
Secreted Factors and Extracellular Vesicles Account for the Immunomodulatory and Tissue Regenerative Properties of Bone-Marrow-Derived Mesenchymal Stromal Cells for Osteoarthritis

Abstract
:1. Introduction
2. Materials and Methods
2.1. Bone Marrow Retrieval and BMSC Isolation and Expansion
2.2. BMSCs Characterization by Flow Cytometry
2.3. Multiplex ELISA Assay
2.4. Protein-Protein Interaction Networks
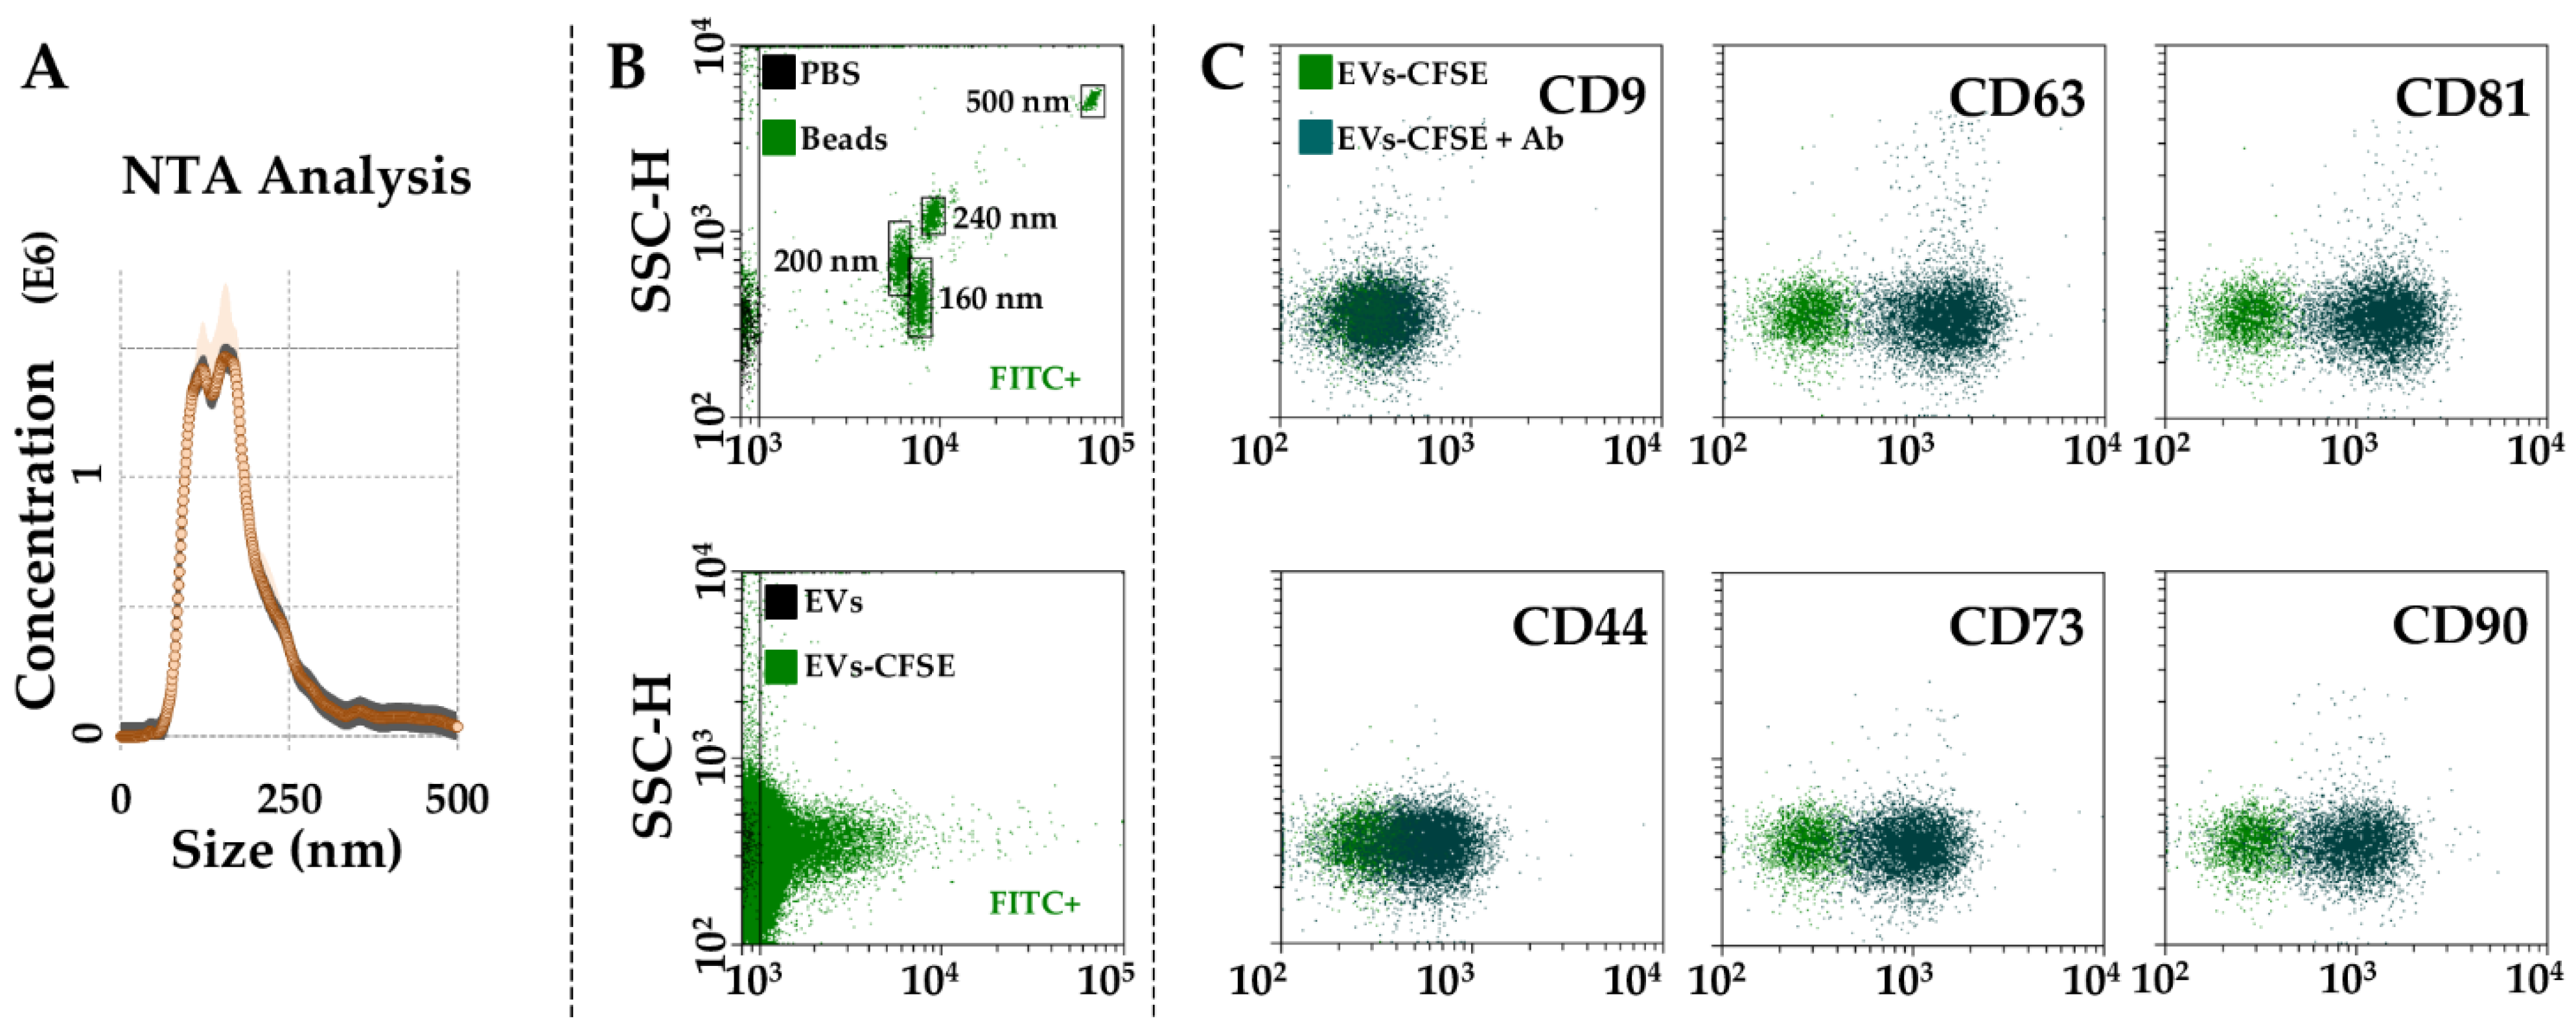
2.5. EVs Characterization
2.6. Total RNA Isolation and miRNA Quantification
2.7. miRNA Target Identification
2.8. Statistical Analyses
3. Results
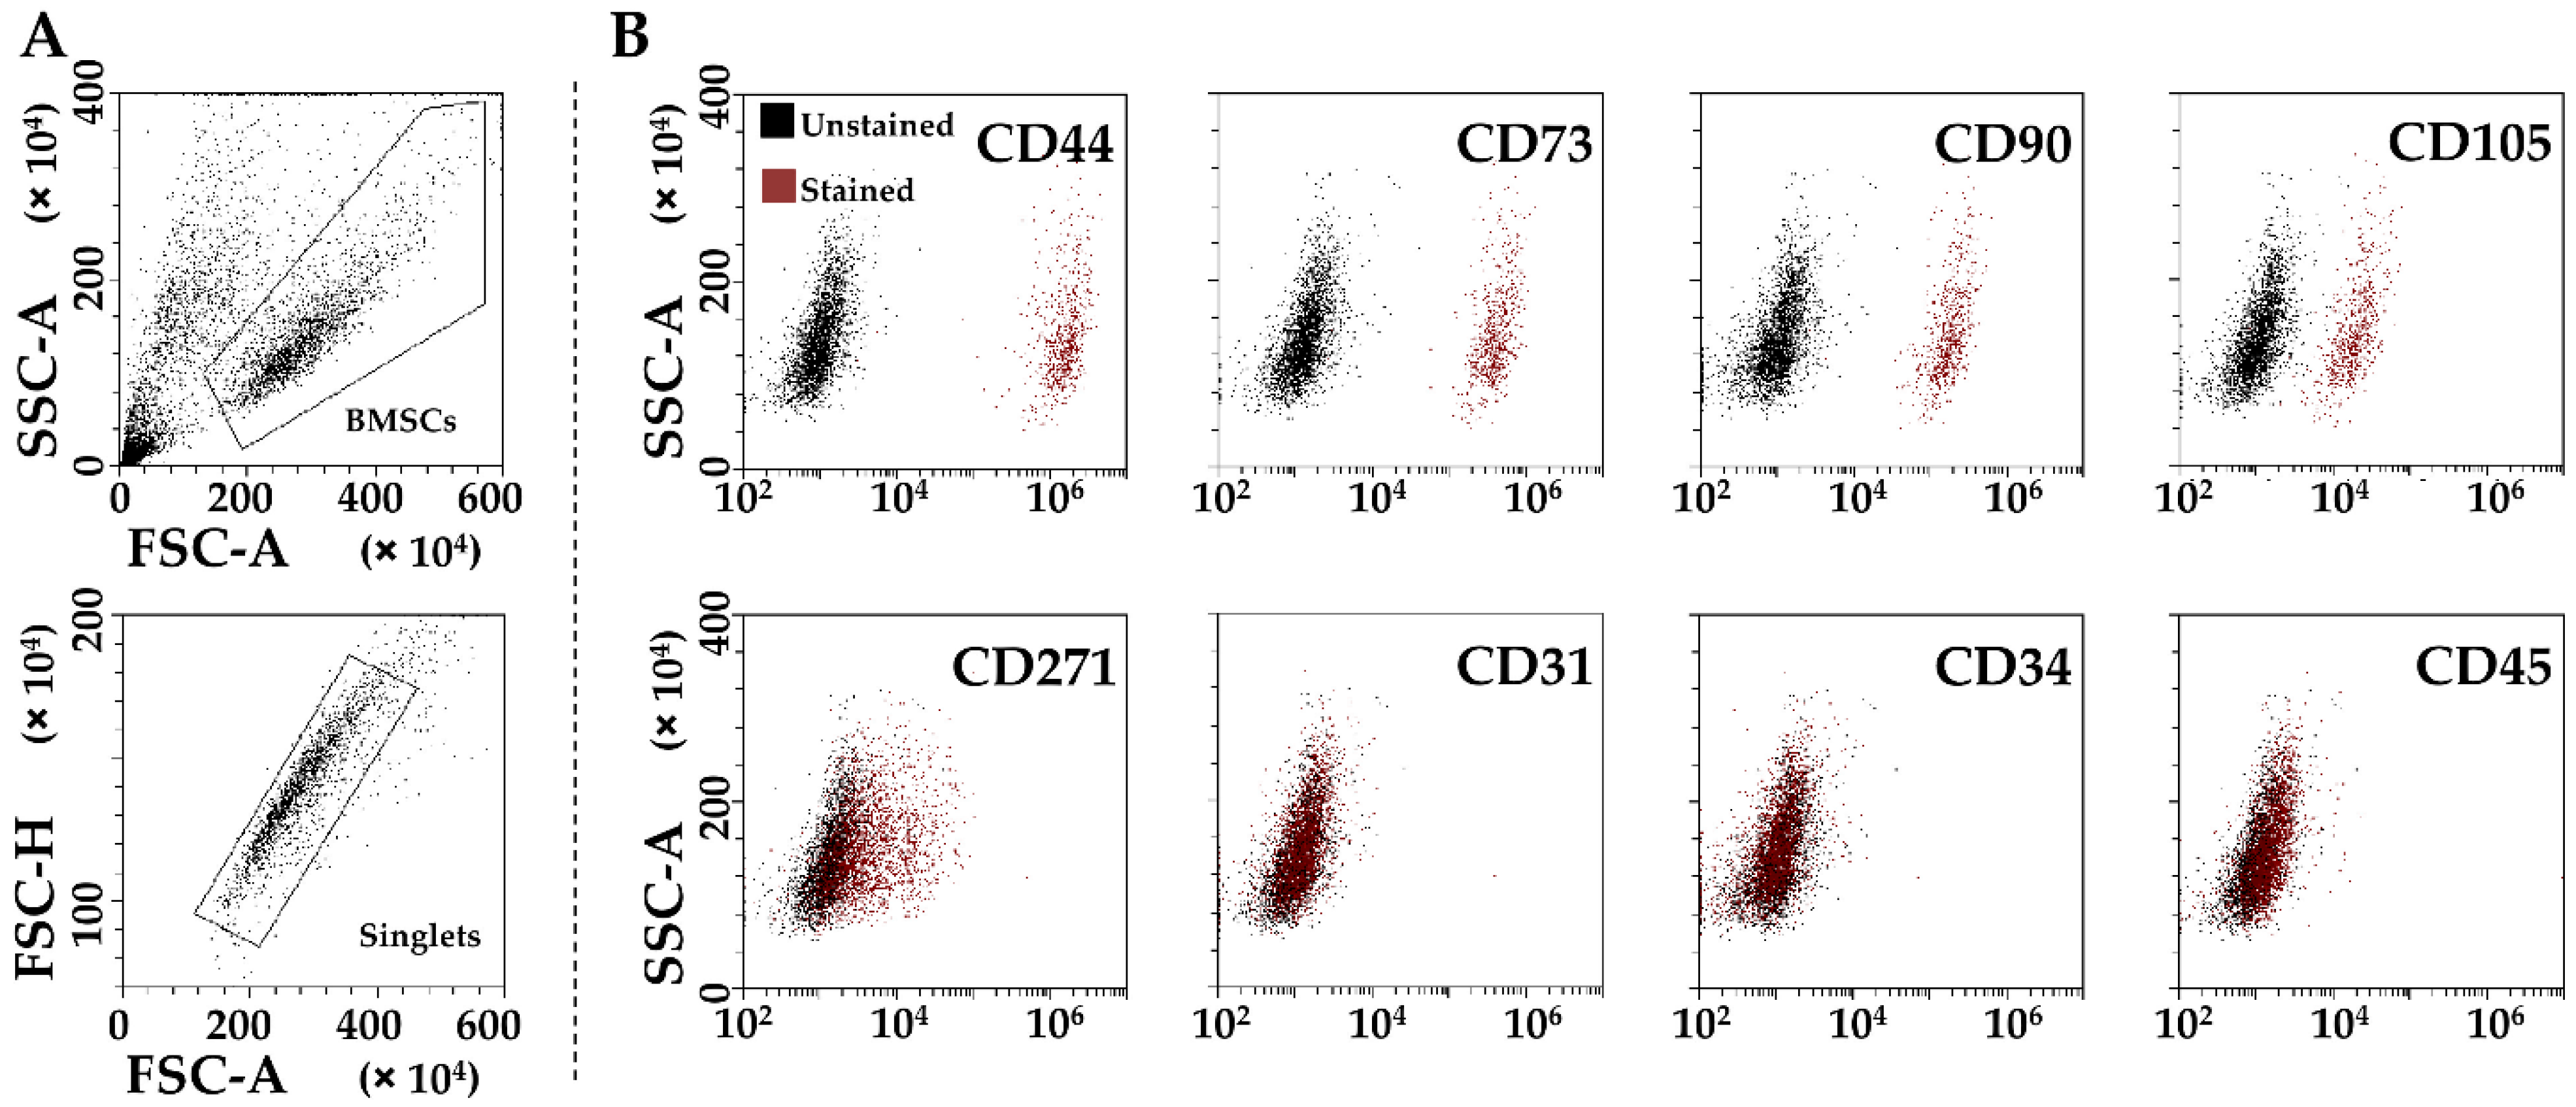
3.1. BMSCs Phenotypic Characterization
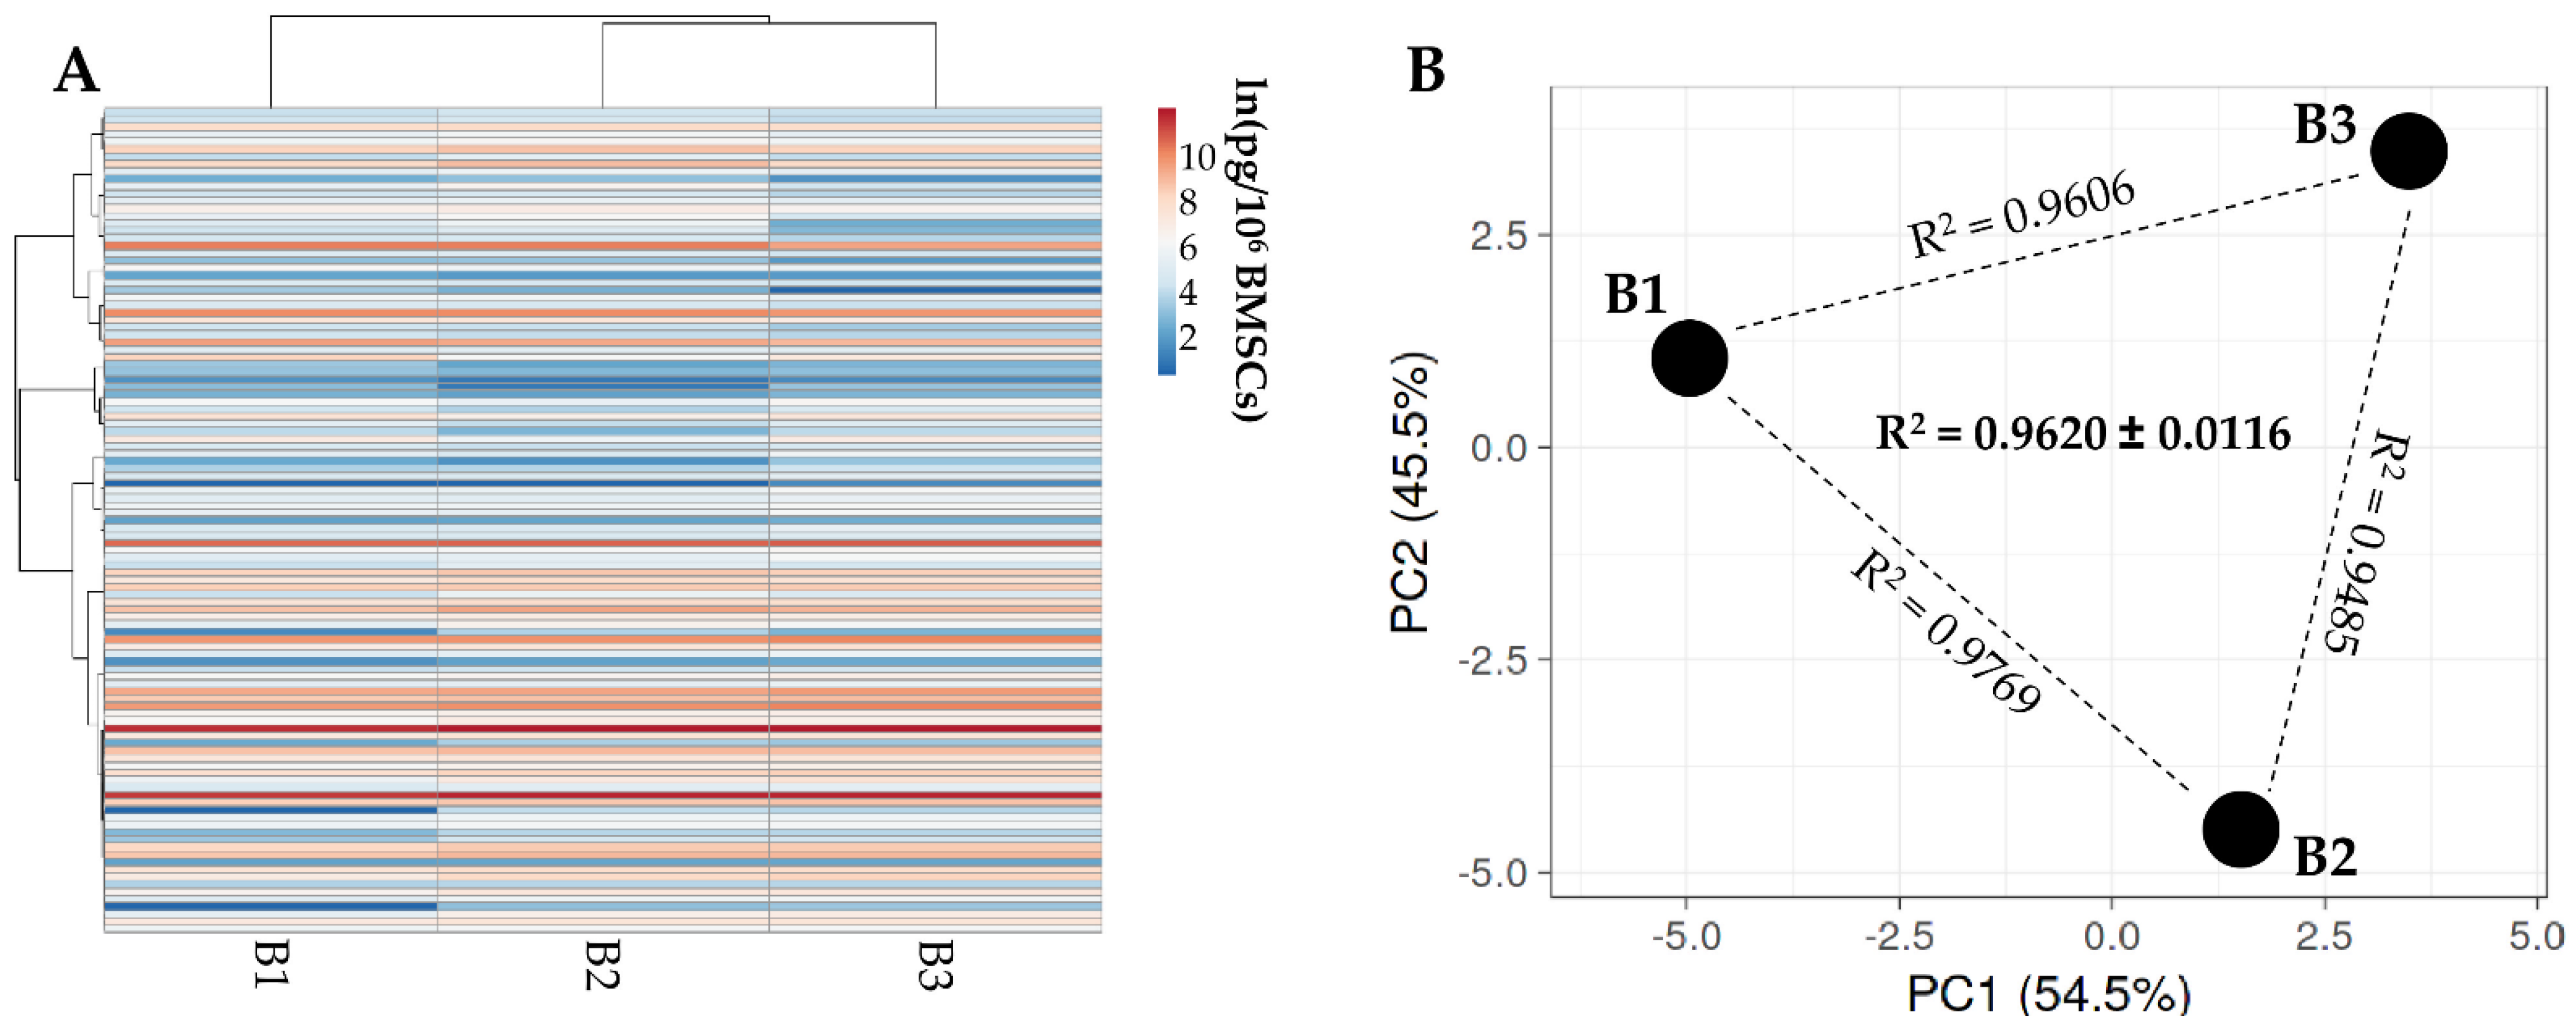
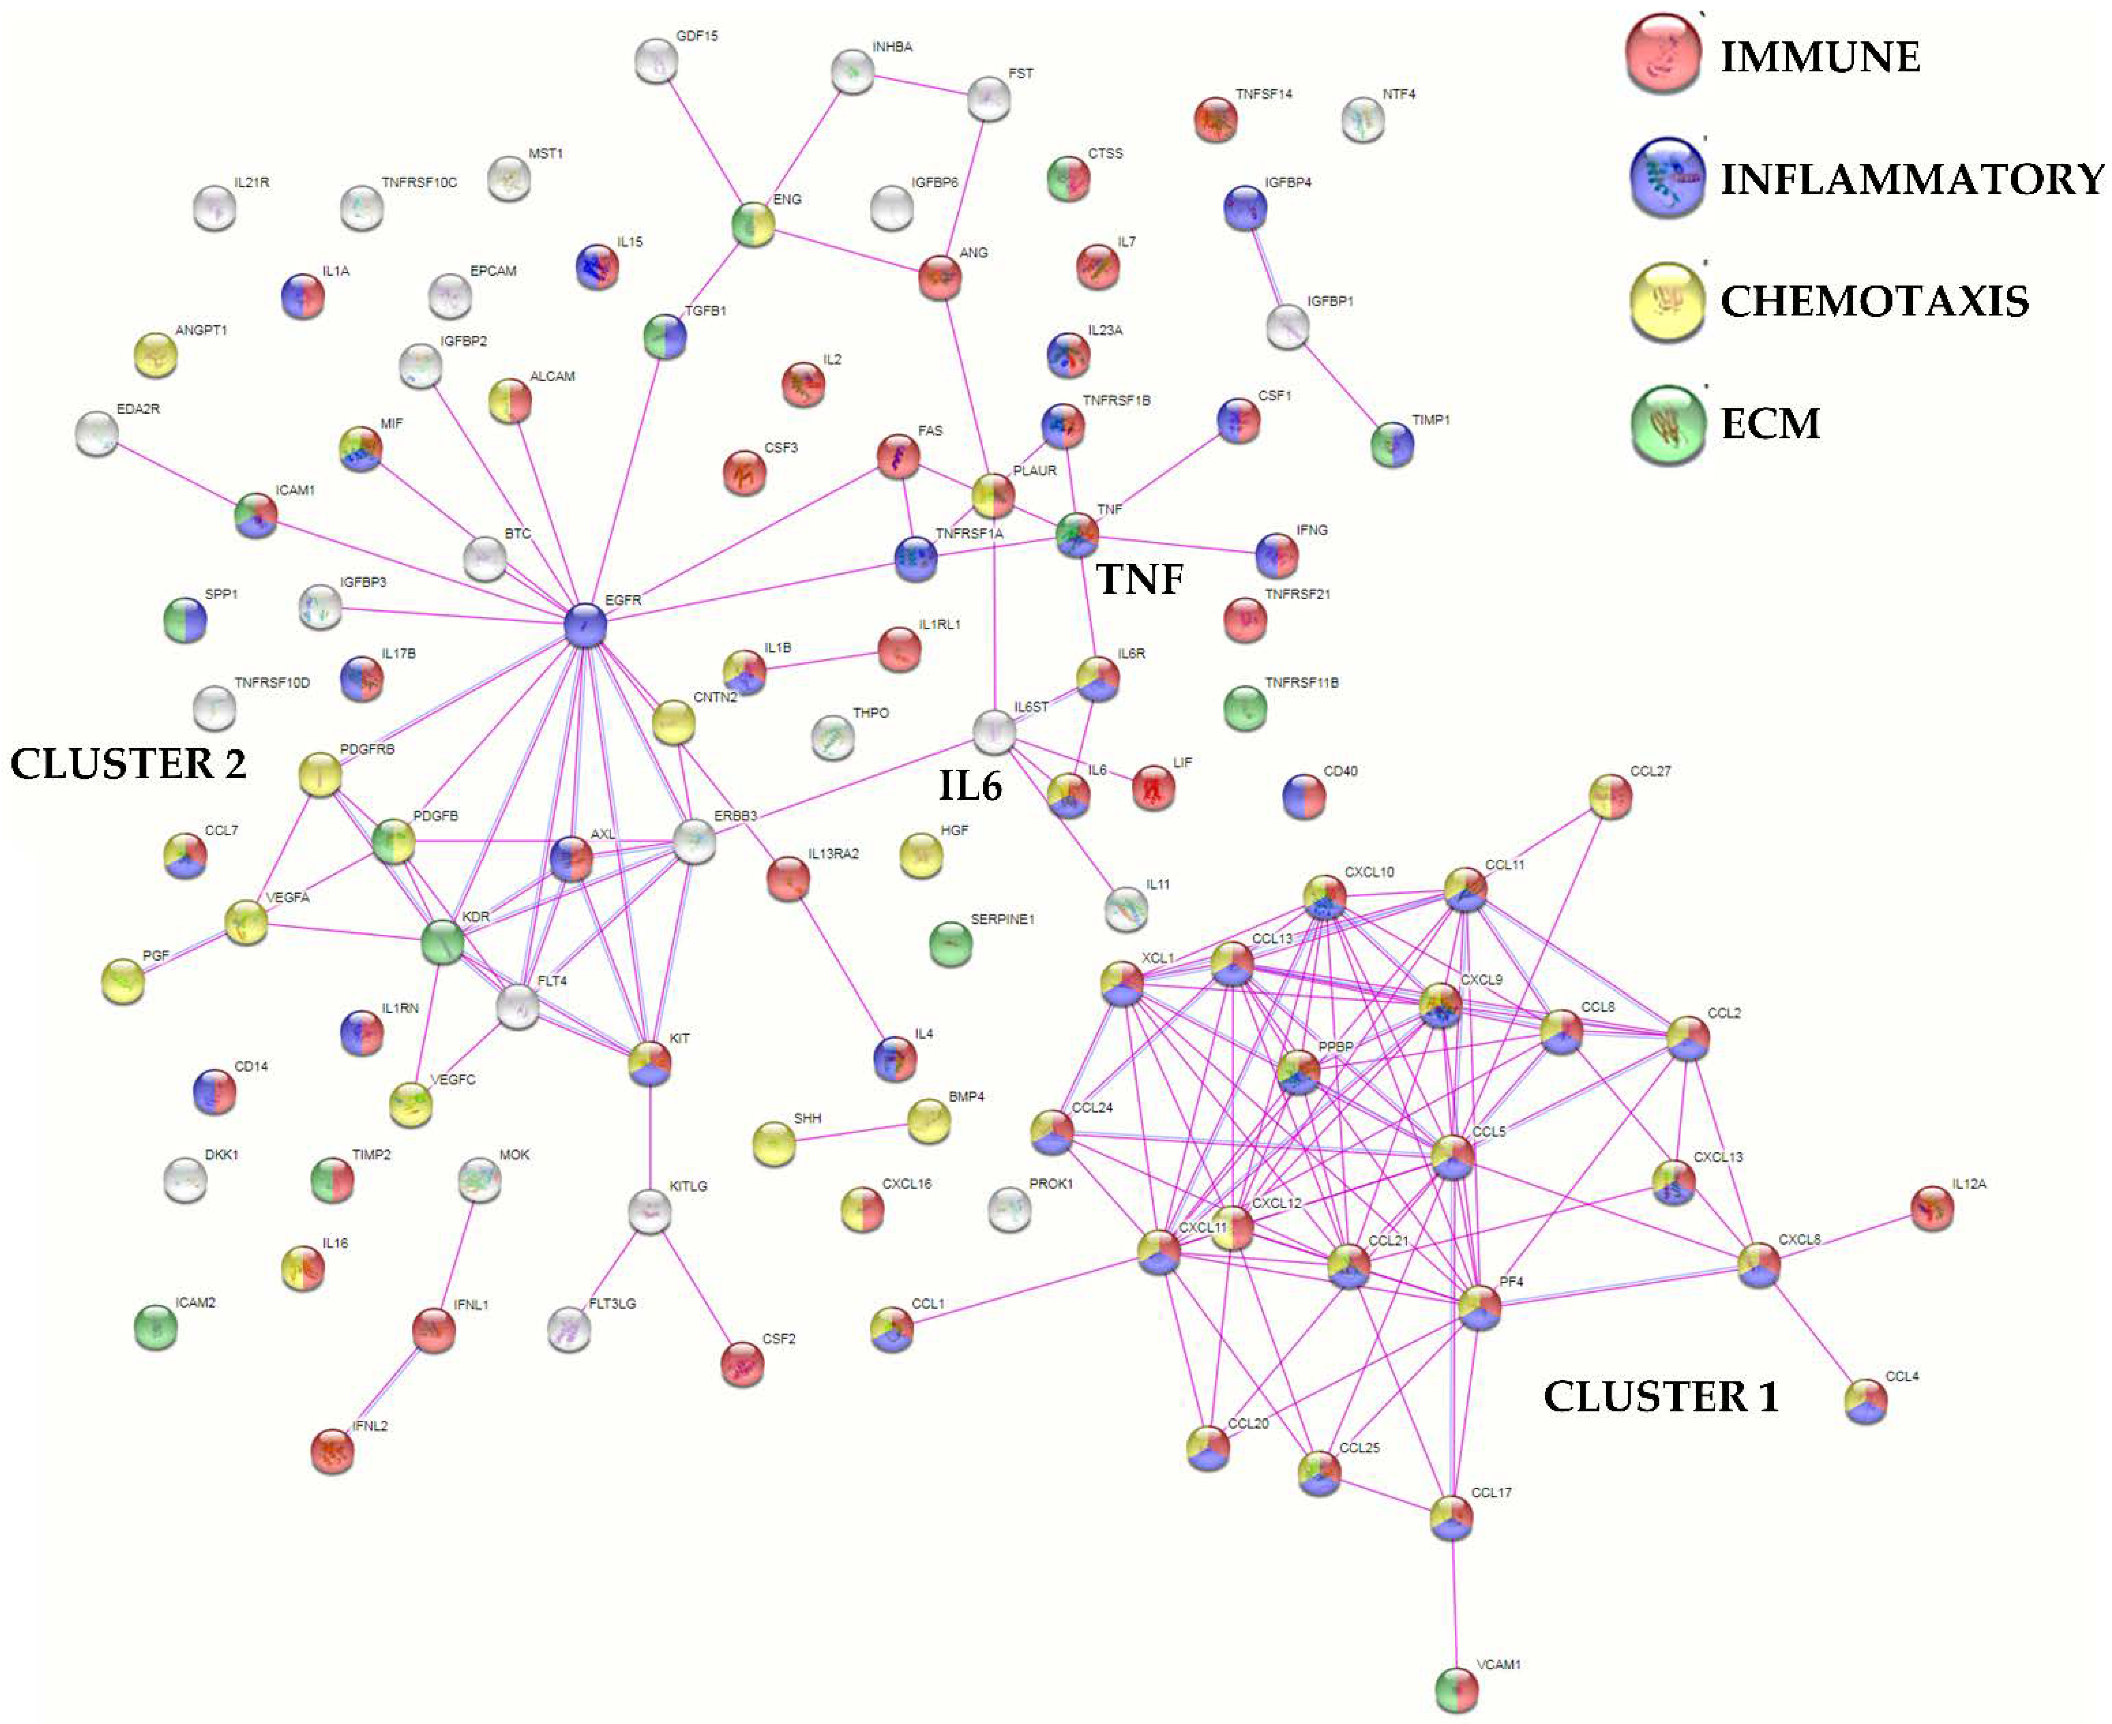
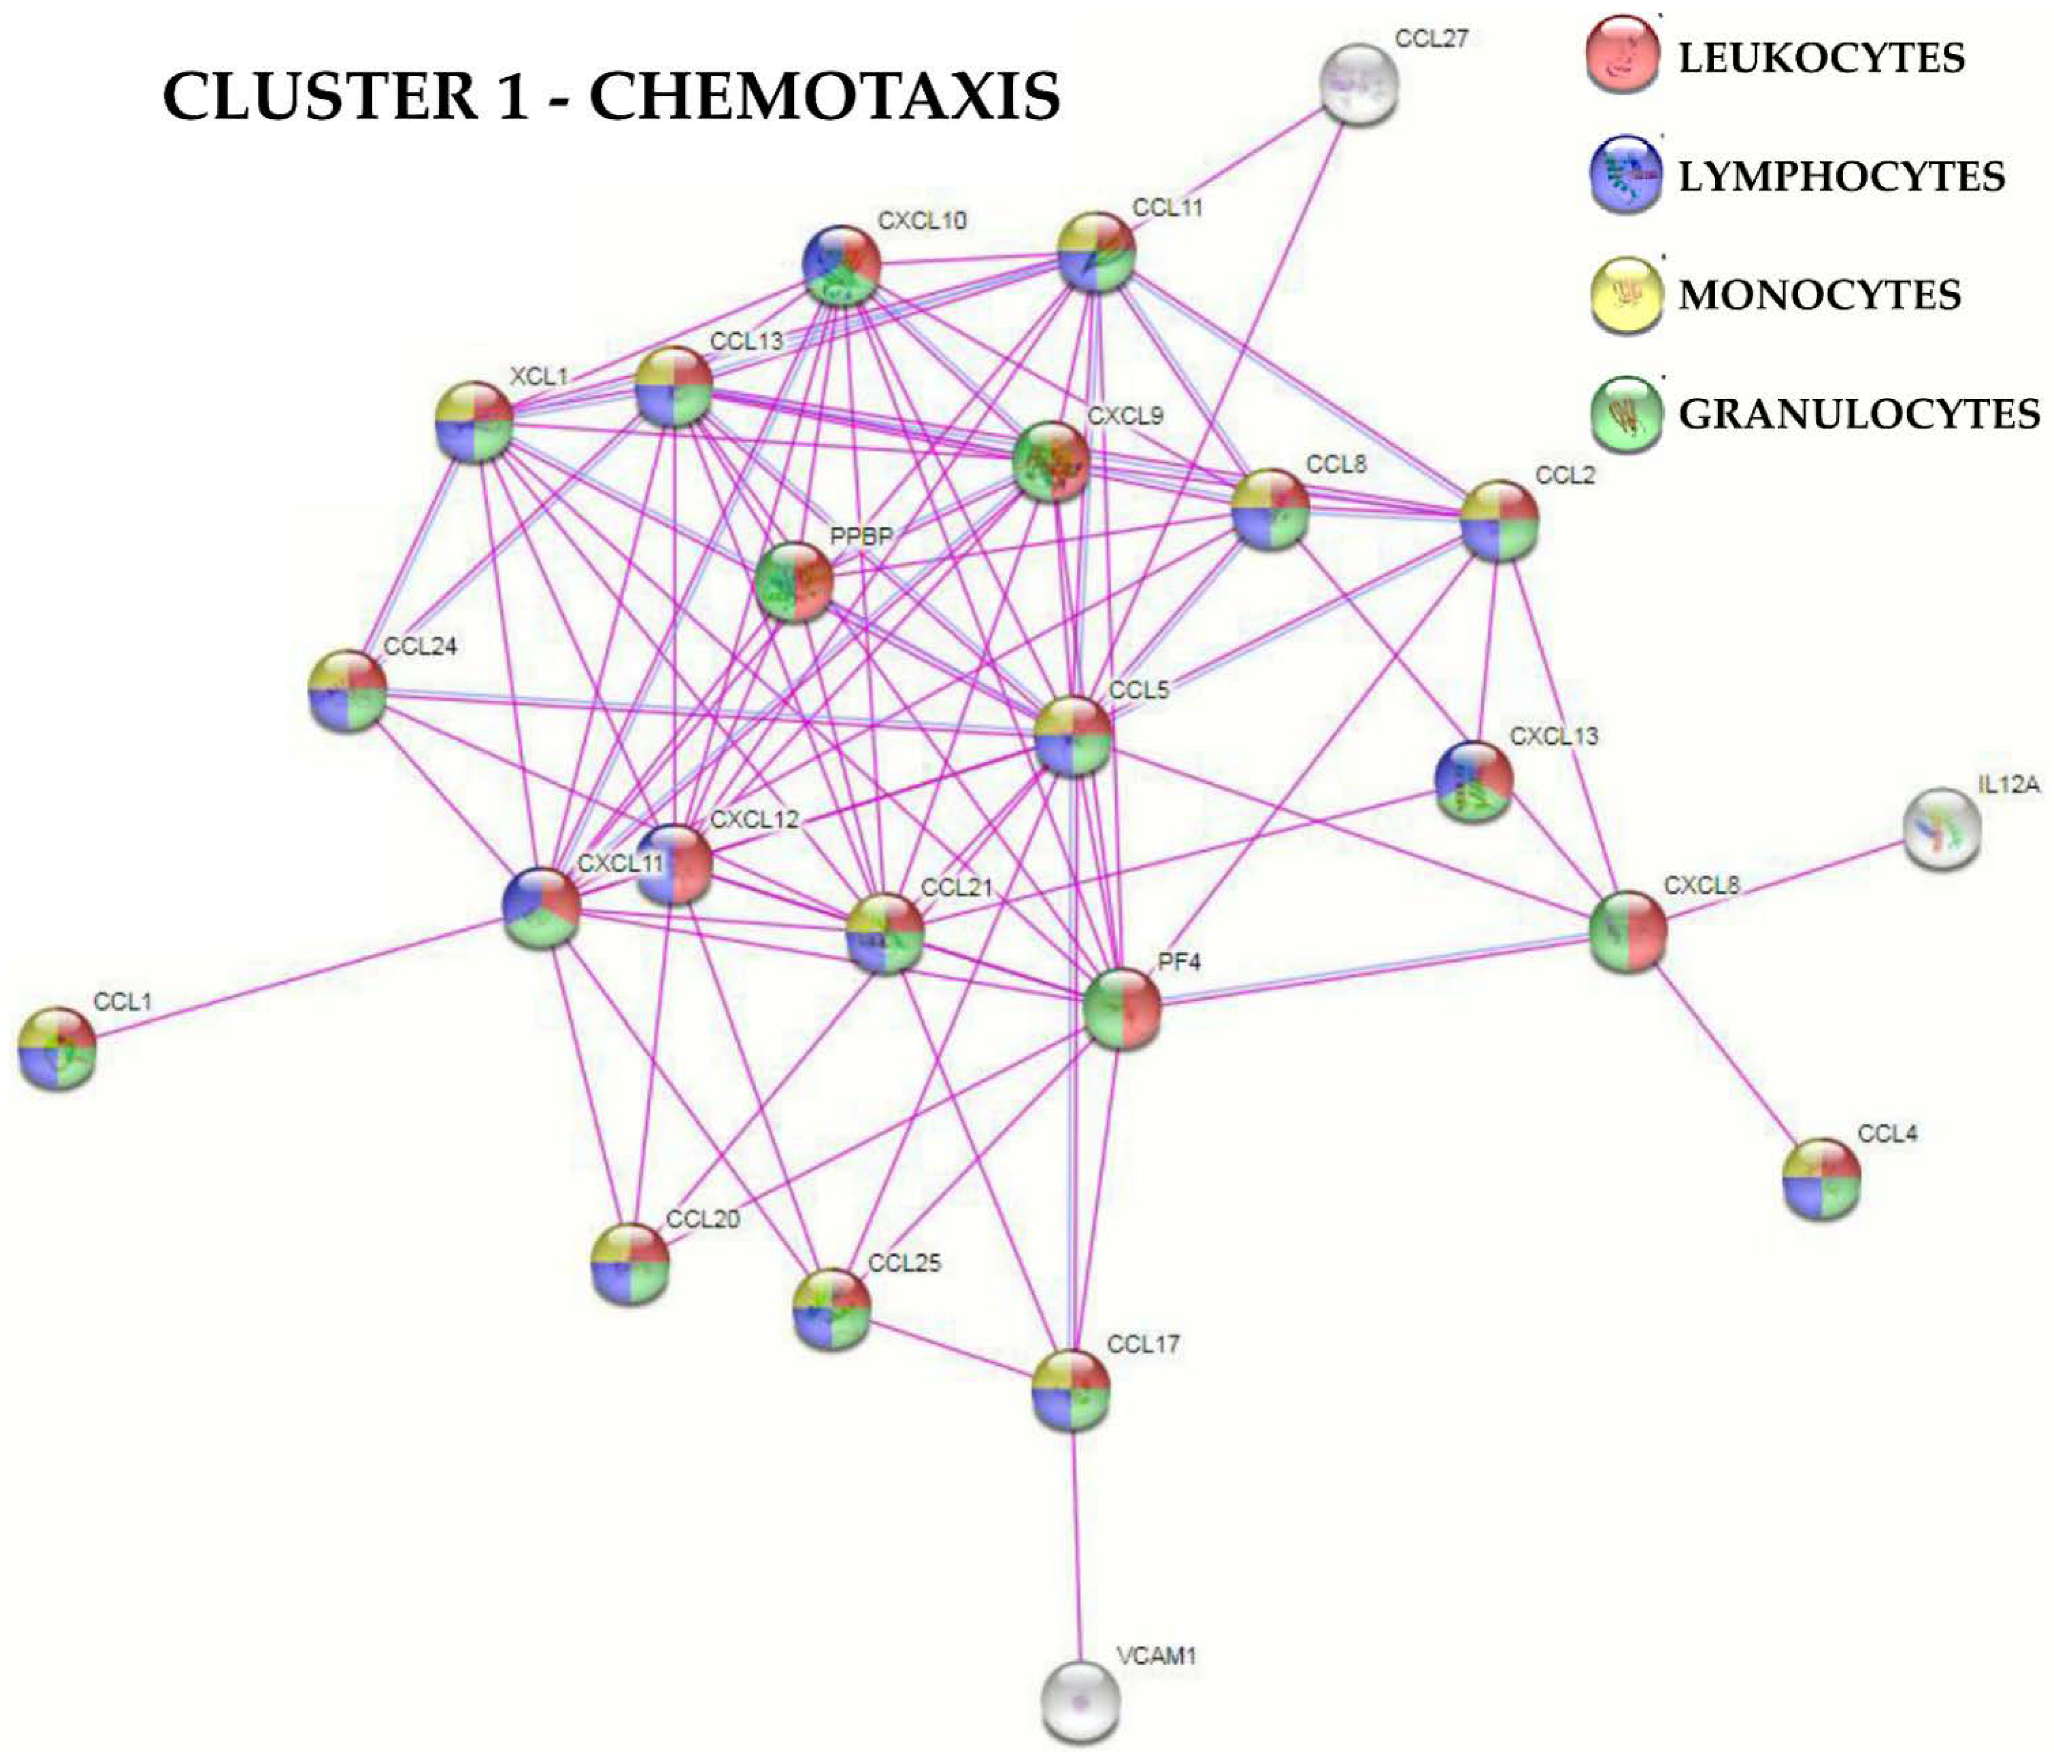
3.2. BMSCs Secreted Factors
3.3. Characterization of BMSC-EVs
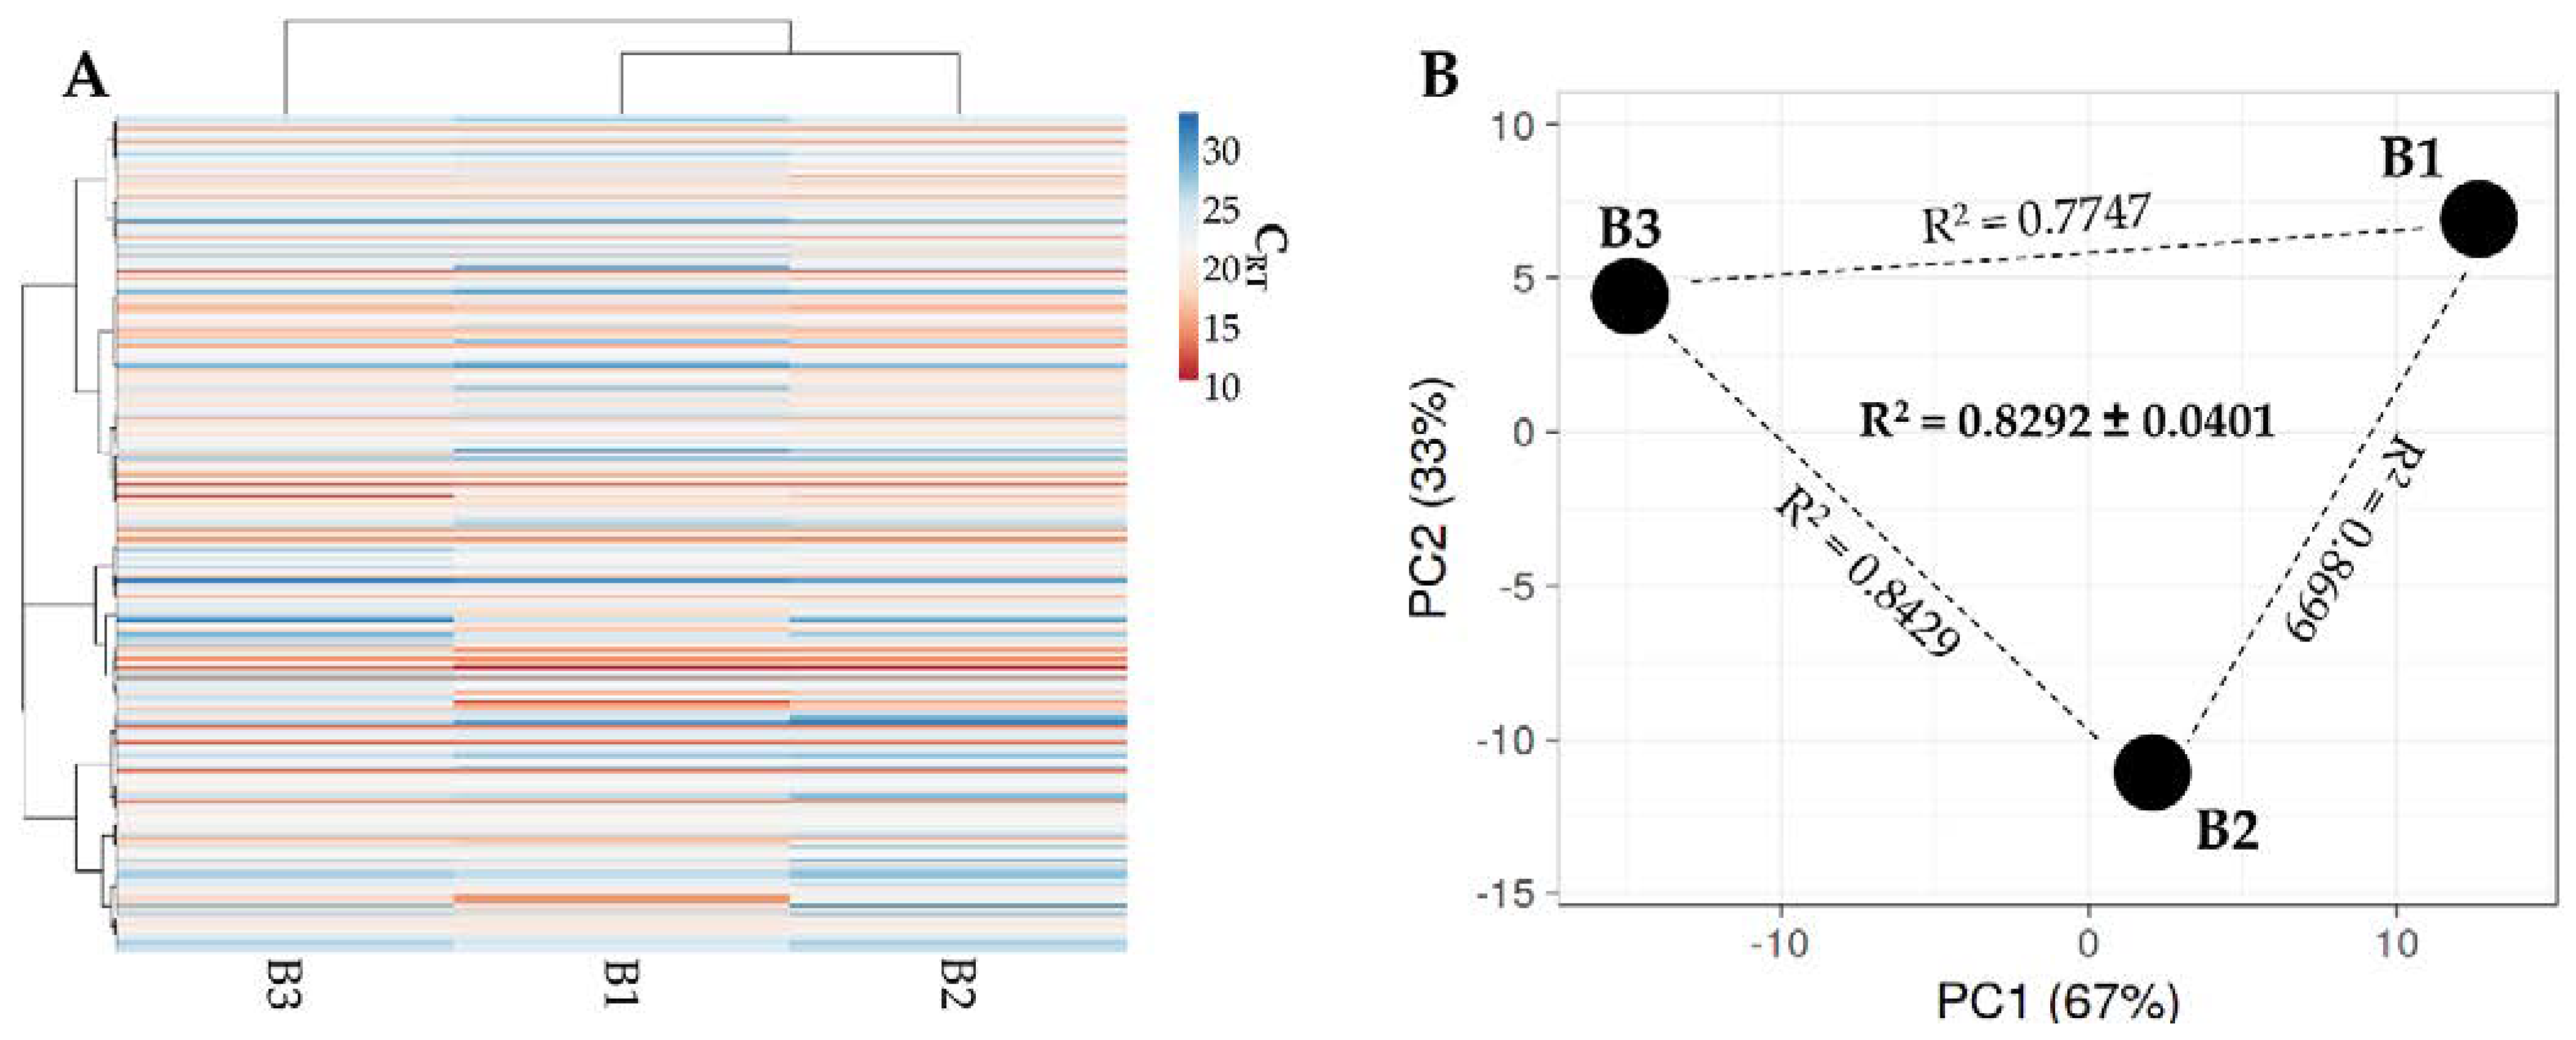
3.4. Identification of BMSC EV-miRNAs
3.5. Target and Effect Prediction of BMSC EV-miRNAs on OA-Related Cell Types
4. Discussion
5. Conclusions
Supplementary Materials
Author Contributions
Funding
Institutional Review Board Statement
Informed Consent Statement
Data Availability Statement
Acknowledgments
Conflicts of Interest
References
- Hunter, D.J.; Bierma-Zeinstra, S. Osteoarthritis. Lancet 2019, 393, 1745–1759. [Google Scholar] [CrossRef]
- Loeser, R.F.; Collins, J.A.; Diekman, B.O. Ageing and the pathogenesis of osteoarthritis. Nat. Rev. Rheumatol. 2016, 12, 412–420. [Google Scholar] [CrossRef] [PubMed] [Green Version]
- Perry, T.; Parkes, M.; Hodgson, R.; Felson, D.; Arden, N.; O′Neill, T. Association between Bone marrow lesions&synovitis and symptoms in symptomatic knee osteoarthritis. Osteoarthr. Cartil. 2019, 28, 316–323. [Google Scholar] [CrossRef] [Green Version]
- Sanchez-Lopez, E.; Coras, R.; Torres, A.; Lane, N.E.; Guma, M. Synovial inflammation in osteoarthritis progression. Nat. Rev. Rheumatol. 2022, 18, 258–275. [Google Scholar] [CrossRef] [PubMed]
- Haynes, M.K.; Hume, E.L.; Smith, J.B. Phenotypic Characterization of Inflammatory Cells from Osteoarthritic Synovium and Synovial Fluids. Clin. Immunol. 2002, 105, 315–325. [Google Scholar] [CrossRef] [PubMed]
- Grässel, S.; Muschter, D. Recent advances in the treatment of osteoarthritis. F1000Research 2020, 9, 325. [Google Scholar] [CrossRef] [PubMed]
- Vasiliadis, A.V.; Galanis, N. Human bone marrow-derived mesenchymal stem cells from different bone sources: A panorama. Stem Cell Investig. 2020, 7, 15. [Google Scholar] [CrossRef]
- Caplan, A.I. Medicinal signalling cells: They work, so use them. Nature 2019, 566, 39. [Google Scholar] [CrossRef] [Green Version]
- Bousnaki, M.; Bakopoulou, A.; Kritis, A.; Koidis, P. The Efficacy of Stem Cells Secretome Application in Osteoarthritis: A Systematic Review of In Vivo Studies. Stem Cell Rev. Rep. 2020, 16, 1222–1241. [Google Scholar] [CrossRef]
- Loo, S.J.Q.; Wong, N.K. Advantages and challenges of stem cell therapy for osteoarthritis (Review). Biomed. Rep. 2021, 15, 67. [Google Scholar] [CrossRef]
- Ni, Z.; Zhou, S.; Li, S.; Kuang, L.; Chen, H.; Luo, X.; Ouyang, J.; He, M.; Du, X.; Chen, L. Exosomes: Roles and therapeutic potential in osteoarthritis. Bone Res. 2020, 8, 25. [Google Scholar] [CrossRef] [PubMed]
- Molnar, V.; Matišić, V.; Kodvanj, I.; Bjelica, R.; Jeleč, Ž.; Hudetz, D.; Rod, E.; Čukelj, F.; Vrdoljak, T.; Vidović, D.; et al. Cytokines and Chemokines Involved in Osteoarthritis Pathogenesis. Int. J. Mol. Sci. 2021, 22, 9208. [Google Scholar] [CrossRef] [PubMed]
- Oliviero, A.; Della Porta, G.; Peretti, G.; Maffulli, N. MicroRNA in osteoarthritis: Physiopathology, diagnosis and therapeutic challenge. Br. Med. Bull. 2019, 130, 137–147. [Google Scholar] [CrossRef] [PubMed]
- Ragni, E.; Perucca Orfei, C.; De Luca, P.; Lugano, G.; Viganò, M.; Colombini, A.; Valli, F.; Zacchetti, D.; Bollati, V.; De Girolamo, L. Interaction with hyaluronan matrix and miRNA cargo as contributors for in vitro potential of mesenchymal stem cell-derived extracellular vesicles in a model of human osteoarthritic synoviocytes. Stem Cell Res. Ther. 2019, 10, 109. [Google Scholar] [CrossRef] [Green Version]
- D’Haene, B.; Mestdagh, P.; Hellemans, J.; Vandesompele, J. miRNA Expression Profiling: From Reference Genes to Global Mean Normalization. In Next-Generation MicroRNA Expression Profiling Technology; Humana Press: Totowa, NJ, USA, 2012; pp. 261–272. [Google Scholar]
- Huang, H.-Y.; Lin, Y.-C.-D.; Li, J.; Huang, K.-Y.; Shrestha, S.; Hong, H.-C.; Tang, Y.; Chen, Y.-G.; Jin, C.-N.; Yu, Y.; et al. miRTarBase 2020: Updates to the experimentally validated microRNA–target interaction database. Nucleic Acids Res. 2020, 48, D148–D154. [Google Scholar] [CrossRef] [Green Version]
- Akoglu, H. User’s guide to correlation coefficients. Turk. J. Emerg. Med. 2018, 18, 91–93. [Google Scholar] [CrossRef]
- Metsalu, T.; Vilo, J. ClustVis: A web tool for visualizing clustering of multivariate data using Principal Component Analysis and heatmap. Nucleic Acids Res. 2015, 43, W566–W570. [Google Scholar] [CrossRef]
- Barilani, M.; Peli, V.; Cherubini, A.; Dossena, M.; Dolo, V.; Lazzari, L. NG2 as an Identity and Quality Marker of Mesenchymal Stem Cell Extracellular Vesicles. Cells 2019, 8, 1524. [Google Scholar] [CrossRef] [Green Version]
- Mortati, L.; De Girolamo, L.; Orfei, C.P.; Viganò, M.; Brayda-Bruno, M.; Ragni, E.; Colombini, A. In Vitro Study of Extracellular Vesicles Migration in Cartilage-Derived Osteoarthritis Samples Using Real-Time Quantitative Multimodal Nonlinear Optics Imaging. Pharmaceutics 2020, 12, 734. [Google Scholar] [CrossRef]
- Papait, A.; Ragni, E.; Cargnoni, A.; Vertua, E.; Romele, P.; Masserdotti, A.; Orfei, C.P.; Signoroni, P.B.; Magatti, M.; Silini, A.R.; et al. Comparison of EV-free fraction, EVs, and total secretome of amniotic mesenchymal stromal cells for their immunomodulatory potential: A translational perspective. Front. Immunol. 2022, 13, 960909. [Google Scholar] [CrossRef]
- Toh, W.S.; Lai, R.C.; Hui, J.H.P.; Lim, S.K. MSC exosome as a cell-free MSC therapy for cartilage regeneration: Implications for osteoarthritis treatment. Semin. Cell Dev. Biol. 2017, 67, 56–64. [Google Scholar] [CrossRef] [PubMed]
- Chevillet, J.R.; Kang, Q.; Ruf, I.K.; Briggs, H.A.; Vojtech, L.N.; Hughes, S.M.; Cheng, H.H.; Arroyo, J.D.; Meredith, E.K.; Gallichotte, E.N.; et al. Quantitative and stoichiometric analysis of the microRNA content of exosomes. Proc. Natl. Acad. Sci. USA 2014, 111, 14888–14893. [Google Scholar] [CrossRef] [PubMed] [Green Version]
- Schopman, N.C.T.; Heynen, S.; Haasnoot, J.; Berkhout, B. A miRNA-tRNA mix-up: tRNA origin of proposed miRNA. RNA Biol. 2010, 7, 573–576. [Google Scholar] [CrossRef] [PubMed]
- Chou, C.-H.; Jain, V.; Gibson, J.; Attarian, D.E.; Haraden, C.A.; Yohn, C.B.; Laberge, R.-M.; Gregory, S.; Kraus, V.B. Synovial cell cross-talk with cartilage plays a major role in the pathogenesis of osteoarthritis. Sci. Rep. 2020, 10, 10868. [Google Scholar] [CrossRef]
- Endisha, H.; Rockel, J.; Jurisica, I.; Kapoor, M. The complex landscape of microRNAs in articular cartilage: Biology, pathology, and therapeutic targets. JCI Insight 2018, 3, e121630. [Google Scholar] [CrossRef] [Green Version]
- Tavallaee, G.; Rockel, J.S.; Lively, S.; Kapoor, M. MicroRNAs in Synovial Pathology Associated With Osteoarthritis. Front. Med. 2020, 7, 376. [Google Scholar] [CrossRef]
- Xu, S.J.; Hu, H.T.; Li, H.L.; Chang, S. The Role of miRNAs in Immune Cell Development, Immune Cell Activation, and Tumor Immunity: With a Focus on Macrophages and Natural Killer Cells. Cells 2019, 8, 1140. [Google Scholar] [CrossRef] [Green Version]
- Galan, A.R.; Fernández-Messina, L.; Sánchez-Madrid, F. Control of Immunoregulatory Molecules by miRNAs in T Cell Activation. Front. Immunol. 2018, 9, 2148. [Google Scholar] [CrossRef]
- Han, X.; Yang, B.; Zou, F.; Sun, J. Clinical therapeutic efficacy of mesenchymal stem cells derived from adipose or bone marrow for knee osteoarthritis: A meta-analysis of randomized controlled trials. J. Comp. Eff. Res. 2020, 9, 361–374. [Google Scholar] [CrossRef]
- Wang, J.; Zhou, L.; Zhang, Y.; Huang, L.; Shi, Q. Mesenchymal stem cells—A promising strategy for treating knee osteoarthritis. Bone Jt. Res. 2020, 9, 719–728. [Google Scholar] [CrossRef]
- Wang, Y.; Yi, H.; Song, Y. The safety of MSC therapy over the past 15 years: A meta-analysis. Stem Cell Res. Ther. 2021, 12, 545. [Google Scholar] [CrossRef] [PubMed]
- Ren, G.; Zhang, L.; Zhao, X.; Xu, G.; Zhang, Y.; Roberts, A.I.; Zhao, R.C.; Shi, Y. Mesenchymal Stem Cell-Mediated Immunosuppression Occurs via Concerted Action of Chemokines and Nitric Oxide. Cell Stem Cell 2008, 2, 141–150. [Google Scholar] [CrossRef] [PubMed] [Green Version]
- Sato, K.; Ozaki, K.; Oh, I.; Meguro, A.; Hatanaka, K.; Nagai, T.; Muroi, K.; Ozawa, K. Nitric oxide plays a critical role in suppression of T-cell proliferation by mesenchymal stem cells. Blood 2006, 109, 228–234. [Google Scholar] [CrossRef] [PubMed]
- Meesuk, L.; Tantrawatpan, C.; Kheolamai, P.; Manochantr, S. The immunosuppressive capacity of human mesenchymal stromal cells derived from amnion and bone marrow. Biochem. Biophys. Rep. 2016, 8, 34–40. [Google Scholar] [CrossRef] [PubMed] [Green Version]
- Sakkas, L.I.; Scanzello, C.; Johanson, N.; Burkholder, J.; Mitra, A.; Salgame, P.; Katsetos, C.D.; Platsoucas, C.D. T cells and T-cell cytokine transcripts in the synovial membrane in patients with osteoarthritis. Clin Diagn Lab Immunol 1998, 5, 430–437. [Google Scholar] [CrossRef] [Green Version]
- Rosshirt, N.; Trauth, R.; Platzer, H.; Tripel, E.; Nees, T.A.; Lorenz, H.-M.; Tretter, T.; Moradi, B. Proinflammatory T cell polarization is already present in patients with early knee osteoarthritis. Arthritis Res. Ther. 2021, 23, 37. [Google Scholar] [CrossRef] [PubMed]
- Li, Y.-S.; Luo, W.; Zhu, S.-A.; Lei, G.-H. T Cells in Osteoarthritis: Alterations and Beyond. Front. Immunol. 2017, 8, 356. [Google Scholar] [CrossRef] [Green Version]
- Viola, A.; Munari, F.; Sánchez-Rodríguez, R.; Scolaro, T.; Castegna, A. The Metabolic Signature of Macrophage Responses. Front. Immunol. 2019, 10, 1462. [Google Scholar] [CrossRef] [Green Version]
- François, M.; Romieu-Mourez, R.; Li, M.; Galipeau, J. Human MSC Suppression Correlates With Cytokine Induction of Indoleamine 2,3-Dioxygenase and Bystander M2 Macrophage Differentiation. Mol. Ther. 2012, 20, 187–195. [Google Scholar] [CrossRef]
- Hsueh, M.; Zhang, X.; Wellman, S.S.; Bolognesi, M.; Kraus, V.B. Synergistic Roles of Macrophages and Neutrophils in Osteoarthritis Progression. Arthritis Rheumatol. 2020, 73, 89–99. [Google Scholar] [CrossRef]
- Inoue, Y.; Iriyama, A.; Ueno, S.; Takahashi, H.; Kondo, M.; Tamaki, Y.; Araie, M.; Yanagi, Y. Subretinal transplantation of bone marrow mesenchymal stem cells delays retinal degeneration in the RCS rat model of retinal degeneration. Exp. Eye Res. 2007, 85, 234–241. [Google Scholar] [CrossRef] [PubMed]
- Joel, M.D.M.; Yuan, J.; Wang, J.; Yan, Y.; Qian, H.; Zhang, X.; Xu, W.; Mao, F. MSC: Immunoregulatory effects, roles on neutrophils and evolving clinical potentials. Am. J. Transl. Res. 2019, 11, 3890–3904. [Google Scholar] [PubMed]
- Mi, M.; Shi, S.; Li, T.; Holz, J.; Lee, Y.-J.; Sheu, T.-J.; Liao, Q.; Xiao, T. TIMP2 deficient mice develop accelerated osteoarthritis via promotion of angiogenesis upon destabilization of the medial meniscus. Biochem. Biophys. Res. Commun. 2012, 423, 366–372. [Google Scholar] [CrossRef]
- Alam, R.; Ji, J.R.; Kim, M.S.; Kim, N.S. Biomarkers for identifying the early phases of osteoarthritis secondary to medial patellar luxation in dogs. J. Vet. Sci. 2011, 12, 273–280. [Google Scholar] [CrossRef] [PubMed] [Green Version]
- Clements, D.N.; Fitzpatrick, N.; Carter, S.D.; Day, P.J. Cartilage gene expression correlates with radiographic severity of canine elbow osteoarthritis. Vet. J. 2009, 179, 211–218. [Google Scholar] [CrossRef]
- Garcia, F.J.B. Catabolic events in osteoarthritic cartilage. Osteoarthr. Cartil. 1999, 7, 308–309. [Google Scholar] [CrossRef] [PubMed] [Green Version]
- Li, J.; Ny, A.; Leonardsson, G.; Nandakumar, K.S.; Holmdahl, R.; Ny, T. The Plasminogen Activator/Plasmin System Is Essential for Development of the Joint Inflammatory Phase of Collagen Type II-Induced Arthritis. Am. J. Pathol. 2005, 166, 783–792. [Google Scholar] [CrossRef] [Green Version]
- Dreier, R.; Wallace, S.; Fuchs, S.; Bruckner, P.; Grassel, S. Paracrine interactions of chondrocytes and macrophages in cartilage degradation: Articular chondrocytes provide factors that activate macrophage-derived pro-gelatinase B (pro-MMP-9). J. Cell Sci. 2001, 114, 3813–3822. [Google Scholar] [CrossRef]
- Wang, W.; Rigueur, D.; Lyons, K.M. TGFβ signaling in cartilage development and maintenance. Birth Defects Res. Part C Embryo Today Rev. 2014, 102, 37–51. [Google Scholar] [CrossRef] [Green Version]
- Blaney Davidson, E.N.; van der Kraan, P.M.; van den Berg, W.B. TGF-β and osteoarthritis. Osteoarthr. Cartil. 2007, 15, 597–604. [Google Scholar] [CrossRef]
- Oh, S.A.; Li, M.O. TGF-β: Guardian of T Cell Function. J. Immunol. 2013, 191, 3973–3979. [Google Scholar] [CrossRef] [PubMed] [Green Version]
- Galasso, O.; De Gori, M.; Nocera, A.; Brunetti, A.; Gasparini, G. Regulatory Functions of Insulin-like Growth Factor Binding Proteins in Osteoarthritis. Int. J. Immunopathol. Pharmacol. 2011, 24, 55–59. [Google Scholar] [CrossRef] [PubMed]
- Tanaka, N.; Tsuno, H.; Ohashi, S.; Iwasawa, M.; Furukawa, H.; Kato, T.; Fukui, N. The attenuation of insulin-like growth factor signaling may be responsible for relative reduction in matrix synthesis in degenerated areas of osteoarthritic cartilage. BMC Musculoskelet. Disord. 2021, 22, 231. [Google Scholar] [CrossRef] [PubMed]
- Harrell, C.R.; Markovic, B.S.; Fellabaum, C.; Arsenijevic, A.; Volarevic, V. Mesenchymal stem cell-based therapy of osteoarthritis: Current knowledge and future perspectives. Biomed. Pharmacother. 2018, 109, 2318–2326. [Google Scholar] [CrossRef]
- Vadalà, G.; Russo, F.; Musumeci, M.; Giacalone, A.; Papalia, R.; Denaro, V. Targeting VEGF-A in cartilage repair and regeneration: State of the art and perspectives. J. Biol. Regul. Homeost. Agents 2019, 32, 217–224. [Google Scholar]
- Thornton, S.; Raghu, H.; Cruz, C.; Frederick, M.D.; Palumbo, J.S.; Mullins, E.S.; Almholt, K.; Usher, P.A.; Flick, M.J. Urokinase plasminogen activator and receptor promote collagen-induced arthritis through expression in hematopoietic cells. Blood Adv. 2017, 1, 545–556. [Google Scholar] [CrossRef] [PubMed] [Green Version]
- Xiang, X.-N.; Zhu, S.-Y.; He, H.-C.; Yu, X.; Xu, Y.; He, C.-Q. Mesenchymal stromal cell-based therapy for cartilage regeneration in knee osteoarthritis. Stem Cell Res. Ther. 2022, 13, 14. [Google Scholar] [CrossRef]
- Hwang, J.J.; Rim, Y.A.; Nam, Y.; Ju, J.H. Recent Developments in Clinical Applications of Mesenchymal Stem Cells in the Treatment of Rheumatoid Arthritis and Osteoarthritis. Front. Immunol. 2021, 12, 631291. [Google Scholar] [CrossRef]
- Song, Y.; Jorgensen, C. Mesenchymal Stromal Cells in Osteoarthritis: Evidence for Structural Benefit and Cartilage Repair. Biomedicines 2022, 10, 1278. [Google Scholar] [CrossRef]
- Xu, J.; Qian, X.; Ding, R. MiR-24-3p attenuates IL-1β-induced chondrocyte injury associated with osteoarthritis by targeting BCL2L12. J. Orthop. Surg. Res. 2021, 16, 371. [Google Scholar] [CrossRef]
- Naqvi, J.B.F.A.R.; Nares, S.; Fordham, J.B. miR-24 Regulates Macrophage Polarization and Plasticity. J. Clin. Cell. Immunol. 2015, 6, 362. [Google Scholar] [CrossRef]
- Jingjing, Z.; Nan, Z.; Wei, W.; Qinghe, G.; Weijuan, W.; Peng, W.; Xiangpeng, W. MicroRNA-24 Modulates Staphylococcus aureus-Induced Macrophage Polarization by Suppressing CHI3L1. Inflammation 2017, 40, 995–1005. [Google Scholar] [CrossRef] [PubMed]
- Fayyad-Kazan, H.; Hamade, E.; Rouas, R.; Najar, M.; Fayyad-Kazan, M.; El Zein, N.; El Dirani, R.; Hussein, N.; Fakhry, M.; Al-Akoum, C.; et al. Downregulation of microRNA-24 and -181 parallels the upregulation of IFN-γ secreted by activated human CD4 lymphocytes. Hum. Immunol. 2014, 75, 677–685. [Google Scholar] [CrossRef] [PubMed]
- Chandran, P.A.; Keller, A.; Weinmann, L.; Seida, A.A.; Braun, M.; Andreev, K.; Fischer, B.; Horn, E.; Schwinn, S.; Junker, M.; et al. The TGF-β-inducible miR-23a cluster attenuates IFN-γ levels and antigen-specific cytotoxicity in human CD8+ T cells. J. Leukoc. Biol. 2014, 96, 633–645. [Google Scholar] [CrossRef]
- Ye, S.-B.; Zhang, H.; Cai, T.-T.; Liu, Y.-N.; Ni, J.-J.; He, J.; Peng, J.-Y.; Chen, Q.-Y.; Mo, H.-Y.; Cui, J.; et al. Exosomal miR-24-3p impedes T-cell function by targeting FGF11 and serves as a potential prognostic biomarker for nasopharyngeal carcinoma. J. Pathol. 2016, 240, 329–340. [Google Scholar] [CrossRef]
- Kopańska, M.; Szala, D.; Czech, J.; Gabło, N.; Gargasz, K.; Trzeciak, M.; Zawlik, I.; Snela, S. MiRNA expression in the cartilage of patients with osteoarthritis. J. Orthop. Surg. Res. 2017, 12, 51. [Google Scholar] [CrossRef] [Green Version]
- Song, J.; Jin, E.-H.; Kim, D.; Kim, K.Y.; Chun, C.-H. MicroRNA-222 regulates MMP-13 via targeting HDAC-4 during osteoarthritis pathogenesis. BBA Clin. 2015, 3, 79–89. [Google Scholar] [CrossRef] [Green Version]
- Graff, J.W.; Dickson, A.M.; Clay, G.; McCaffrey, A.P.; Wilson, M.E. Identifying Functional MicroRNAs in Macrophages with Polarized Phenotypes. J. Biol. Chem. 2012, 287, 21816–21825. [Google Scholar] [CrossRef] [Green Version]
- Ying, X.; Wu, Q.; Wu, X.; Zhu, Q.; Wang, X.; Jiang, L.; Chen, X.; Wang, X. Epithelial ovarian cancer-secreted exosomal miR-222-3p induces polarization of tumor-associated macrophages. Oncotarget 2016, 7, 43076–43087. [Google Scholar] [CrossRef] [Green Version]
- Meng, F.; Li, Z.; Zhang, Z.; Yang, Z.; Kang, Y.; Zhao, X.; Long, D.; Hu, S.; Gu, M.; He, S.; et al. MicroRNA-193b-3p regulates chondrogenesis and chondrocyte metabolism by targeting HDAC3. Theranostics 2018, 8, 2862–2883. [Google Scholar] [CrossRef]
- Chang, Z.; Meng, F.; Zhang, Z.; Mao, G.; Huang, Z.; Liao, W.; He, A. MicroRNA-193b-3p regulates matrix metalloproteinase 19 expression in interleukin-1β-induced human chondrocytes. J. Cell. Biochem. 2018, 119, 4775–4782. [Google Scholar] [CrossRef] [PubMed]
- Mathiessen, A.; Conaghan, P.G. Synovitis in osteoarthritis: Current understanding with therapeutic implications. Arthritis Res. Ther. 2017, 19, 18. [Google Scholar] [CrossRef] [PubMed] [Green Version]
- Colombini, A.; Libonati, F.; Lopa, S.; Ragni, E.; De Luca, P.; Zagra, L.; Sinigaglia, F.; Moretti, M.; de Girolamo, L. Immunomodulatory potential of secretome from cartilage cells and mesenchymal stromal cells in an arthritic context: From predictive fiction toward reality. Front. Med. 2022, 9, 992386. [Google Scholar] [CrossRef] [PubMed]
- Ragni, E.; Orfei, C.P.; De Luca, P.; Mondadori, C.; Viganò, M.; Colombini, A.; De Girolamo, L. Inflammatory priming enhances mesenchymal stromal cell secretome potential as a clinical product for regenerative medicine approaches through secreted factors and EV-miRNAs: The example of joint disease. Stem Cell Res. Ther. 2020, 11, 165. [Google Scholar] [CrossRef] [PubMed]
- Skibber, M.A.; Olson, S.D.; Prabhakara, K.S.; Gill, B.S.; Cox, C.S.J. Enhancing Mesenchymal Stromal Cell Potency: Inflammatory Licensing via Mechanotransduction. Front. Immunol. 2022, 13, 3327. [Google Scholar] [CrossRef]
- Zhao, X.; Zhao, Y.; Sun, X.; Xing, Y.; Wang, X.; Yang, Q. Immunomodulation of MSCs and MSC-Derived Extracellular Vesicles in Osteoarthritis. Front. Bioeng. Biotechnol. 2020, 8, 575057. [Google Scholar] [CrossRef]
- Cifù, A.; Domenis, R.; Pozzi-Mucelli, M.; Di Benedetto, P.; Causero, A.; Moretti, M.; Stevanato, M.; Pistis, C.; Parodi, P.C.; Fabris, M.; et al. The Exposure to Osteoarthritic Synovial Fluid Enhances the Immunomodulatory Profile of Adipose Mesenchymal Stem Cell Secretome. Stem Cells Int. 2020, 2020, 4058760. [Google Scholar] [CrossRef]
- Ragni, E.; Colombini, A.; Viganò, M.; Libonati, F.; Orfei, C.P.; Zagra, L.; de Girolamo, L. Cartilage Protective and Immunomodulatory Features of Osteoarthritis Synovial Fluid-Treated Adipose-Derived Mesenchymal Stem Cells Secreted Factors and Extracellular Vesicles-Embedded miRNAs. Cells 2021, 10, 1072. [Google Scholar] [CrossRef]
- Long, H.; Liu, Q.; Yin, H.; Wang, K.; Diao, N.; Zhang, Y.; Lin, J.; Guo, A. Prevalence Trends of Site-Specific Osteoarthritis From 1990 to 2019: Findings From the Global Burden of Disease Study 2019. Arthritis Rheumatol. 2022, 74, 1172–1183. [Google Scholar] [CrossRef]


| pg/Million BMSCs per 48 h | |||||||
|---|---|---|---|---|---|---|---|
| Role | Factor | B1 | B2 | B3 | Mean | SD | Function |
| GF | IGFBP4 | 96,122 | 154,302 | 146,144 | 132,189 | 25,720 | Insulin-like growth factor-binding protein 4 |
| GF | IGFBP3 | 83,291 | 108,773 | 121,569 | 104,545 | 15,910 | Insulin-like growth factor-binding protein 3 |
| INF | TIMP2 | 36,744 | 39,361 | 45,708 | 40,604 | 3764 | Metalloproteinase inhibitor 2 |
| GF | TGFB1 | 24,241 | 25,312 | 10,951 | 20,168 | 6532 | Transforming growth factor beta-1 |
| CHE | IFNL1 | 18,892 | 18,815 | 15,755 | 17,821 | 1461 | Interferon lambda-1 |
| CYT | SERPINE1 | 14,532 | 17,906 | 20,270 | 17,570 | 2354 | Plasminogen activator inhibitor 1 |
| INF | TIMP1 | 14,137 | 16,618 | 20,310 | 17,022 | 2536 | Metalloproteinase inhibitor 1 |
| GF | IGFBP6 | 9478 | 11,134 | 13,129 | 11,247 | 1493 | Insulin-like growth factor-binding protein 6 |
| GF | BMP4 | 12,217 | 9427 | 6622 | 9422 | 2284 | Bone morphogenetic protein 4 |
| GF | IGFBP2 | 4926 | 11,110 | 7451 | 7829 | 2539 | Insulin-like growth factor-binding protein 2 |
| GF | VEGFA | 4498 | 6802 | 6811 | 6037 | 1088 | Vascular endothelial growth factor A |
| REC | VCAM1 | 5052 | 6333 | 6116 | 5834 | 560 | Vascular cell adhesion protein 1 |
| CHE | MIF | 4137 | 4918 | 5835 | 4963 | 694 | Macrophage migration inhibitory factor |
| INF | TNFRSF1A | 3763 | 4516 | 4897 | 4392 | 471 | Tumor necrosis factor receptor superfamily member 1A |
| CHE | XCL1 | 3176 | 5103 | 3256 | 3845 | 890 | Lymphotactin |
| CYT | INHBA | 3536 | 4186 | 3812 | 3845 | 266 | Inhibin beta A chain |
| CYT | ICAM2 | 3013 | 4715 | 3609 | 3779 | 705 | Intercellular adhesion molecule 2 |
| CHE | CCL27 | 2460 | 6090 | 2445 | 3665 | 1715 | C-C motif chemokine 27 |
| CHE | CXCL16 | 2945 | 3952 | 3942 | 3613 | 473 | C-X-C motif chemokine 16 |
| CYT | FST | 1925 | 3169 | 3700 | 2931 | 744 | Follistatin |
| CHE | MST1 | 2232 | 2598 | 2135 | 2322 | 200 | Hepatocyte growth-factor-like protein |
| CHE | CCL21 | 934 | 2655 | 3282 | 2290 | 992 | C-C motif chemokine 2 |
| CYT | ANGPT1 | 1542 | 2114 | 2277 | 1978 | 315 | Angiopoietin-1 |
| REC | PLAUR | 1301 | 2257 | 1872 | 1810 | 393 | Urokinase plasminogen activator surface receptor |
| CYT | IL6ST | 1135 | 2164 | 1532 | 1610 | 424 | Interleukin-6 receptor subunit beta |
| CHE | PF4 | 3191 | 387 | 1071 | 1550 | 1194 | Platelet factor 4 |
| INF | CCL2 | 841 | 1368 | 1855 | 1355 | 414 | C-C motif chemokine 2 |
| CYT | CTSS | 1051 | 1535 | 1461 | 1349 | 213 | Cathepsin S |
| CYT | ANG | 1204 | 1397 | 1364 | 1322 | 85 | Angiogenin |
| REC | ALCAM | 1034 | 1342 | 1390 | 1255 | 158 | CD166 antigen |
| CHE | CXCL11 | 1443 | 1370 | 828 | 1214 | 274 | C-X-C motif chemokine 11 |
| INF | IL11 | 1611 | 711 | 1261 | 1194 | 371 | Interleukin-11 |
| CYT | IL23A | 530 | 1172 | 1263 | 989 | 326 | Interleukin-23 subunit alpha |
| CHE | CCL25 | 257 | 965 | 1495 | 906 | 507 | C-C motif chemokine 25 |
| CHE | SPP1 | 742 | 954 | 848 | 848 | 86 | Osteopontin |
| CYT | IL13RA2 | 683 | 873 | 557 | 704 | 130 | Interleukin-13 receptor subunit alpha-2 |
| CHE | LIF | 960 | 251 | 844 | 685 | 311 | Leukemia inhibitory factor |
| INF | IL6 | 530 | 641 | 795 | 655 | 109 | Interleukin-6 |
| INF | IL1RN | 439 | 807 | 695 | 647 | 154 | Interleukin-1 receptor antagonist protein |
| GF | HGF | 383 | 537 | 741 | 554 | 147 | Hepatocyte growth factor |
| CYT | CED | 386 | 587 | 663 | 545 | 117 | Diaphyseal Dysplasia 1 |
| REC | PDGFRB | 162 | 647 | 805 | 538 | 274 | Platelet-derived growth factor receptor beta |
| REC | CD14 | 361 | 385 | 457 | 401 | 41 | Monocyte differentiation antigen CD14 |
| GF | KDR | 167 | 575 | 350 | 364 | 167 | Vascular endothelial growth factor receptor 2 |
| CHE | CXCL10 | 307 | 456 | 290 | 351 | 75 | C-X-C motif chemokine 10 |
| CHE | IFNL2 | 371 | 182 | 466 | 340 | 118 | Interferon lambda-2 |
| GF | GDF15 | 255 | 334 | 345 | 311 | 40 | Growth/differentiation factor 15 |
| INF | TNFRSF1B | 263 | 328 | 330 | 307 | 31 | Tumor necrosis factor receptor superfamily member 1B |
| CHE | TNFSF14 | 402 | 245 | 213 | 287 | 83 | Tumor necrosis factor ligand superfamily member 14 |
| CHE | CXCL12 | 248 | 244 | 360 | 284 | 54 | C-X-C motif chemokine 12, splicing variant alpha |
| INF | IL6R | 324 | 294 | 197 | 272 | 55 | Interleukin-6 receptor subunit alpha |
| CYT | IL17B | 189 | 513 | 56 | 253 | 192 | Interleukin-17B |
| REC | IL21R | 210 | 194 | 353 | 252 | 71 | Interleukin-21 receptor |
| INF | ICAM1 | 200 | 265 | 268 | 244 | 31 | Intercellular adhesion molecule 1 |
| CHE | AXL | 177 | 427 | 80 | 228 | 146 | Tyrosine-protein kinase receptor UFO |
| INF | IL16 | 172 | 162 | 349 | 228 | 86 | Pro-interleukin-16 |
| INF | IL1A | 107 | 261 | 285 | 218 | 79 | Interleukin-1 alpha |
| INF | TNF | 122 | 158 | 363 | 215 | 106 | Tumor necrosis factor |
| CYT | DKK1 | 182 | 299 | 156 | 212 | 62 | Dickkopf-related protein 1 |
| INF | PDGFB | 150 | 89 | 288 | 176 | 83 | Platelet-derived growth factor subunit B |
| GF | NTF4 | 112 | 170 | 233 | 172 | 49 | Neurotrophin-4 |
| GF | EGFR | 141 | 170 | 203 | 171 | 26 | Epidermal growth factor receptor |
| CYT | CXCL12 | 146 | 219 | 146 | 170 | 34 | C-X-C motif chemokine 12, splicing variant beta |
| INF | CXCL9 | 161 | 194 | 144 | 166 | 21 | C-X-C motif chemokine 9 |
| INF | IL7 | 147 | 144 | 139 | 144 | 3 | Interleukin-7 |
| GF | TNFRSF11B | 127 | 121 | 178 | 142 | 26 | Tumor necrosis factor receptor superfamily member 11B |
| CYT | THPO | 106 | 269 | 9 | 128 | 107 | Thrombopoietin |
| INF | CXCL8 | 86 | 99 | 180 | 122 | 42 | Interleukin-8 |
| INF | CCL5 | 87 | 120 | 141 | 116 | 22 | C-C motif chemokine 5 |
| REC | CNTN2 | 49 | 193 | 90 | 111 | 61 | Contactin-2 |
| INF | IL15 | 87 | 88 | 150 | 108 | 30 | Interleukin-15 |
| CHE | CCL7 | 137 | 42 | 112 | 97 | 40 | C-C motif chemokine 7 |
| CHE | BTC | 85 | 89 | 109 | 94 | 11 | Probetacellulin |
| CYT | VEGFC | 105 | 110 | 61 | 92 | 22 | Vascular endothelial growth factor C |
| INF | IL2 | 46 | 135 | 66 | 83 | 38 | Interleukin-2 |
| INF | IFNG | 45 | 148 | 44 | 79 | 49 | Interferon gamma |
| INF | CSF2 | 95 | 81 | 53 | 76 | 18 | Granulocyte-macrophage colony-stimulating factor |
| GF | KIT | 88 | 50 | 83 | 74 | 17 | Mast/stem cell growth factor receptor Kit |
| INF | CCL1 | 88 | 78 | 49 | 72 | 17 | C-C motif chemokine 1 |
| CYT | TNFRSF10D | 56 | 108 | 13 | 59 | 39 | Tumor necrosis factor receptor superfamily member 10D |
| REC | ENG | 52 | 80 | 45 | 59 | 15 | Endoglin |
| INF | IL4 | 60 | 30 | 85 | 59 | 22 | Interleukin-4 |
| CYT | SHH | 47 | 58 | 71 | 58 | 10 | Sonic hedgehog protein |
| CYT | CD40 | 66 | 77 | 32 | 58 | 19 | Tumor necrosis factor receptor superfamily member 5 |
| GF | IGFBP1 | 54 | 80 | 35 | 56 | 19 | Insulin-like growth-factor-binding protein 1 |
| REC | FAS | 51 | 63 | 47 | 54 | 7 | Tumor necrosis factor receptor superfamily member 6 |
| CHE | CCL20 | 22 | 66 | 64 | 51 | 20 | C-C motif chemokine 20 |
| CHE | CCL8 | 55 | 50 | 24 | 43 | 14 | C-C motif chemokine 8 |
| INF | CSF3 | 57 | 41 | 32 | 43 | 10 | Granulocyte colony-stimulating factor |
| INF | CSF1 | 31 | 32 | 54 | 39 | 10 | Macrophage colony-stimulating factor 1 |
| CYT | EPCAM | 30 | 35 | 36 | 34 | 3 | Epithelial cell adhesion molecule |
| GF | KITLG | 40 | 11 | 37 | 30 | 13 | Kit ligand |
| GF | PGF | 13 | 33 | 34 | 27 | 10 | Placenta growth factor |
| REC | EDA2R | 1 | 41 | 33 | 25 | 17 | Tumor necrosis factor receptor superfamily member 27 |
| INF | IL1B | 8 | 26 | 21 | 19 | 8 | Interleukin-1 beta |
| GF | PROK1 | 19 | 13 | 16 | 16 | 2 | Prokineticin-1 |
| CYT | IL1RL1 | 3 | 30 | 11 | 15 | 11 | Interleukin-1 receptor-like 1 |
| GF | FLT4 | 22 | 7 | 12 | 14 | 6 | Vascular endothelial growth factor receptor 3 |
| REC | TNFRSF21 | 16 | 18 | 5 | 13 | 6 | Tumor necrosis factor receptor superfamily member 21 |
| REC | MOK | 1 | 16 | 21 | 13 | 9 | MAPK/MAK/MRK overlapping kinase |
| INF | CCL24 | 15 | 2 | 19 | 12 | 7 | C-C motif chemokine 24 |
| REC | ERBB3 | 23 | 10 | 1 | 12 | 9 | Receptor tyrosine-protein kinase erbB-3 |
| INF | CCL11 | 8 | 4 | 19 | 11 | 6 | Eotaxin |
| REC | TNFRSF10C | 9 | 16 | 4 | 10 | 5 | Tumor necrosis factor receptor superfamily member 10C |
| CHE | CCL13 | 10 | 6 | 11 | 9 | 2 | C-C motif chemokine 13 |
| CHE | CCL17 | 6 | 7 | 9 | 7 | 1 | C-C motif chemokine 17 |
| REC | FLT3LG | 6 | 7 | 7 | 7 | 0 | Fms-related tyrosine kinase 3 ligand |
| INF | CCL4 | 4 | 6 | 8 | 6 | 2 | C-C motif chemokine 4 |
| CHE | PPBP | 7 | 5 | 5 | 6 | 1 | Platelet basic protein |
| INF | CXCL13 | 4 | 2 | 3 | 3 | 1 | C-X-C motif chemokine 13 |
| INF | IL12A/B | 1 | 1 | 3 | 2 | 1 | Interleukin-12 subunit alpha |
| CRT | CRT | CRT | CRT | CRT | CRT | CRT | CRT | CRT | CRT | ||||
|---|---|---|---|---|---|---|---|---|---|---|---|---|---|
| miRBase ID | B1 | B2 | B3 | Mean | SD | Weight % | miRBase ID | B1 | B2 | B3 | Mean | SD | Weight % |
| hsa-miR-518f-3p | 10.20 | 10.12 | 13.23 | 11.18 | 1.45 | 25.25552 | hsa-miR-409-3p | 16.97 | 17.12 | 16.73 | 16.94 | 0.16 | 0.46626 |
| hsa-miR-24-3p | 12.66 | 12.19 | 12.09 | 12.31 | 0.25 | 11.52898 | hsa-miR-618 | 11.91 | 15.11 | 23.98 | 17.00 | 5.10 | 0.44726 |
| hsa-miR-222-3p | 13.16 | 13.01 | 12.51 | 12.89 | 0.28 | 7.70535 | hsa-miR-106a-5p | 17.15 | 16.86 | 17.43 | 17.15 | 0.23 | 0.40375 |
| hsa-miR-574-3p | 13.11 | 13.22 | 12.77 | 13.03 | 0.19 | 6.99275 | hsa-miR-657 | 18.32 | 16.08 | 17.18 | 17.19 | 0.91 | 0.39180 |
| hsa-miR-193b-3p | 13.08 | 13.23 | 12.87 | 13.06 | 0.15 | 6.87580 | hsa-miR-221-3p | 18.56 | 17.13 | 16.95 | 17.55 | 0.72 | 0.30620 |
| hsa-miR-191-5p | 13.20 | 13.30 | 13.00 | 13.16 | 0.13 | 6.39020 | hsa-miR-34a-5p | 15.92 | 17.18 | 19.68 | 17.59 | 1.56 | 0.29686 |
| hsa-miR-484 | 13.91 | 14.04 | 13.83 | 13.93 | 0.09 | 3.76555 | hsa-miR-627-5p | 16.27 | 16.58 | 20.00 | 17.62 | 1.69 | 0.29156 |
| hsa-miR-1274B | 13.99 | 13.97 | 14.23 | 14.06 | 0.12 | 3.42521 | hsa-miR-302c-3p | 14.25 | 20.79 | 17.81 | 17.62 | 2.67 | 0.29149 |
| hsa-miR-197-3p | 14.17 | 14.20 | 14.56 | 14.31 | 0.18 | 2.89092 | hsa-miR-92a-3p | 18.04 | 17.63 | 17.67 | 17.78 | 0.19 | 0.25999 |
| hsa-miR-320a-3p | 14.27 | 14.17 | 14.73 | 14.39 | 0.24 | 2.74067 | hsa-miR-132-3p | 18.16 | 17.62 | 17.87 | 17.88 | 0.22 | 0.24247 |
| hsa-miR-662 | 17.80 | 16.69 | 12.09 | 15.53 | 2.47 | 1.24360 | hsa-miR-205-5p | 14.88 | 20.81 | 18.07 | 17.92 | 2.42 | 0.23693 |
| hsa-miR-523-3p | 14.57 | 14.89 | 17.56 | 15.67 | 1.34 | 1.12287 | hsa-miR-483-5 | 17.43 | 18.43 | 18.00 | 17.95 | 0.41 | 0.23125 |
| hsa-miR-214-3p | 15.85 | 15.62 | 15.77 | 15.75 | 0.10 | 1.06599 | hsa-miR-382-5p | 17.24 | 18.16 | 18.65 | 18.02 | 0.58 | 0.22137 |
| hsa-miR-125b-5p | 16.24 | 15.54 | 15.69 | 15.82 | 0.30 | 1.01269 | hsa-miR-199a-3p | 18.76 | 17.68 | 17.65 | 18.03 | 0.52 | 0.21903 |
| hsa-miR-145-5p | 16.24 | 15.98 | 15.45 | 15.89 | 0.33 | 0.96495 | hsa-miR-31-5p | 18.23 | 18.15 | 17.96 | 18.12 | 0.11 | 0.20659 |
| hsa-miR-19b-3p | 15.93 | 16.01 | 15.94 | 15.96 | 0.04 | 0.92244 | hsa-miR-138-5p | 18.27 | 17.82 | 18.36 | 18.15 | 0.24 | 0.20206 |
| hsa-miR-342-3p | 16.10 | 16.05 | 15.77 | 15.98 | 0.15 | 0.91121 | hsa-miR-20a-5p | 18.45 | 18.08 | 18.03 | 18.19 | 0.19 | 0.19663 |
| hsa-miR-99a-5p | 16.16 | 15.85 | 16.19 | 16.07 | 0.15 | 0.85571 | hsa-miR-376c-3p | 18.24 | 18.27 | 18.44 | 18.31 | 0.09 | 0.18027 |
| hsa-miR-16-5p | 16.46 | 15.99 | 15.94 | 16.13 | 0.23 | 0.81990 | hsa-miR-146b-5p | 18.68 | 18.58 | 17.93 | 18.39 | 0.33 | 0.17046 |
| hsa-miR-30c-5p | 16.37 | 16.19 | 16.06 | 16.20 | 0.13 | 0.77693 | hsa-miR-28-3p | 18.77 | 18.23 | 18.20 | 18.40 | 0.26 | 0.16979 |
| hsa-miR-21-5p | 16.68 | 15.99 | 15.96 | 16.21 | 0.33 | 0.77407 | hsa-miR-194-5p | 17.13 | 20.51 | 18.07 | 18.57 | 1.42 | 0.15075 |
| hsa-miR-29a-3p | 16.27 | 16.14 | 16.33 | 16.25 | 0.08 | 0.75516 | hsa-miR-186-5p | 18.83 | 18.72 | 18.18 | 18.58 | 0.28 | 0.14995 |
| hsa-miR-30b-5p | 16.58 | 16.21 | 16.35 | 16.38 | 0.15 | 0.68770 | hsa-miR-720 | 18.81 | 18.48 | 18.66 | 18.65 | 0.14 | 0.14235 |
| hsa-let-7b-5p | 17.41 | 16.26 | 16.00 | 16.56 | 0.61 | 0.60872 | hsa-miR-520e-3p | 15.35 | 17.71 | 23.08 | 18.72 | 3.23 | 0.13621 |
| hsa-miR-17-5p | 17.00 | 16.75 | 16.94 | 16.90 | 0.10 | 0.48147 | hsa-miR-193a-5p | 19.25 | 18.40 | 18.54 | 18.73 | 0.37 | 0.13502 |
| hsa-miR-1274A | 16.88 | 16.85 | 16.99 | 16.91 | 0.06 | 0.47782 | Total | 97.2 |
| GO | Biological Process | Count in Network | FDR |
|---|---|---|---|
| GO:0048518 | Positive regulation of biological process | 826 of 6112 | 2.85 × 10−165 |
| GO:0048522 | Positive regulation of cellular process | 791 of 5579 | 4.50 × 10−165 |
| GO:0048519 | Negative regulation of biological process | 762 of 5389 | 6.31 × 10−154 |
| GO:0048523 | Negative regulation of cellular process | 720 of 4874 | 7.11 × 10−150 |
| GO:0009893 | Positive regulation of metabolic process | 642 of 3893 | 3.33 × 10−147 |
| GO:0010604 | Positive regulation of macromolecule metabolic process | 611 of 3600 | 1.93 × 10−142 |
| GO:0031325 | Positive regulation of cellular metabolic process | 587 of 3413 | 5.69 × 10−137 |
| GO:0051173 | Positive regulation of nitrogen compound metabolic process | 567 of 3239 | 1.25 × 10−133 |
| GO:0031323 | Regulation of cellular metabolic process | 781 of 6239 | 1.77 × 10−130 |
| GO:0019222 | Regulation of metabolic process | 823 of 6948 | 1.27 × 10−129 |
| Expressing Cell (>1%) * | Weight% | Main EV-miRNA (%) | Function | ||||
|---|---|---|---|---|---|---|---|
| C | S | H | T | ||||
| CYTOKINES | |||||||
| TNF | X | X | 1.49 | hsa-miR-125b-5p (1.01) | Pro-inflammatory | ||
| IL6 | X | X | 0.17 | hsa-miR-146b-5p (0.17) | Pro-inflammatory | ||
| IL1B | X | X | 0.77 | hsa-miR-21-5p (0.77) | Pro-inflammatory | ||
| IL1A | X | X | 6.39 | hsa-miR-191-5p (6.39) | Pro-inflammatory | ||
| CXCL12 | X | X | 0.52 | hsa-miR-221-3p (0.31) | Articular cartilage matrix degeneration | ||
| CCL5 | X | X | X | 1.07 | hsa-miR-214-3p (1.07) | Cartilage erosion | |
| IL11 | X | X | X | 0.78 | hsa-miR-30c-5p (0.78) | Pro-inflammatory | |
| GROWTH FACTORS | |||||||
| TGFB1 | X | X | X | X | 18.52 | hsa-miR-24-3p (11.53) | Cartilage homeostasis, chondrocytes hypertrophy |
| IGF1 | X | X | 0.98 | hsa-miR-29a-3p (0.76) | Promotes chondrocyte anabolic activity | ||
| FGF2 | X | X | 0.97 | hsa-miR-16-5p (0.82) | Promotes catabolic and anti-anabolic effects in OA joints | ||
| BMP2 | X | X | X | 0.88 | hsa-miR-17-5p (0.48) | Promotes cartilage regeneration | |
| VEGFA | X | X | X | 8.04 | hsa-miR-320a-3p (2.74) | Chondrocyte catabolism | |
| HGF | X | X | 1.04 | hsa-miR-16-5p (0.82) | Cartilage homeostasis, osteophyte formation | ||
| ANGPT2 | X | X | 1.97 | hsa-miR-125b-5p (1.01) | Abnormal angiogenesis in OA | ||
| CTGF | X | X | X | 1.98 | hsa-miR-145-5p (0.96) | Promotes osteophyte formation and ECM degradation | |
| KITLG | X | X | X | 2.74 | hsa-miR-320a-3p (2.74) | Promotes synovial mast cell hyperplasia and inflammation | |
| TGFB2 | X | X | X | 1.73 | hsa-miR-145-5p (0.96) | Cartilage homeostasis, high levels during OA development | |
| INHBB | X | 0.30 | hsa-miR-34a-5p (0.30) | TGFB superfamily, upregulated in OA | |||
| IGF2 | X | X | 1.01 | hsa-miR-125b-5p (1.01) | Promotes cartilage matrix levels | ||
| BDNF | X | 1.06 | hsa-miR-16-5p (0.82) | Promotes joint pain and inflammation | |||
| PROTEASES | |||||||
| ADAM12 | X | X | 0.76 | hsa-miR-29a-3p (0.76) | Metalloproteinase involved in ECM degradation | ||
| ADAM17 | X | X | X | 0.96 | hsa-miR-145-5p (0.96) | Metalloproteinase involved in ECM degradation | |
| ADAMTS9 | X | 0.76 | hsa-miR-29a-3p (0.76) | Metalloproteinase involved in ECM degradation | |||
| MMP1 | X | 8.67 | hsa-miR-222-3p (7.71) | Metalloproteinase involved in ECM degradation | |||
| MMP2 | X | X | 2.56 | hsa-miR-125b-5p (1.01) | Metalloproteinase involved in ECM degradation | ||
| MMP9 | X | X | 0.24 | hsa-miR-132-3p (0.24) | Metalloproteinase involved in ECM degradation | ||
| MMP14 | X | X | 12.49 | hsa-miR-24-3p (11.53) | Metalloproteinase involved in ECM degradation | ||
| PLAU | X | X | 6.88 | hsa-miR-193b-3p (6.88) | ECM-degrading enzyme | ||
| PLAT | X | X | 0.77 | hsa-miR-21-5p (0.77) | ECM-degrading enzyme | ||
| APC | X | X | 1.41 | hsa-miR-125b-5p (1.01) | Promotes MMP activity | ||
| TIMP2 | X | X | 0.60 | hsa-miR-106a-5p (0.40) | MMP inhibitor | ||
| TIMP3 | X | X | 9.27 | hsa-miR-222-3p (7.71) | MMP inhibitor | ||
| Cartilage | Weight% | Role |
|---|---|---|
| Protective | ||
| hsa-miR-24-3p | 11.52898 | Regulates chondrocyte senescence |
| hsa-miR-222-3p | 7.70535 | Reduces cartilage degradation |
| hsa-miR-193b-3p | 6.87580 | Reduces inflammation |
| hsa-miR-320a-3p | 2.74067 | Increases chondrocyte viability |
| hsa-miR-125b-5p | 1.01269 | Prevents aggrecan loss |
| hsa-miR-17-5p | 0.48147 | Induces autophagy |
| hsa-miR-221-3p | 0.30620 | Prevents ECM degradation |
| hsa-miR-92a-3p | 0.25999 | Increases collagen deposition |
| hsa-miR-199a-3p | 0.21903 | Anti-catabolic |
| TOTAL | 31.13017 | |
| Destructive | ||
| hsa-miR-16-5p | 0.81990 | Cartilage degradation |
| hsa-miR-21-5p | 0.77407 | Negatively regulates chondrogenesis |
| hsa-miR-30b-5p | 0.68770 | Pro-apoptotic, ECM degradation |
| hsa-miR-34a-5p | 0.29686 | Pro-apoptotic |
| hsa-miR-483-5p | 0.23125 | Chondrocyte hypertrophy, ECM degradation and cartilage angiogenesis |
| hsa-miR-138-5p | 0.20206 | Cartilage degradation |
| TOTAL | 3.01185 | |
| Dual | ||
| hsa-miR-145-5p | 0.96495 | Regulates chondrocyte proliferation and fibrosis |
| SYNOVIA | ||
| Protective | ||
| hsa-miR-29a-3p | 0.75516 | Protects synovial remodeling |
| Destructive | ||
| hsa-miR-34a-5p | 0.29686 | Synovial inflammation |
| MACROPHAGE | ||
| M1 | ||
| hsa-miR-125b-5p | 1.01269 | Pro-M1 |
| hsa-miR-145-5p | 0.96495 | Pro-M1 |
| TOTAL | 1.97764 | |
| M2 | ||
| hsa-miR-24-3p | 11.52898 | Pro-M2, anti-M1 |
| hsa-miR-222-3p | 7.70535 | Pro-M2 |
| hsa-miR-34a-5p | 0.29686 | Pro-M2 |
| hsa-let-7b-5p | 0.60872 | Pro-M2 |
| TOTAL | 20.13992 | |
| T CELL | ||
| Pro-activation | ||
| hsa-miR-214-3p | 1.06599 | Reduces PTEN repressor |
| hsa-miR-19b-3p | 0.92244 | Reduces PTEN repressor |
| hsa-miR-21-5p | 0.77407 | Reduces PTEN repressor |
| hsa-let-7b-5p | 0.60872 | Targets IL10 |
| hsa-miR-17-5p | 0.48147 | Reduces PTEN repressor and promotes IFNG |
| hsa-miR-106a-5p | 0.40375 | Targets IL10 |
| hsa-miR-221-3p | 0.3062 | Downregulates PIK3R1 |
| hsa-miR-132-3p | 0.24247 | Downregulates PIK3R1 |
| TOTAL | 4.80510 | |
| Anti-activation | ||
| hsa-miR-24-3p | 11.52898 | Represses IFNG |
| hsa-miR-125b-5p | 1.01269 | Targets key molecules for T cell activation |
| hsa-miR-342-3p | 0.91121 | Downregulated during activation |
| TOTAL | 13.45289 | |
| Dual | ||
| hsa-miR-31-5p | 0.20659 | Upregulates IL2, downregulated with activation |
| hsa-miR-146b-5p | 0.17046 | Reduces TREF6 repressor, downregulated with activation |
| TOTAL | 0.37706 |
Publisher’s Note: MDPI stays neutral with regard to jurisdictional claims in published maps and institutional affiliations. |
© 2022 by the authors. Licensee MDPI, Basel, Switzerland. This article is an open access article distributed under the terms and conditions of the Creative Commons Attribution (CC BY) license (https://creativecommons.org/licenses/by/4.0/).
Share and Cite
Ragni, E.; Perucca Orfei, C.; de Girolamo, L. Secreted Factors and Extracellular Vesicles Account for the Immunomodulatory and Tissue Regenerative Properties of Bone-Marrow-Derived Mesenchymal Stromal Cells for Osteoarthritis. Cells 2022, 11, 3501. https://doi.org/10.3390/cells11213501
Ragni E, Perucca Orfei C, de Girolamo L. Secreted Factors and Extracellular Vesicles Account for the Immunomodulatory and Tissue Regenerative Properties of Bone-Marrow-Derived Mesenchymal Stromal Cells for Osteoarthritis. Cells. 2022; 11(21):3501. https://doi.org/10.3390/cells11213501
Chicago/Turabian StyleRagni, Enrico, Carlotta Perucca Orfei, and Laura de Girolamo. 2022. "Secreted Factors and Extracellular Vesicles Account for the Immunomodulatory and Tissue Regenerative Properties of Bone-Marrow-Derived Mesenchymal Stromal Cells for Osteoarthritis" Cells 11, no. 21: 3501. https://doi.org/10.3390/cells11213501