
Sacsin Deletion Induces Aggregation of Glial Intermediate Filaments

 , , , and
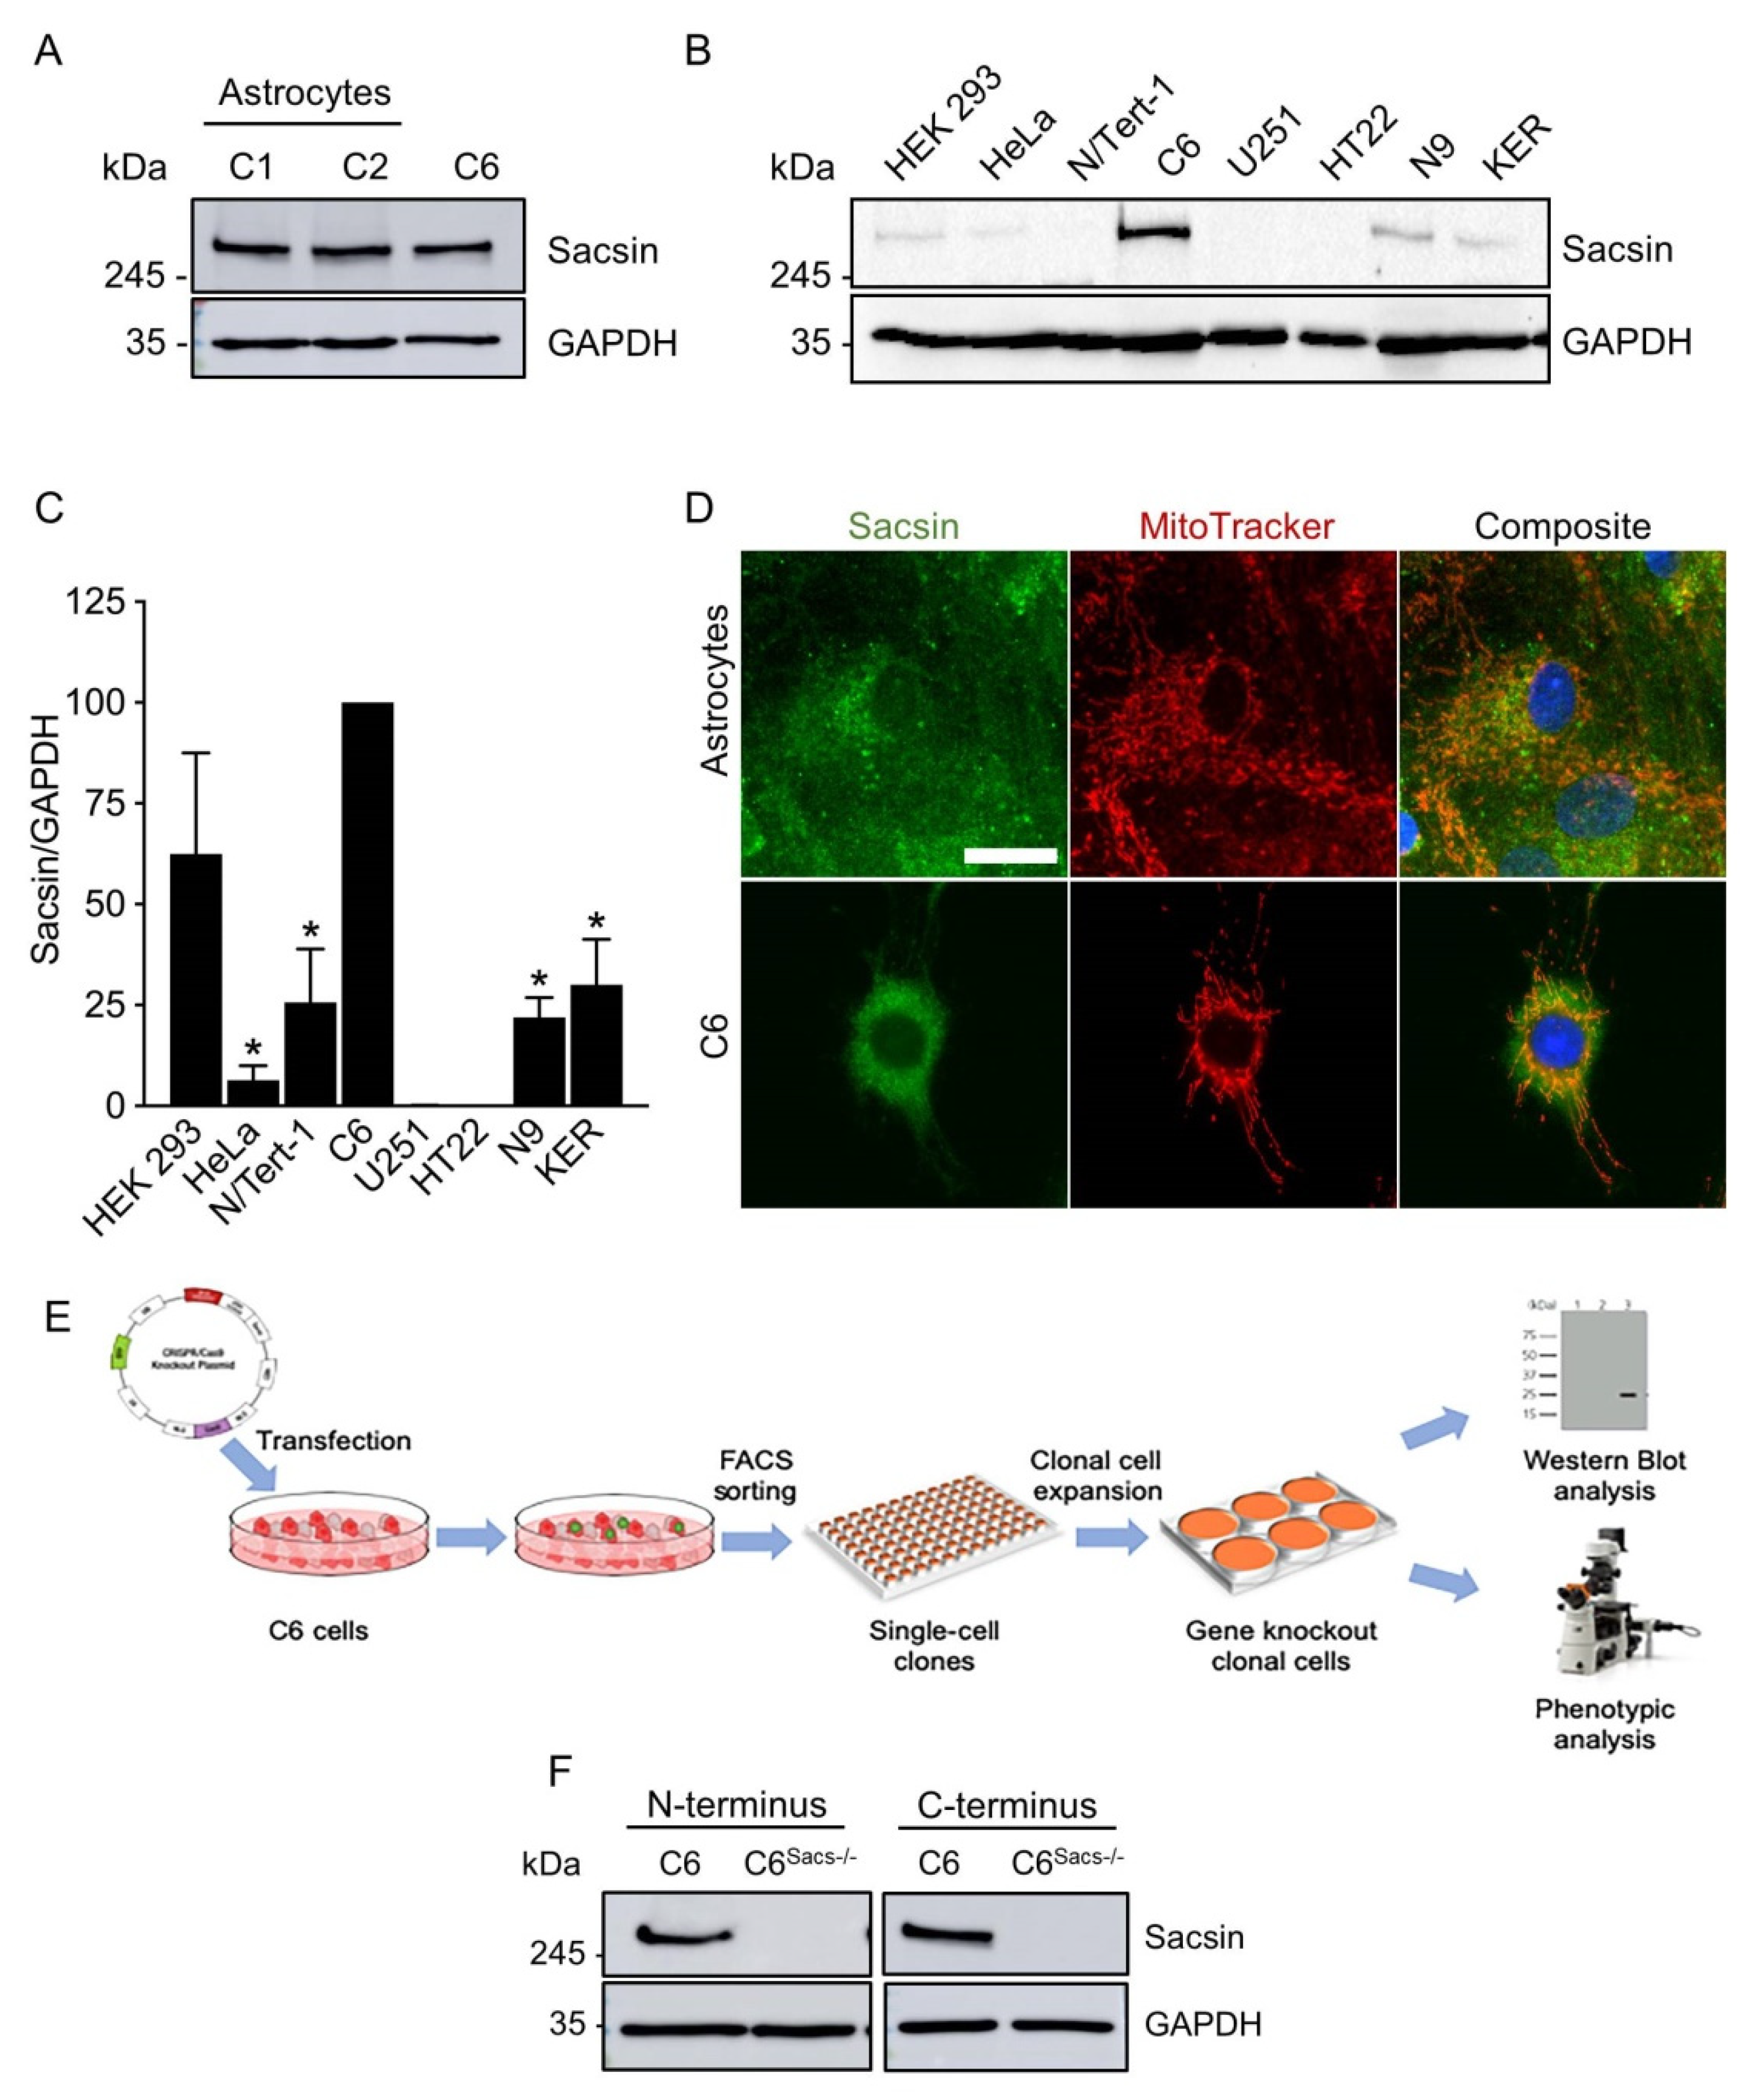
Abstract
:1. Introduction
2. Materials and Methods
2.1. Reagents
2.2. Cell Cultures and Treatments
2.3. Generation of Sacsin KO Cell Lines Using the CRISPR/Cas9 System
2.4. Primary Cultures of Astrocytes
2.5. Cell Viability Assays
2.6. Flow Cytometry
2.7. Western Blot
2.8. Filter Trap Assays
2.9. Fluorescence Microscopy of Live Cells and Immunocytochemistry
2.10. Statistical Analysis
3. Results
3.1. Astroglia Express Sacsin
3.2. Sacsin Loss Induces Higher Sensitivity to Oxidative Challenge
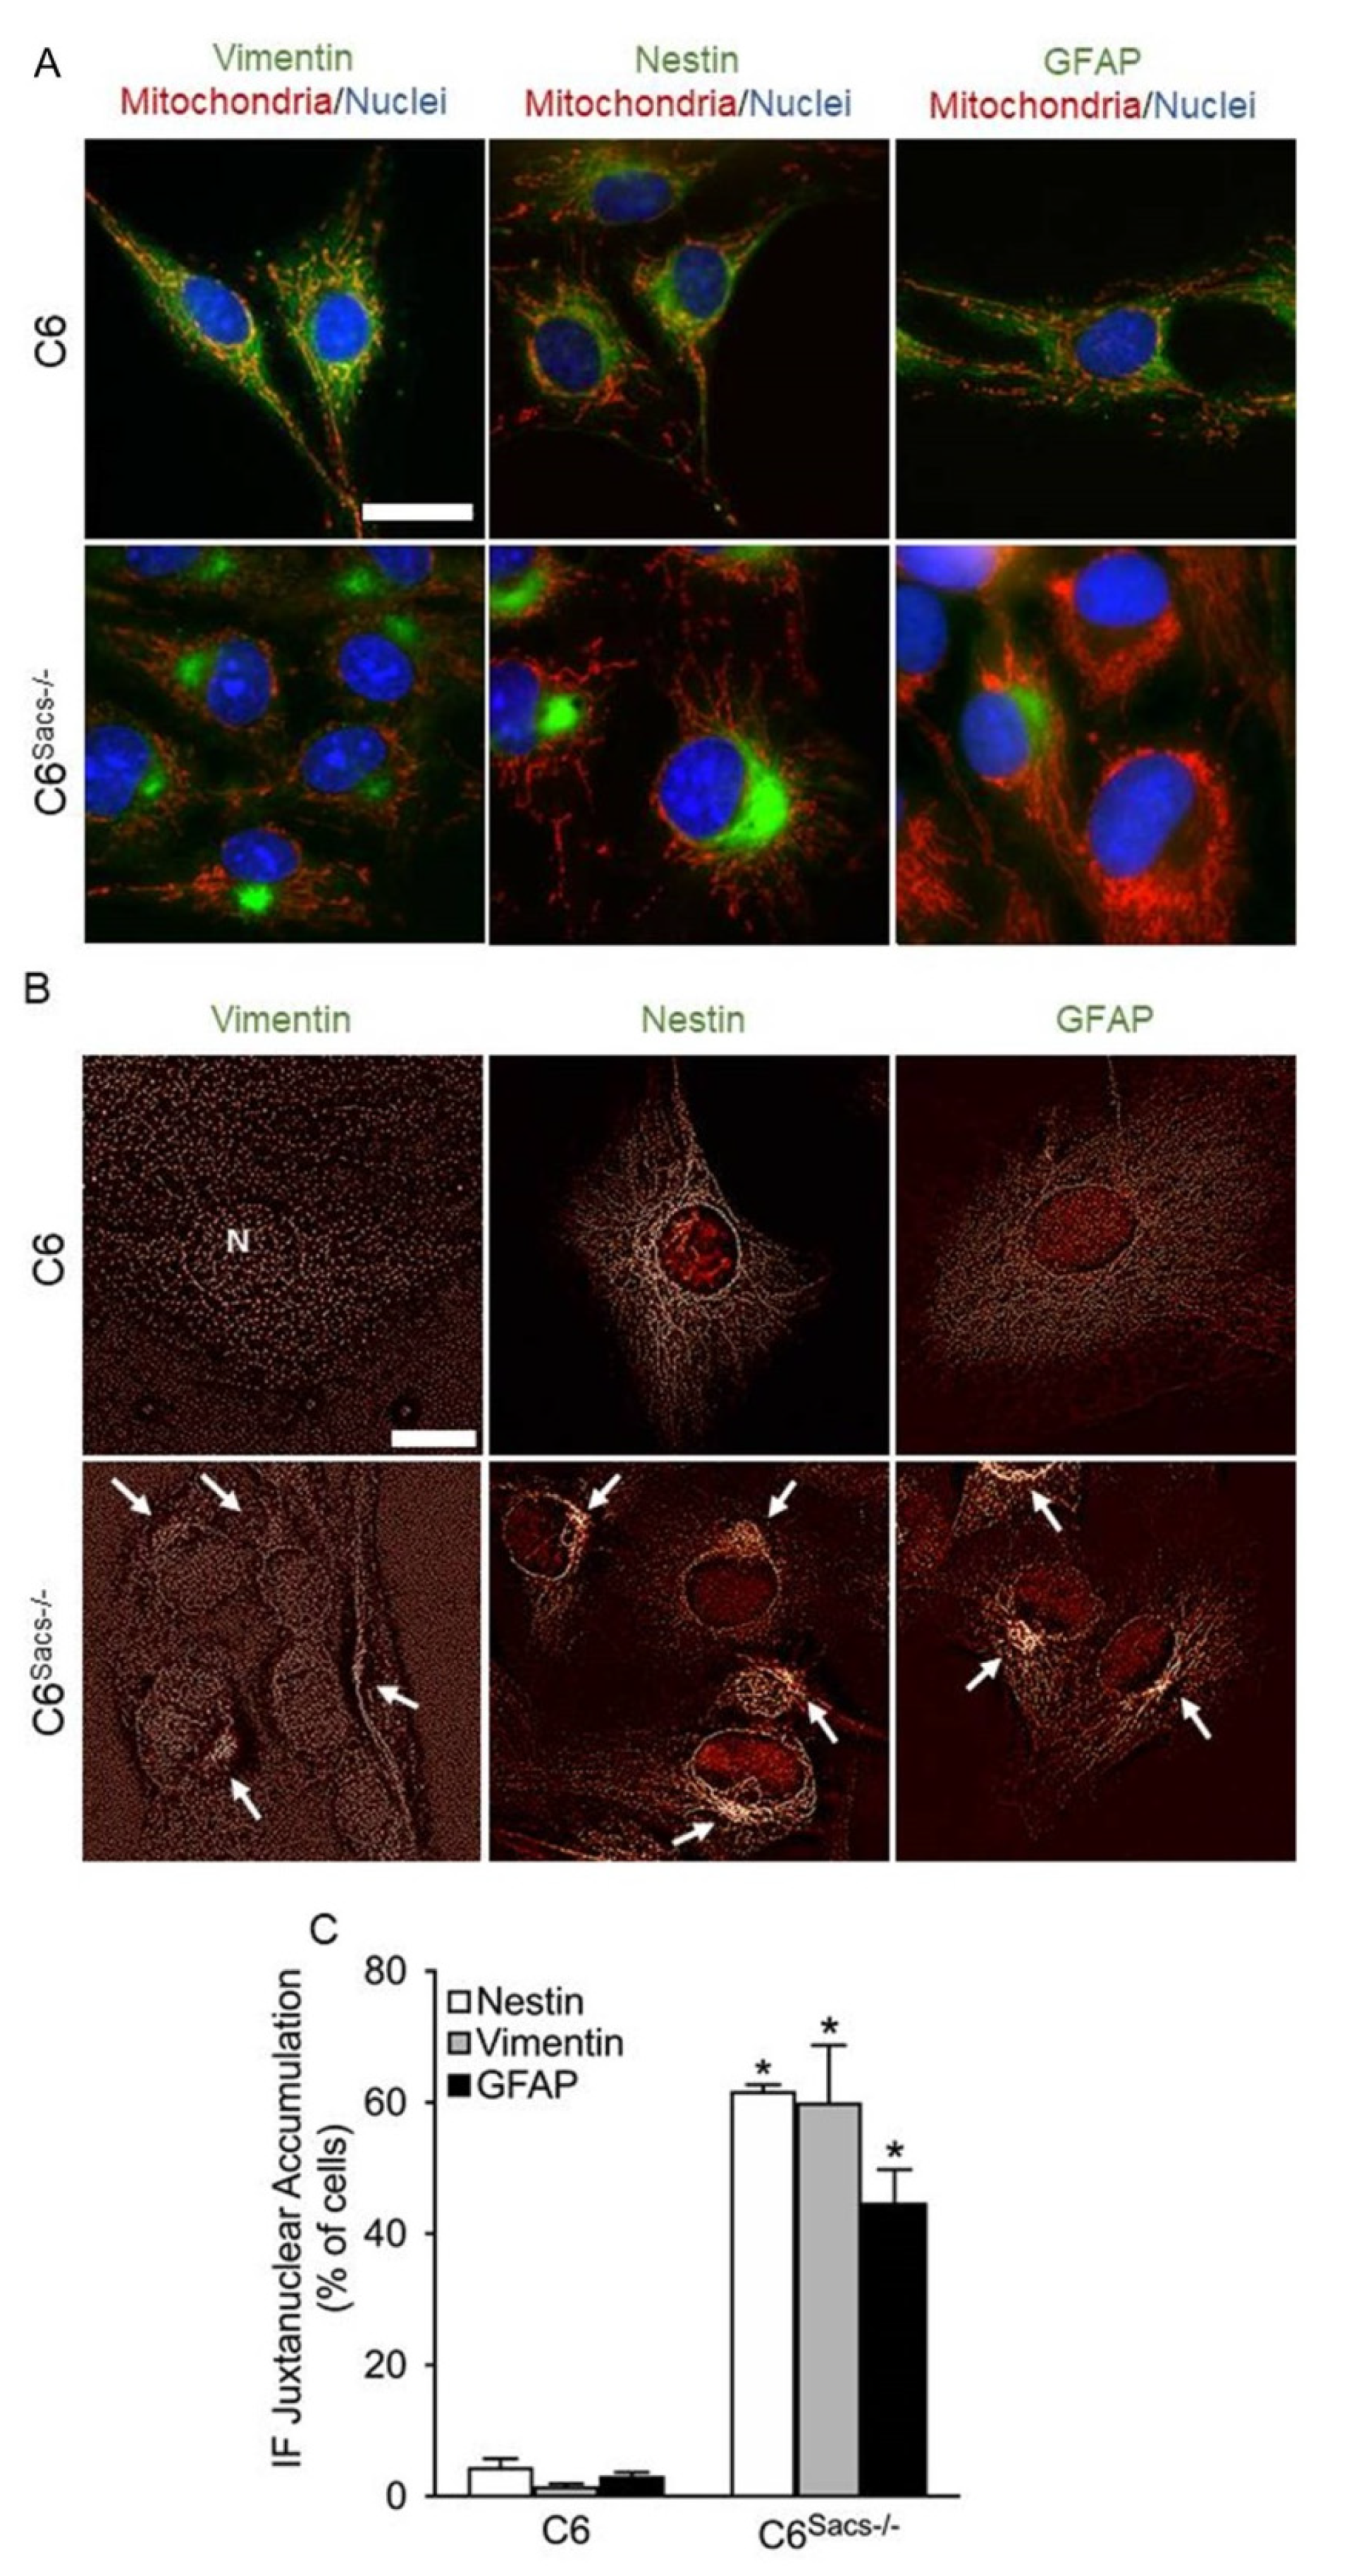
3.3. Sacsin Deletion Leads to Juxtanuclear Accumulation of Glial IFs
3.4. Sacsin Deletion Produces Alterations in the Response to Inflammatory Cytokines
4. Discussion
Supplementary Materials
Author Contributions
Funding
Institutional Review Board Statement
Informed Consent Statement
Data Availability Statement
Acknowledgments
Conflicts of Interest
References
- Castro, A.A.; Machuca, C.; Jimenez, F.J.R.; Jendelova, P.; Erceg, S. Short Review: Investigating ARSACS: Models for understanding cerebellar degeneration. Neuropathol. Appl. Neurobiol. 2019, 45, 531–537. [Google Scholar] [CrossRef] [Green Version]
- Vermeer, S.; van de Warrenburg, B.P.; Kamsteeg, E.-J. ARSACS. In GeneReviews; University of Washington: Seattle, WA, USA, 1993. [Google Scholar]
- Stevens, J.C.; Murphy, S.M.; Davagnanam, I.; Phadke, R.; Anderson, G.; Nethisinghe, S.; Bremner, F.; Giunti, P.; Reilly, M.M. The ARSACS phenotype can include supranuclear gaze palsy and skin lipofuscin deposits. J. Neurol. Neurosurg. Psychiatry 2013, 84, 114–116. [Google Scholar] [CrossRef] [PubMed]
- Larivière, R.; Gaudet, R.; Gentil, B.J.; Girard, M.; Conte, T.C.; Minotti, S.; Leclerc-Desaulniers, K.; Gehring, K.; McKinney, R.A.; Shoubridge, E.A.; et al. Sacs knockout mice present pathophysiological defects underlying autosomal recessive spastic ataxia of Charlevoix-Saguenay. Hum. Mol. Genet. 2015, 24, 727–739. [Google Scholar] [CrossRef] [Green Version]
- Parfitt, D.A.; Michael, G.J.; Vermeulen, E.G.M.; Prodromou, N.V.; Webb, T.R.; Gallo, J.-M.; Cheetham, M.E.; Nicoll, W.S.; Blatch, G.L.; Chapple, J.P. The ataxia protein sacsin is a functional co-chaperone that protects against polyglutamine-expanded ataxin-1. Hum. Mol. Genet. 2009, 18, 1556–1565. [Google Scholar] [CrossRef] [Green Version]
- Anderson, J.F.; Siller, E.; Barral, J.M. The neurodegenerative-disease-related protein sacsin is a molecular chaperone. J. Mol. Biol. 2011, 411, 870–880. [Google Scholar] [CrossRef] [PubMed]
- Girard, M.; Lariviere, R.; Parfitt, D.A.; Deane, E.C.; Gaudet, R.; Nossova, N.; Blondeau, F.; Prenosil, G.; Vermeulen, E.G.M.; Duchen, M.R.; et al. Mitochondrial dysfunction and Purkinje cell loss in autosomal recessive spastic ataxia of Charlevoix-Saguenay (ARSACS). Proc. Natl. Acad. Sci. USA 2012, 109, 1661–1666. [Google Scholar] [CrossRef] [Green Version]
- Bradshaw, T.Y.; Romano, L.E.L.; Duncan, E.J.; Nethisinghe, S.; Abeti, R.; Michael, G.J.; Giunti, P.; Vermeer, S.; Chapple, J.P. A reduction in Drp1-mediated fission compromises mitochondrial health in autosomal recessive spastic ataxia of Charlevoix Saguenay. Hum. Mol. Genet. 2016, 25, 3232–3244. [Google Scholar] [CrossRef] [Green Version]
- Gentil, B.J.; Lai, G.T.; Menade, M.; Larivière, R.; Minotti, S.; Gehring, K.; Chapple, J.P.; Brais, B.; Durham, H.D. Sacsin, mutated in the ataxia ARSACS, regulates intermediate filament assembly and dynamics. FASEB J. 2019, 33, 2982–2994. [Google Scholar] [CrossRef] [PubMed] [Green Version]
- Duncan, E.J.; Larivière, R.; Bradshaw, T.Y.; Longo, F.; Sgarioto, N.; Hayes, M.J.; Romano, L.E.L.; Nethisinghe, S.; Giunti, P.; Bruntraeger, M.B.; et al. Altered organization of the intermediate filament cytoskeleton and relocalization of proteostasis modulators in cells lacking the ataxia protein sacsin. Hum. Mol. Genet. 2017, 26, 3130–3143. [Google Scholar] [CrossRef] [PubMed] [Green Version]
- Nishimura, Y.; Kasahara, K.; Inagaki, M. Intermediate filaments and IF-associated proteins: From cell architecture to cell proliferation. Proc. Jpn. Acad. Ser. B Phys. Biol. Sci. 2019, 95, 479–493. [Google Scholar] [CrossRef] [Green Version]
- Winter, L.; Wiche, G. The many faces of plectin and plectinopathies: Pathology and mechanisms. Acta Neuropathol. 2013, 125, 77–93. [Google Scholar] [CrossRef]
- Omary, M.B. “IF-pathies”: A broad spectrum of intermediate filament-associated diseases. J. Clin. Investig. 2009, 119, 1756–1762. [Google Scholar] [CrossRef] [PubMed] [Green Version]
- Liddelow, S.A.; Guttenplan, K.A.; Clarke, L.E.; Bennett, F.C.; Bohlen, C.J.; Schirmer, L.; Bennett, M.L.; Münch, A.E.; Chung, W.-S.; Peterson, T.C.; et al. Neurotoxic reactive astrocytes are induced by activated microglia. Nature 2017, 541, 481–487. [Google Scholar] [CrossRef]
- Messing, A. Alexander disease. In Handbook of Clinical Neurology; Elsevier: Amsterdam, The Netherlands, 2018; Volume 148, pp. 693–700. [Google Scholar]
- Armao, D.; Bouldin, T.W.; Bailey, R.M.; Hooper, J.E.; Bharucha, D.X.; Gray, S.J. Advancing the pathologic phenotype of giant axonal neuropathy: Early involvement of the ocular lens. Orphanet J. Rare Dis. 2019, 14, 27. [Google Scholar] [CrossRef]
- Clarke, L.E.; Liddelow, S.A.; Chakraborty, C.; Münch, A.E.; Heiman, M.; Barres, B.A. Normal aging induces A1-like astrocyte reactivity. Proc. Natl. Acad. Sci. USA 2018, 115, E1896–E1905. [Google Scholar] [CrossRef] [Green Version]
- Zhang, Y.; Sloan, S.A.; Clarke, L.E.; Caneda, C.; Plaza, C.A.; Blumenthal, P.D.; Vogel, H.; Steinberg, G.K.; Edwards, M.S.B.; Li, G.; et al. Purification and Characterization of Progenitor and Mature Human Astrocytes Reveals Transcriptional and Functional Differences with Mouse. Neuron 2016, 89, 37–53. [Google Scholar] [CrossRef] [PubMed] [Green Version]
- Aroeira, R.I.; Sebastião, A.M.; Valente, C.A. BDNF, via truncated TrkB receptor, modulates GlyT1 and GlyT2 in astrocytes. Glia 2015, 63, 2181–2197. [Google Scholar] [CrossRef] [PubMed]
- Letra-Vilela, R.; Cardoso, B.; Silva-Almeida, C.; Maia Rocha, A.; Murtinheira, F.; Branco-Santos, J.; Rodriguez, C.; Martin, V.; Santa-Marta, M.; Herrera, F. Can asymmetric post-translational modifications regulate the behavior of STAT3 homodimers? FASEB BioAdv. 2020, 2, 116–125. [Google Scholar] [CrossRef] [Green Version]
- Criscuolo, C.; Procaccini, C.; Meschini, M.C.; Cianflone, A.; Carbone, R.; Doccini, S.; Devos, D.; Nesti, C.; Vuillaume, I.; Pellegrino, M.; et al. Powerhouse failure and oxidative damage in autosomal recessive spastic ataxia of Charlevoix-Saguenay. J. Neurol. 2015, 262, 2755–2763. [Google Scholar] [CrossRef] [PubMed] [Green Version]
- Gustafsson, N.; Culley, S.; Ashdown, G.; Owen, D.M.; Pereira, P.M.; Henriques, R. Fast live-cell conventional fluorophore nanoscopy with ImageJ through super-resolution radial fluctuations. Nat. Commun. 2016, 7, 1–9. [Google Scholar] [CrossRef] [Green Version]
- Herrmann, J.E.; Imura, T.; Song, B.; Qi, J.; Ao, Y.; Nguyen, T.K.; Korsak, R.A.; Takeda, K.; Akira, S.; Sofroniew, M.V. STAT3 is a critical regulator of astrogliosis and scar formation after spinal cord injury. J. Neurosci. 2008, 28, 7231–7243. [Google Scholar] [CrossRef]
- Muñoz-Lasso, D.C.; Romá-Mateo, C.; Pallardó, F.V.; Gonzalez-Cabo, P. Much More Than a Scaffold: Cytoskeletal Proteins in Neurological Disorders. Cells 2020, 9, 358. [Google Scholar] [CrossRef] [PubMed] [Green Version]
- Wang, X.; Li, X.; Zuo, X.; Liang, Z.; Ding, T.; Li, K.; Ma, Y.; Li, P.; Zhu, Z.; Ju, C.; et al. Photobiomodulation inhibits the activation of neurotoxic microglia and astrocytes by inhibiting Lcn2/JAK2-STAT3 crosstalk after spinal cord injury in male rats. J. Neuroinflamm. 2021, 18, 1–20. [Google Scholar] [CrossRef] [PubMed]
- Zhao, J.; Fu, Y.; Yamazaki, Y.; Ren, Y.; Davis, M.D.; Liu, C.C.; Lu, W.; Wang, X.; Chen, K.; Cherukuri, Y.; et al. APOE4 exacerbates synapse loss and neurodegeneration in Alzheimer’s disease patient iPSC-derived cerebral organoids. Nat. Commun. 2020, 11, 1–14. [Google Scholar] [CrossRef] [PubMed]
- Didonna, A.; Opal, P. The role of neurofilament aggregation in neurodegeneration: Lessons from rare inherited neurological disorders. Mol. Neurodegener. 2019, 14, 19. [Google Scholar] [CrossRef]
- Kuhn, J.; Cascella, M. Alexander Disease; StatPearls Publishing: Treasure Island, FL, USA, 2021. [Google Scholar]
- Tazir, M.; Nouioua, S.; Magy, L.; Huehne, K.; Assami, S.; Urtizberea, A.; Grid, D.; Hamadouche, T.; Rautenstrauss, B.; Vallat, J.M. Phenotypic variability in giant axonal neuropathy. Neuromuscul. Disord. 2009, 19, 270–274. [Google Scholar] [CrossRef]
- Lowery, J.; Jain, N.; Kuczmarski, E.R.; Mahammad, S.; Goldman, A.; Gelfand, V.I.; Opal, P.; Goldman, R.D. Abnormal intermediate filament organization alters mitochondrial motility in giant axonal neuropathy fibroblasts. Mol. Biol. Cell 2016, 27, 608–616. [Google Scholar] [CrossRef] [PubMed]
- Israeli, E.; Dryanovski, D.I.; Schumacker, P.T.; Chandel, N.S.; Singer, J.D.; Julien, J.P.; Goldman, R.D.; Opal, P. Intermediate filament aggregates cause mitochondrial dysmotility and increase energy demands in giant axonal neuropathy. Hum. Mol. Genet. 2016, 25, 2143–2157. [Google Scholar] [CrossRef] [PubMed] [Green Version]
- Dawley, E.M.; O. Samson, S.; Woodard, K.T.; Matthias, K.A. Spinal cord regeneration in a tail autotomizing urodele. J. Morphol. 2012, 273, 211–225. [Google Scholar] [CrossRef]
- Alvarez-Buylla, A.; García-Verdugo, J.M.; Tramontin, A.D. A unified hypothesis on the lineage of neural stem cells. Nat. Rev. Neurosci. 2001, 2, 287–293. [Google Scholar] [CrossRef]
- Zheng, X.; Shen, G.; Yang, X.; Liu, W. Most C6 cells are cancer stem cells: Evidence from clonal and population analyses. Cancer Res. 2007, 67, 3691–3697. [Google Scholar] [CrossRef] [PubMed] [Green Version]
- Zhang, S.J.; Ye, F.; Xie, R.F.; Hu, F.; Wang, B.F.; Wan, F.; Guo, D.S.; Lei, T. Comparative study on the stem cell phenotypes of C6 cells under different culture conditions. Chin. Med. J. 2011, 124, 3118–3126. [Google Scholar] [CrossRef]
- Nekrasova, O.E.; Mendez, M.G.; Chernoivanenko, I.S.; Tyurin-Kuzmin, P.A.; Kuczmarski, E.R.; Gelfand, V.I.; Goldman, R.D.; Minin, A.A. Vimentin intermediate filaments modulate the motility of mitochondria. Mol. Biol. Cell 2011, 22, 2282–2289. [Google Scholar] [CrossRef] [PubMed]
- Jones, J.R.; Kong, L.; Hanna, M.G.; Hoffman, B.; Krencik, R.; Bradley, R.; Hagemann, T.; Choi, J.; Doers, M.; Dubovis, M.; et al. Mutations in GFAP Disrupt the Distribution and Function of Organelles in Human Astrocytes. Cell Rep. 2018, 25, 947–958.e4. [Google Scholar] [CrossRef] [PubMed] [Green Version]


Publisher’s Note: MDPI stays neutral with regard to jurisdictional claims in published maps and institutional affiliations. |
© 2022 by the authors. Licensee MDPI, Basel, Switzerland. This article is an open access article distributed under the terms and conditions of the Creative Commons Attribution (CC BY) license (https://creativecommons.org/licenses/by/4.0/).
Share and Cite
Murtinheira, F.; Migueis, M.; Letra-Vilela, R.; Diallo, M.; Quezada, A.; Valente, C.A.; Oliva, A.; Rodriguez, C.; Martin, V.; Herrera, F. Sacsin Deletion Induces Aggregation of Glial Intermediate Filaments. Cells 2022, 11, 299. https://doi.org/10.3390/cells11020299
Murtinheira F, Migueis M, Letra-Vilela R, Diallo M, Quezada A, Valente CA, Oliva A, Rodriguez C, Martin V, Herrera F. Sacsin Deletion Induces Aggregation of Glial Intermediate Filaments. Cells. 2022; 11(2):299. https://doi.org/10.3390/cells11020299
Chicago/Turabian StyleMurtinheira, Fernanda, Mafalda Migueis, Ricardo Letra-Vilela, Mickael Diallo, Andrea Quezada, Cláudia A. Valente, Abel Oliva, Carmen Rodriguez, Vanesa Martin, and Federico Herrera. 2022. "Sacsin Deletion Induces Aggregation of Glial Intermediate Filaments" Cells 11, no. 2: 299. https://doi.org/10.3390/cells11020299