Figure 1.
Screening for low molecular weight and commercially available phloroglucinol derivatives decreasing Aβ levels. (A) Chemical structures of the phloroglucinol derivatives screened in the present study. (B) MTT reduction assay analysis after treatment of 293sw cells with different doses of the compounds for 8 h. The column color indicates the low (light gray), medium (gray), and high (black) doses of each individual compound. The concentration range for each compound was determined through 3-4 independent repeated measurement. (C) ELISA analysis of Aβ1–40 and Aβ1–42 levels in the culture medium of 293sw cells treated with the indicated doses of compounds for 8 h. Values in panels B and C are presented as means ± SEMs (n = 3). Statistical significance of the differences between treated cells and untreated controls were determined using Student’s t-test (* p < 0.05, ** p < 0.01).
Figure 2.
Examination of the potential of phloroglucinol and acetylphloroglucinols to lower Aβ levels. (A) Chemical structures of phloroglucinol and acetylphloroglucinols. (B,C) ELISA analysis of Aβ1–40 (B) and Aβ1–42 (C) levels in the culture medium of 293sw cells treated with the indicated doses of the compounds for 8 h. (D,E) LDH release (D) and MTT reduction (E) assays after treatment with the indicated doses of DAPG for 8 h. Values in panels B–E are presented as means ± SEMs (n = 3). Statistical significances of the differences between treated cells and untreated controls were determined using Student’s t-test (* p < 0.05, ** p < 0.01).
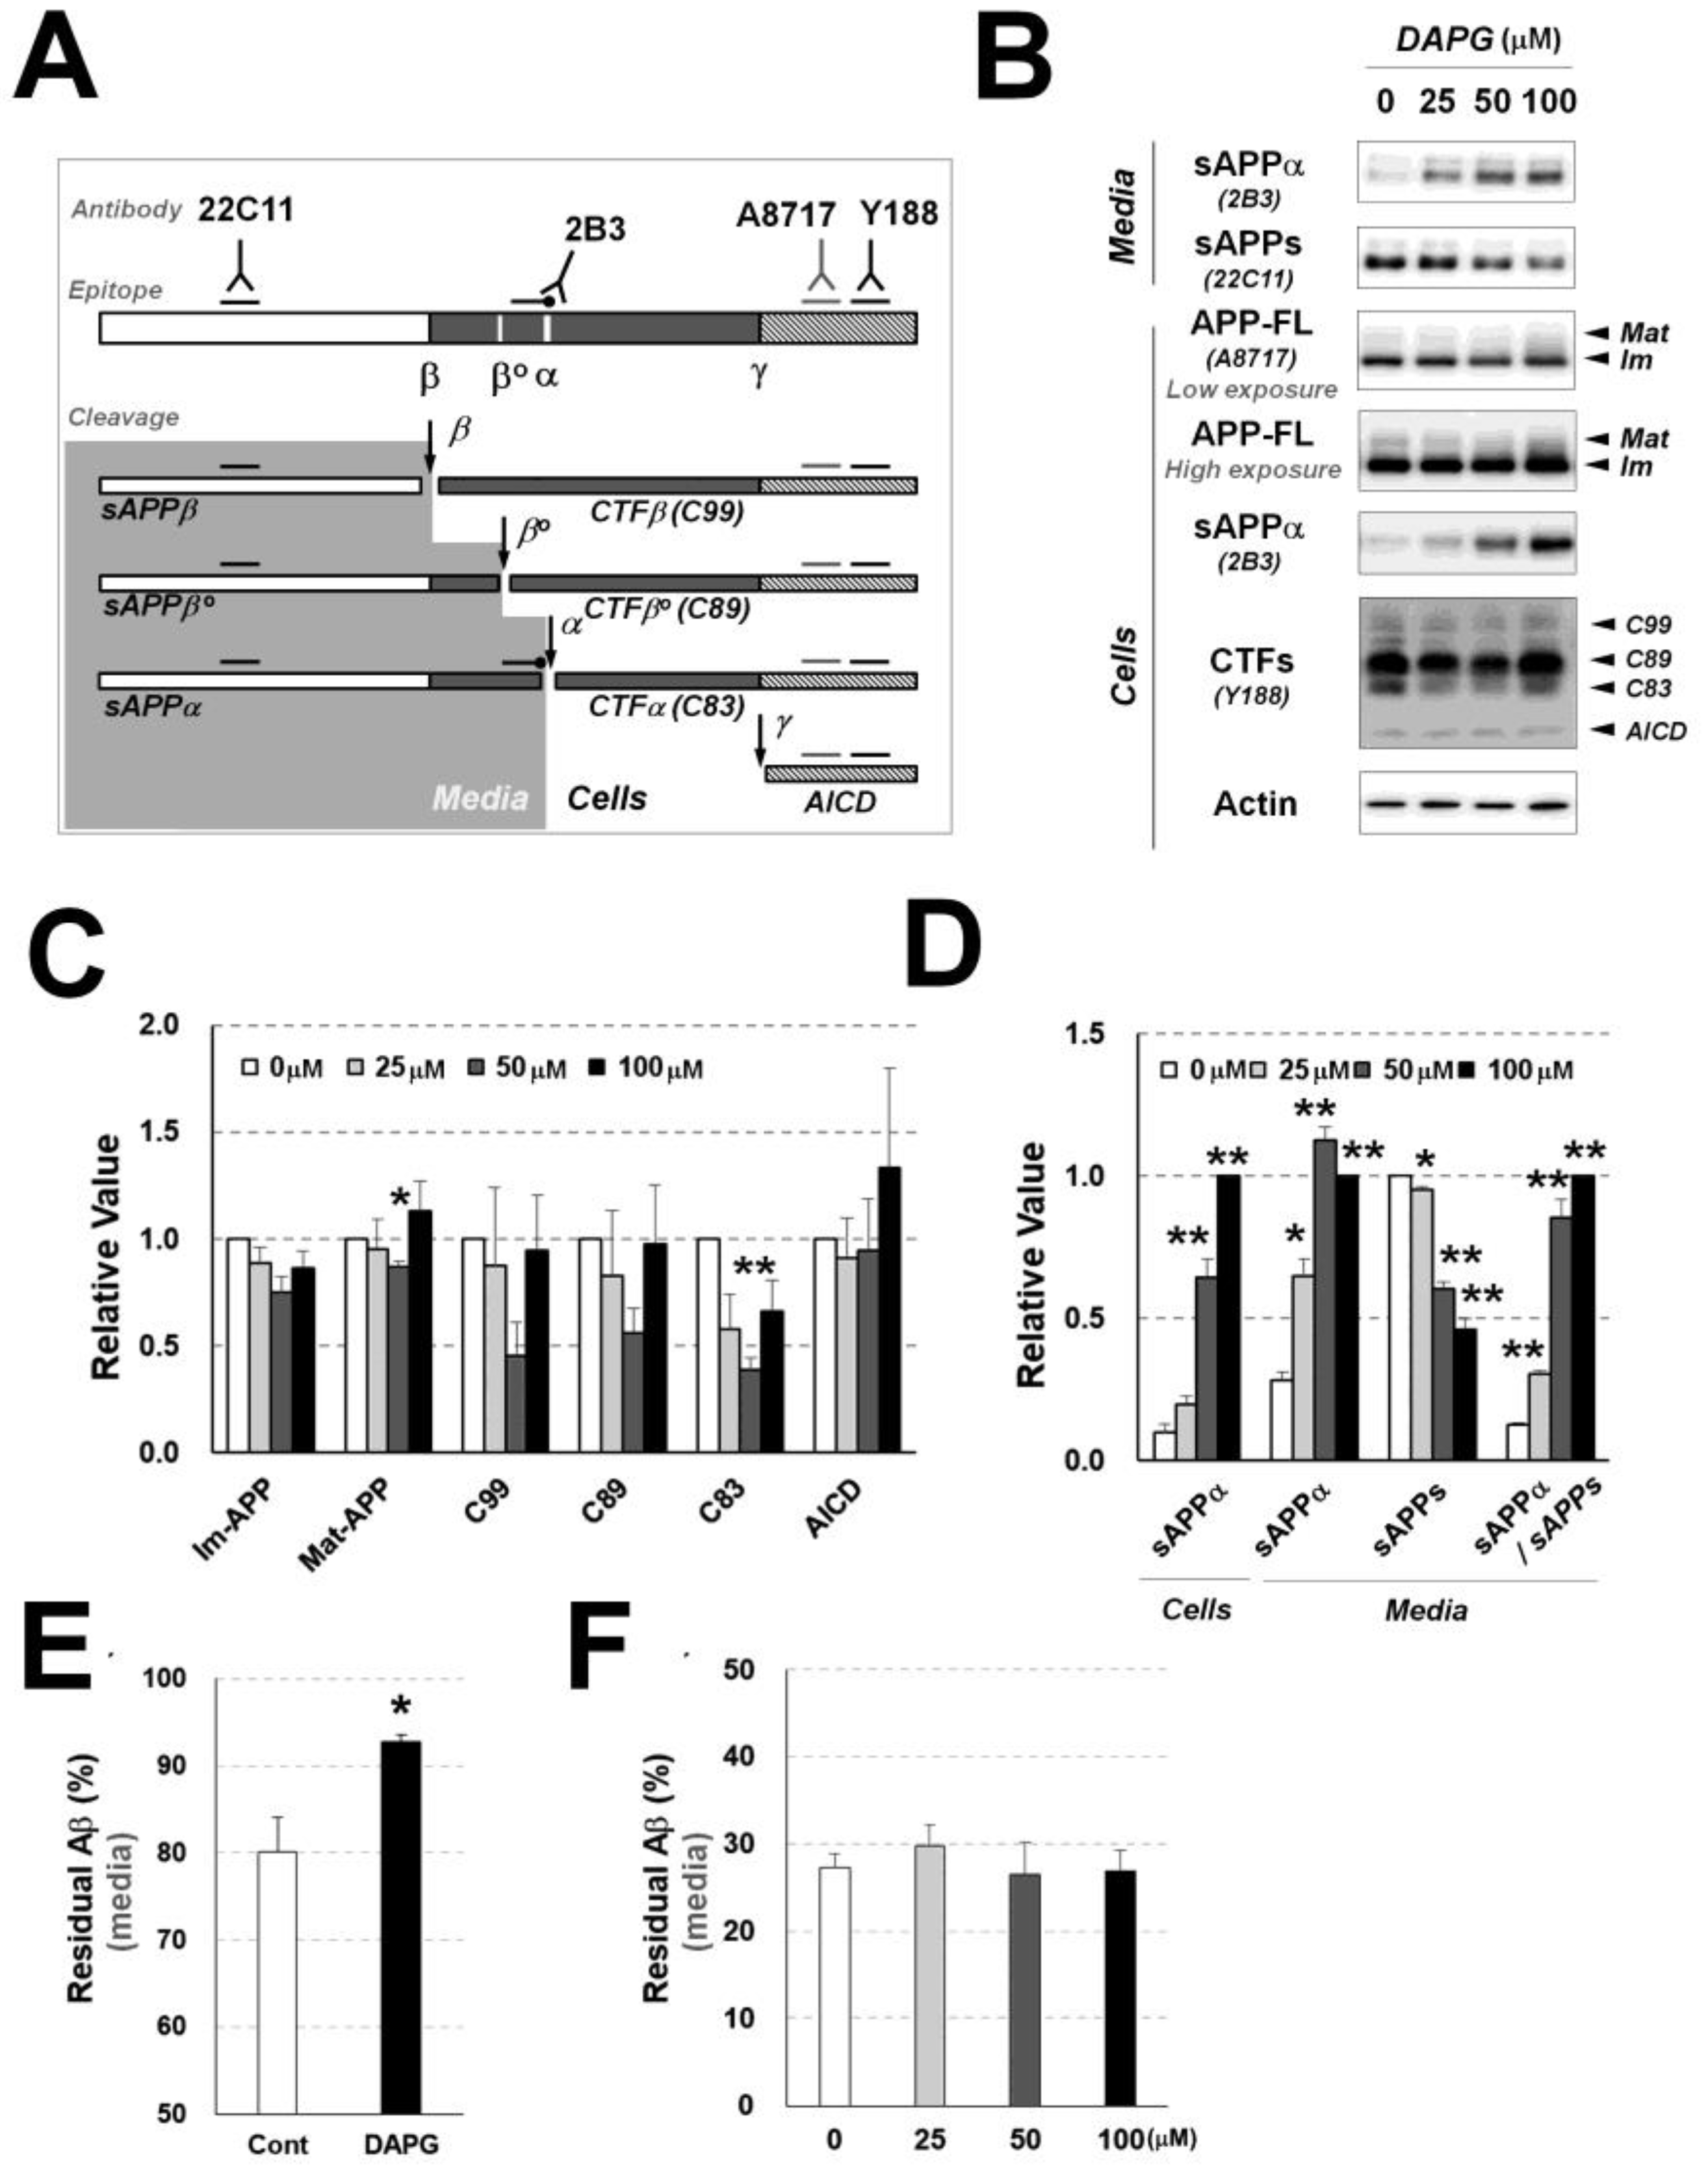
Figure 3.
Examination of DAPG-mediated regulation of Aβ production and degradation or clearance in 293sw cells. (A) Schematic illustration of APP processing and antibodies detecting the cleaved products. Full-length APP (APP-FL) can be cleaved into soluble APPα (sAPPα) and CTFα (C83) by α-secretase, soluble APPβ (APPβ) and CTFβ (C99) by β-secretase, or soluble APPβ’ (APPβ’) and CTFβ’ (C89) by β-secretase. C99 and C89 can be cleaved into APP intracellular domain (AICD) and Aβ by γ-secretase and C83 cleavage by γ-secretase produces AICD and non-toxic p3 fragment. Alternatively, non-cleaved APP-FL can be glycosylated, and the glycosylated form of APP-FL is mature form (Mat-APP) and non-glycosylated form is immature form (Im-APP). To examine APP processing by immunoblot, 22C11 and α-cleavage site specific 2B3 antibody detect sAPPs (sAPPα, sAPPβ’, and sAPPβ) and sAPPα in culture medium, respectively. In cell lysates, A8717 detects APP-FL (Mat- and Im-APP), 2B3 detects intracellular sAPPα, and Y188 detects CTFs including AICD. (B) Immunoblot analysis of APP processing in 293sw cells and culture medium after 8 h treatment with 0–100 μM DAPG. The levels of sAPPα and sAPPs in the medium and APP-FL (Mat- and Im-APP), sAPPα, CTFs (C99, C89, and C83), AICD, and actin in cells were examined. (C,D) Densitometry analysis of the immunoblot bands for the markers described in (B) in 293sw cells (C) and for sAPPα and sAPPs in the cells and culture medium (D). (E) Exogenous Aβ clearance assay on HEK293 cells. ELISA analyses of the culture medium were performed after treating wild-type HEK293 cells with 10 ng Aβ1–40 with or without DAPG for 8 h. (F) Exogenous Aβ degradation analysis of the culture medium from untreated and DAPG-treated HEK293 cells. Cell-free medium collected from HEK293 cells treated with 0–100 μM DAPG for 8 h was incubated with 1 ng Aβ1-40 at 37 °C for 8 h. Values in panels C–F are presented as means ± SEMs (n = 3). Statistical significances of the differences between treated groups and untreated controls were determined using Student’s t-test (* p < 0.05, ** p < 0.01).
![Cells 11 02585 g003]()
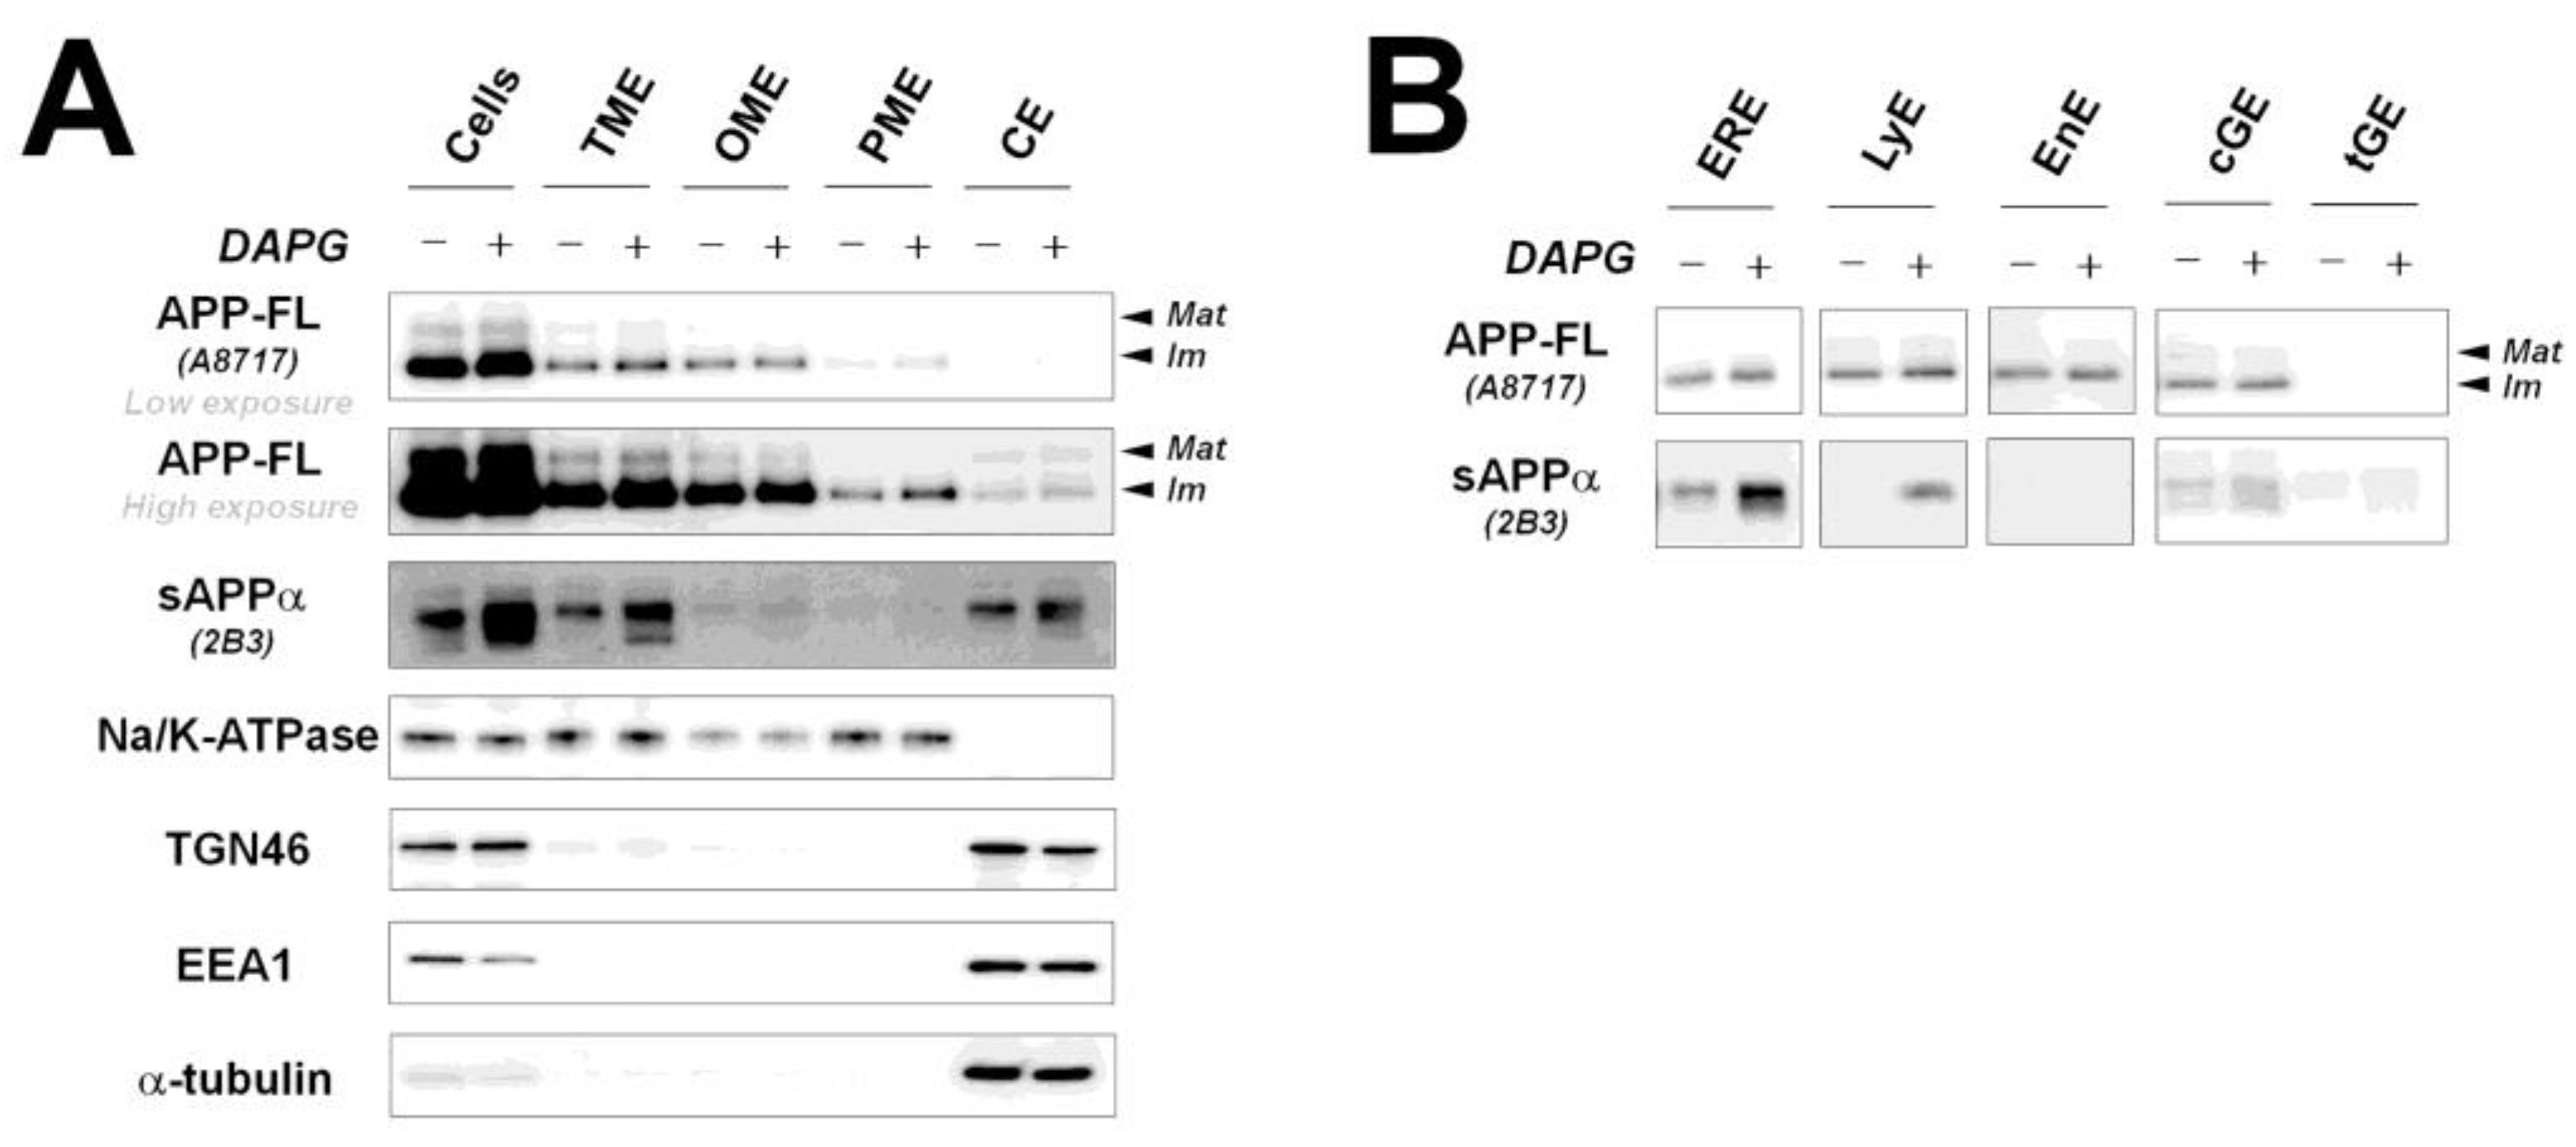
Figure 4.
Examination of APP-FL and sAPPα levels in intracellular organelles after DAPG treatment. (A) Changes of APP-FL and sAPPα levels induced by DAPG in total cell lysate (Cells, 8 μg), total membrane-enriched (TME, 4 μg), organelle membrane-enriched (OME, 2 μg), plasma membrane-enriched (PME, 2 μg), and cytosol-enriched (CE, 6 μg) fractions. Markers of intracellular organelles including the plasma membrane (Na/K-ATPase), trans-Golgi (TGN46), early endosome (EEA1), and cytosol (α-tubulin) were analyzed. (B) Changes of APP-FL and sAPPα levels induced by DAPG in the ER-enriched (ERE, 1 μg), lysosome-enriched (LyE, 1 μg), cis-Golgi-enriched (cGE, 1 μg), and trans-Golgi-enriched (tGE, 1 μg) fractions.
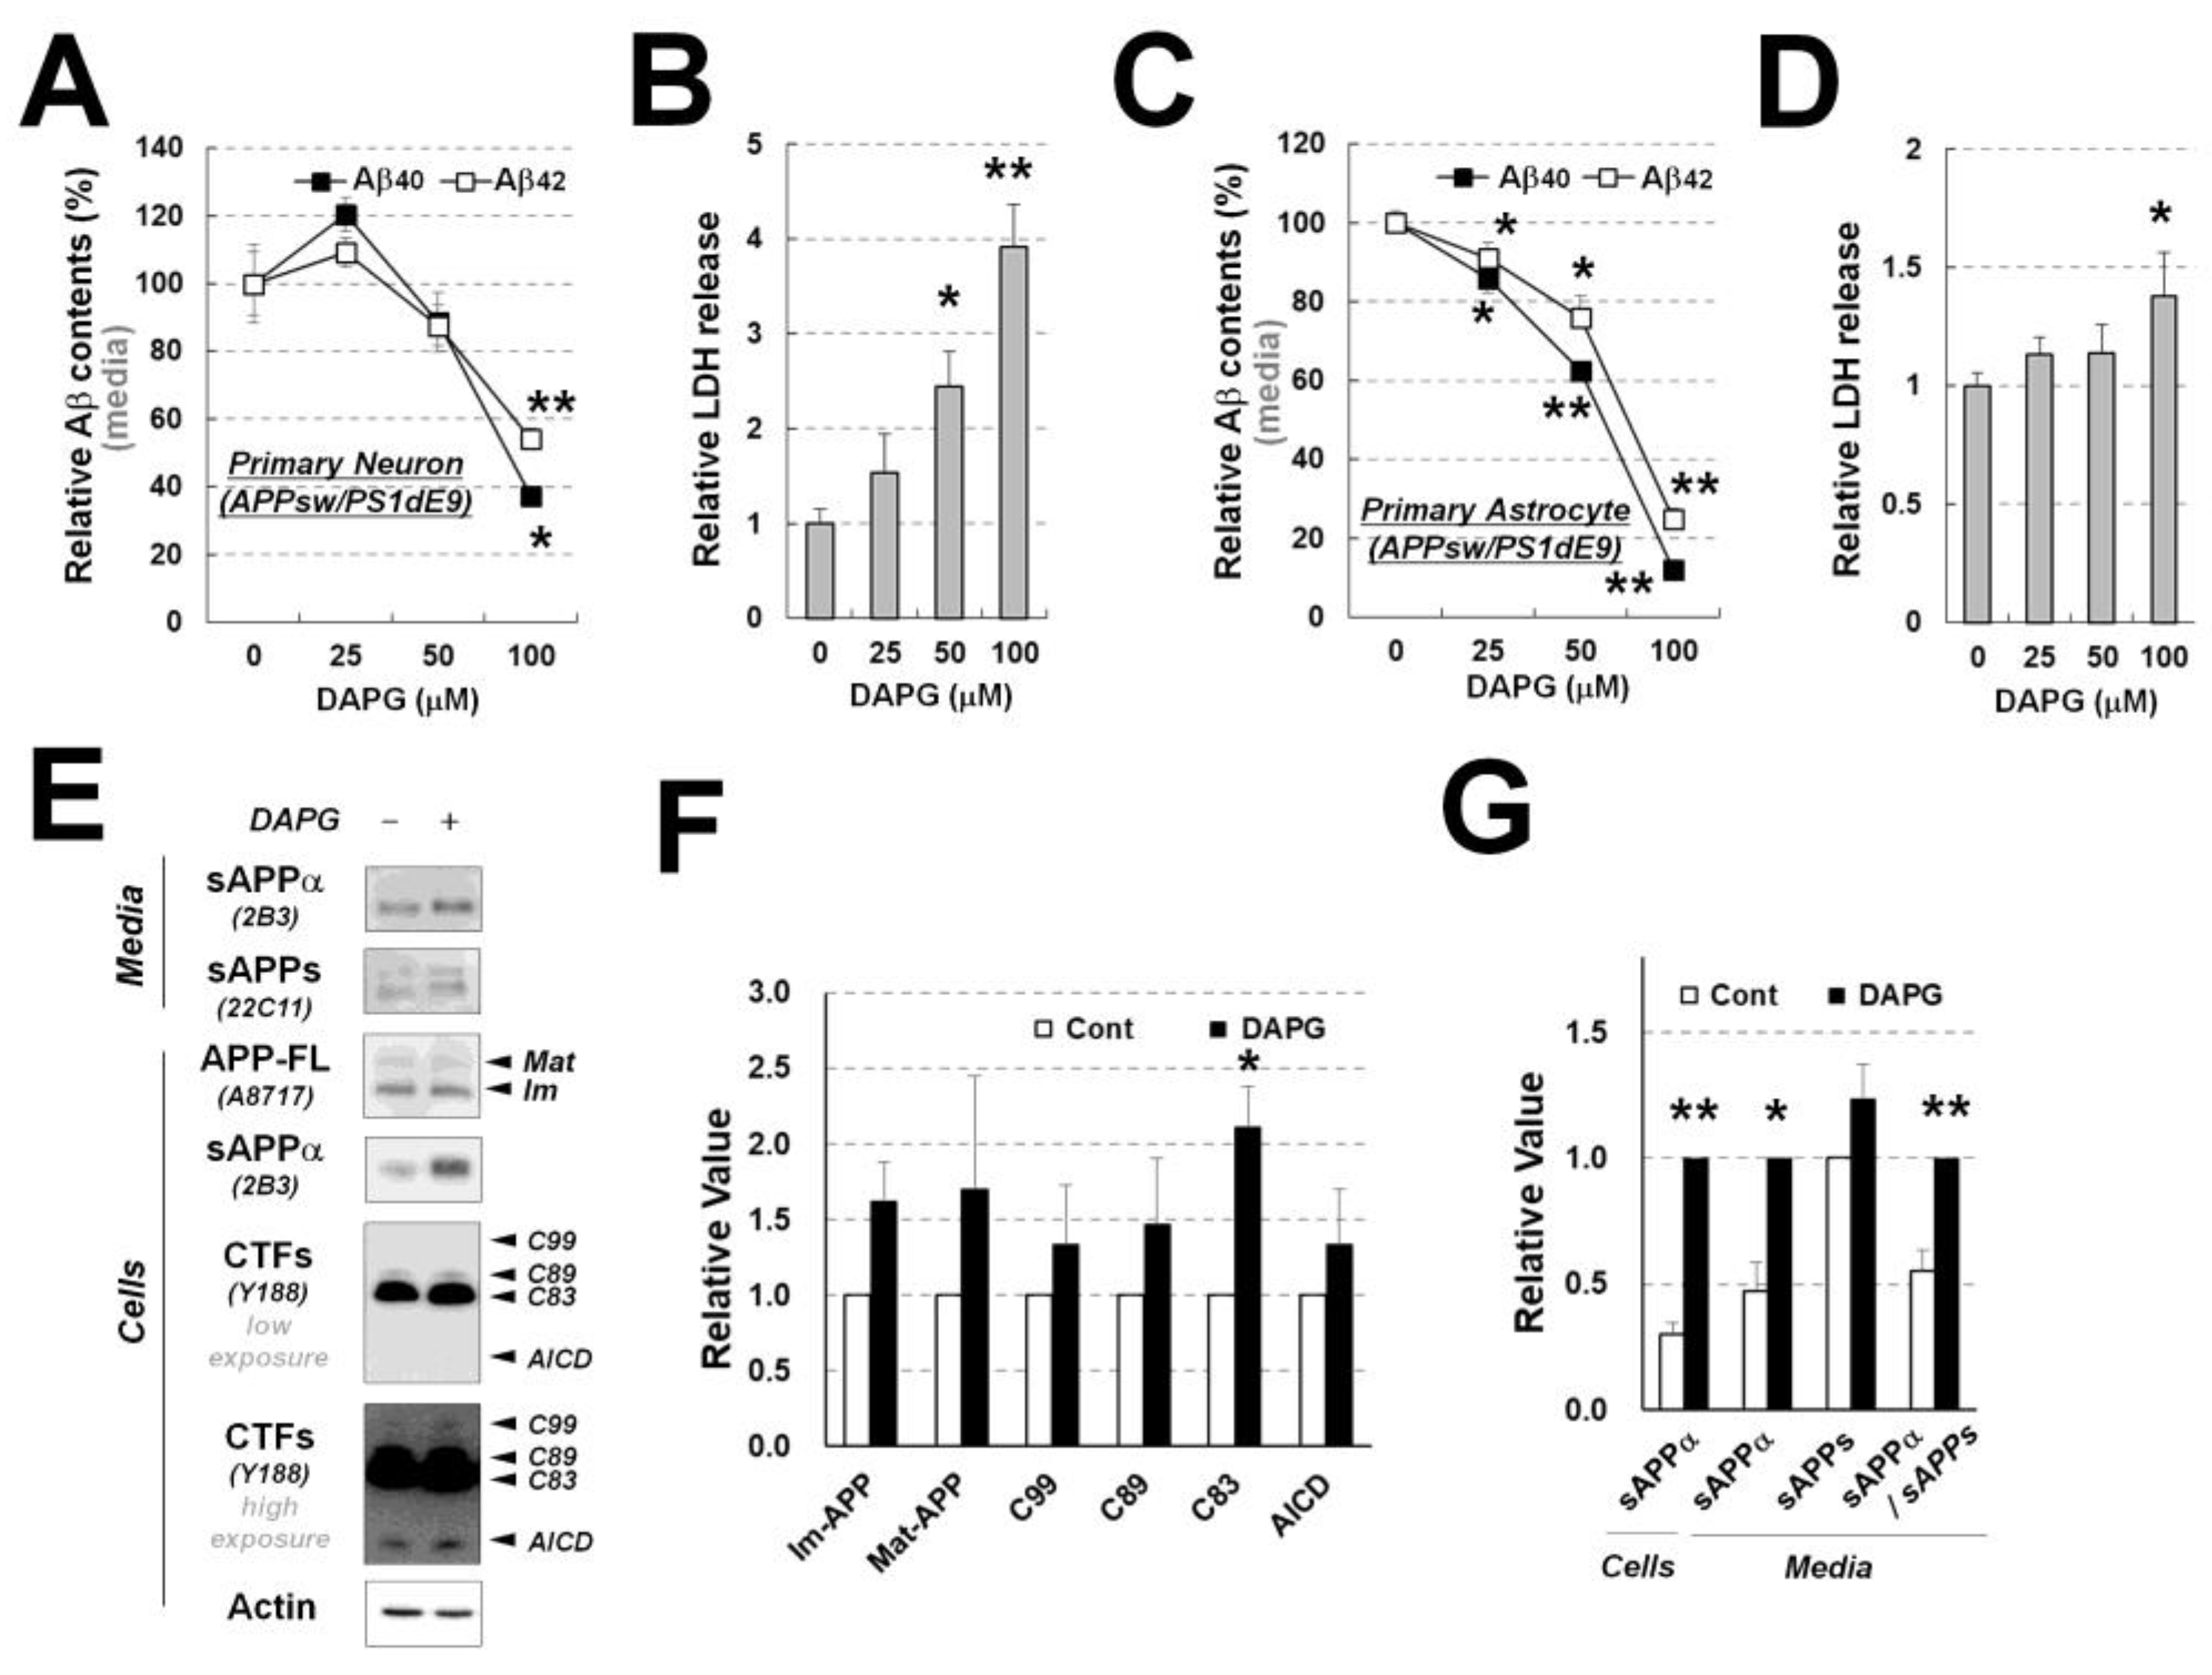
Figure 5.
Examination of DAPG-mediated decrease in Aβ levels and toxicity in primary neurons and astrocytes from APPsw/PS1dE9 transgenic mice. (A,B) ELISA analysis of Aβ1–40 and Aβ1–42 levels (A) and LDH release analysis (B) in the culture medium from primary neurons isolated from APPsw/PS1dE9 transgenic mice. Neurons were treated with 0–100 μM DAPG for 8 h. (C) ELISA analysis of Aβ1–40 and Aβ1–42 levels (C) and LDH release analysis (D) in the culture medium from primary astrocytes isolated from the transgenic mice. Astrocytes were treated with 0–100 μM DAPG for 8 h. (E) Immunoblots analysis of APP processing in primary astrocytes and culture medium after 8 h treatment with 30 μM DAPG. The levels of sAPPα and sAPPs in the medium and immature (Im) and mature (Mat) APP-FL, sAPPα, CTFs, AICD, and actin in cells were examined. (F,G) Densitometry analysis of markers in primary astrocytes (F) and sAPPs in the cells and medium (G) from immunoblots presented in (E). Values in all graphs are presented as means ± SEMs (n = 3). Statistical significances of the differences between treated groups and untreated controls were determined using Student’s t-test (* p < 0.05, ** p < 0.01).
![Cells 11 02585 g005]()
Figure 6.
Examination of DAPG effects on Aβ levels and APP processing after DAPG intrahippocampal injection. (
A) Computational prediction of blood–brain barrier permeability to DAPG using online prediction software available at
http://www.cbligand.org/BBB, accessed on 26 July 2022. (
B) Schematic illustration of DAPG intrahippocampal injection and further analyses, including immunoblot and Aβ ELISA assays, in 8-month-old APPsw/PS1dE9 transgenic mice. Detailed methods for DAPG injection and Aβ analysis are described in Materials and Methods. (
C,
D) ELISA analysis of Aβ
1–40 (
C) and Aβ
1–42 (
D) levels obtained in Triton-soluble and Triton-insoluble (or GuHCl-soluble) fractions from control and DAPG-injected hippocampi. In the graph, the values obtained for control (contralateral) and DAPG-injected (ipsilateral) hippocampi were statistically paired. Paired
t-tests were used to determine the statistical significance of the differences (n = 7) and the resultant p-values are plotted on the graph. (
D,
E) Immunoblot analysis of APP processing (
E) in control and DAPG-injected hippocampi from the transgenic mice and densitometry analysis of the immunoblots (
F). Values in (
F) are presented as means ± SEMs (n = 7). Statistical significances of difference between the injected and uninjected groups were determined using paired
t-test (*
p < 0.05).
![Cells 11 02585 g006]()
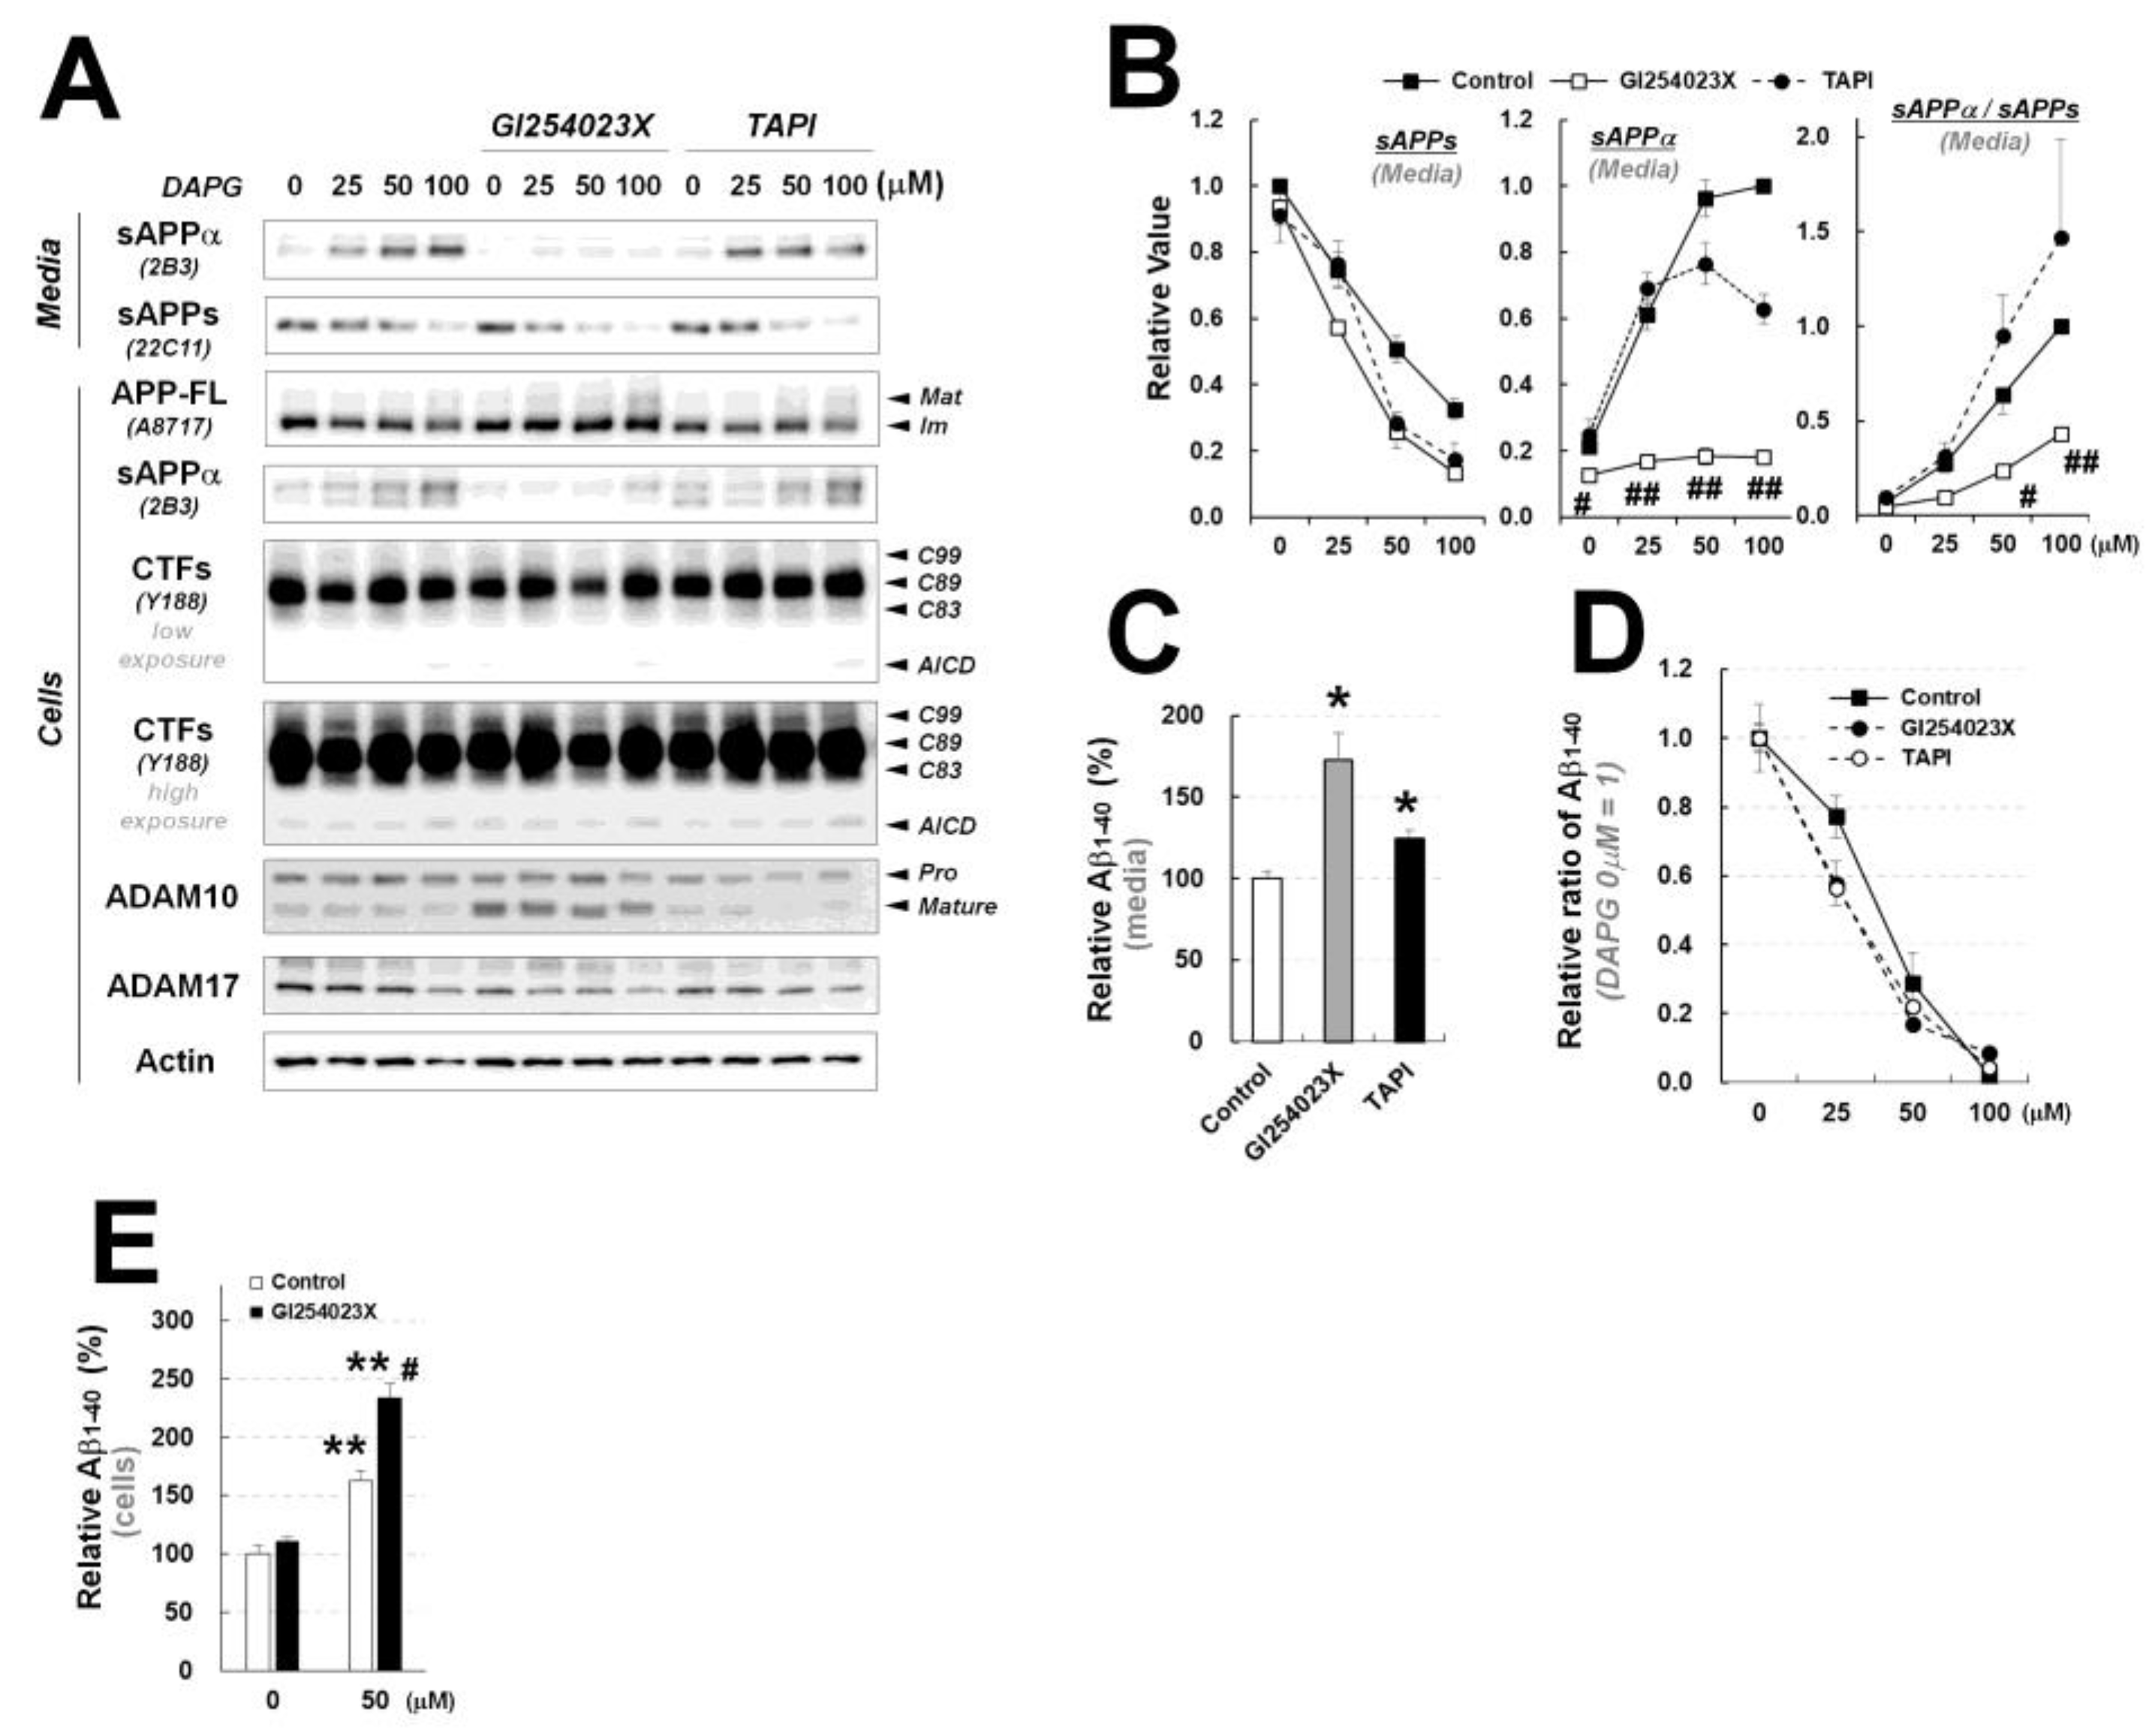
Figure 7.
Examination of the effects of ADAM10 and ADAM17 inhibitors on DAPG-mediated decrease in Aβ levels and changes in APP processing in 293sw cells. (A) Immunoblot analysis of APP processing and expression of ADAM10 and ADAM17 in 293sw cells co-treated with 0–100 μM DAPG and 10 μM GI243023X (an ADAM10 inhibitor) or 10 μM TAPI (an ADAM17 inhibitor) for 8 h. (B) Densitometry analyses of the immunoblots from (A) for sAPPα and sAPPs levels in the culture medium and the ratio of sAPPα to sAPPs levels. Values are presented as means ± SEMs (n = 3). Statistical significances of the differences between DAPG-treated group and both DAPG- and GI254023X-treated group (# p < 0.05, ## p < 0.01) were determined using one-way ANOVA followed by Tukey’s test. (C) ELISA analysis of Aβ1–40 levels in the medium of 293sw cells treated with GI254023X or TAPI for 8 h. Values are presented as means ± SEMs (n = 3). Statistical significances of the differences between treated groups and untreated controls were determined using Student’s t-test (* p < 0.05). (D) Relative ratio of Aβ1–40 in the medium of 293sw cells compared with DAPG-untreated group determined by ELISA analysis after treatment with 0–100 μM DAPG with or without GI254023X and TAPI for 8 h. (E) ELISA analysis of intracellular Aβ1–40 levels after treatment of 293sw cells with 50 μM DAPG in presence or absence of GI254023X for 8 h. Values are presented as means ± SEMs (n = 3). Statistical significances of the differences between DAPG-untreated group and DAPG-treated group (** p < 0.01) or between DAPG-treated group and both DAPG- and GI254023X-treated group (# p < 0.05) were determined using one-way ANOVA followed by Tukey’s test.
![Cells 11 02585 g007]()
Figure 8.
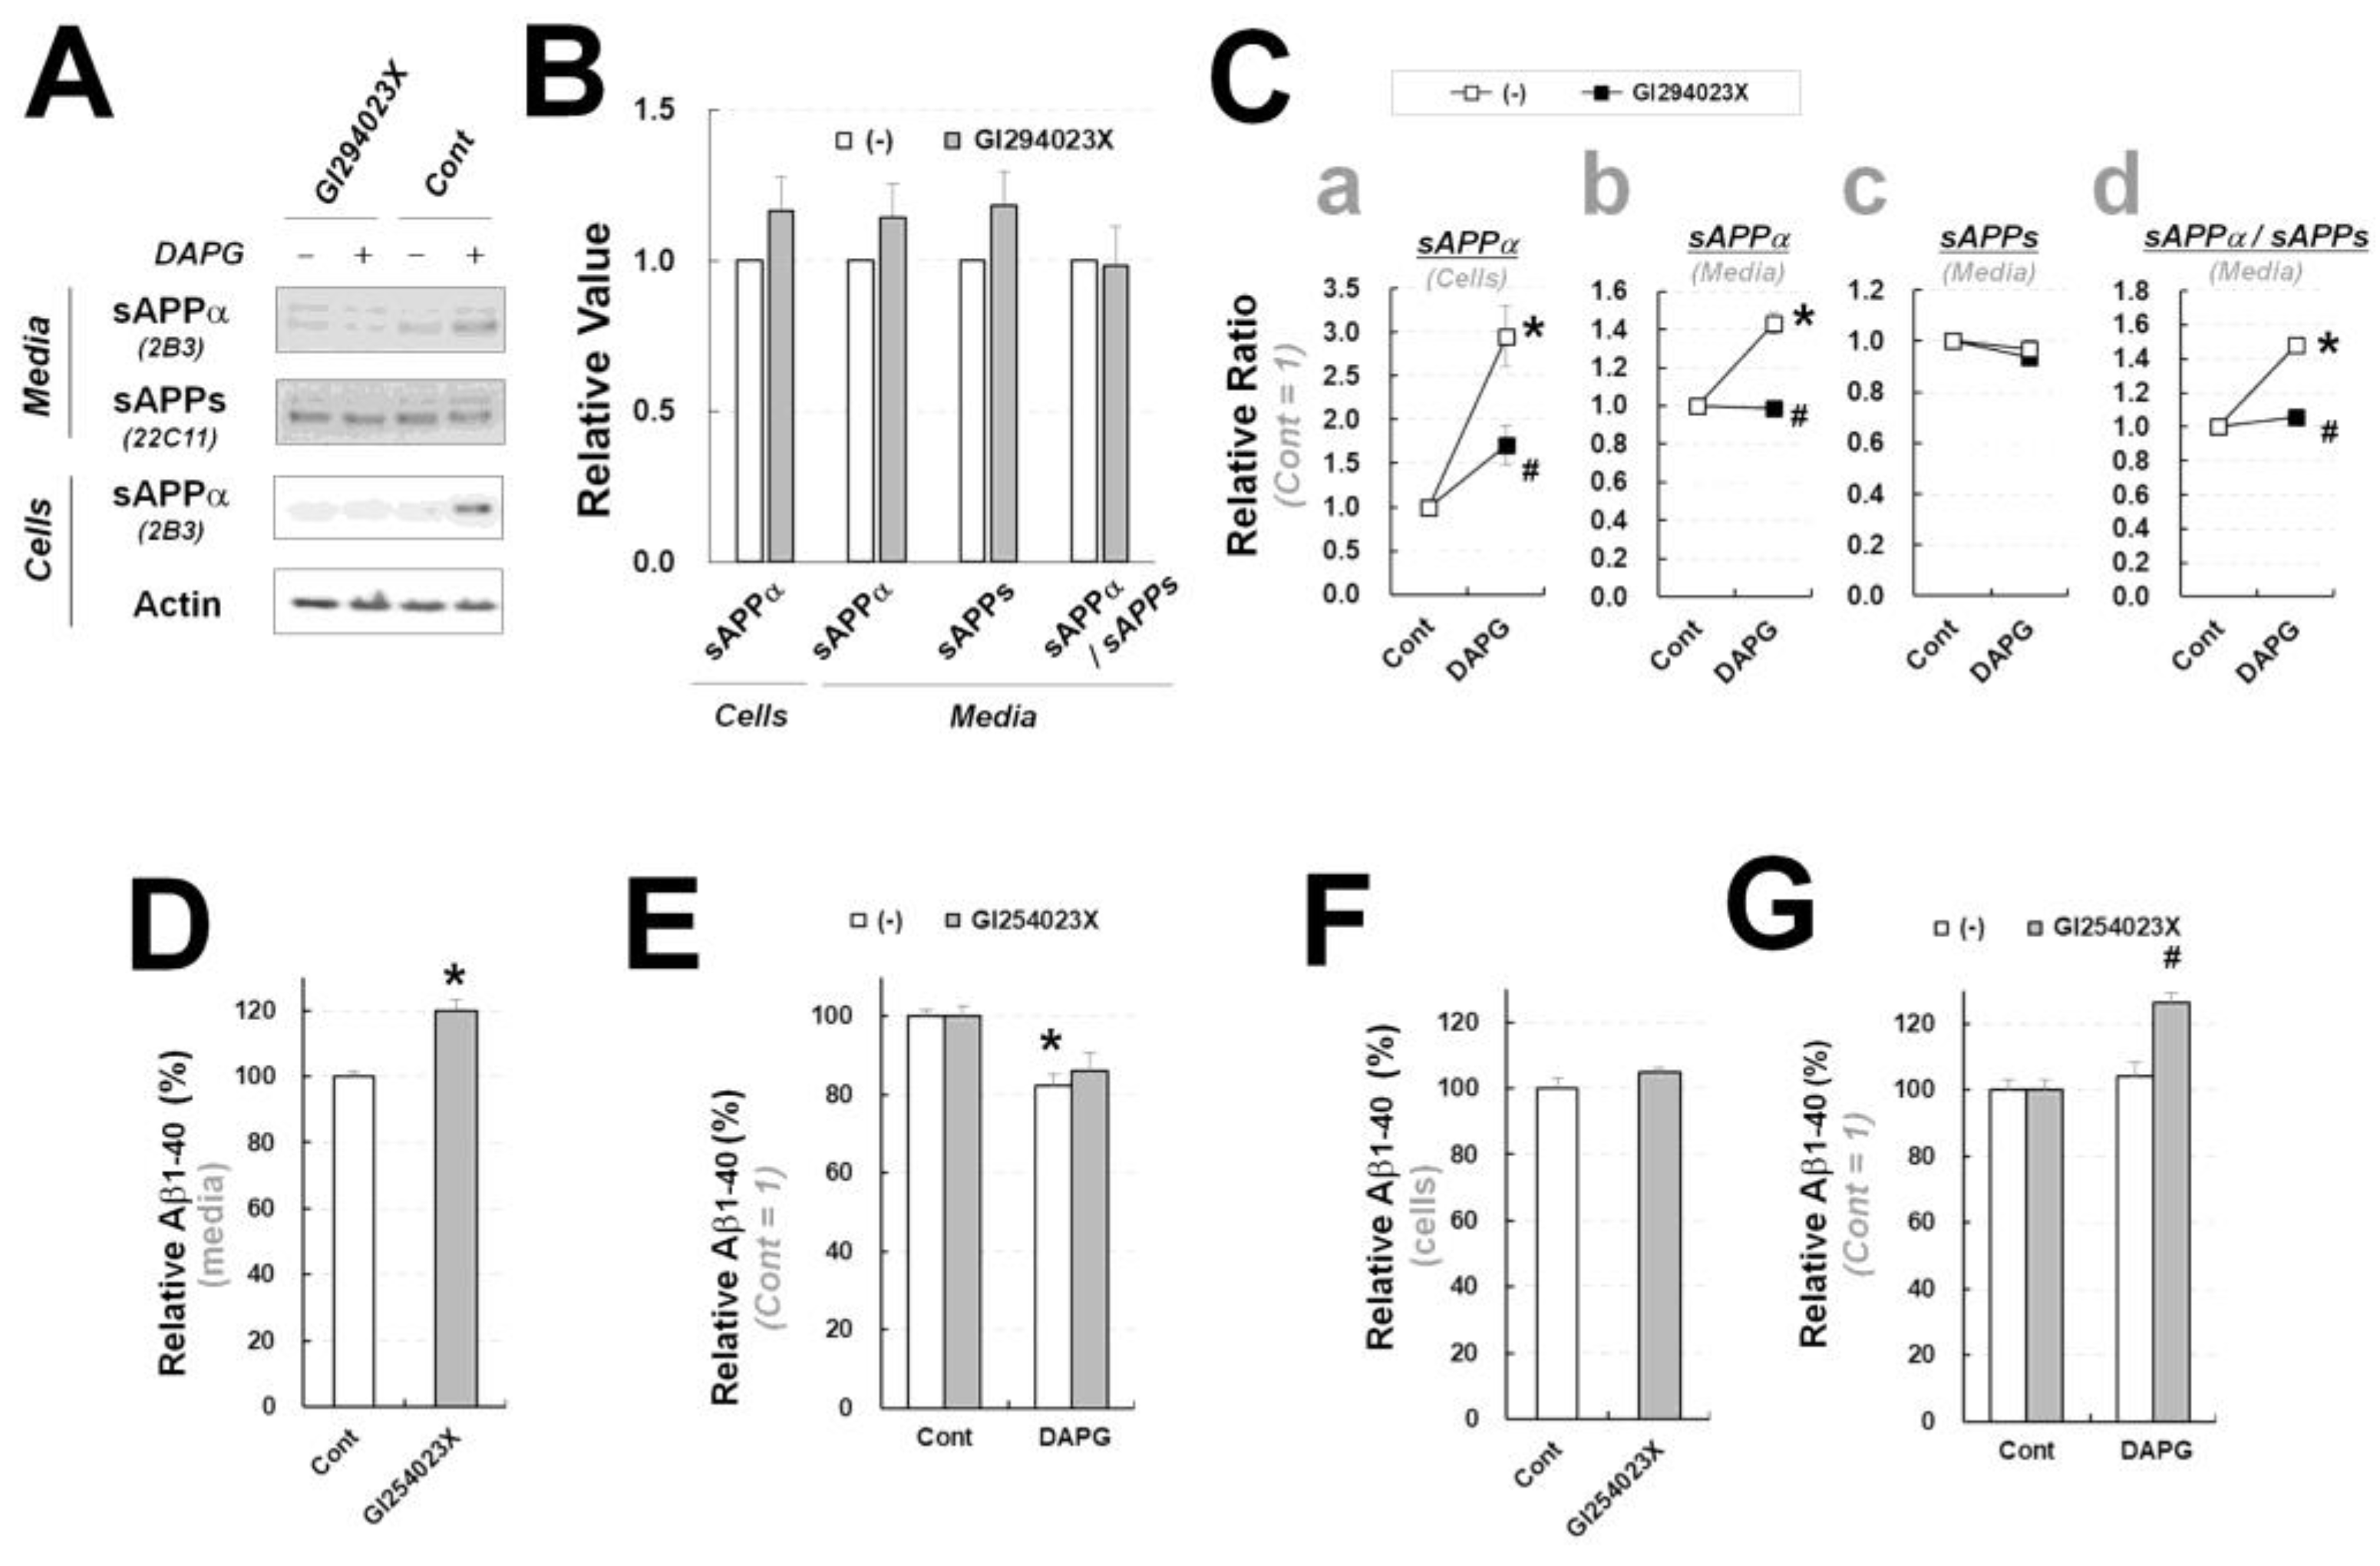
Examination of ADAM10 inhibitor effects on DAPG-mediated decrease in Aβ and increase in sAPPα levels in primary astrocytes from APPsw/PS1dE9 transgenic mice. (A) Immunoblot analysis of sAPPα and sAPPs levels in primary astrocytes treated with 10 μM GI243023X (ADAM10 inhibitor) and 30 μM DAPG for 8 h. (B,C) Densitometry analysis of sAPPα and sAPPs levels in the medium or cells from the immunoblots presented in (A). Panel B shows the effects of GI294023X alone. Panel C shows the relative ratio between controls and cells treated with DAPG or DAPG and GI294023X. The values of sAPPα levels in cells (a) and the medium (b), sAPPs levels in the medium (c), and the ratio of sAPPα to sAPPs levels in the medium (d) are represented. (D) ELISA analysis of Aβ1–40 amounts in the culture medium from primary astrocytes treated with GI294023X for 8 h. (E) Relative Aβ1–40 content in the culture medium from primary astrocytes treated with 30 μM DAPG with or without 10 μM GI294023X for 8 h measured by ELISA (F,G) ELISA analysis of intracellular Aβ1–40 levels in primary astrocytes treated with GI294023X alone (F) or GI294023X with DAPG (G). Statistical significances of differences between treated groups and untreated controls were determined using Student’s t-test in panels D and E (* p < 0.05). In panels C and G, differences between untreated and DAPG-treated groups (* p < 0.05) or between DAPG-treated and both DAPG- and GI254023X-treated group (# p < 0.05) were analyzed using one-way ANOVA followed by Tukey’s test.
Figure 8.
Examination of ADAM10 inhibitor effects on DAPG-mediated decrease in Aβ and increase in sAPPα levels in primary astrocytes from APPsw/PS1dE9 transgenic mice. (A) Immunoblot analysis of sAPPα and sAPPs levels in primary astrocytes treated with 10 μM GI243023X (ADAM10 inhibitor) and 30 μM DAPG for 8 h. (B,C) Densitometry analysis of sAPPα and sAPPs levels in the medium or cells from the immunoblots presented in (A). Panel B shows the effects of GI294023X alone. Panel C shows the relative ratio between controls and cells treated with DAPG or DAPG and GI294023X. The values of sAPPα levels in cells (a) and the medium (b), sAPPs levels in the medium (c), and the ratio of sAPPα to sAPPs levels in the medium (d) are represented. (D) ELISA analysis of Aβ1–40 amounts in the culture medium from primary astrocytes treated with GI294023X for 8 h. (E) Relative Aβ1–40 content in the culture medium from primary astrocytes treated with 30 μM DAPG with or without 10 μM GI294023X for 8 h measured by ELISA (F,G) ELISA analysis of intracellular Aβ1–40 levels in primary astrocytes treated with GI294023X alone (F) or GI294023X with DAPG (G). Statistical significances of differences between treated groups and untreated controls were determined using Student’s t-test in panels D and E (* p < 0.05). In panels C and G, differences between untreated and DAPG-treated groups (* p < 0.05) or between DAPG-treated and both DAPG- and GI254023X-treated group (# p < 0.05) were analyzed using one-way ANOVA followed by Tukey’s test.
![Cells 11 02585 g008]()
Figure 9.
Examination of GCA and BFA effects in 293sw cells on DAPG-mediated Aβ levels decrease and sAPPα levels increase. (A) ELISA analysis of Aβ1–40 amounts in the culture medium of 293sw cells treated with 3.5 μM GCA or 60 ng/mL BFA for 8 h. (B) Relative Aβ1–40 content in the culture medium of 293sw cells treated with 50 μM DAPG with or without 3.5 μM GCA or 60 ng/mL BFA for 8 h analyzed by ELISA. (C) Immunoblot analysis of sAPPα and sAPPs levels in 293sw cells treated with DAPG and GCA or BFA for 8 h. (D,E) Densitometry analysis of sAPPα and sAPPs levels in the medium or cells from immunoblots presented in (C). Panel D represents the effects of GCA or BFA alone. Panel E shows the relative ratio between controls and cells treated with DAPG alone (untreated) or with DAPG and GCA or BFA. The values of sAPPα levels in cells (a) and the medium (b) and sAPPs levels in the medium (c) as well as the ratios of sAPPα to sAPPs levels in the medium (d) and of sAPPα levels in cells to the levels in the medium (e) are presented. (F,G) ELISA analysis of intracellular Aβ1–40 levels in 293sw cells treated with GCA or BFA (F) or DAPG and GCA or BFA (G). (H) Ratios of Aβ1–40 levels in cells treated with DAPG and GCA or BFA (Ic Aβ) to the levels in their culture medium (Ec Aβ). All values in graphs are presented as means ± SEMs (n = 3). Statistical significances of differences between untreated and DAPG-treated groups (* p < 0.05, ** p < 0.01) or between DAPG–treated and DAPG- and GCA- or BFA-treated groups (# p < 0.05, ## p < 0.01) were analyzed. In panels (A,D,F), Student’s t-test was used (* p < 0.05, ** p < 0.01), whereas one-way ANOVA followed by Tukey’s test was performed in panels (B,E,G,H).
![Cells 11 02585 g009]()
Figure 10.
Examination of GCA and BFA effects on DAPG-mediated Aβ level decrease and sAPPα level increase in primary astrocytes from APPsw/PS1dE9 transgenic mice. (A) ELISA analysis of Aβ1–40 levels in the culture medium of primary astrocytes treated with 3.5 μM GCA or 60 ng/mL BFA for 8 h. (B) Relative Aβ1–40 content in the medium of primary astrocytes treated with 30 μM DAPG in the presence or absence of 3.5 μM GCA or 60 ng/mL BFA for 8 h obtained by ELISA analysis. (C) Immunoblot analysis of sAPPα and sAPPs levels in the primary astrocytes treated with DAPG and GCA or BFA for 8 h. (D,E) Densitometry analysis of sAPPα and sAPPs levels in the medium or cells from immunoblots presented in (C). Panel D shows the effects of GCA or BFA alone (D). Panel E shows the ratio between controls and cells treated with DAPG (untreated) or DAPG and GCA or BFA (E). The levels of sAPPα in cells (a) and the medium (b) and sAPPs in the medium (c) as well as the ratios of sAPPα to sAPPs levels in the medium (d), and of sAPPα levels in cells to those in the medium (e) are shown. (F,G) ELISA analysis of intracellular Aβ1–40 levels in primary astrocytes treated with GCA or BFA (F) and of relative Aβ1–40 content after DAPG and GCA or BFA co-treatment (G). (H) Ratios of Aβ1–40 levels in cells (Ic Aβ) to those in the medium (Ec Aβ) after DAPG and GCA or BFA co-treatment. Statistical significances of differences between treated and untreated groups in panels A, D, and F were determined using Student’s t-test (* p < 0.05, ** p < 0.01). In panels B, E, G, and H, statistical significances of differences between untreated and DAPG-treated groups (* p < 0.05) and between DAPG-treated and DAPG- and GCA- or BFA-treated groups (# p < 0.05, ## p < 0.01) were determined using one-way ANOVA followed by Tukey’s test.
![Cells 11 02585 g010]()
Figure 11.
Schematic illustration of the mechanisms activated by DAPG to decrease Aβ levels and increase sAPPα levels in 293sw cells and primary astrocytes from APPsw/PS1dE9 transgenic mice. (A) APP processing pathways leading to Aβ and sAPPα production and secretion. (B) Effects of DAPG on Aβ and sAPPα production and secretion in 293sw cells and impact of the trafficking inhibitors BFA and ZCL-278. (C) DAPG effects on Aβ and sAPPα production and secretion in primary astrocytes from APPsw/PS1dE9 transgenic mice and impact of the trafficking inhibitors GCA and BFA.
Table 1.
Permeability prediction of phloroglucinol derivatives using LogP (distribution coefficient P) value. Values mean lipid bilayer permeability (0 < LogP < 3, optimal; LogP < 0, poor lipid bilayer permeability; LogP > 3, poor aqueous solubility).
Table 1.
Permeability prediction of phloroglucinol derivatives using LogP (distribution coefficient P) value. Values mean lipid bilayer permeability (0 < LogP < 3, optimal; LogP < 0, poor lipid bilayer permeability; LogP > 3, poor aqueous solubility).
| Compound | LogP Value | Meaning |
|---|
| Phloroglucinol | 0.803 | Optimal |
| 1,3,5-trimethylbenzene | 2.612 | Optimal |
| Scyllo-inositol | −3.835 | Poor lipid bilayer permeability |
| Flopropione | 1.396 | Optimal |
| 2,4,6-Trihydroxybenzaldehyde | 0.616 | Optimal |
| Maclurin | 1.446 | Optimal |
| Phloroacetophenone | 1.006 | Optimal |
| 2,4-diacetylphloroglucinol | 1.209 | Optimal |
| 2,4,6-triacetylphloroglucinol | 1.411 | Optimal |
| Phloroglucinol triacetate | 1.462 | Optimal |
| 2,4,6-trihydroxybenzoic acid | 0.502 | Optimal |
| Phloretin | 2.325 | Optimal |
Table 2.
Summary of changes in Aβ parameters by GI293023X, BFA, or GCA alone and co-treatment with DAPG. Changes are shown compared to untreated cells (untreated) and DAPG-treated cells (DAPG-treated), respectively (Ic, intracellular; Ec, extracellular; n.d., not determined).
Table 2.
Summary of changes in Aβ parameters by GI293023X, BFA, or GCA alone and co-treatment with DAPG. Changes are shown compared to untreated cells (untreated) and DAPG-treated cells (DAPG-treated), respectively (Ic, intracellular; Ec, extracellular; n.d., not determined).
| Compound | Inhibitory
Target | Comparison
Target | Molecular Actions |
|---|
| Secreted Aβ | Intracellular Aβ | Ratio of
Ic Aβ per Ec Aβ |
|---|
| 293sw | Primary
Astrocytes | 293sw | Primary
Astrocytes | 293sw | Primary
Astrocytes |
|---|
| GI294023X | ADAM10 | Untreated | ↑ | ↑ | − | − | n.d. | n.d. |
| DAPG-treated | − | − | ↑ | ↑ | n.d. | n.d. |
| BFA | GBF1/BIG1/BIG2 | Untreated | ↓ | ↓ | ↓ | − | n.d. | n.d. |
| DAPG-treated | ↑ | ↑ | ↑ | ↑ | ↓ | ↓ |
| GCA | GBF1 | Untreated | ↓ | ↓ | ↓ | ↓ | n.d. | n.d. |
| DAPG-treated | − | ↑ | − | − | − | ↓ |
Table 3.
Summary of changes in sAPPs parameters by GI293023X, BFA, or GCA alone and co-treatment with DAPG. Changes are shown compared to untreated cells (untreated) and DAPG-treated cells (DAPG-treated), respectively (Ic, intracellular; Ec, extracellular; n.d., not determined).
Table 3.
Summary of changes in sAPPs parameters by GI293023X, BFA, or GCA alone and co-treatment with DAPG. Changes are shown compared to untreated cells (untreated) and DAPG-treated cells (DAPG-treated), respectively (Ic, intracellular; Ec, extracellular; n.d., not determined).
| Compound | Inhibitory
Target | Comparison
Target | Molecular Actions |
|---|
| sAPPα (Cells) | sAPPα (Media) | sAPPs (Media) | sAPPα/sAPPs
(Media) | Ratio of
Ic sAPPα/Ec sAPPα |
|---|
| 293sw | Primary
Astrocytes | 293sw | Primary
Astrocytes | 293sw | Primary
Astrocytes | 293sw | Primary
Astrocytes | 293sw | Primary
Astrocytes |
|---|
| GI294023X | ADAM10 | Untreated | − | ↓ | − | − | − | − | ↓ | − | n.d. | n.d. |
| DAPG-treated | ↓ | ↓ | ↓ | ↓ | − | − | ↓ | ↓ | n.d. | n.d. |
| BFA | GBF1/BIG1/BIG2 | Untreated | − | ↑ | ↓ | ↑ | ↓ | ↓ | − | ↑ | n.d. | n.d. |
| DAPG-treated | − | ↓ | ↑ | ↓ | ↑ | − | − | ↓ | ↓ | ↓ |
| GCA | GBF1 | Untreated | − | − | − | ↓ | ↓ | ↓ | − | ↑ | n.d. | n.d. |
| DAPG-treated | − | ↓ | − | − | − | − | − | ↓ | ↓ | ↓ |


 ,
, 


