
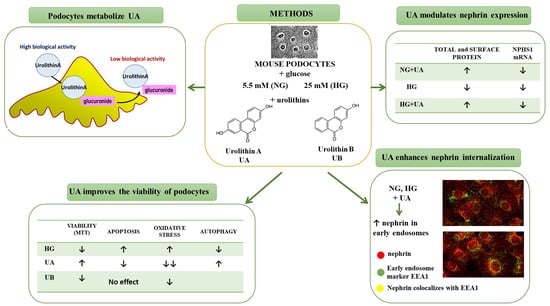
Urolithins Modulate the Viability, Autophagy, Apoptosis, and Nephrin Turnover in Podocytes Exposed to High Glucose

 , , and
Abstract
:
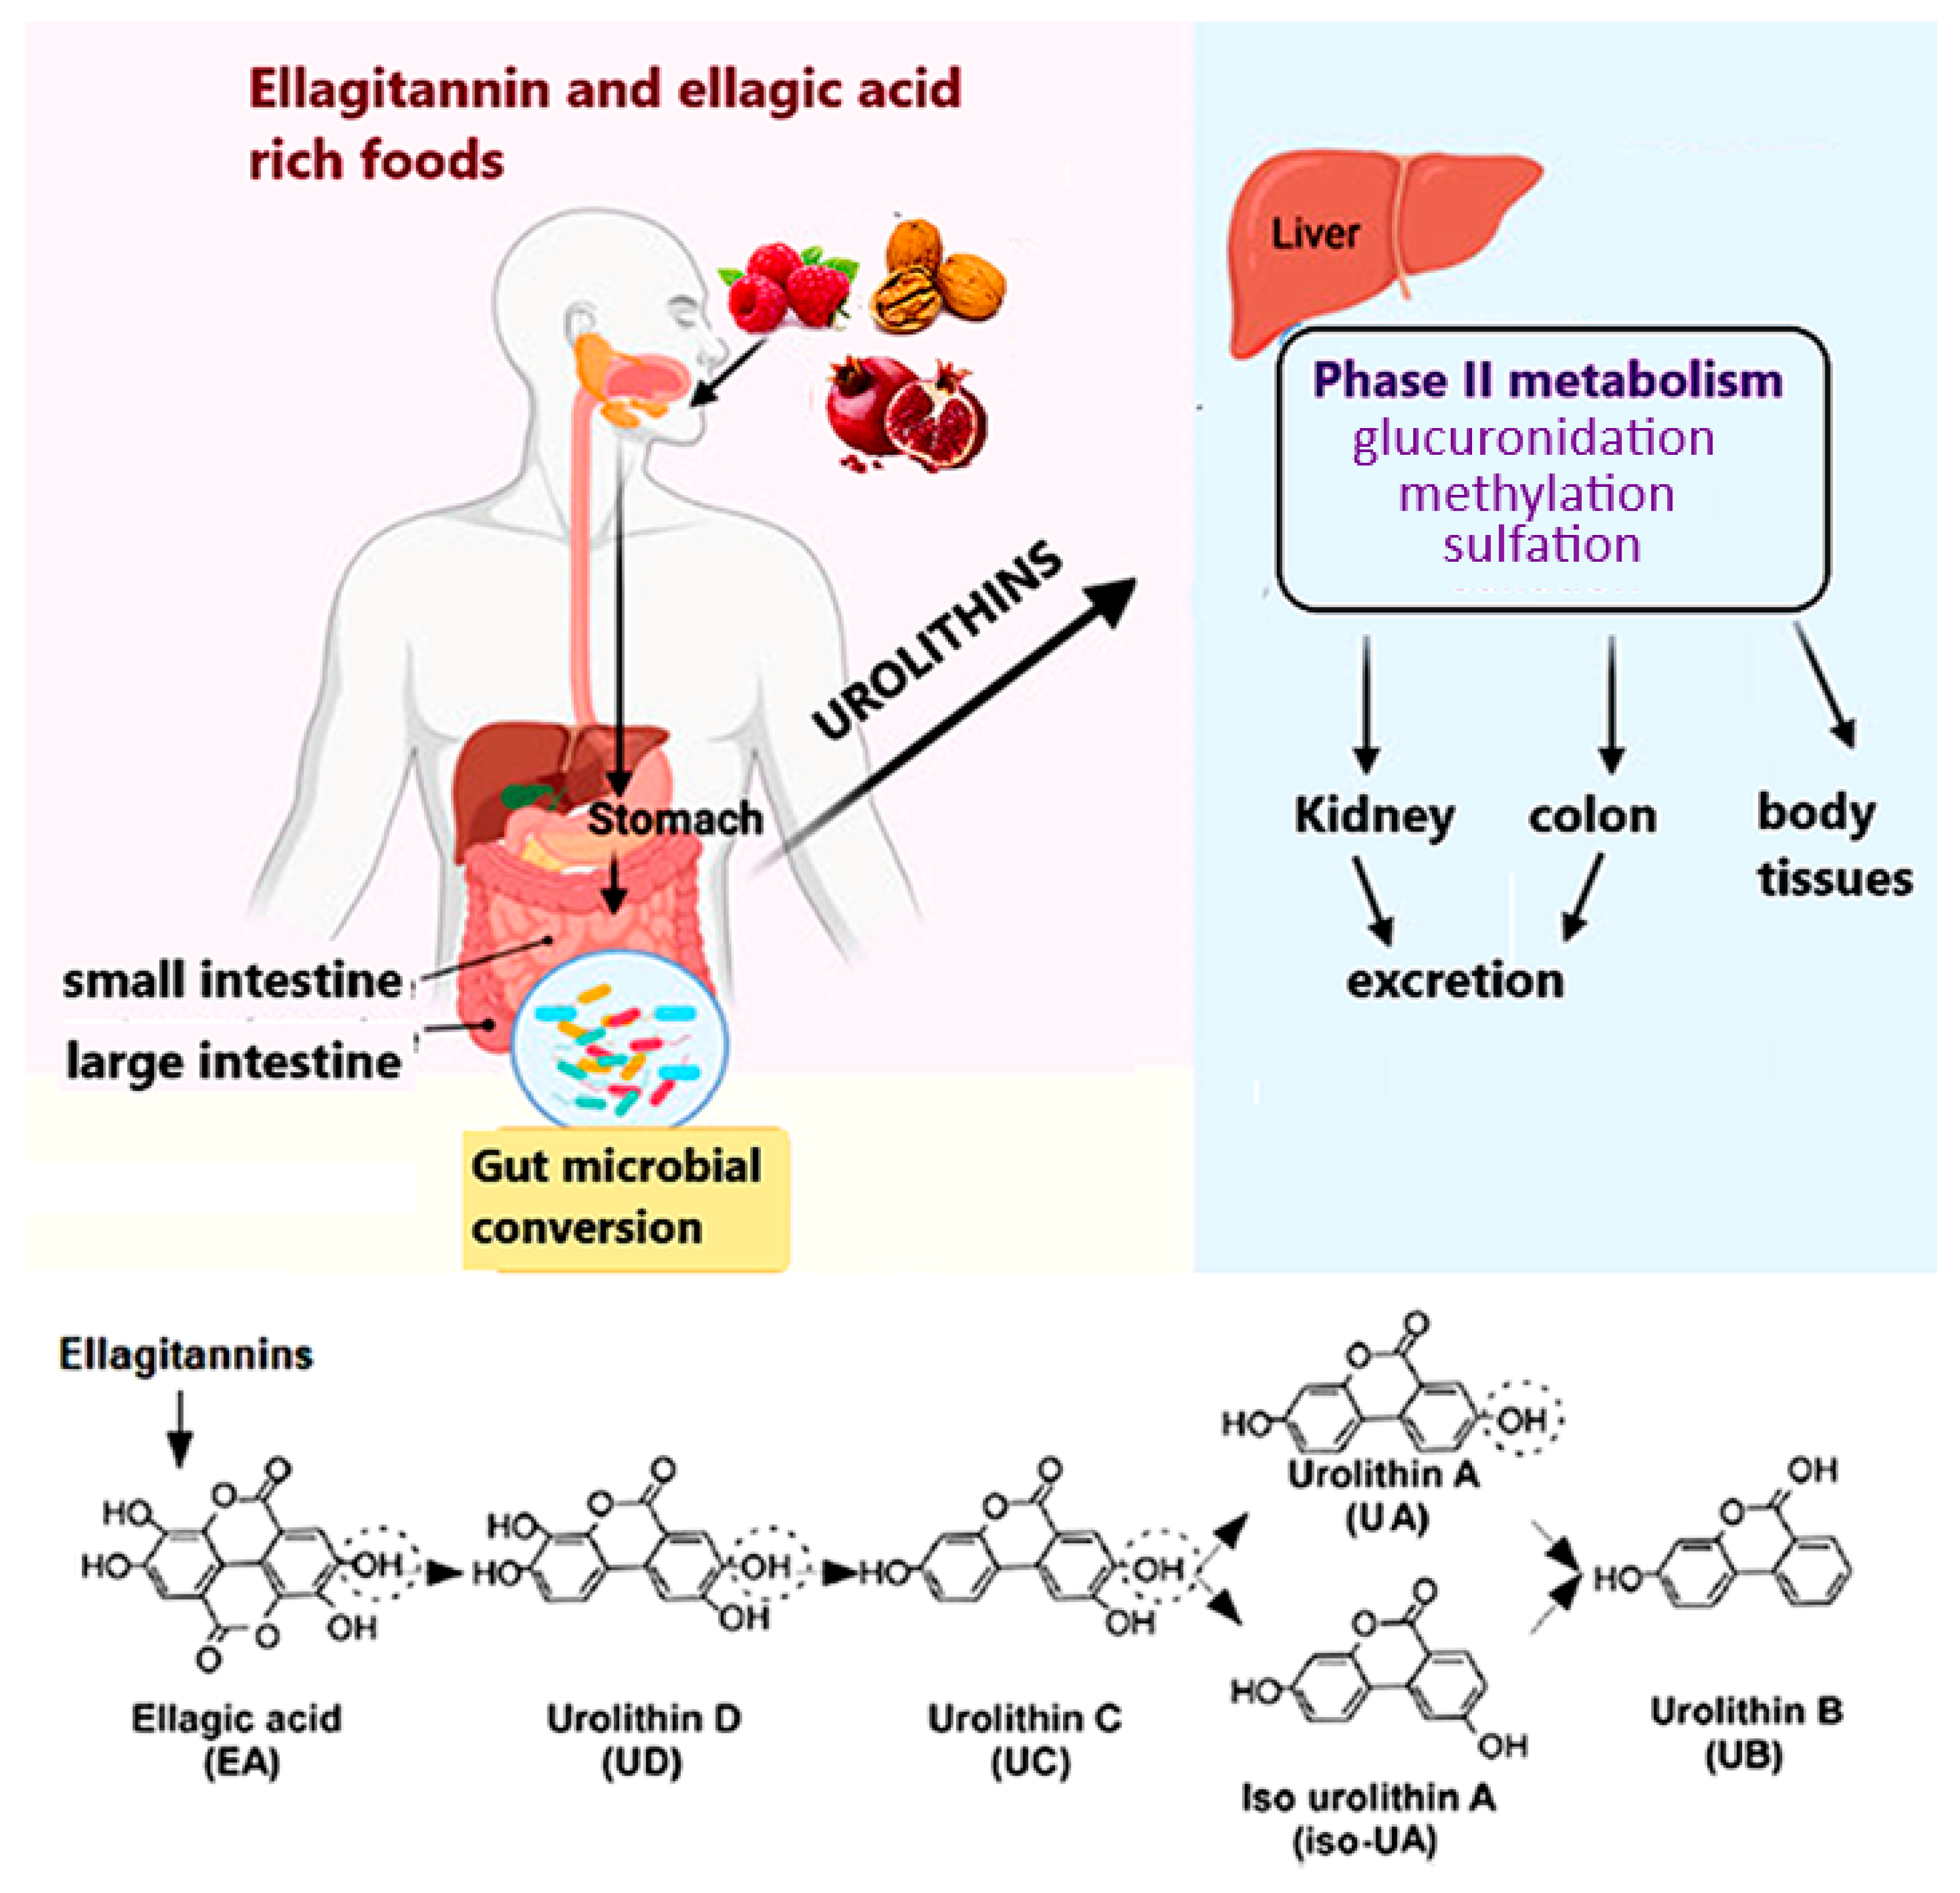
1. Introduction
2. Materials and Methods
2.1. Urolithins
2.2. Podocyte Culture and Treatment
2.3. Chromatographic Determination of Urolithin A and Identification of Its Metabolite in Podocyte Culture Media
2.4. Targeted Analysis of Urolithin A and Its Metabolite by Means of an MRM-Based Approach
2.5. Cell Viability Assay
2.6. Flow Cytometry Analysis of Nephrin
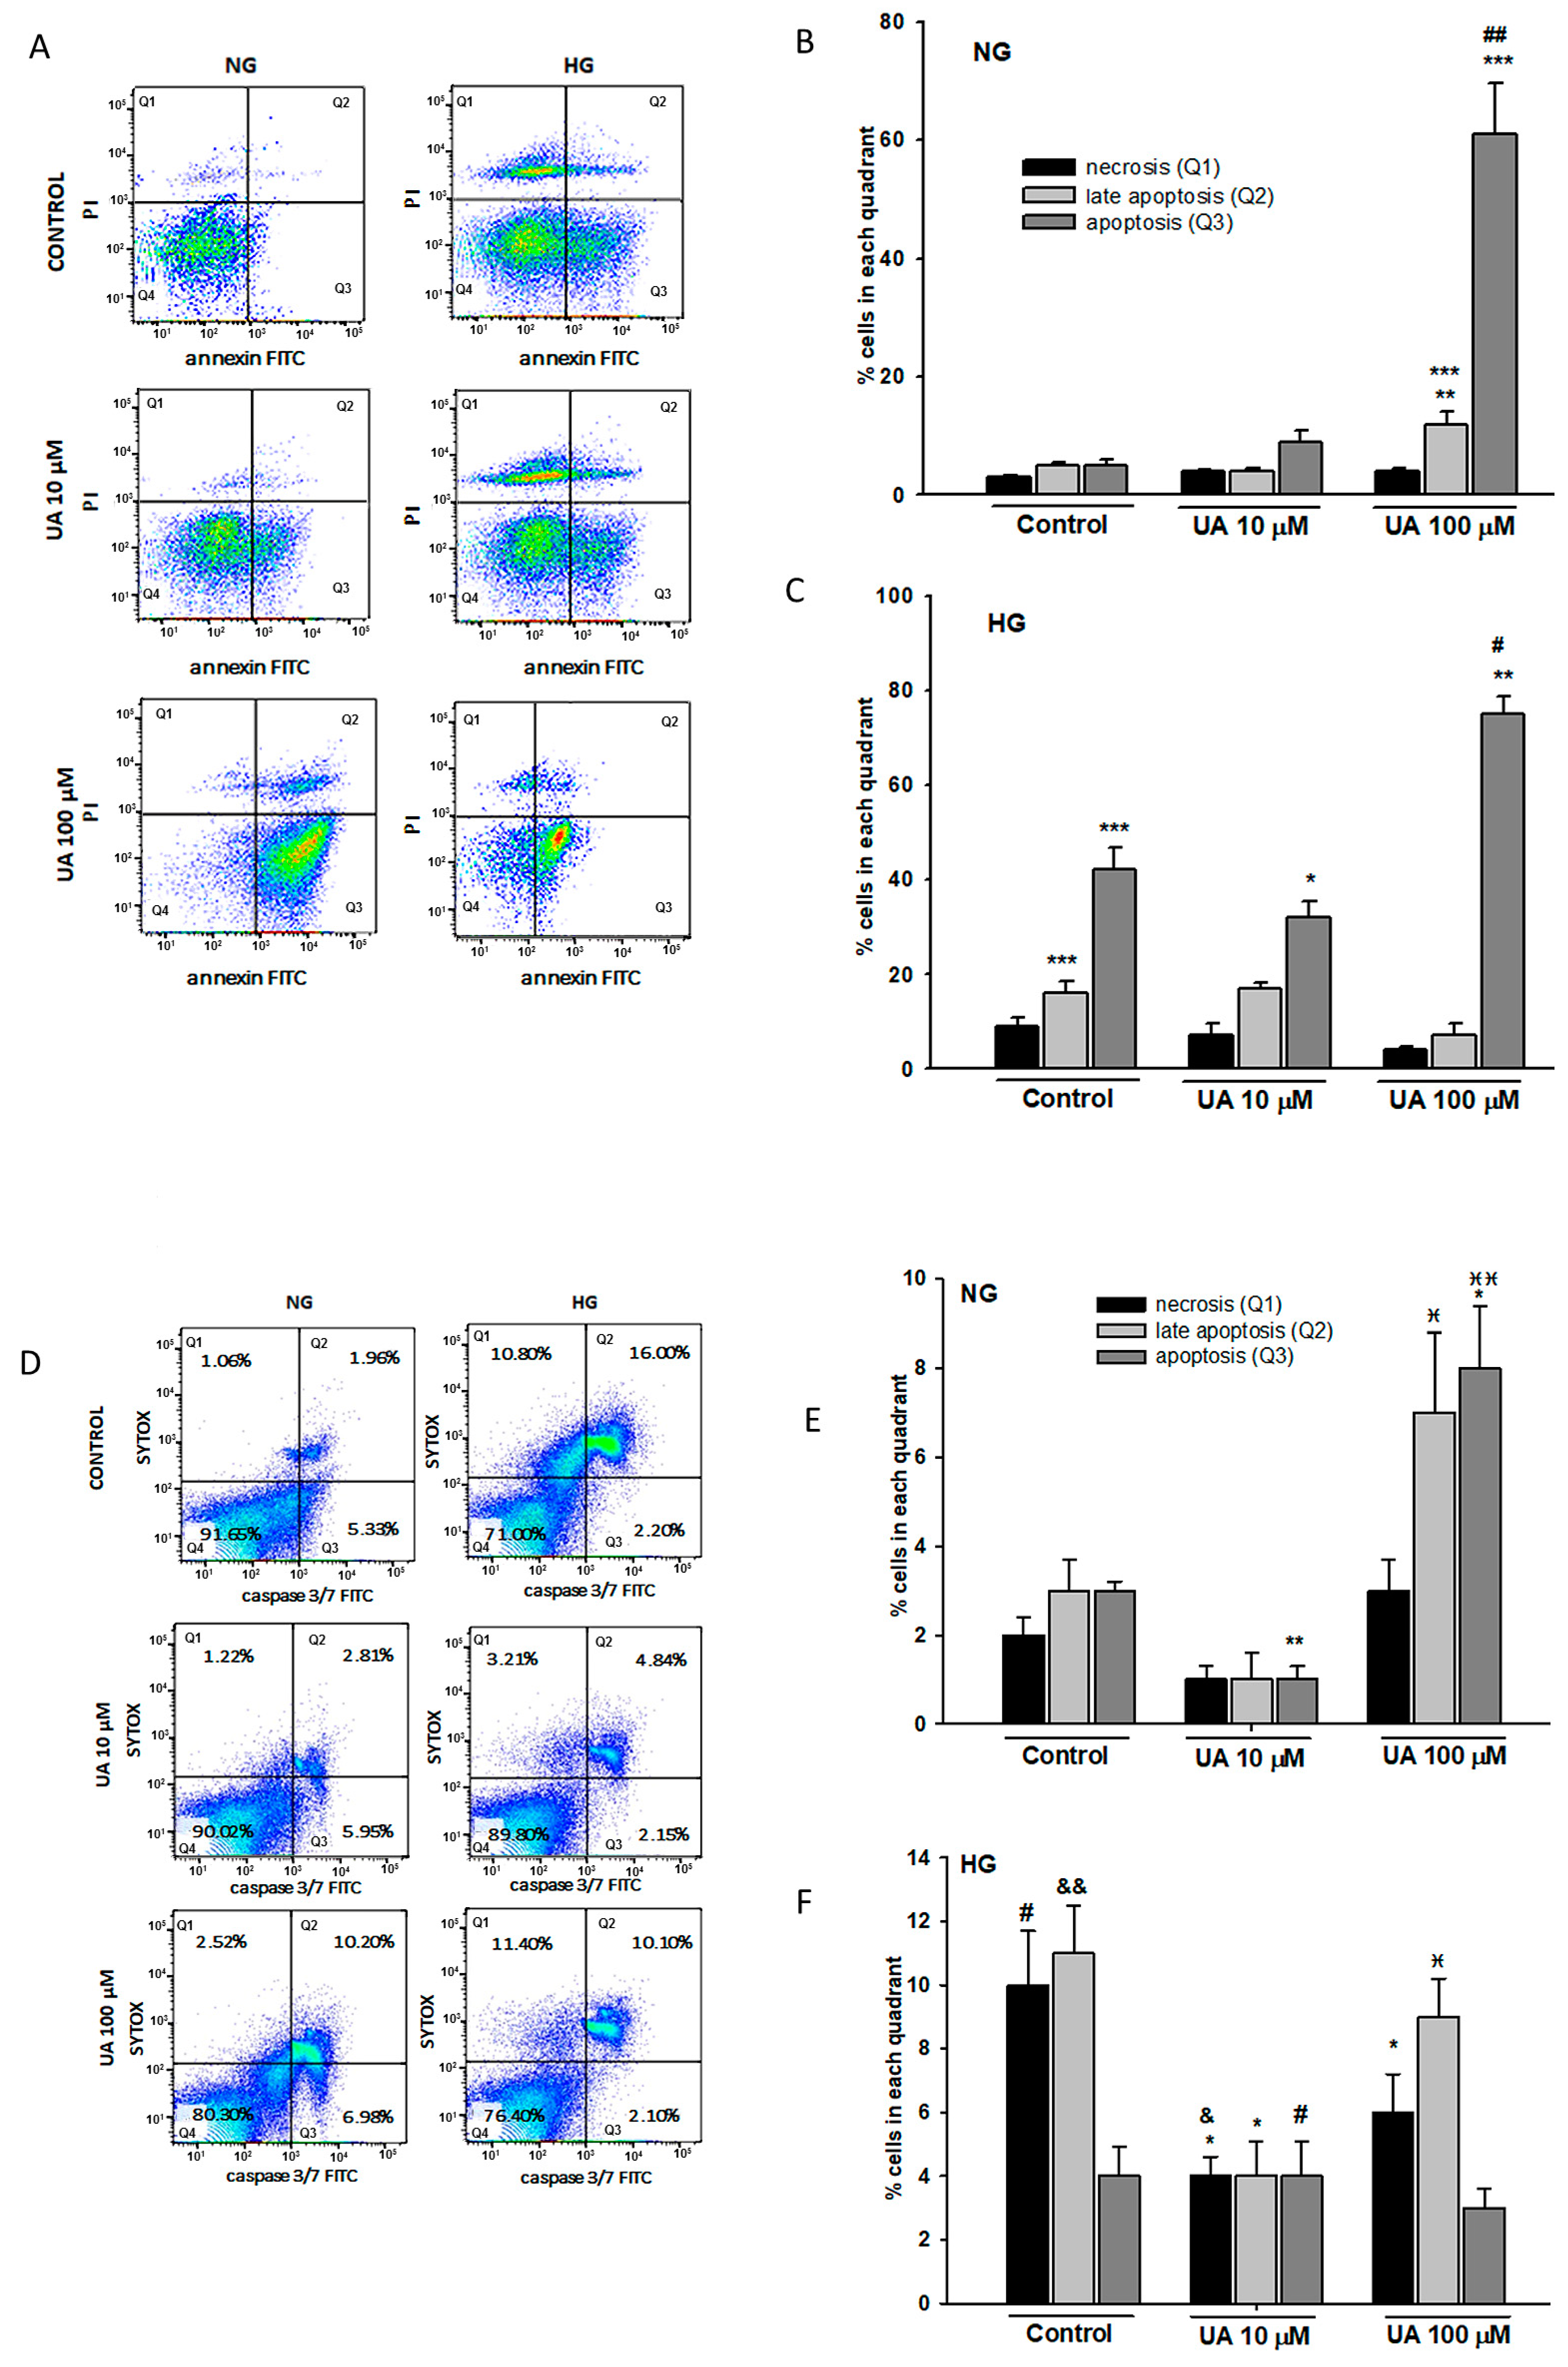
2.7. Detection of Apoptosis
2.8. Immunofluorescence Staining and Confocal Microscopy
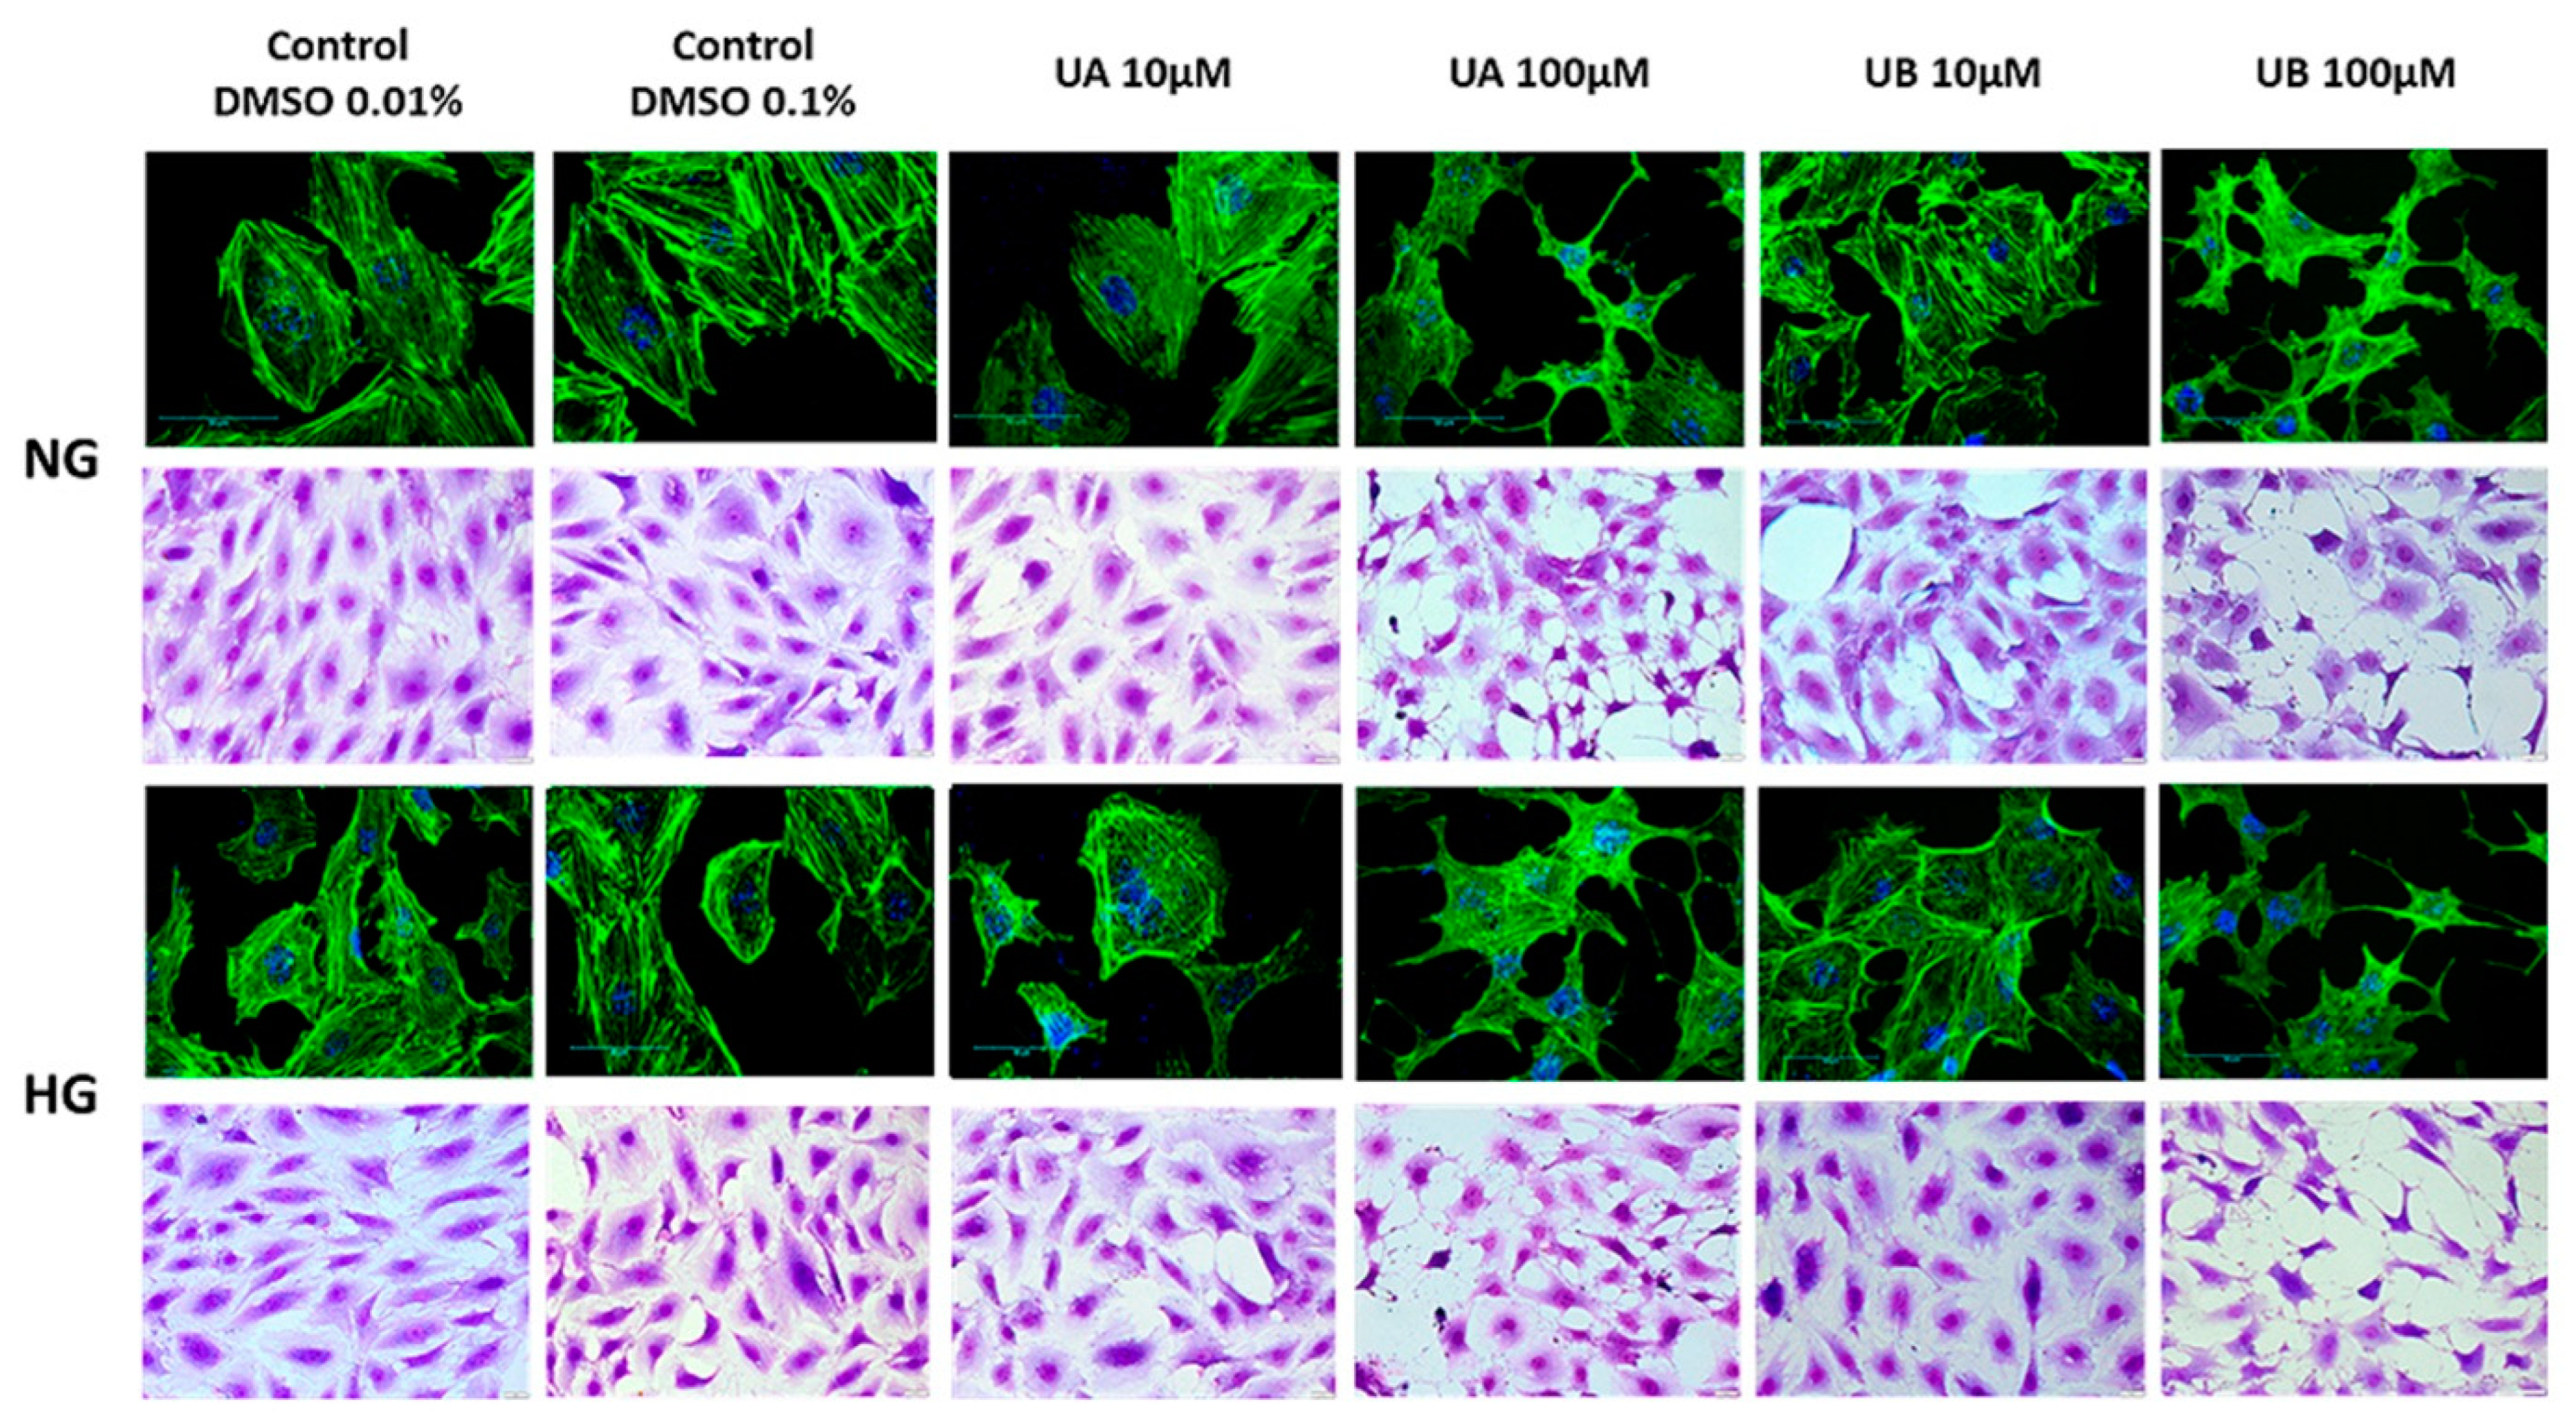
2.9. Assessment of Morphology and Actin Cytoskeleton
2.10. RNA Isolation and qPCR
2.11. Protein Extraction and Western Blot Analysis
2.12. Statistical Analyses
3. Results
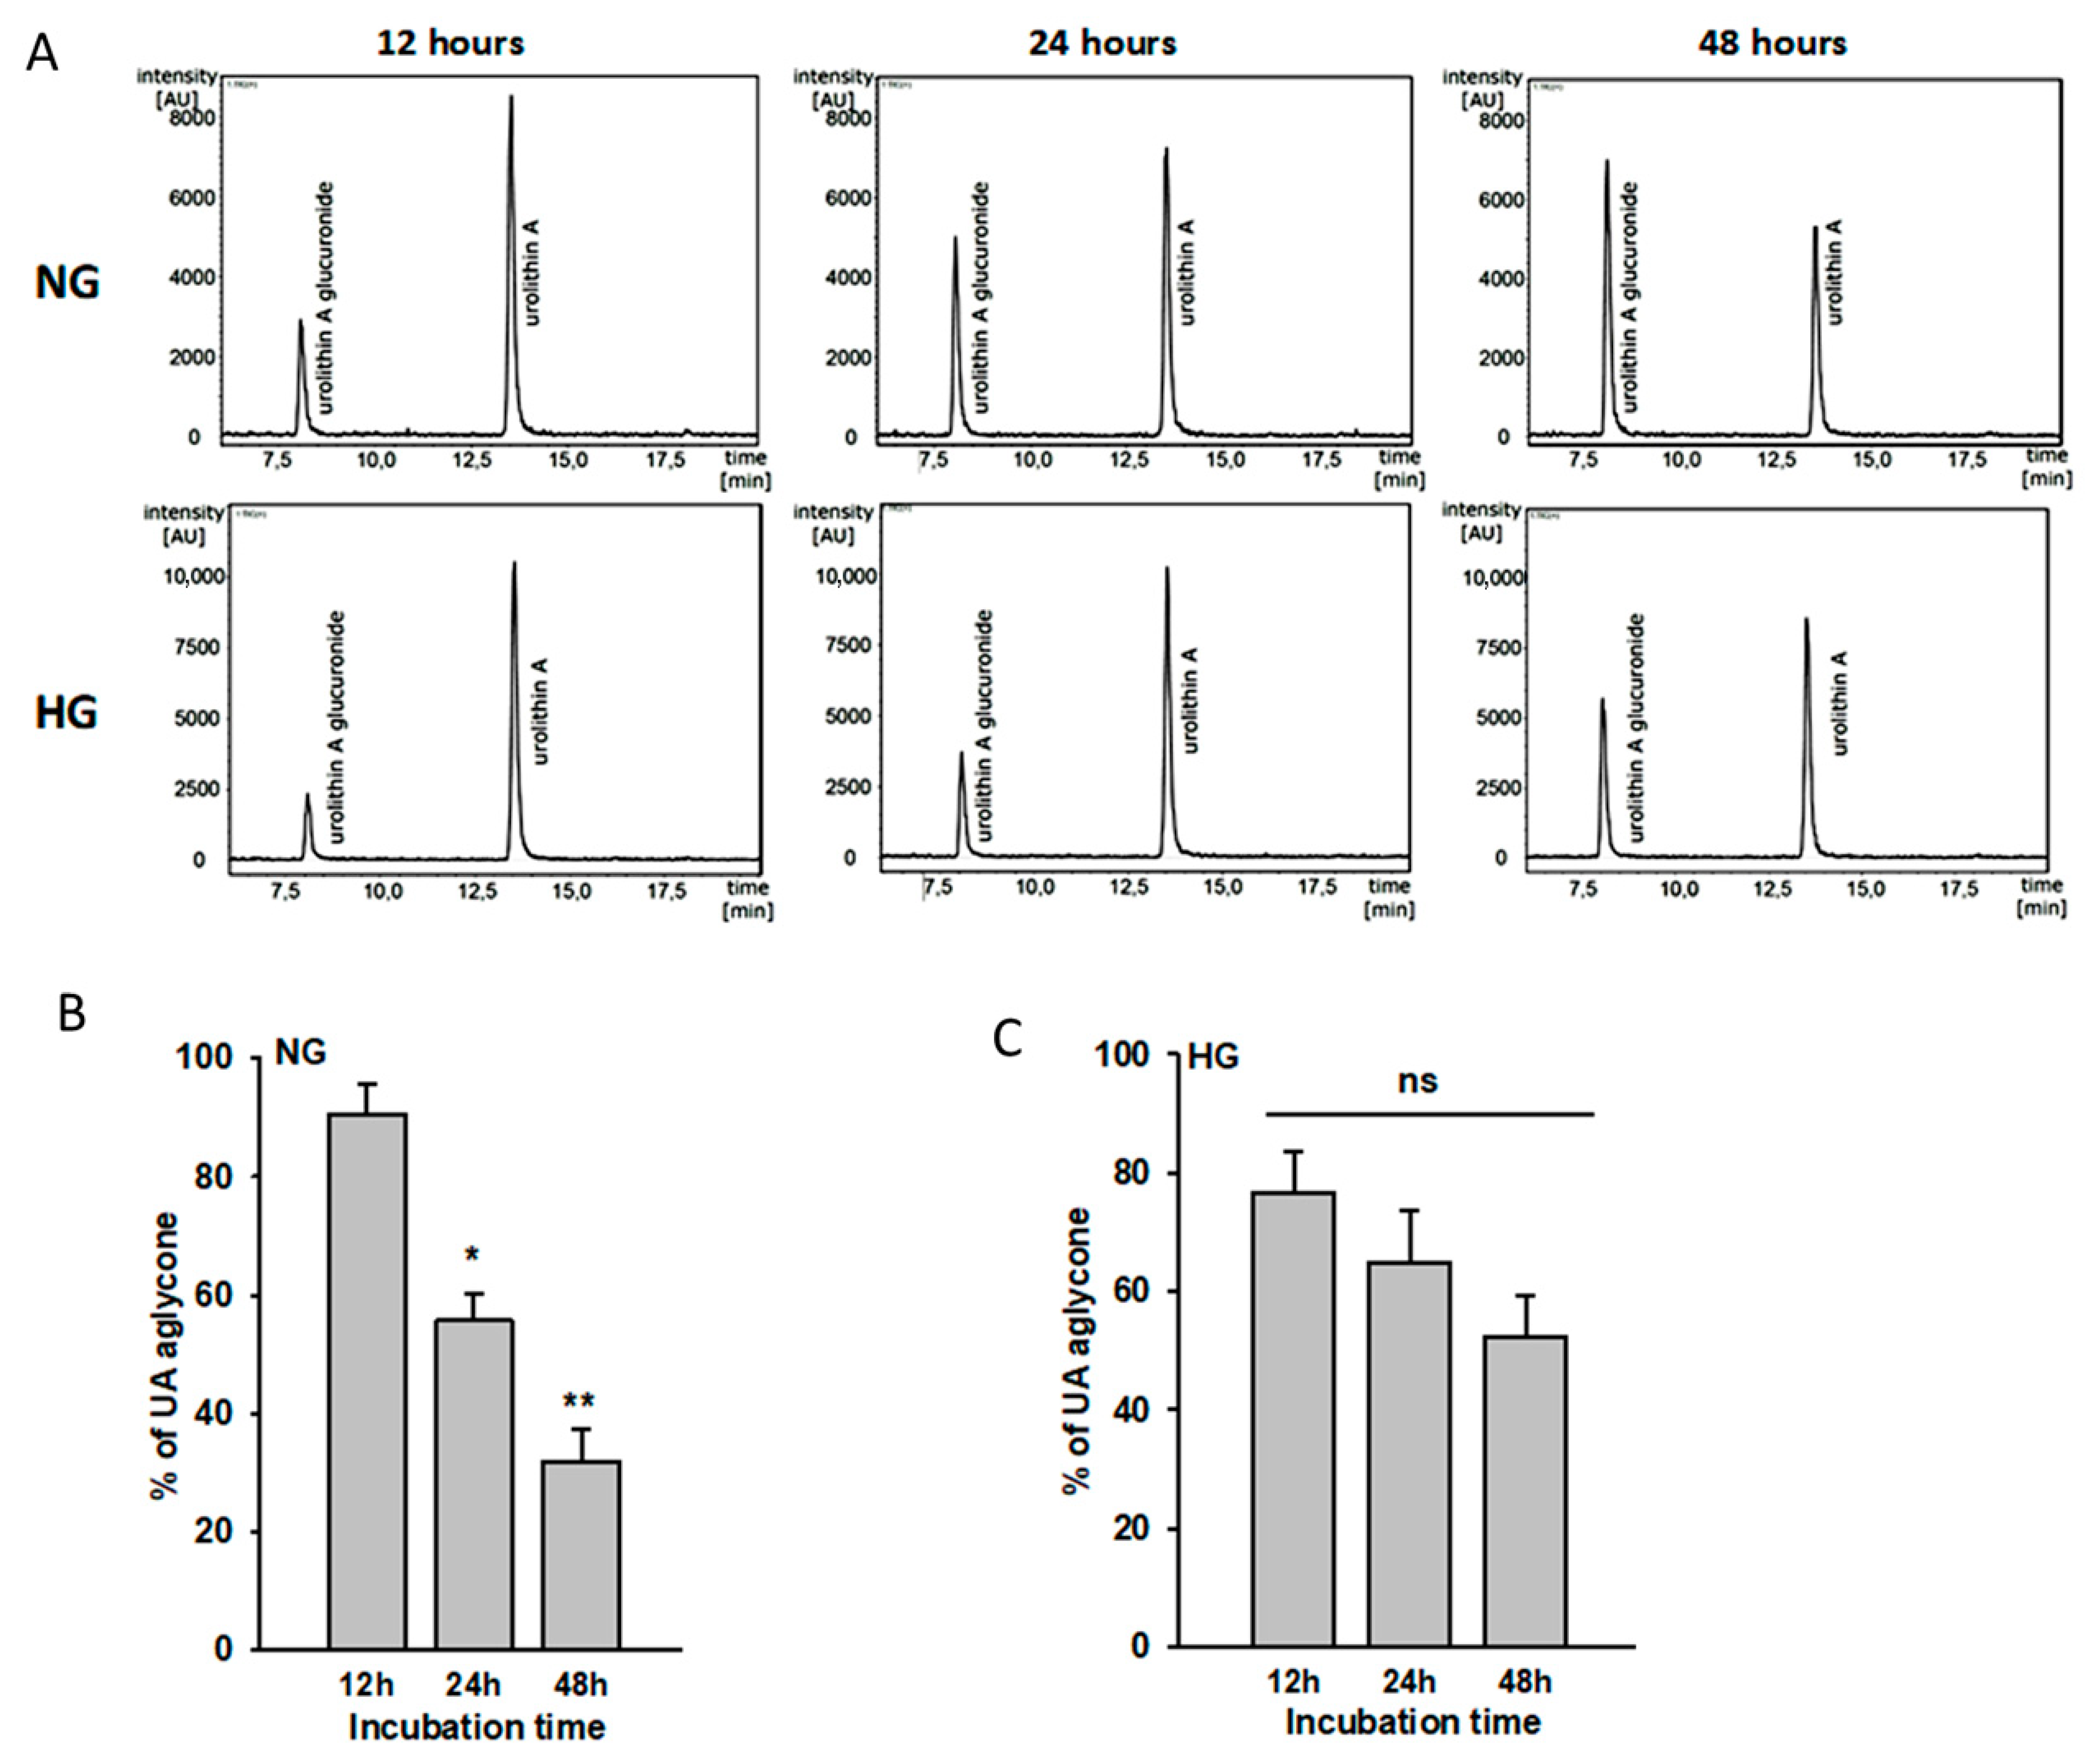
3.1. Urolithin A Is Metabolized by Podocytes
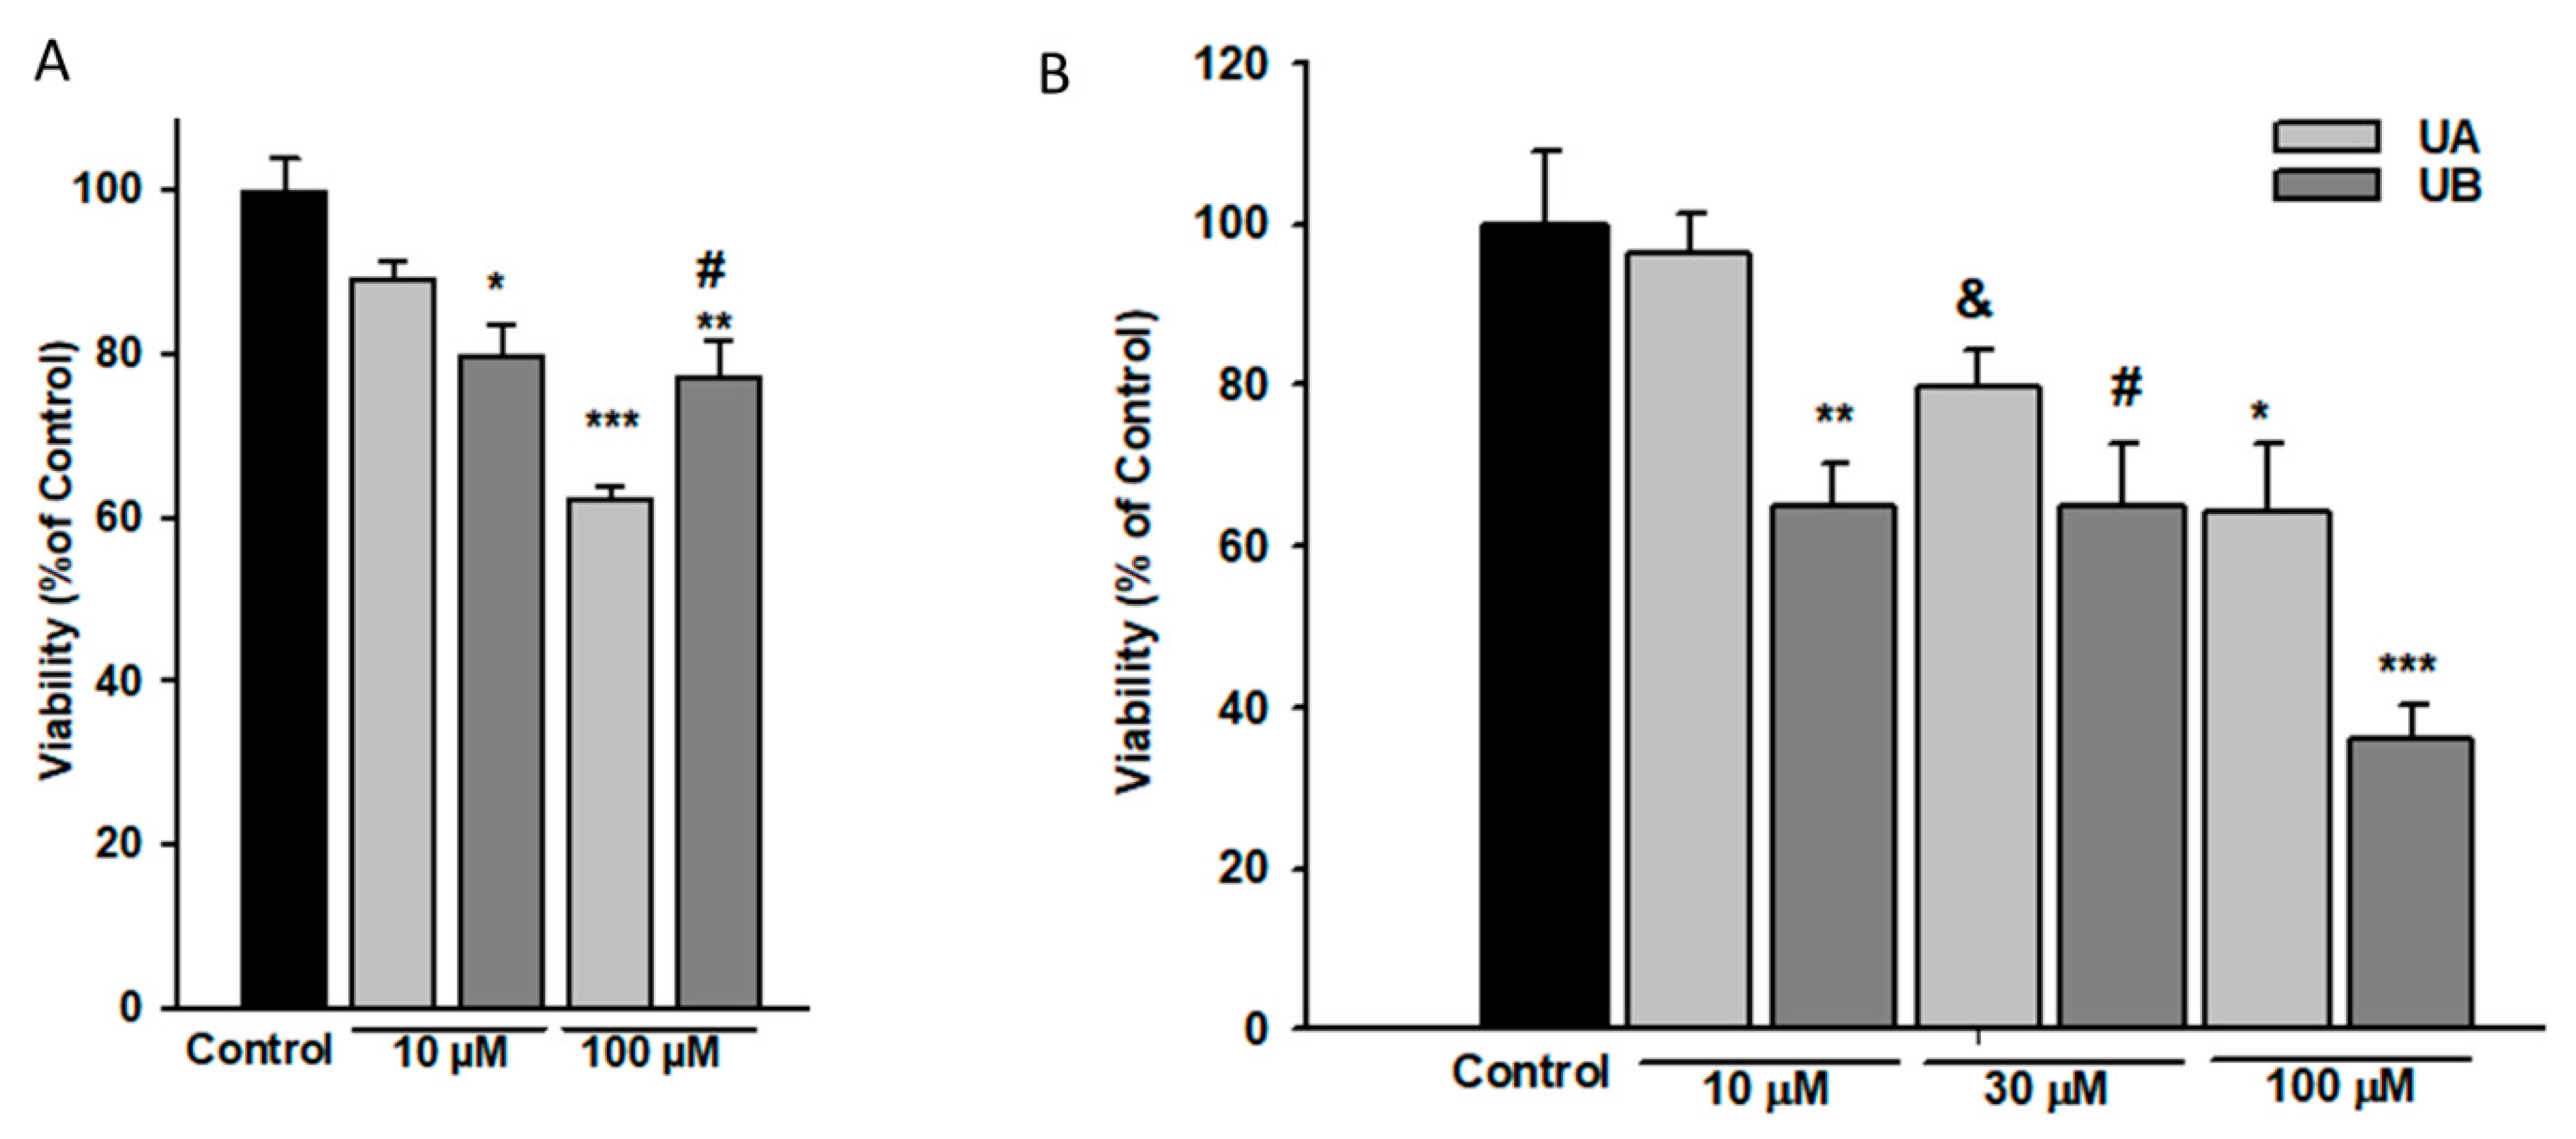
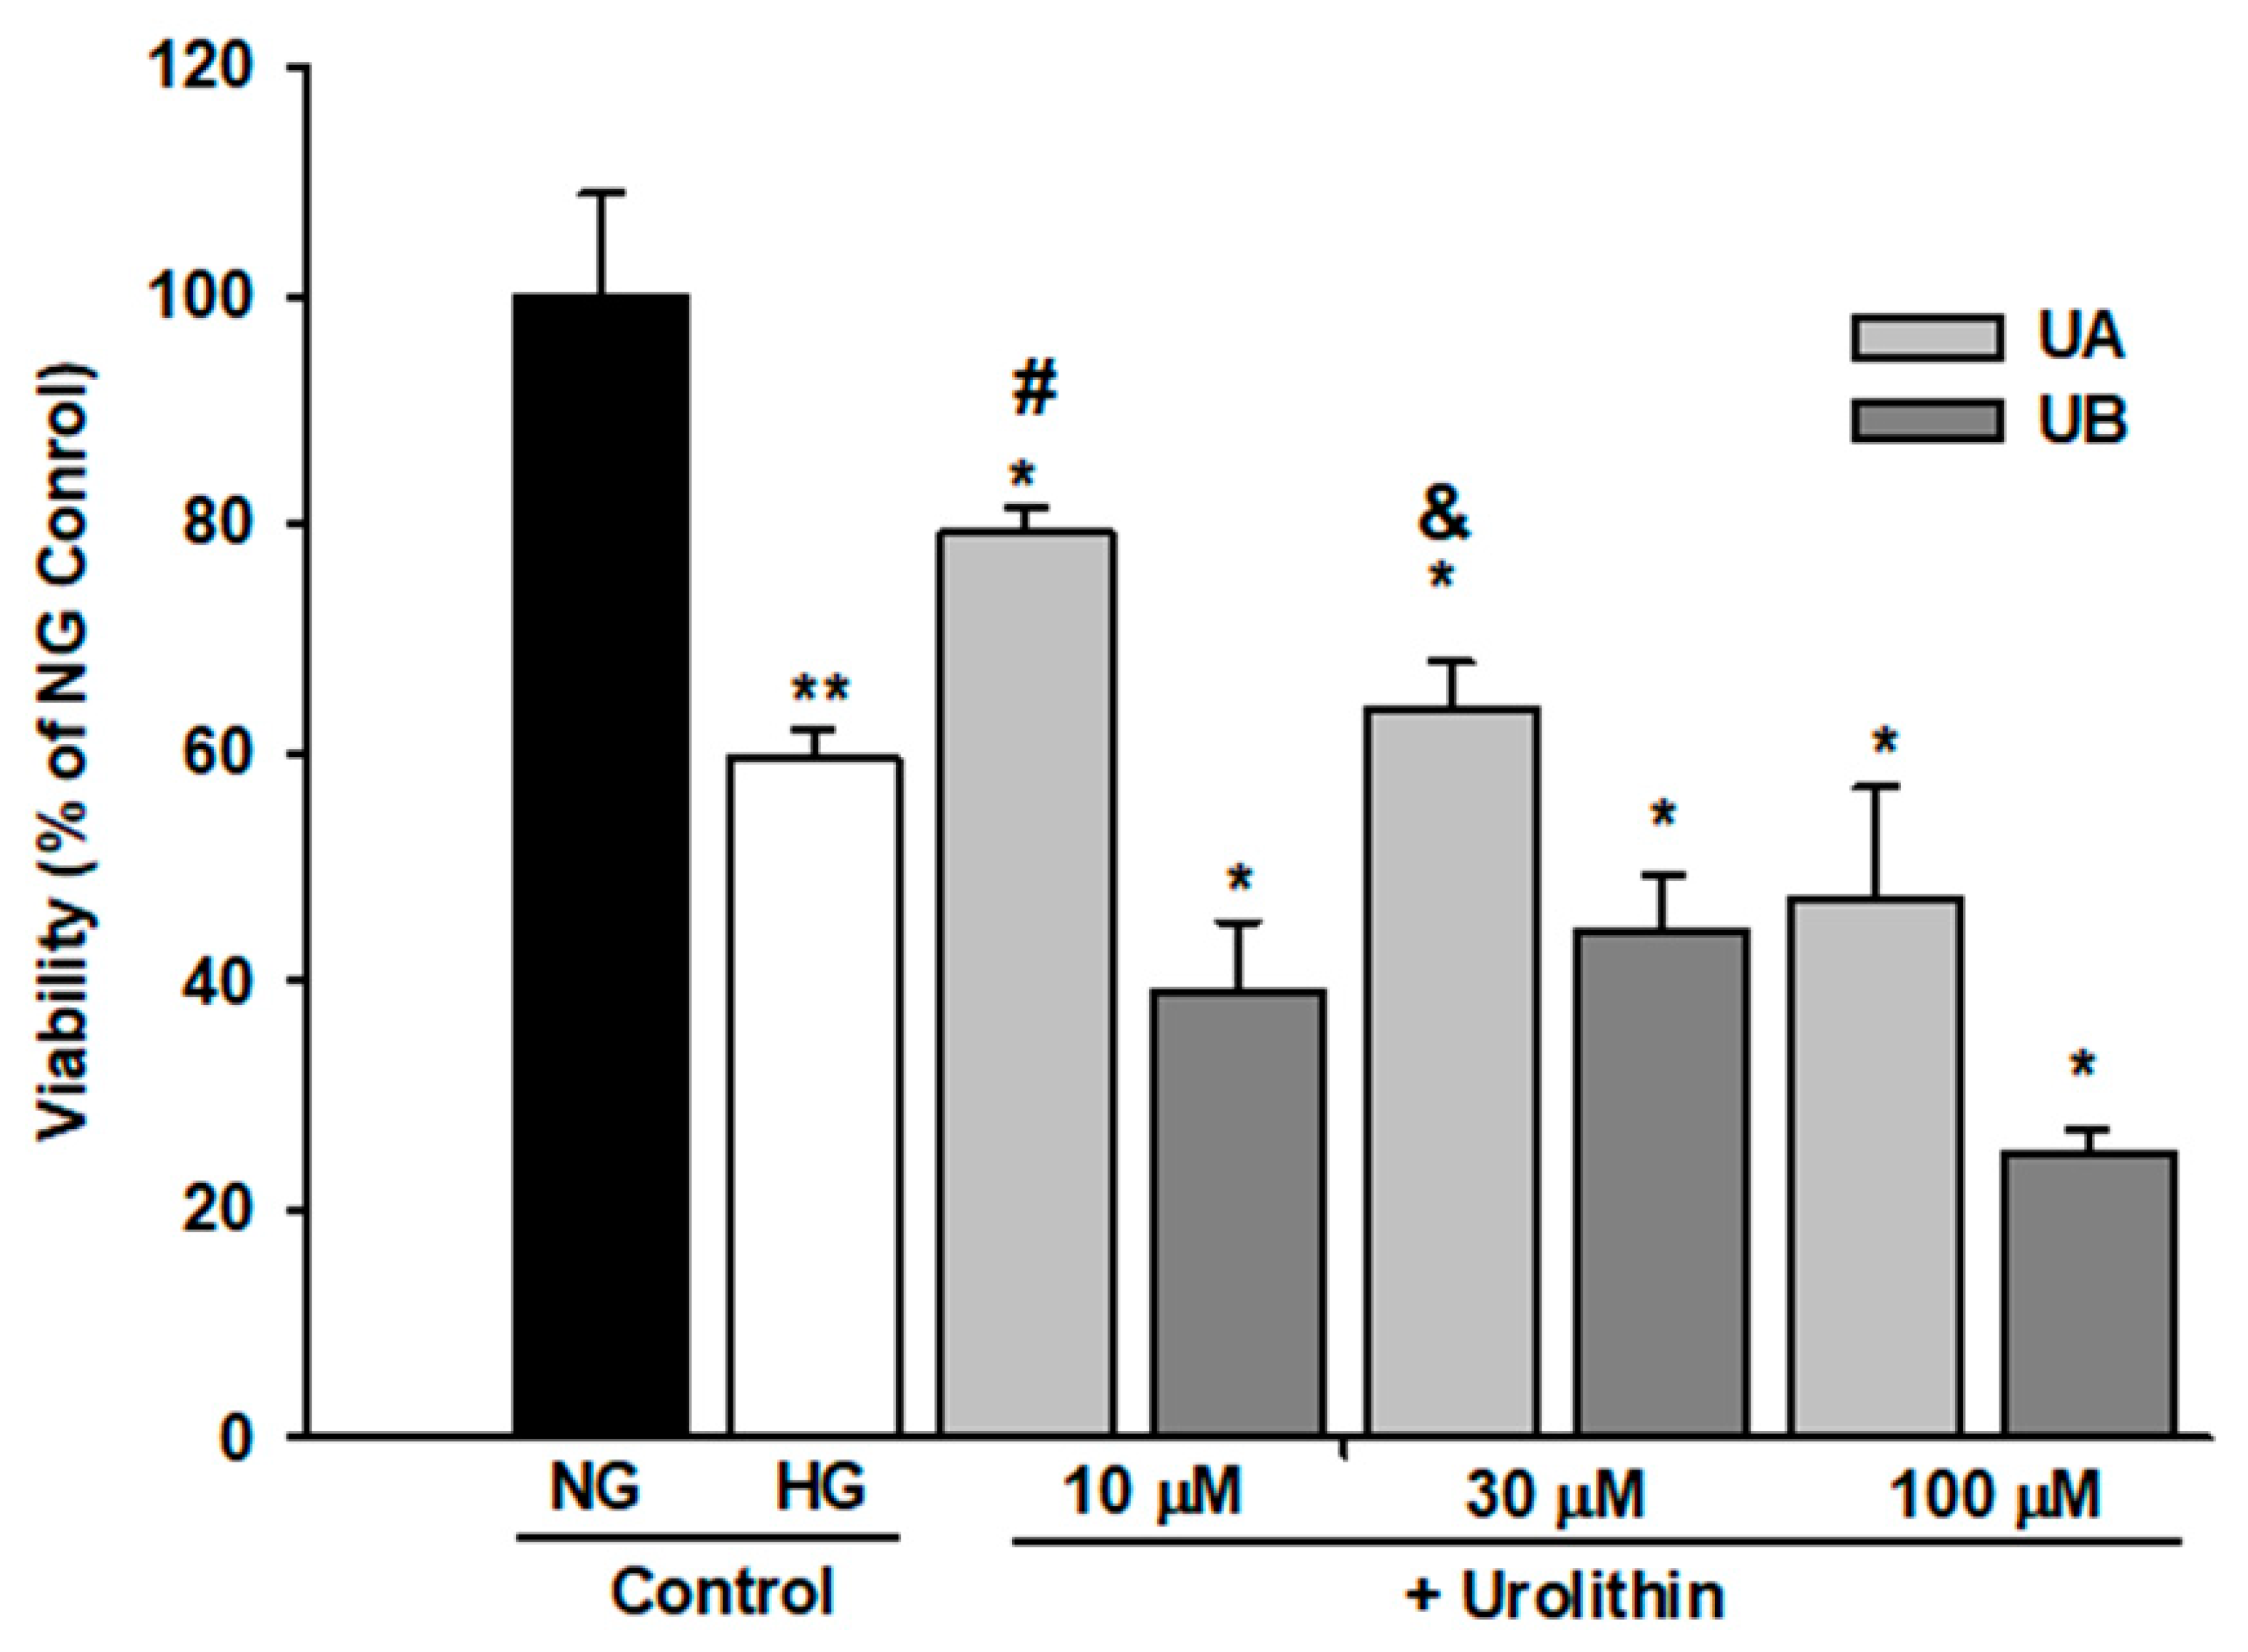
3.2. Podocyte Viability and Structure Are Affected by High Concentrations of Urolithins
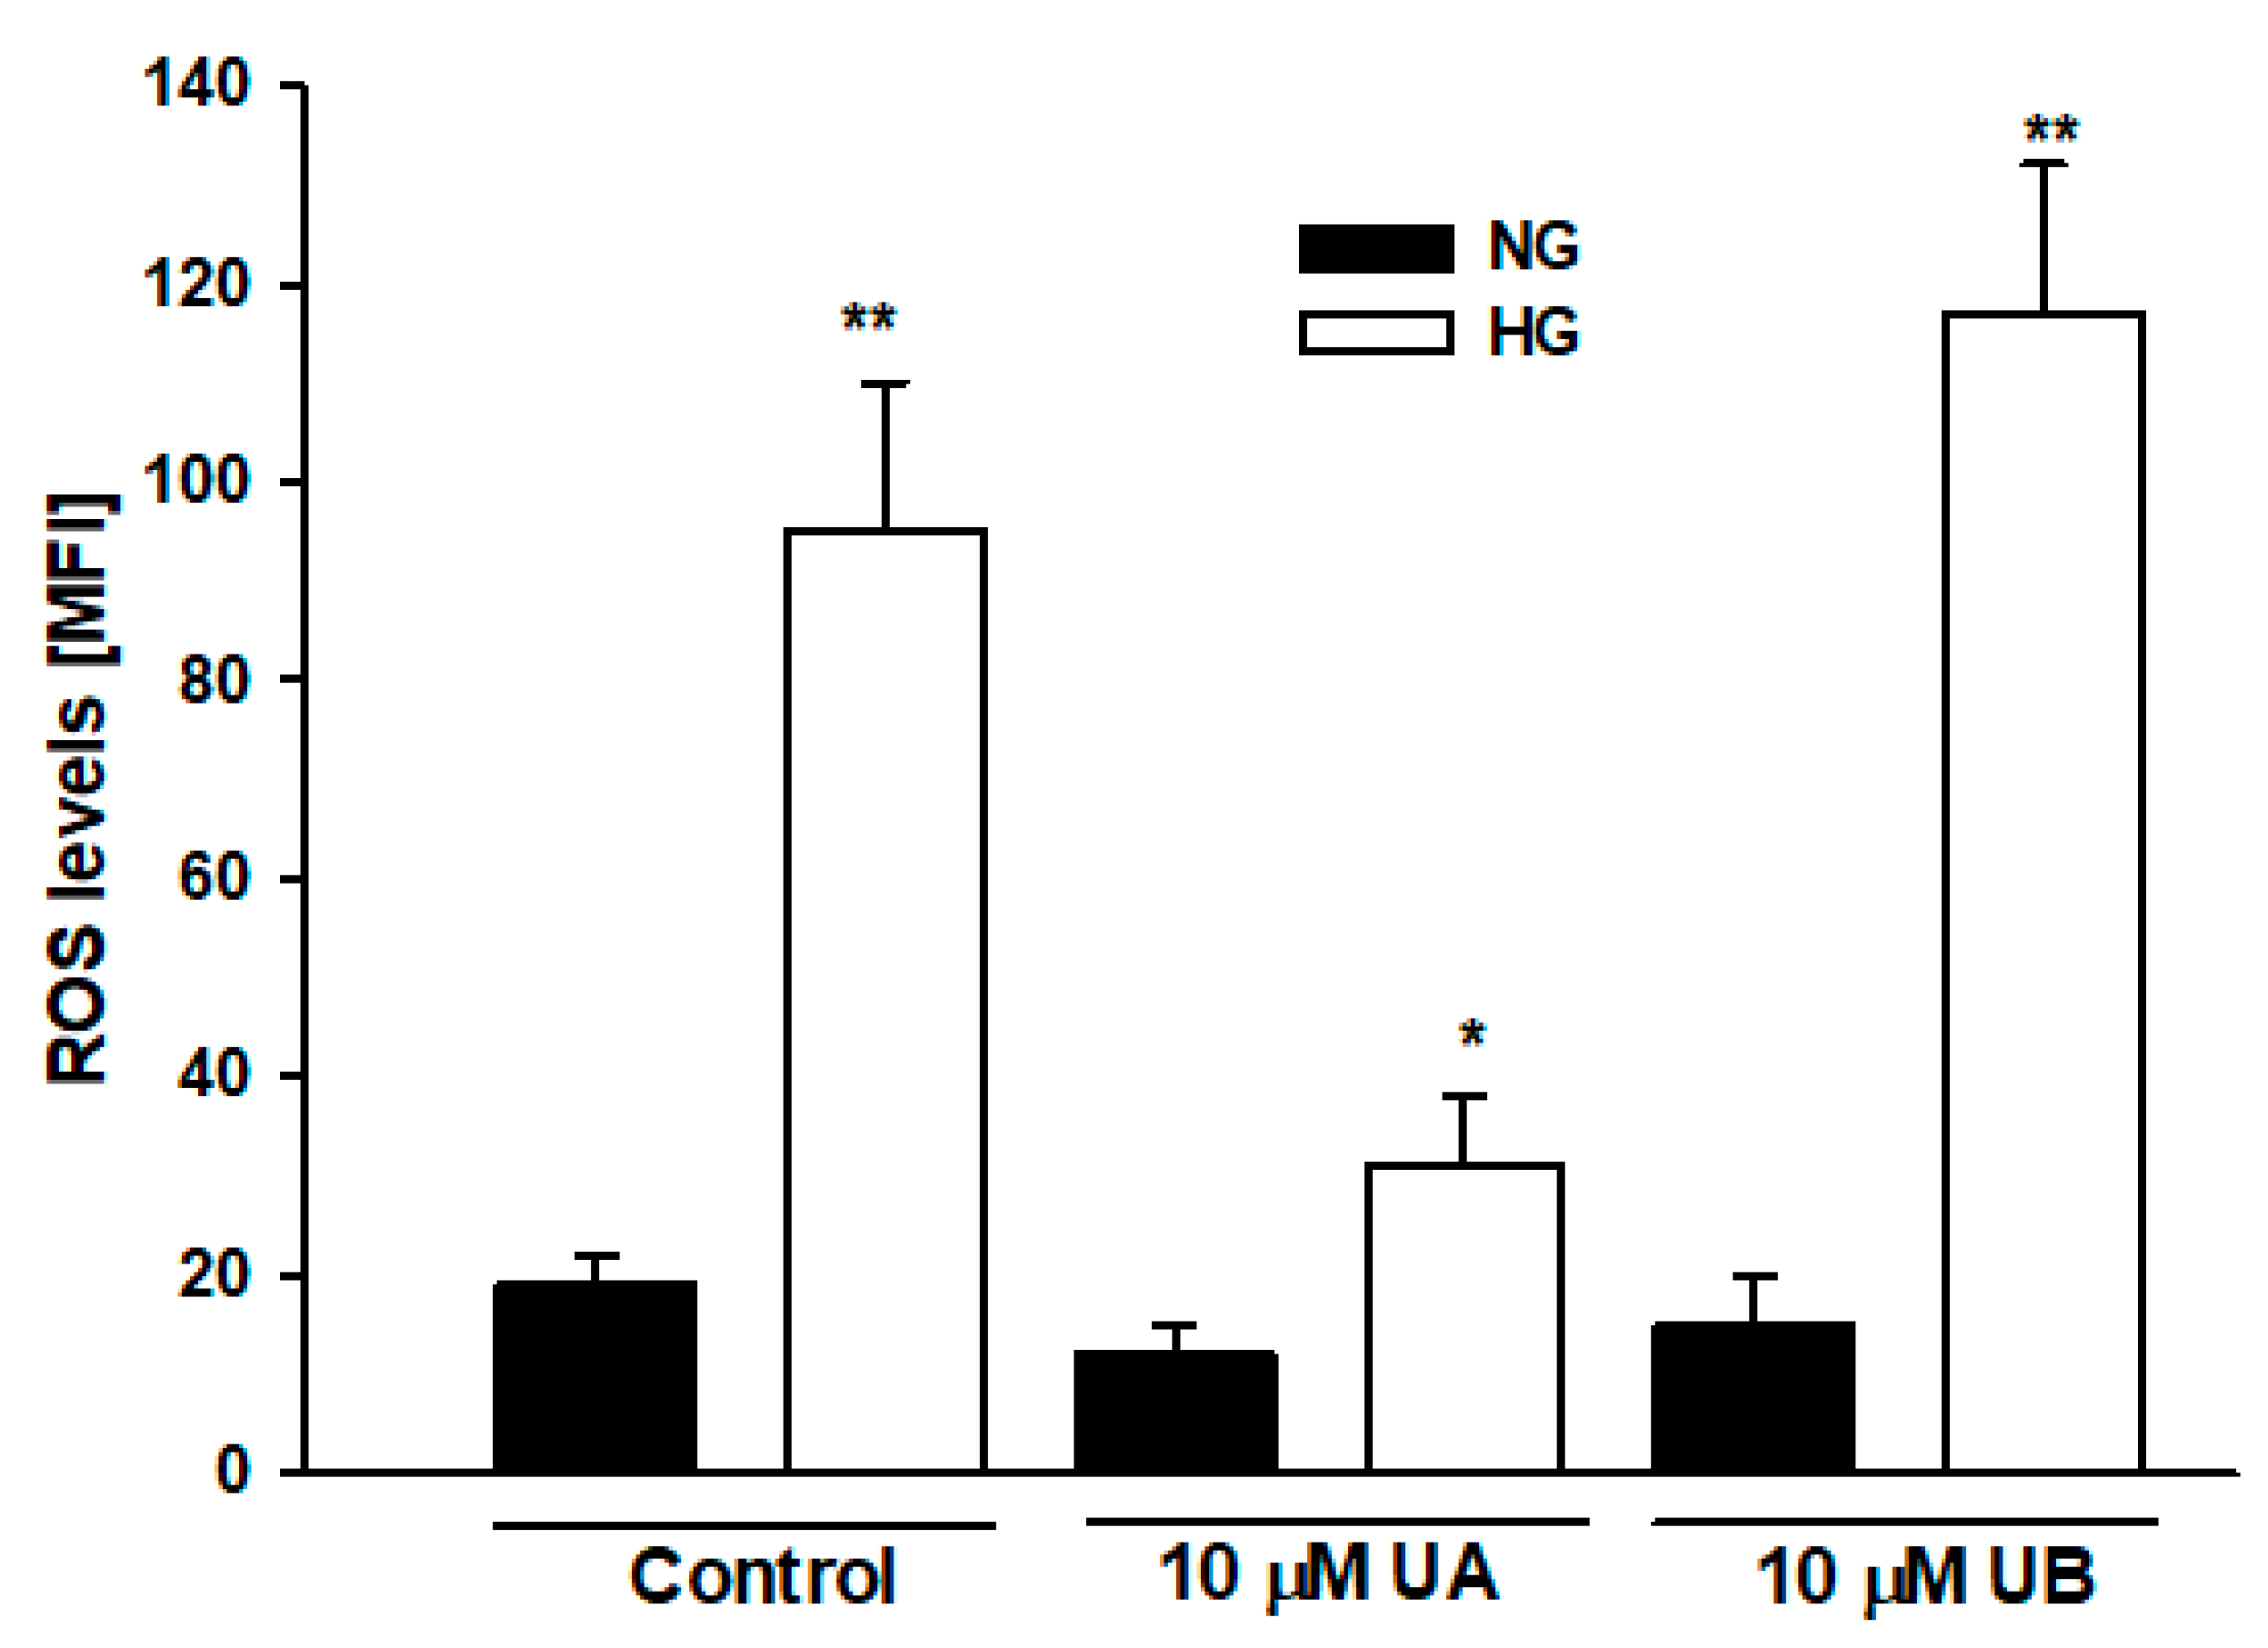
3.3. Urolithin A Reduces High Glucose–Induced Reactive Oxygen Species Production in Podocytes
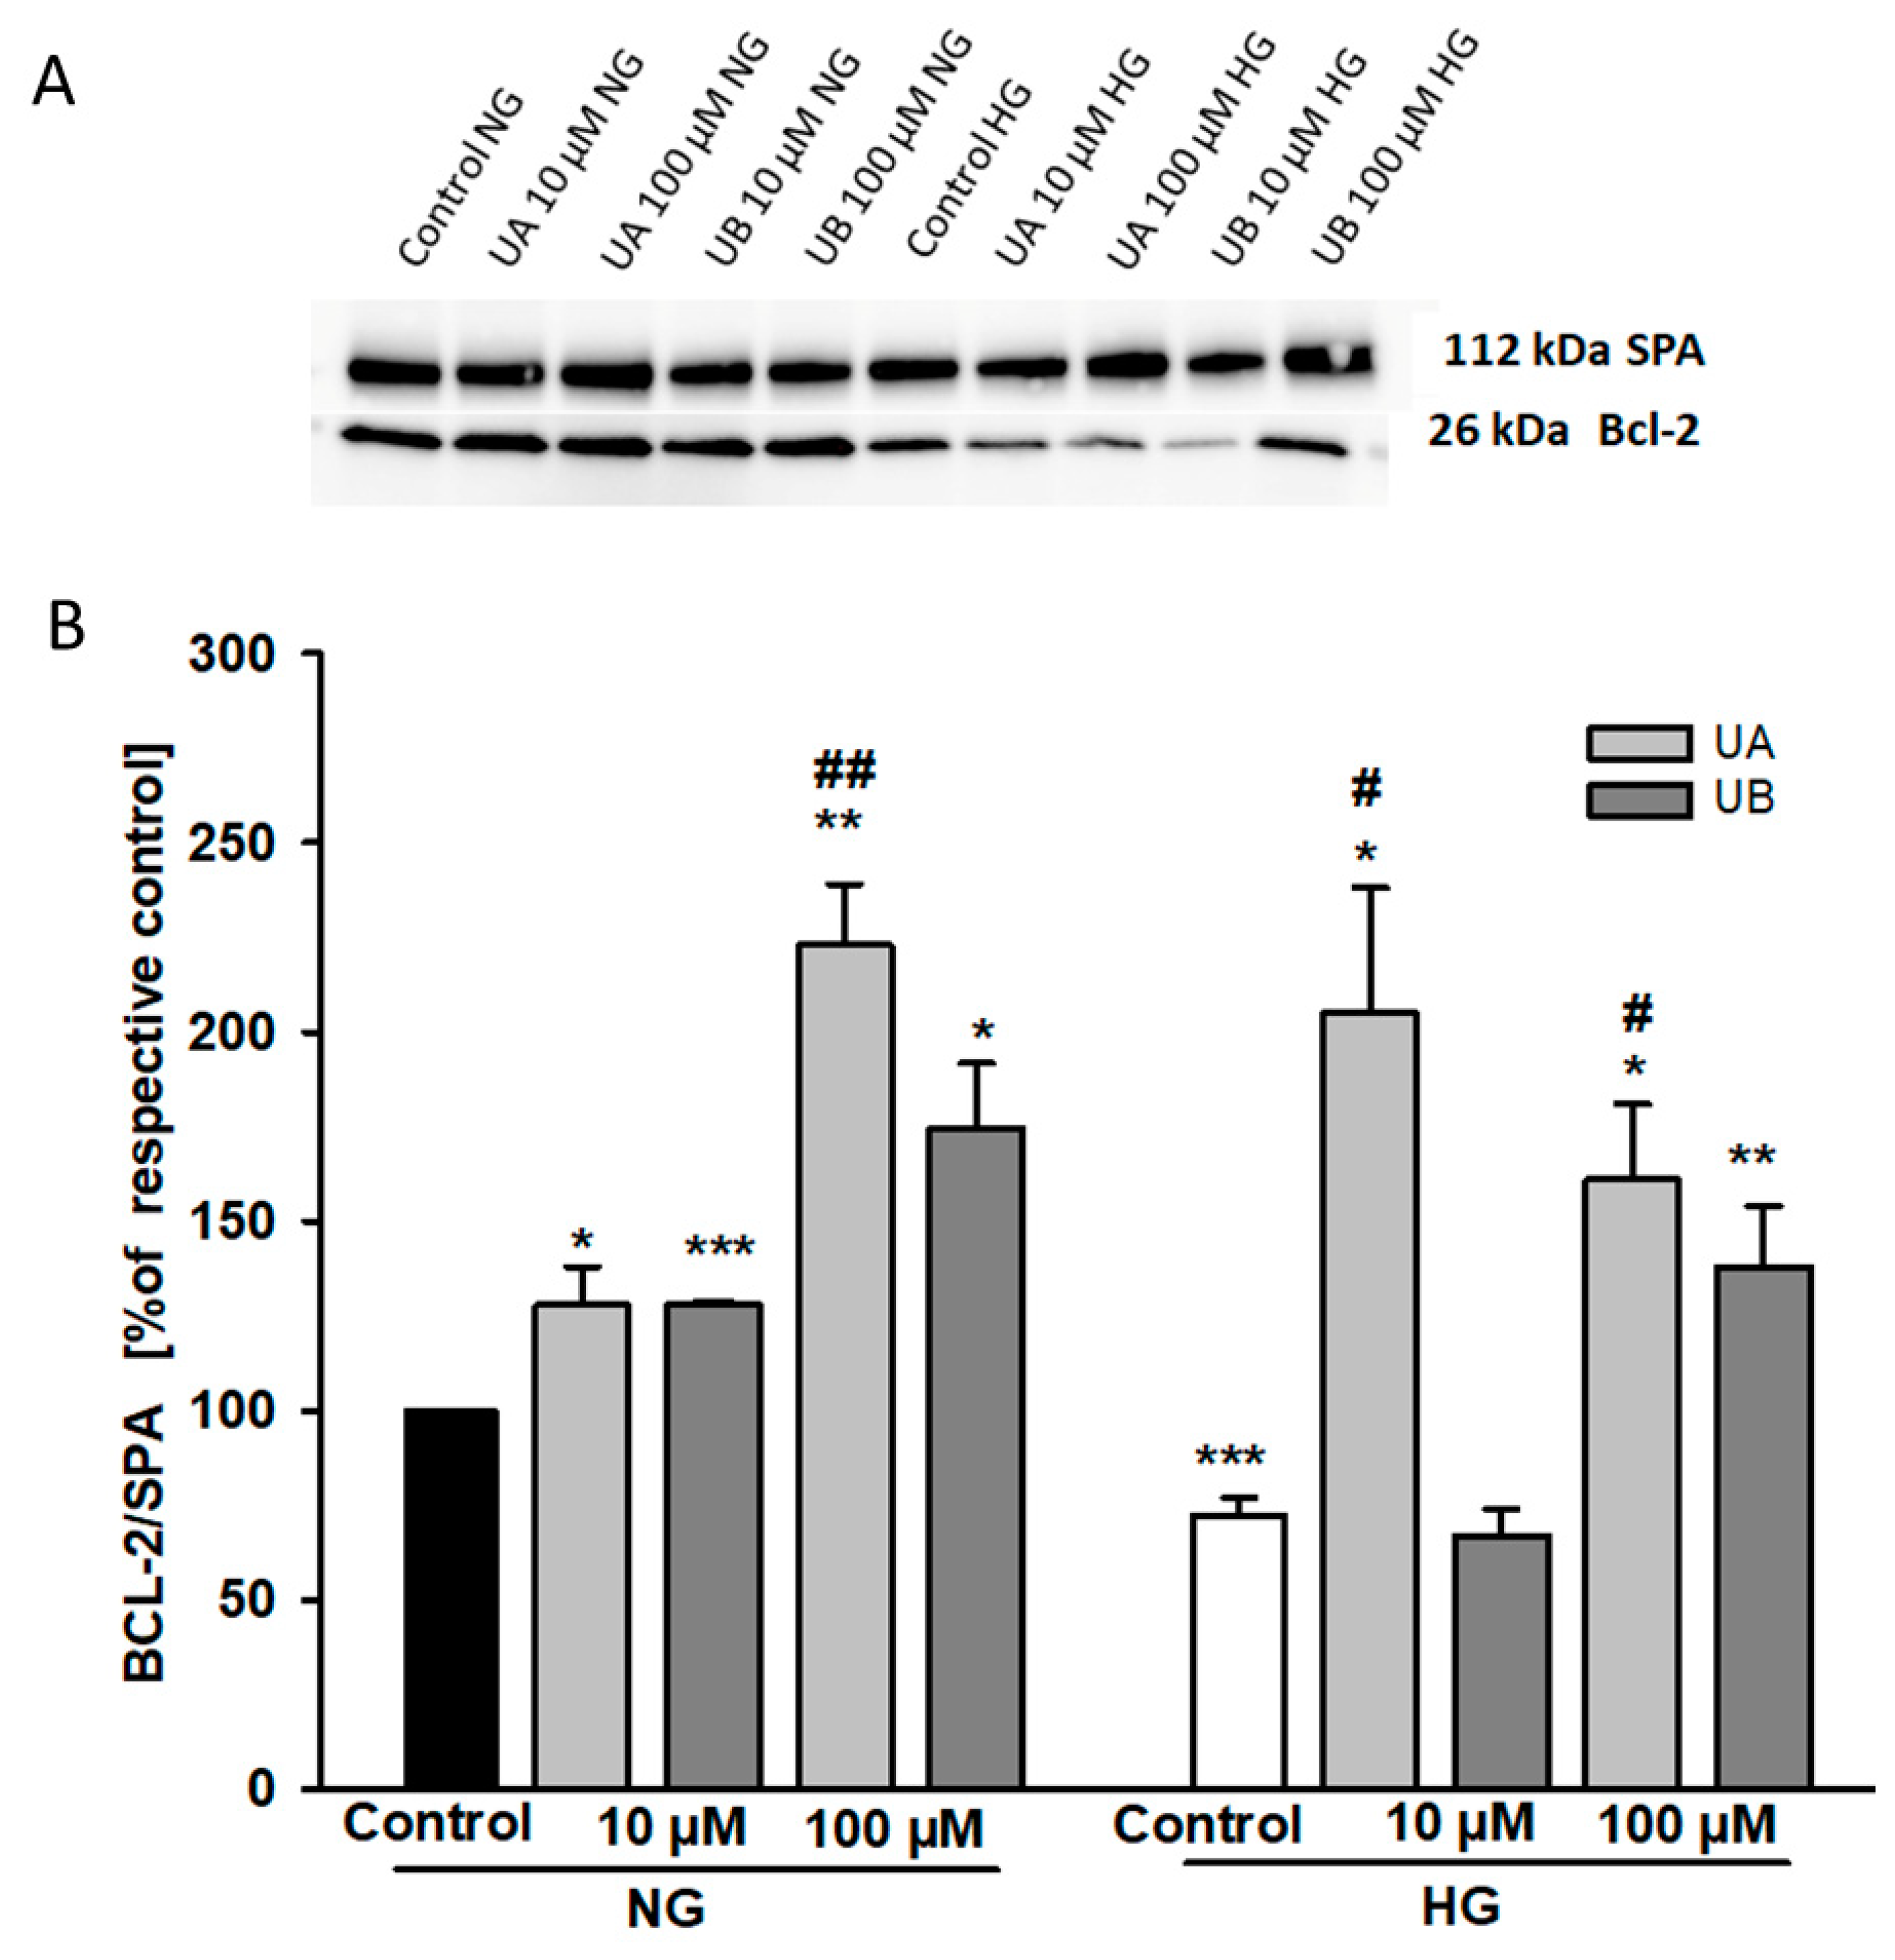
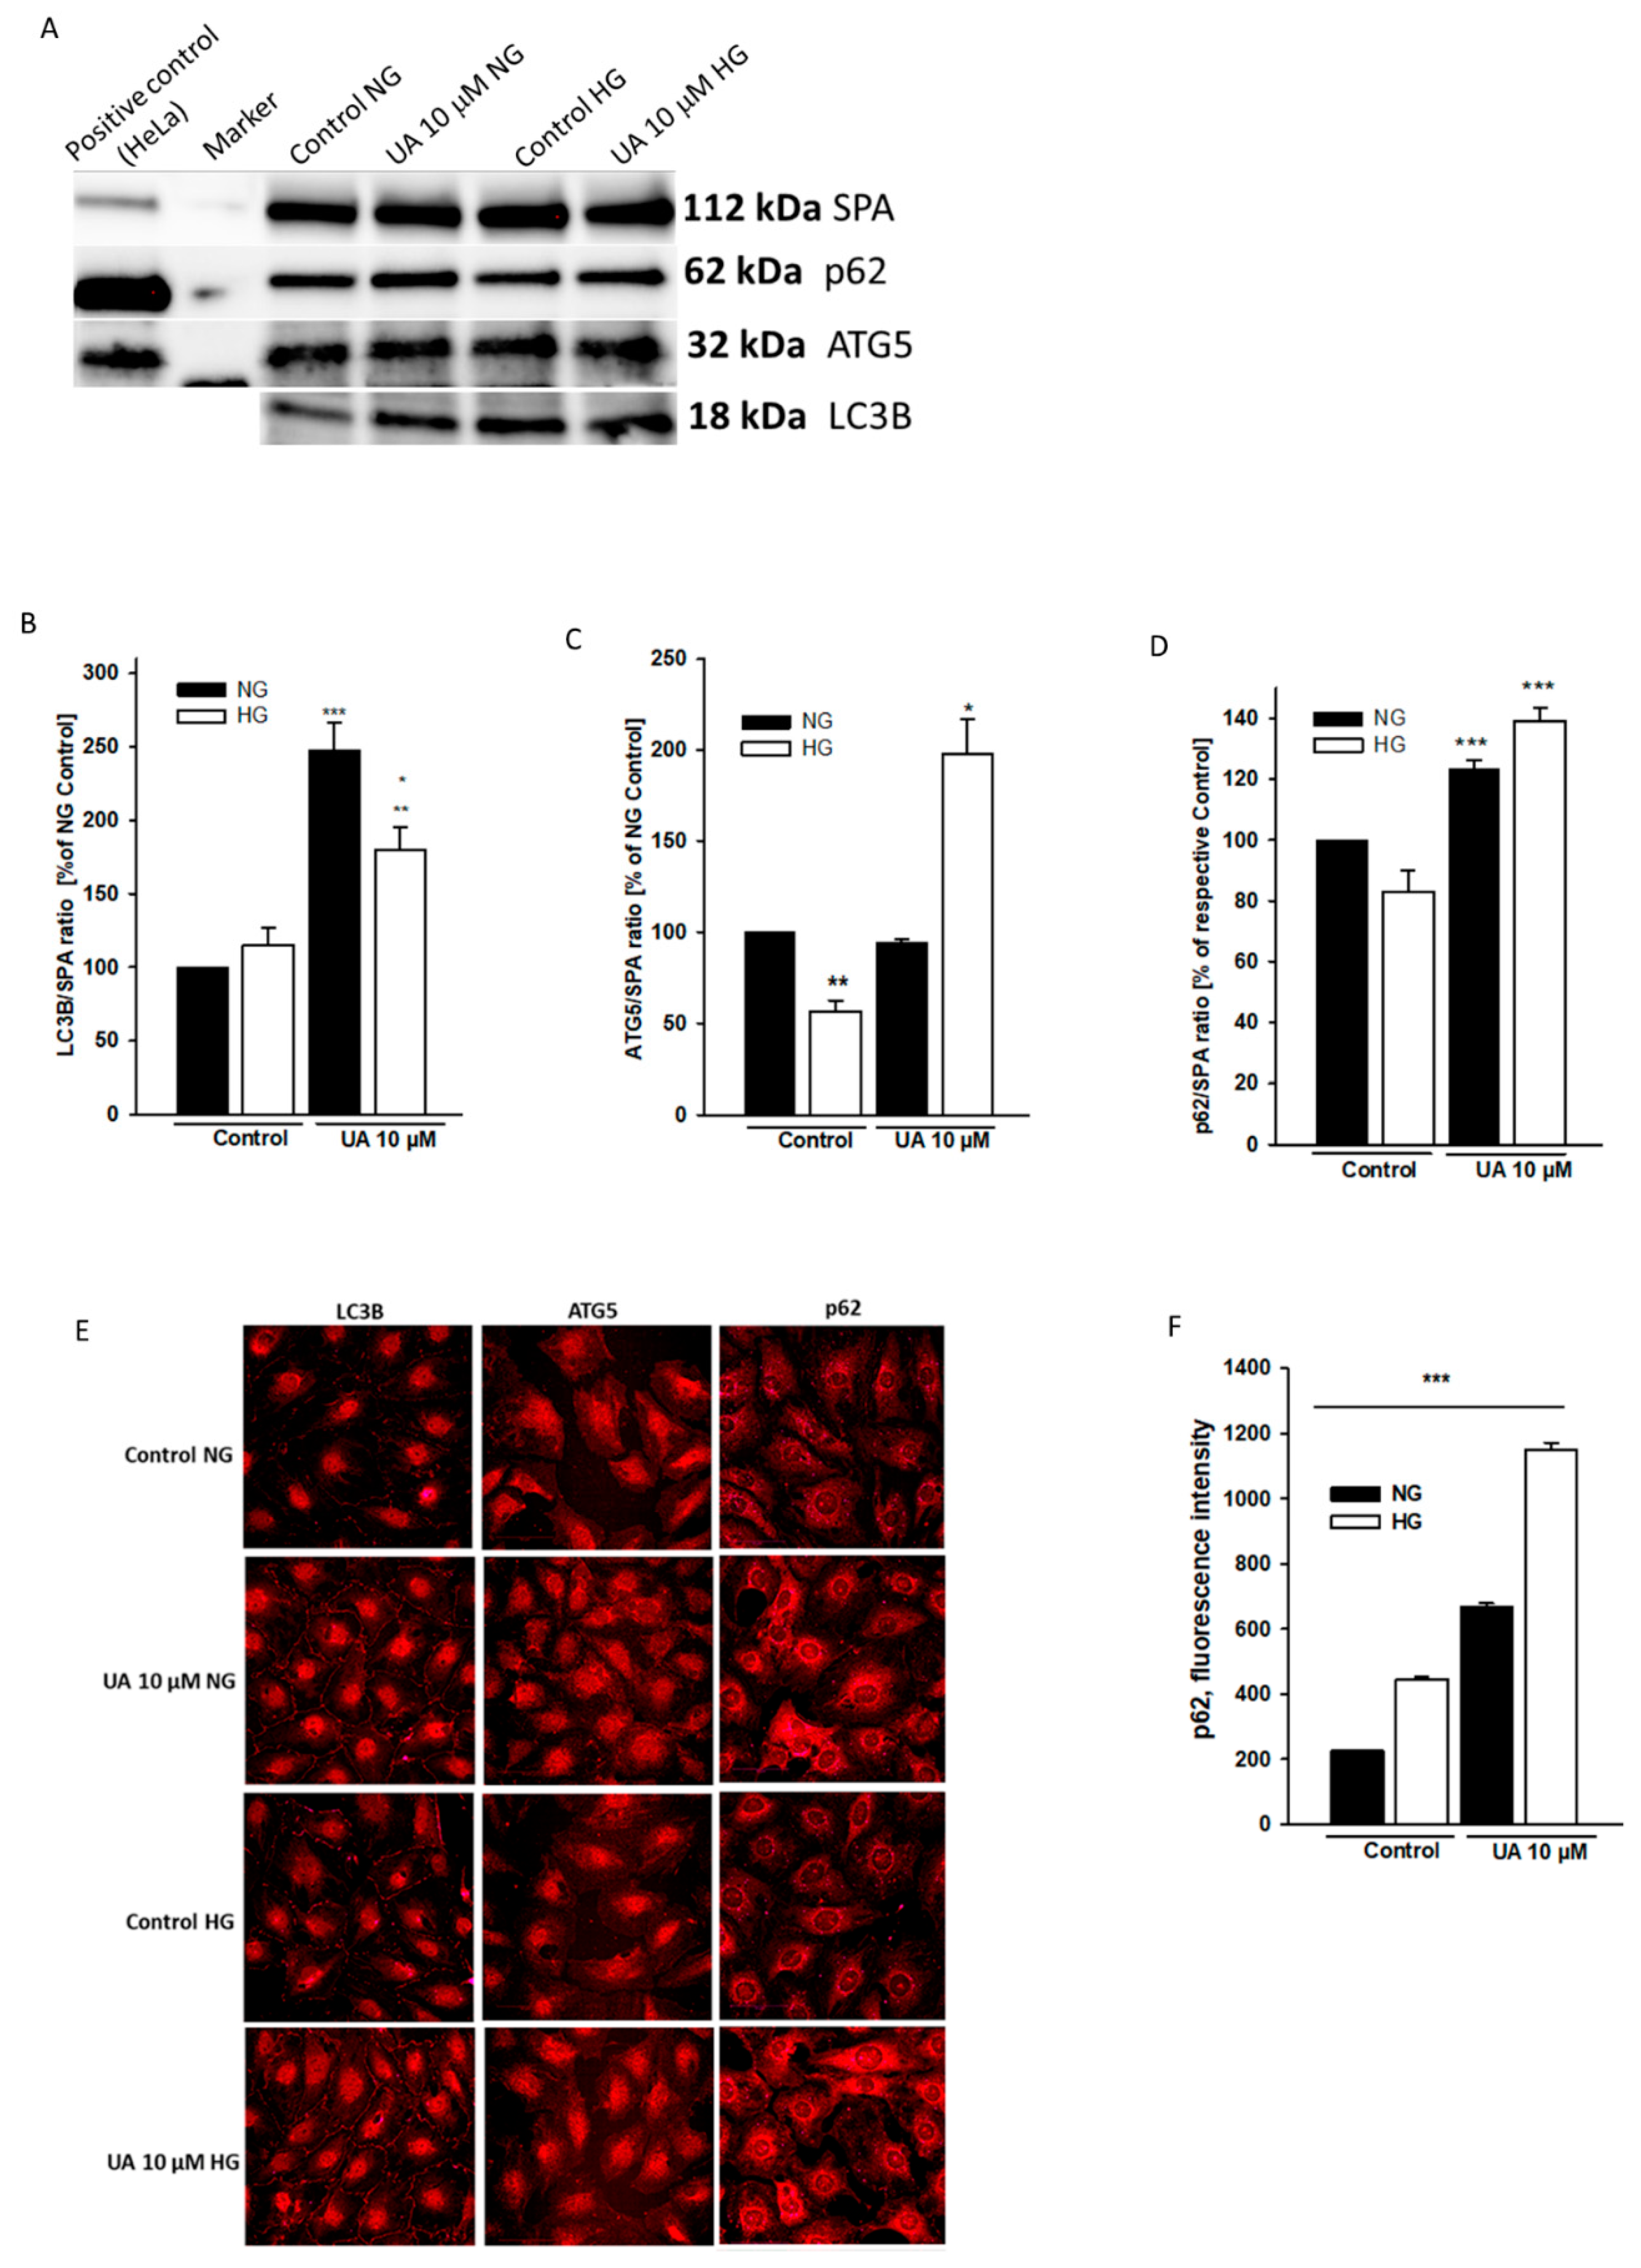
3.4. Urolithin A Modulates Expression of Autophagy-Related Proteins
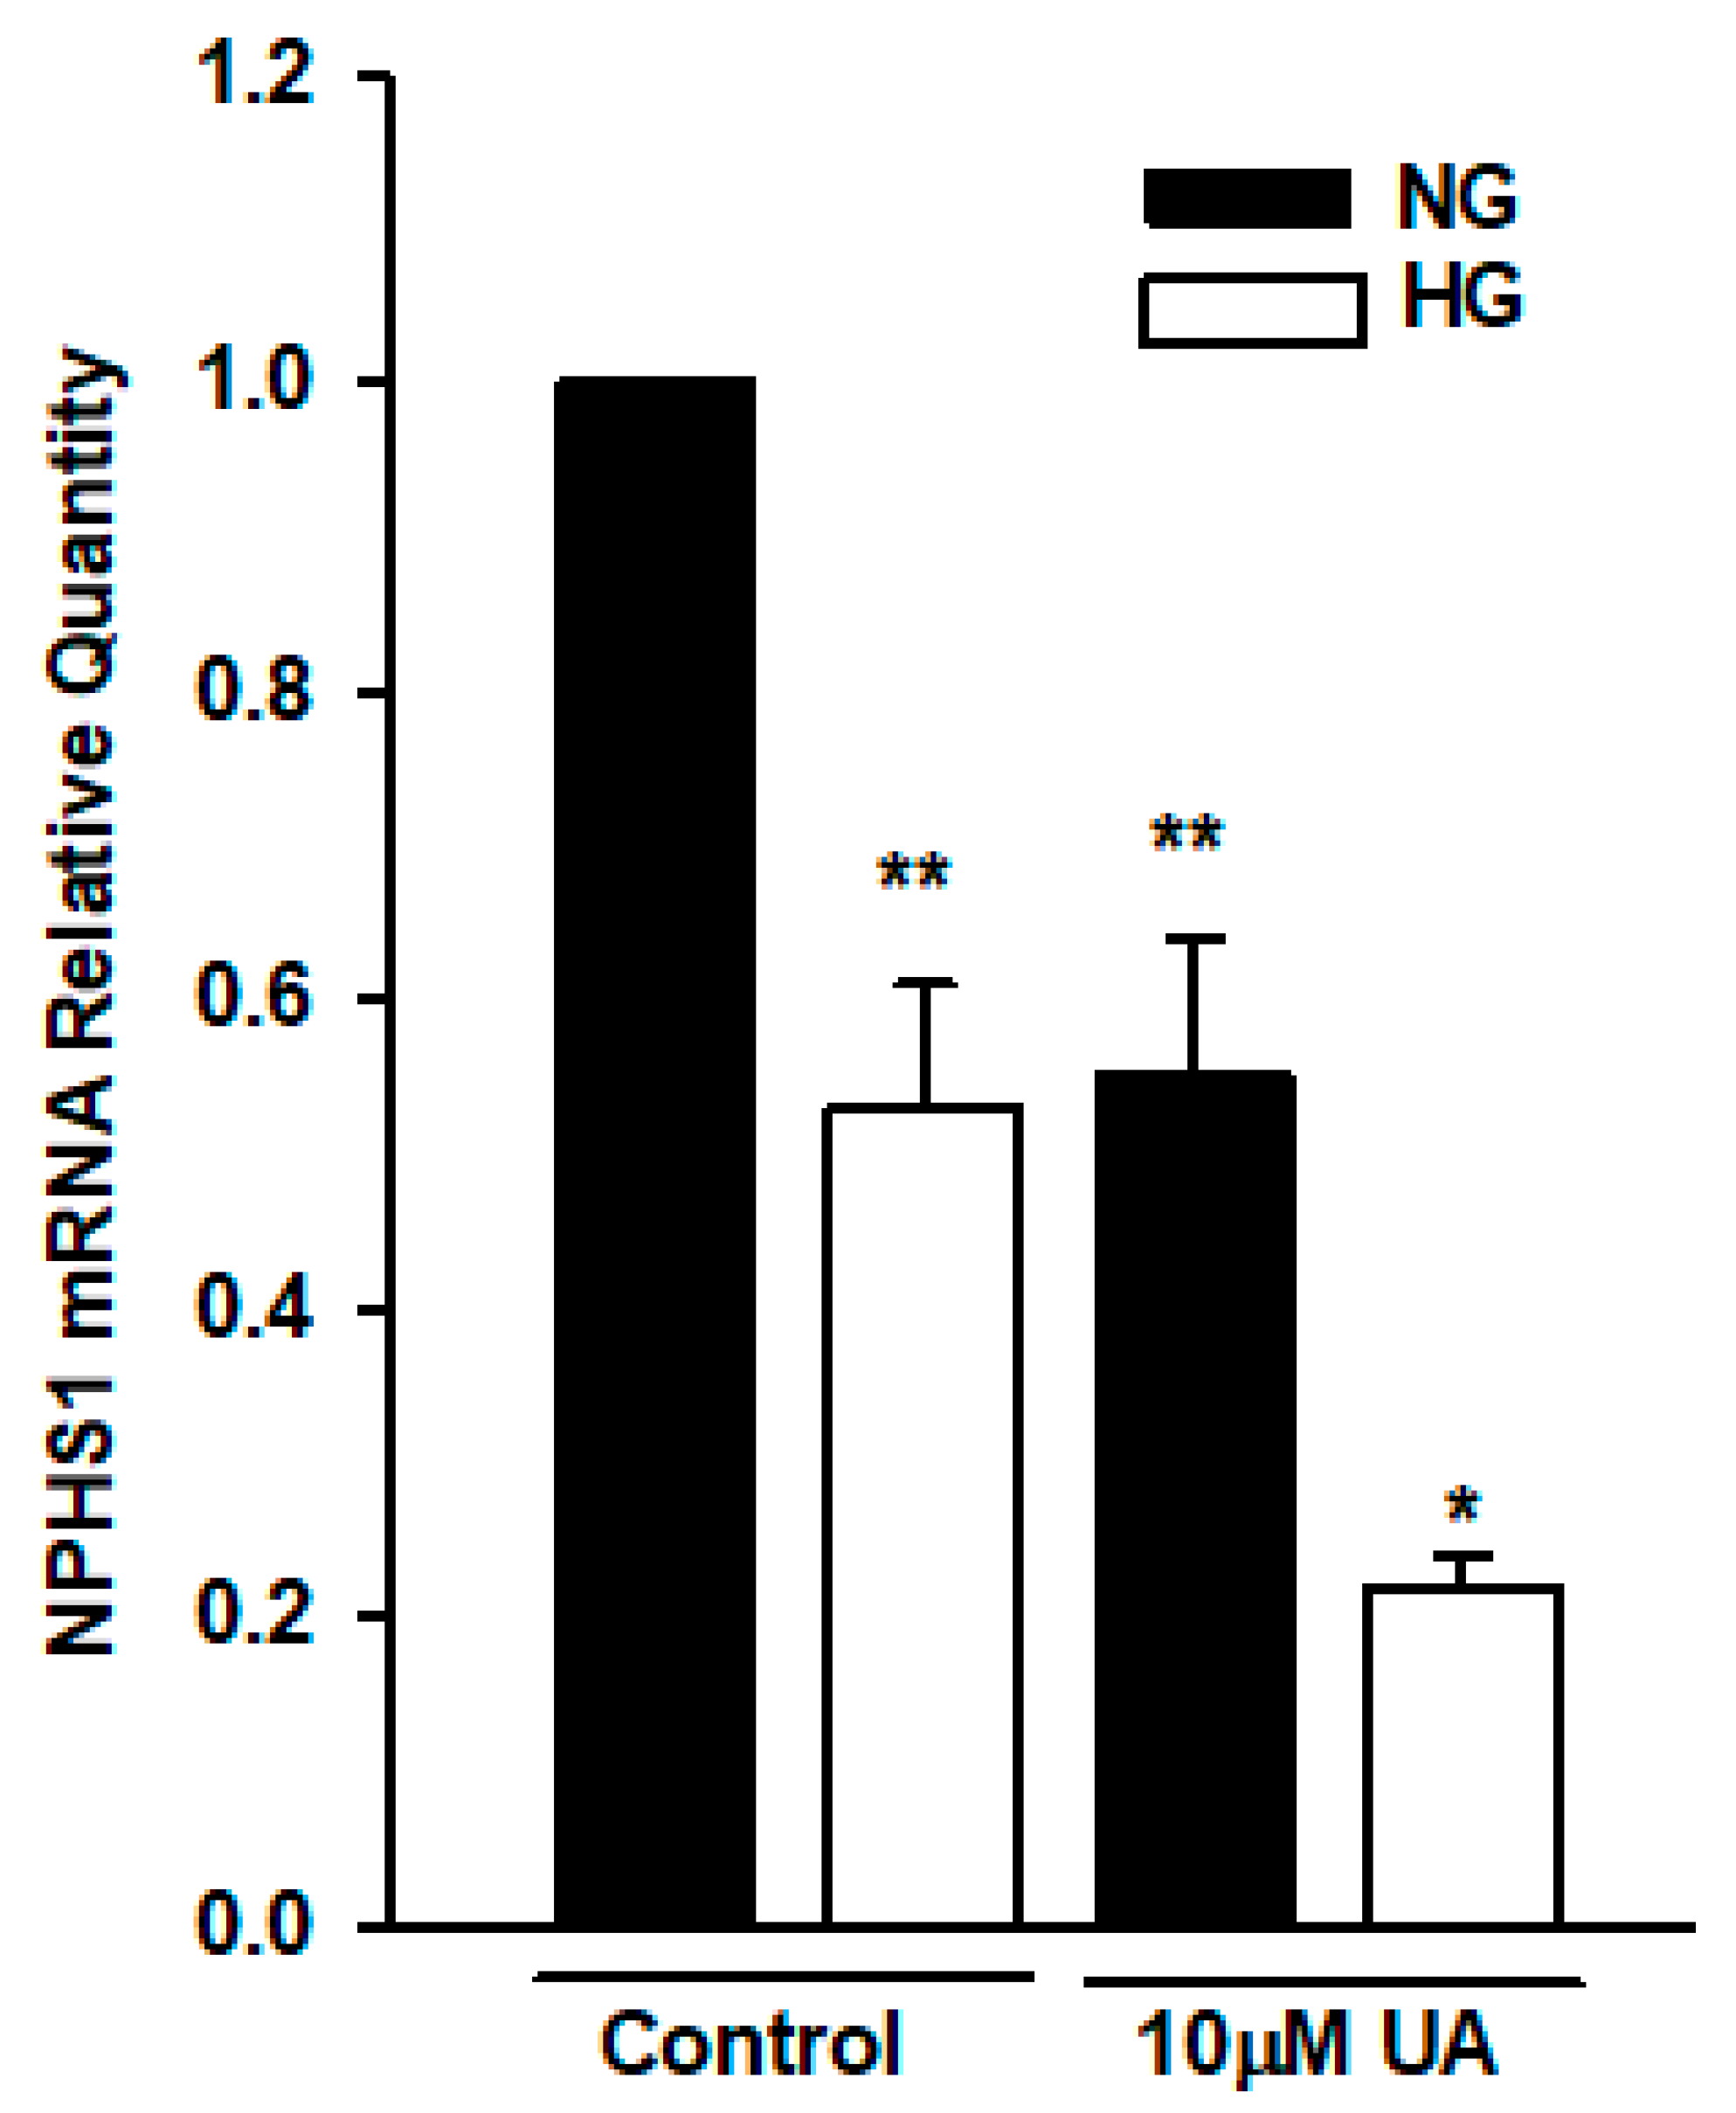
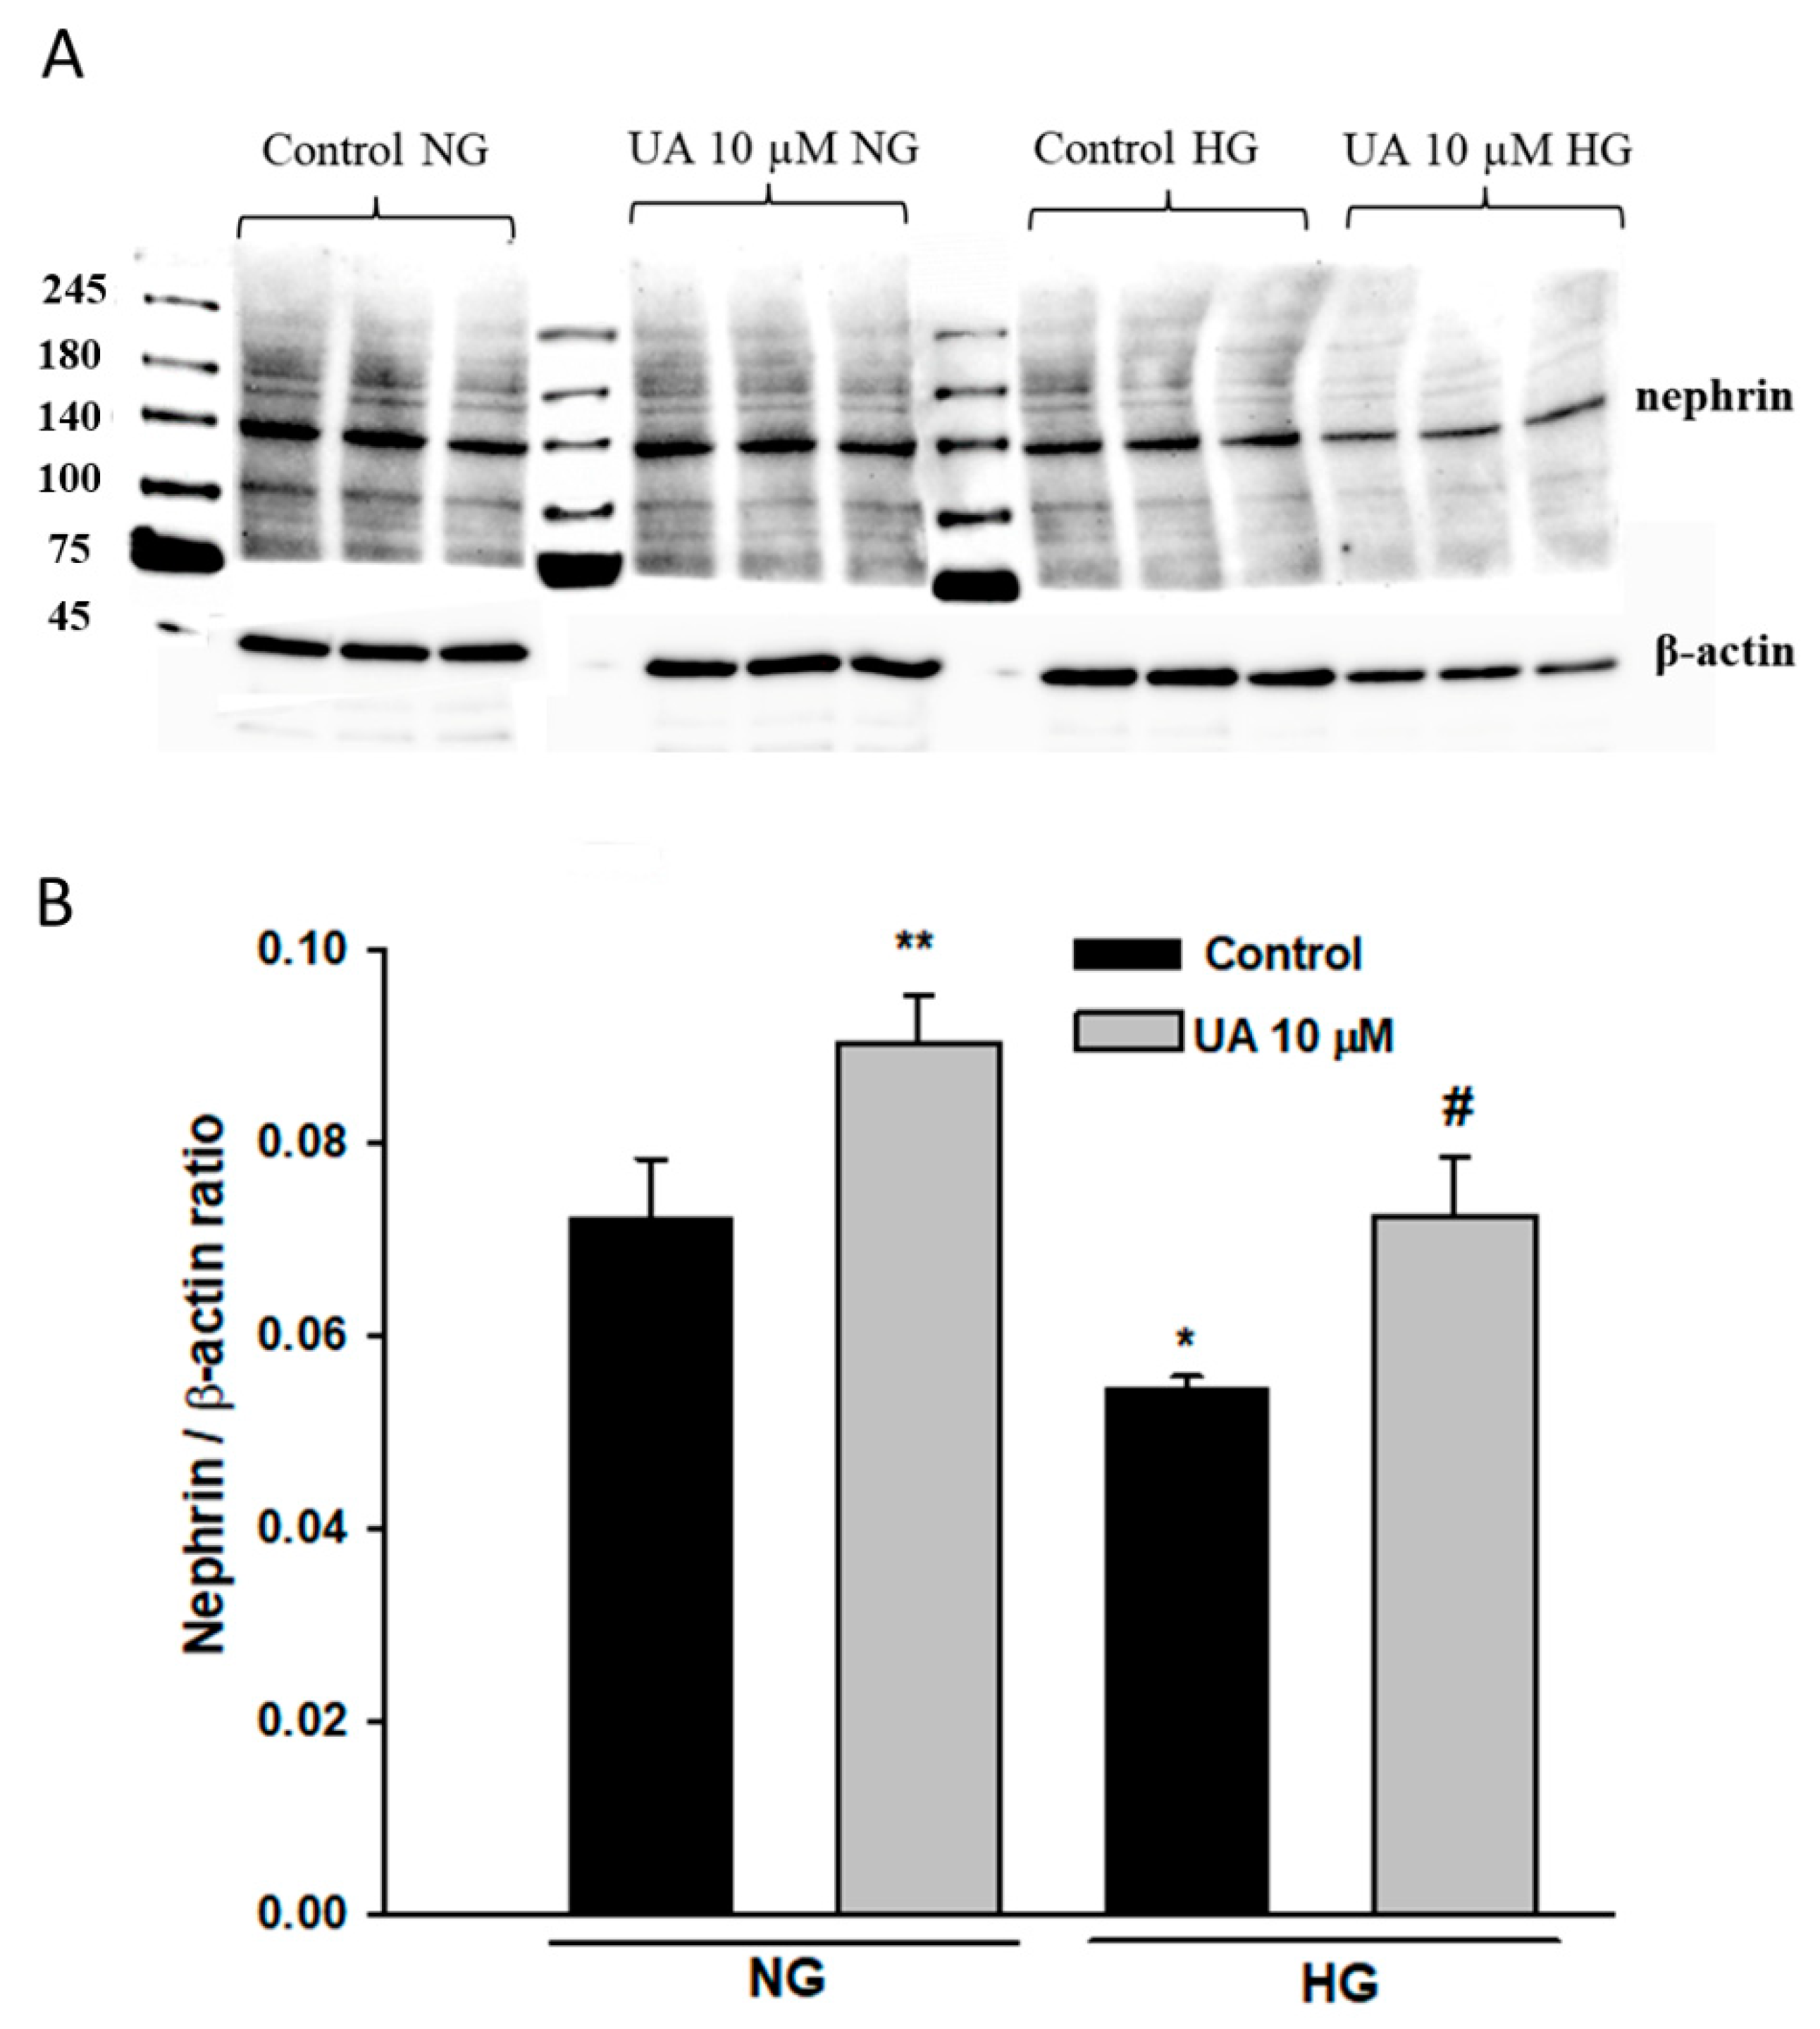
3.5. Urolithin A Upregulates Nephrin Protein but Reduces mRNA Expression
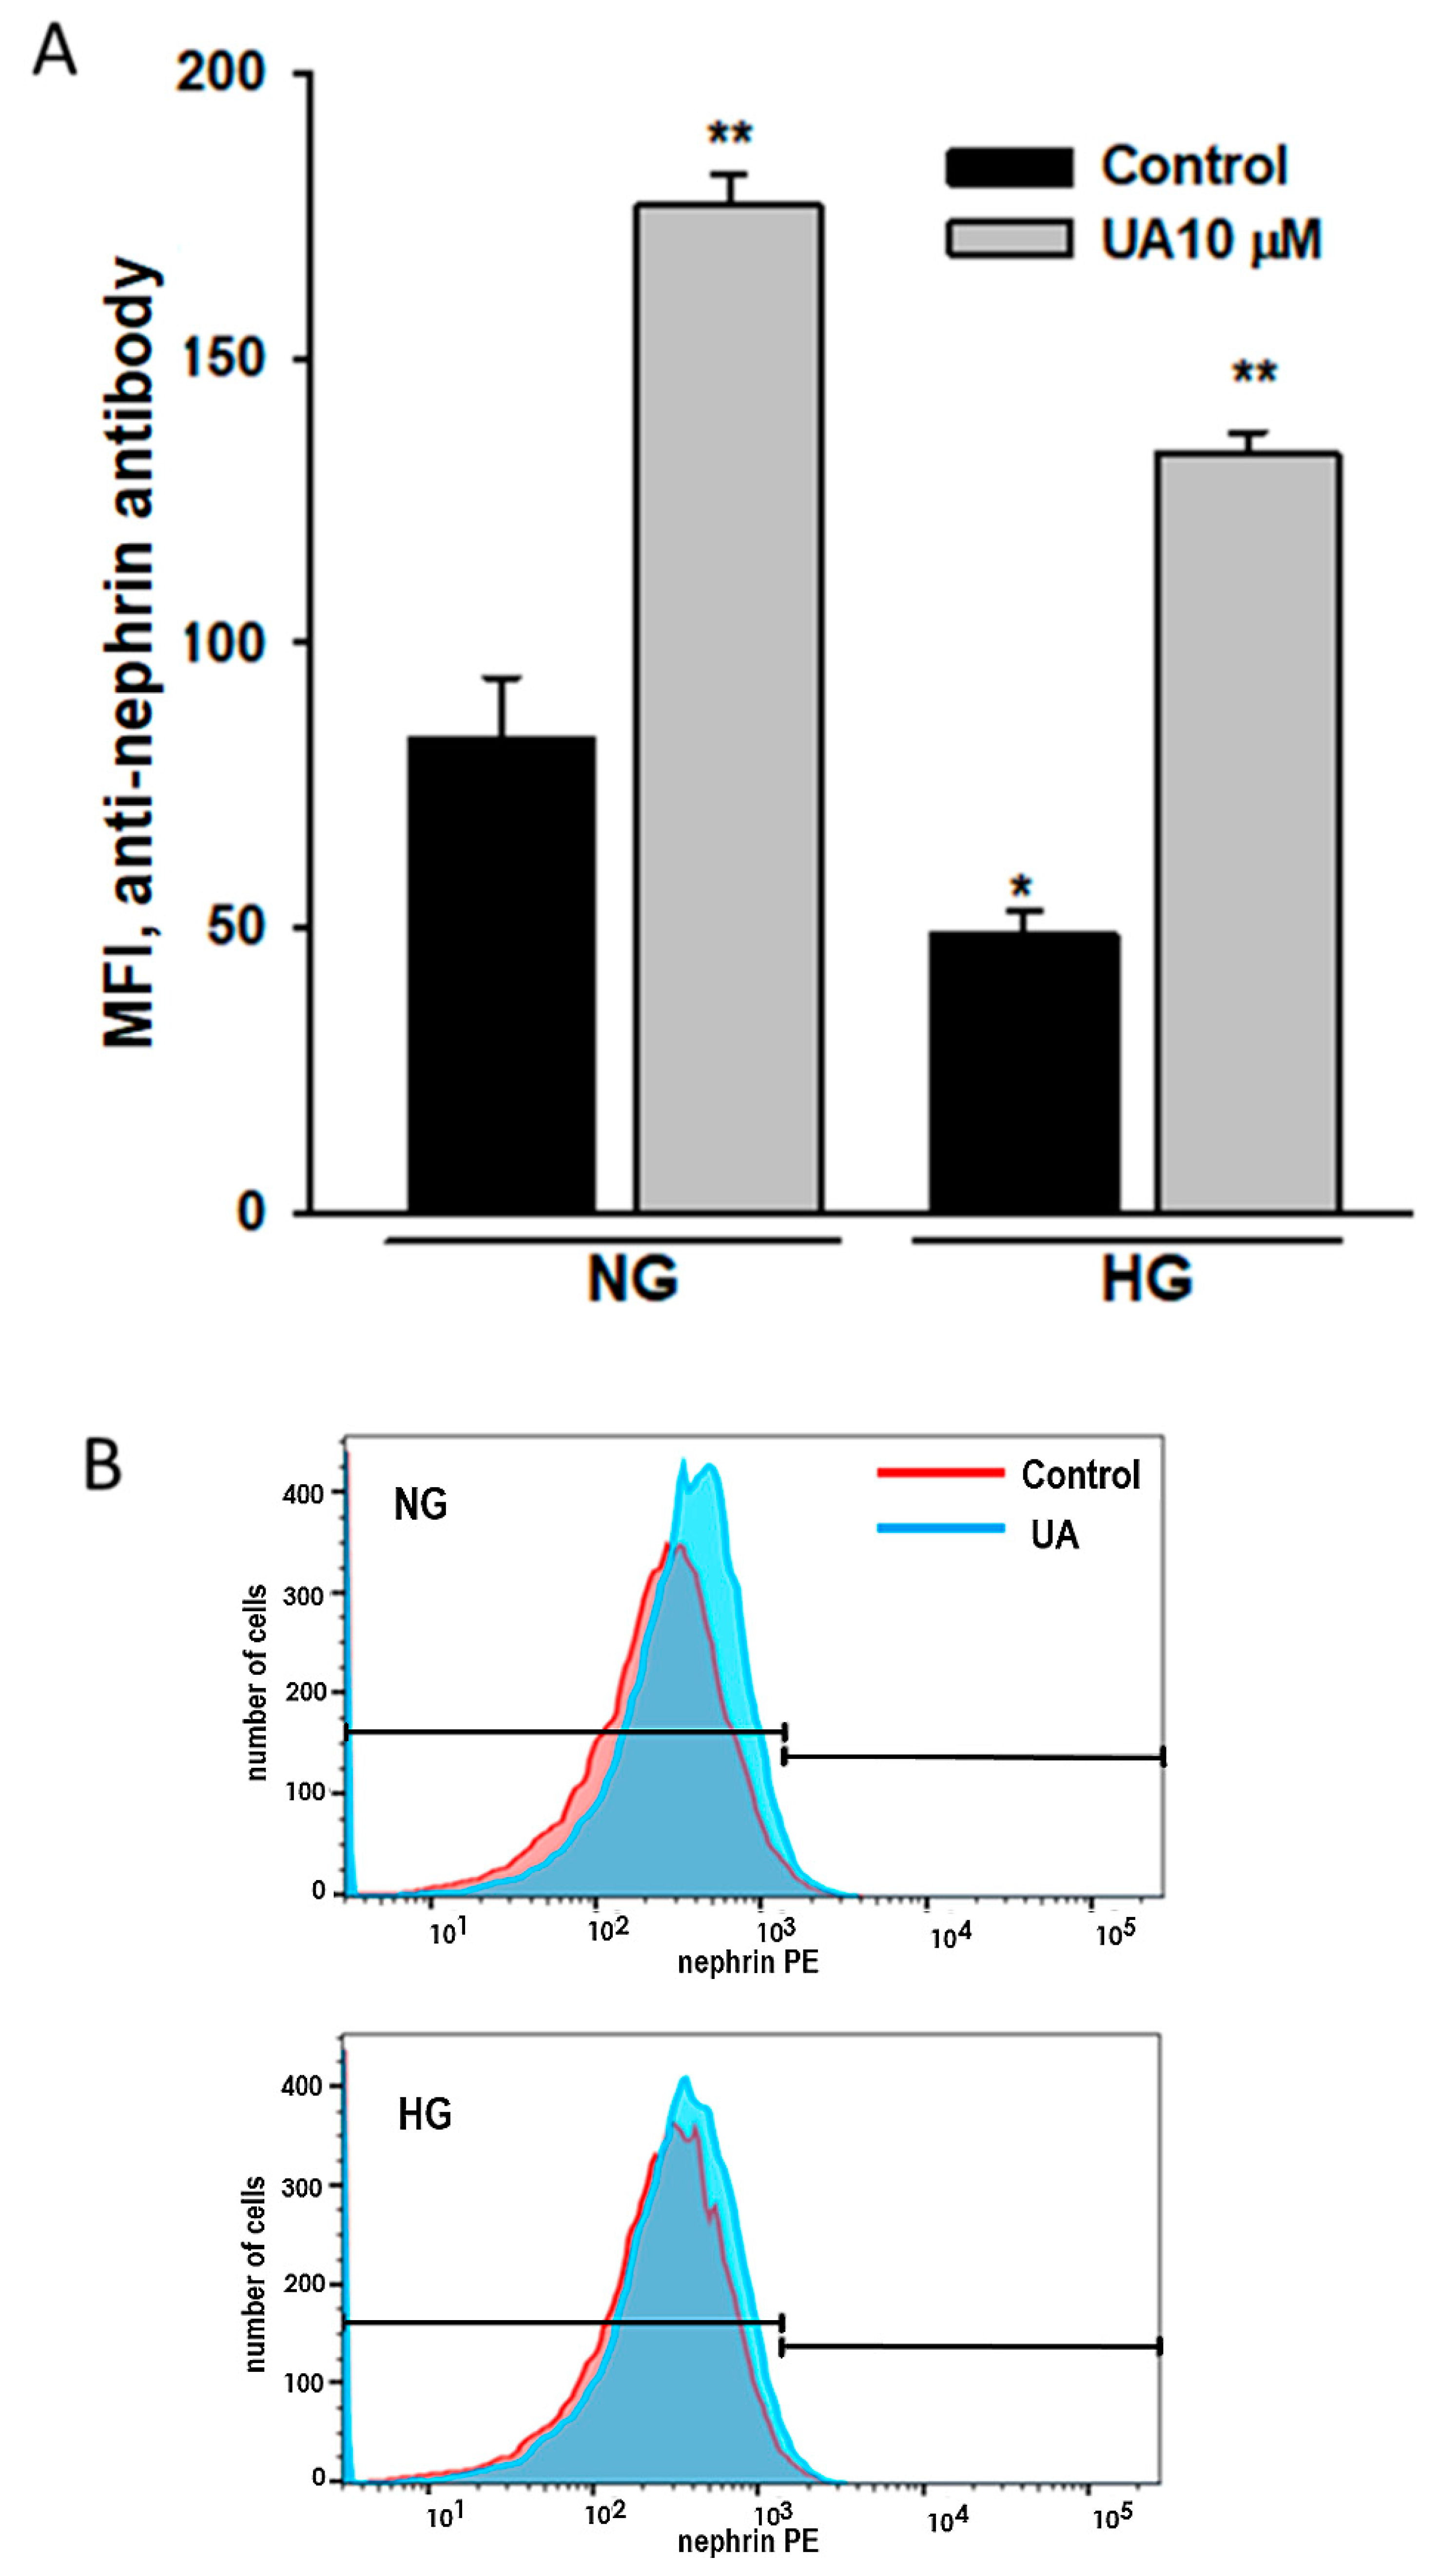
3.6. Urolithin A Upregulates Nephrin Expression at the Podocyte Surface
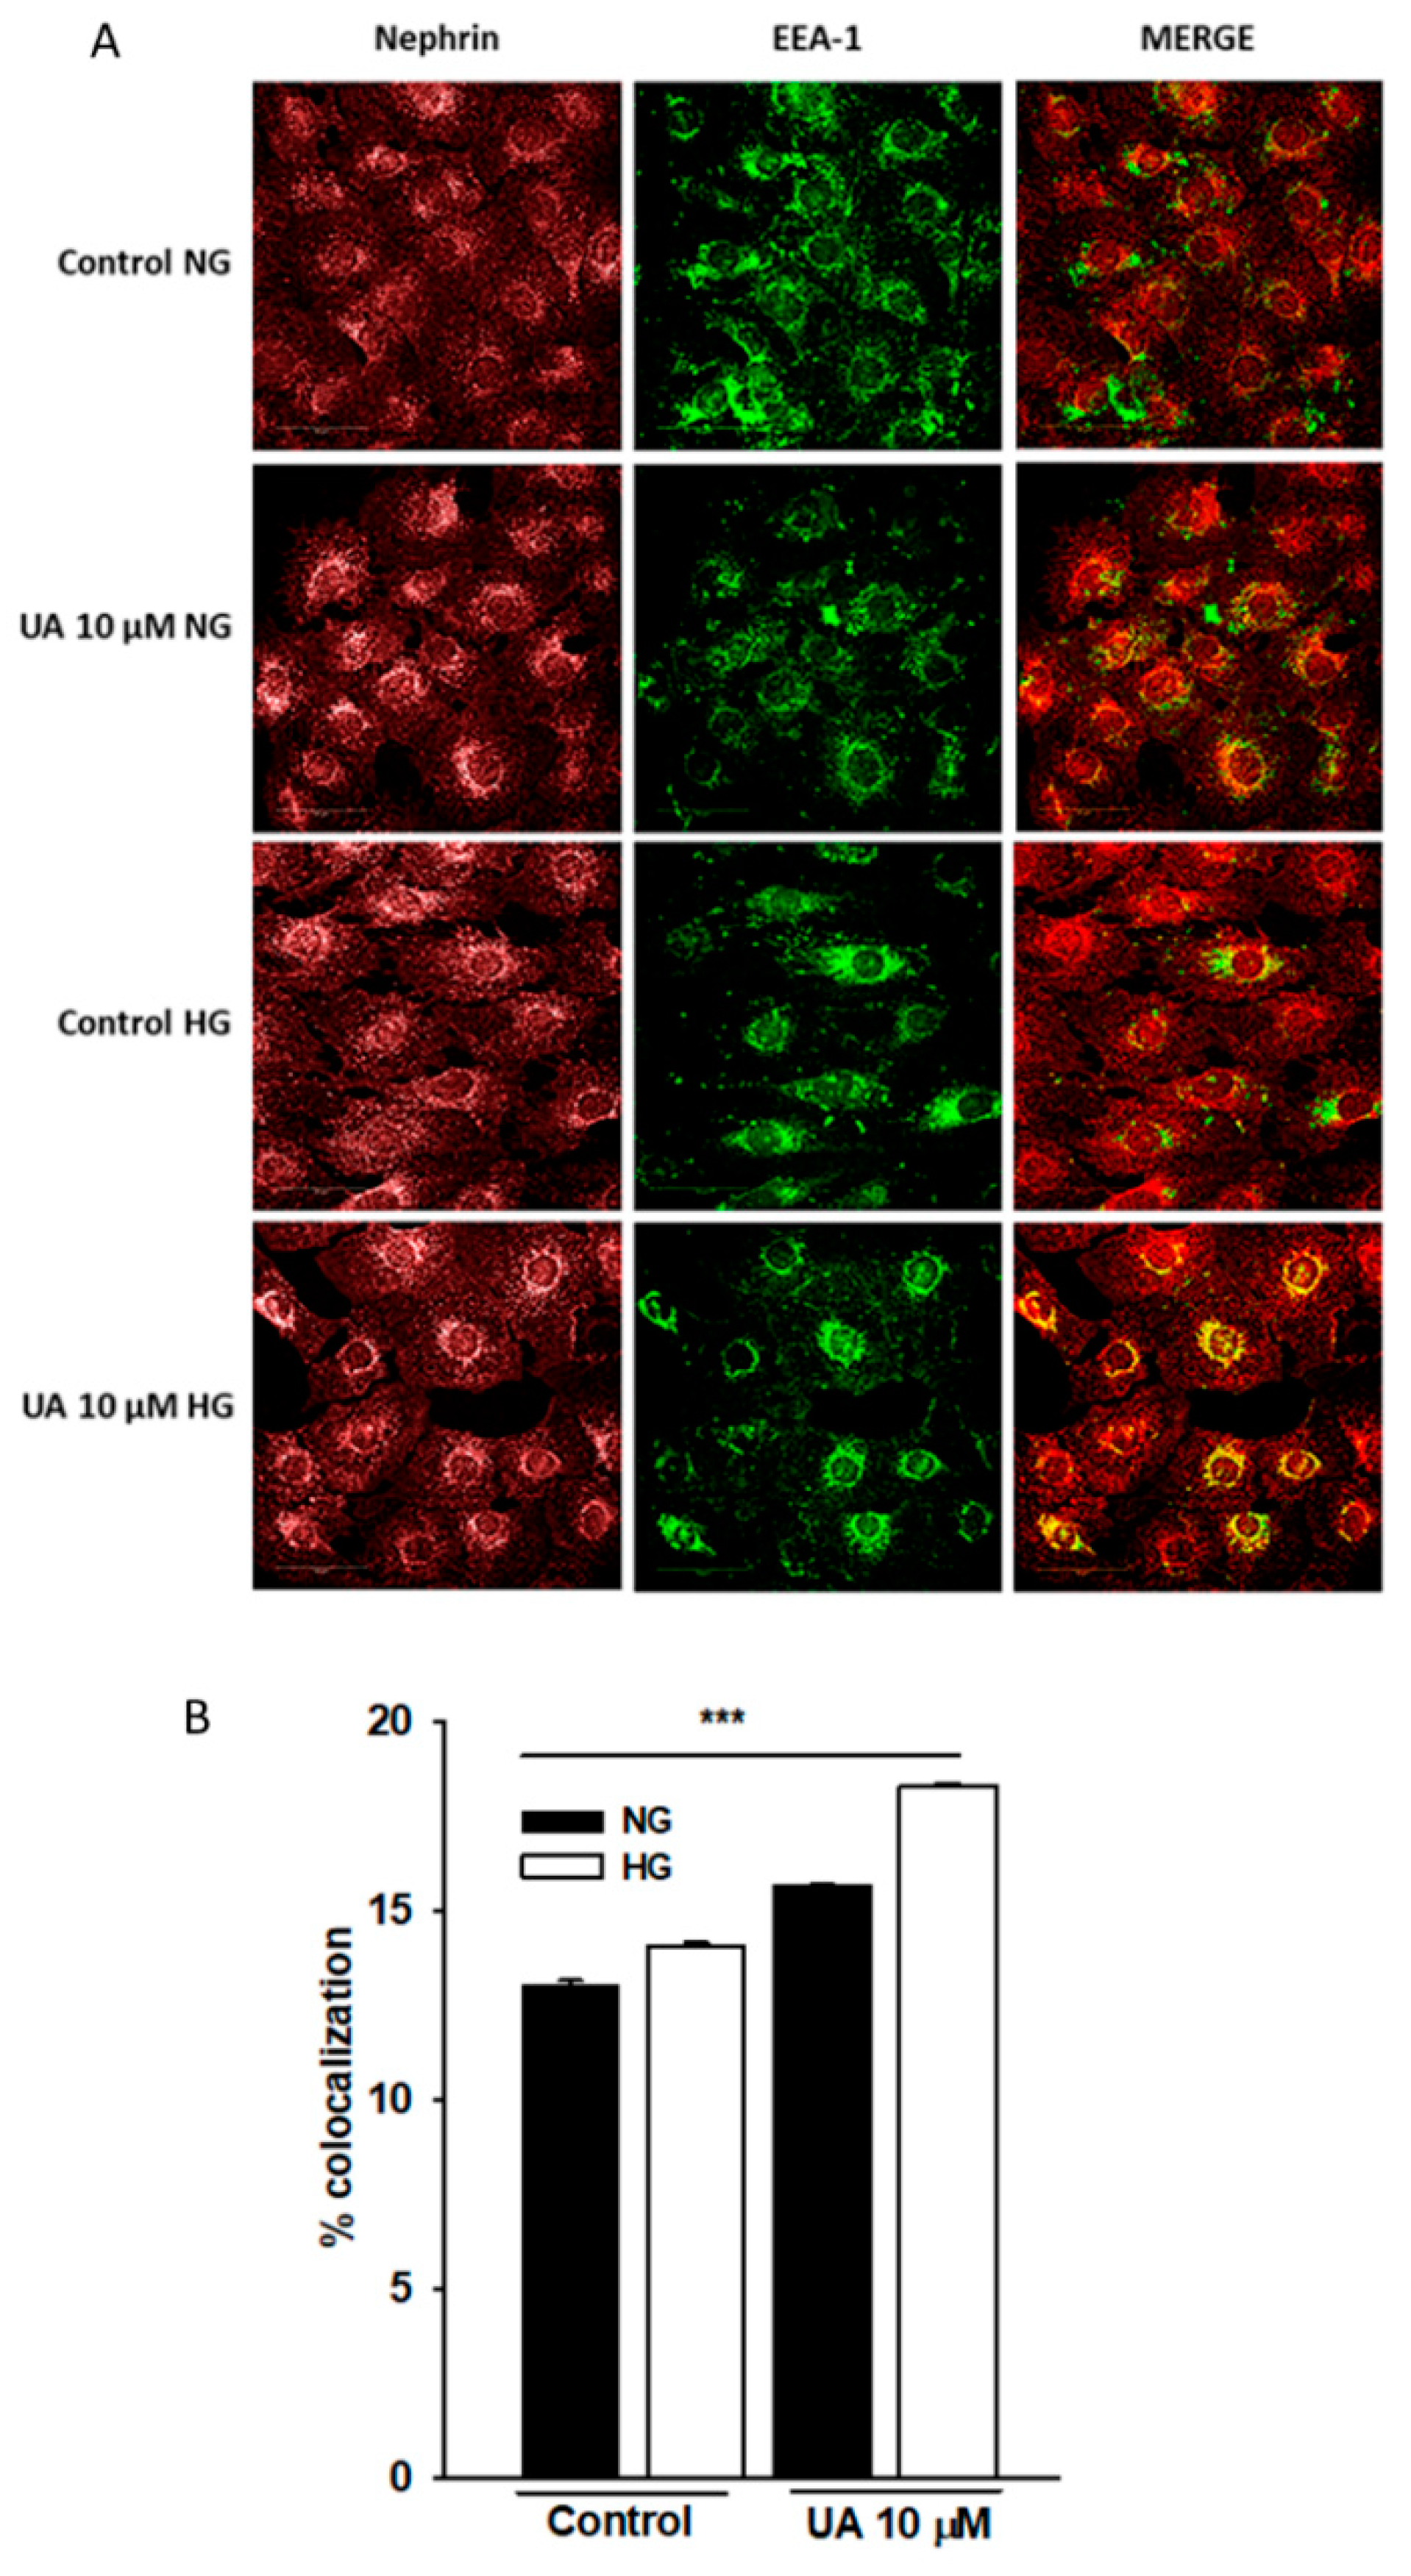
3.7. Intracellular Trafficking of Nephrin Is Modulated by Urolithin A
4. Discussion
Supplementary Materials
Author Contributions
Funding
Institutional Review Board Statement
Informed Consent Statement
Data Availability Statement
Acknowledgments
Conflicts of Interest
References
- Sun, H.; Saeedi, P.; Karuranga, S.; Pinkepank, M.; Ogurtsova, K.; Duncan, B.B.; Stein, C.; Basit, A.; Chan, J.C.N.; Mbanya, J.C.; et al. IDF Diabetes Atlas: Global, regional and country-level diabetes prevalence estimates for 2021 and projections for 2045. Diabetes Res. Clin. Pract. 2022, 183, 109119. [Google Scholar] [CrossRef]
- Tuttle, K.R.; Bakris, G.L.; Bilous, R.W.; Chiang, J.L.; de Boer, I.H.; Goldstein-Fuchs, J.; Hirsch, I.B.; Kalantar-Zadeh, K.; Narva, A.S.; Navaneethan, S.D.; et al. Diabetic kidney disease: A report from an ADA Consensus Conference. Diabetes Care 2014, 37, 2864–2883. [Google Scholar] [CrossRef] [PubMed]
- Pagtalunan, M.E.; Miller, P.L.; Jumping-Eagle, S.; Nelson, R.G.; Myers, B.D.; Rennke, H.G.; Coplon, N.S.; Sun, L.; Meyer, T.W. Podocyte loss and progressive glomerular injury in type II diabetes. J. Clin. Investig. 1997, 99, 342–348. [Google Scholar] [CrossRef]
- Kriz, W. Podocyte is the major culprit accounting for the progression of chronic renal disease. Microsc. Res. Tech. 2002, 57, 189–195. [Google Scholar] [CrossRef]
- Kravets, I.; Mallipattu, S.K. The Role of Podocytes and Podocyte-Associated Biomarkers in Diagnosis and Treatment of Diabetic Kidney Disease. J. Endocr. Soc. 2020, 4, bvaa029. [Google Scholar] [CrossRef] [PubMed]
- Marshall, S.M. The podocyte: A potential therapeutic target in diabetic nephropathy? Curr. Pharm. Des. 2007, 13, 2713–2720. [Google Scholar] [CrossRef] [PubMed]
- Liu, N.; Xu, L.; Shi, Y.; Zhuang, S. Podocyte Autophagy: A Potential Therapeutic Target to Prevent the Progression of Diabetic Nephropathy. J. Diabetes Res. 2017, 2017, 3560238. [Google Scholar] [CrossRef] [PubMed]
- Barutta, F.; Bellini, S.; Gruden, G. Mechanisms of podocyte injury and implications for diabetic nephropathy. Clin. Sci. 2022, 136, 493–520. [Google Scholar] [CrossRef] [PubMed]
- Espín, J.C.; Larrosa, M.; García-Conesa, M.T.; Tomás-Barberán, F. Biological Significance of Urolithins, the Gut Microbial Ellagic Acid-Derived Metabolites: The Evidence So Far. Evid.-Based Complement. Altern. Med. 2013, 2013, 270418. [Google Scholar] [CrossRef] [PubMed]
- Toney, A.M.; Fox, D.; Chaidez, V.; Ramer-Tait, A.E.; Chung, S. Immunomodulatory Role of Urolithin A on Metabolic Diseases. Biomedicines 2021, 9, 192. [Google Scholar] [CrossRef] [PubMed]
- García-Villalba, R.; Giménez-Bastida, J.A.; Cortés-Martín, A.; Ávila-Gálvez, M.Á.; Tomás-Barberán, F.A.; Selma, M.V.; Espín, J.C.; González-Sarrías, A. Urolithins: A Comprehensive Update on their Metabolism, Bioactivity, and Associated Gut Microbiota. Mol. Nutr. Food Res. 2022, 2101019. [Google Scholar] [CrossRef]
- Ávila-Gálvez, M.Á.; Espín, J.C.; González-Sarrías, A. Physiological Relevance of the Antiproliferative and Estrogenic Effects of Dietary Polyphenol Aglycones versus Their Phase-II Metabolites on Breast Cancer Cells: A Call of Caution. J. Agric. Food Chem. 2018, 66, 8547–8555. [Google Scholar] [CrossRef]
- Tomás-Barberán, F.A.; García-Villalba, R.; González-Sarrías, A.; Selma, M.V.; Espín, J.C. Ellagic Acid Metabolism by Human Gut Microbiota: Consistent Observation of Three Urolithin Phenotypes in Intervention Trials, Independent of Food Source, Age, and Health Status. J. Agric. Food Chem. 2014, 62, 6535–6538. [Google Scholar] [CrossRef]
- García-Villalba, R.; Beltrán, D.; Frutos, M.D.; Selma, M.V.; Espín, J.C.; Tomás-Barberán, F.A. Metabolism of different dietary phenolic compounds by the urolithin-producing human-gut bacteria Gordonibacter urolithinfaciens and Ellagibacter isourolithinifaciens. Food Funct. 2020, 11, 7012–7022. [Google Scholar] [CrossRef]
- Hasheminezhad, S.H.; Boozari, M.; Iranshahi, M.; Yazarlu, O.; Sahebkar, A.; Hasanpour, M.; Iranshahy, M. A mechanistic insight into the biological activities of urolithins as gut microbial metabolites of ellagitannins. Phytother. Res. 2022, 36, 112–146. [Google Scholar] [CrossRef] [PubMed]
- Vini, R.; Azeez, J.M.; Remadevi, V.; Susmi, T.R.; Ayswarya, R.S.; Sujatha, A.S.; Muraleedharan, P.; Lathika, L.M.; Sreeharshan, S. Urolithins: The Colon Microbiota Metabolites as Endocrine Modulators: Prospects and Perspectives. Front. Nutr. 2022, 8, 800990. [Google Scholar] [CrossRef] [PubMed]
- Kotewicz, M.; Lewko, B. Urolithins and their possible implications for diabetic kidney. Eur. J. Transl. Clin. Med. 2020, 5, 53–63. [Google Scholar] [CrossRef]
- Andreux, P.A.; Blanco-Bose, W.; Ryu, D.; Burdet, F.; Ibberson, M.; Aebischer, P.; Auwerx, J.; Singh, A.; Rinsch, C. The mitophagy activator urolithin A is safe and induces a molecular signature of improved mitochondrial and cellular health in humans. Nat. Metab. 2019, 1, 595–603. [Google Scholar] [CrossRef]
- Cheng, Z.; Tu, J.; Zhang, H.; Zhang, Y.; Zhou, B. Urolithin A attenuates renal fibrosis by inhibiting TGF-β1/Smad and MAPK signaling pathways. J. Funct. Foods 2021, 83, 104547. [Google Scholar] [CrossRef]
- Bialonska, D.; Kasimsetty, S.G.; Khan, S.I.; Ferreira, D. Urolithins, intestinal microbial metabolites of Pomegranate ellagitannins, exhibit potent antioxidant activity in a cell-based assay. J. Agric. Food Chem. 2009, 57, 10181–10186. [Google Scholar] [CrossRef]
- Kobayashi, N.; Reiser, J.; Schwarz, K.; Sakai, T.; Kriz, W.; Mundel, P. Process formation of podocytes: Morphogenetic activity of microtubules and regulation by protein serine/threonine phosphatase PP2A. Histochem. Cell Biol. 2001, 115, 255–266. [Google Scholar] [CrossRef]
- Sala, R.; Mena, P.; Savi, M.; Brighenti, F.; Crozier, A.; Miragoli, M.; Stilli, D.; Del Rio, D. Urolithins at physiological concentrations affect the levels of pro-inflammatory cytokines and growth factor in cultured cardiac cells in hyperglucidic conditions. J. Funct. Foods 2015, 15, 97–105. [Google Scholar] [CrossRef]
- García-Villalba, R.; Espín, J.C.; Tomás-Barberán, F.A. Chromatographic and spectroscopic characterization of urolithins for their determination in biological samples after the intake of foods containing ellagitannins and ellagic acid. J. Chromatogr. A 2016, 1428, 162–175. [Google Scholar] [CrossRef]
- Booth, B.P.; Simon, W.C. Analytical method validation. In New Drug Development: Regulatory Paradigms for Clinical Pharmacology and Biopharmaceutics; CRC Press: Boca Raton, FL, USA, 2016; pp. 138–159. [Google Scholar] [CrossRef]
- Endlich, N.; Schordan, E.; Cohen, C.D.; Kretzler, M.; Lewko, B.; Welsch, T.; Kriz, W.; Otey, C.A.; Endlich, K. Palladin is a dynamic actin-associated protein in podocytes. Kidney Int. 2009, 75, 214–226. [Google Scholar] [CrossRef]
- Aragonès, G.; Danesi, F.; Del Rio, D.; Mena, P. The importance of studying cell metabolism when testing the bioactivity of phenolic compounds. Trends Food Sci. Technol. 2017, 69, 230–242. [Google Scholar] [CrossRef]
- Adachi, S.; Sasaki, K.; Kondo, S.; Komatsu, W.; Yoshizawa, F.; Isoda, H.; Yagasaki, K. Antihyperuricemic Effect of Urolithin A in Cultured Hepatocytes and Model Mice. Molecules 2020, 25, 5136. [Google Scholar] [CrossRef]
- Abdelazeem, K.N.M.; Kalo, M.Z.; Beer-Hammer, S.; Lang, F. The gut microbiota metabolite urolithin A inhibits NF-κB activation in LPS stimulated BMDMs. Sci. Rep. 2021, 11, 7117. [Google Scholar] [CrossRef]
- Cásedas, G.; Les, F.; Choya-Foces, C.; Hugo, M.; López, V. The Metabolite Urolithin-A Ameliorates Oxidative Stress in Neuro-2a Cells, Becoming a Potential Neuroprotective Agent. Antioxidants 2020, 9, 177. [Google Scholar] [CrossRef]
- Welsh, G.I.; Saleem, M.A. The podocyte cytoskeleton—Key to a functioning glomerulus in health and disease. Nat. Rev. Nephrol. 2012, 8, 14–21. [Google Scholar] [CrossRef]
- Hardwick, J.M.; Soane, L. Multiple Functions of BCL-2 Family Proteins. Cold Spring Harb. Perspect. Biol. 2013, 5, a008722. [Google Scholar] [CrossRef]
- Cory, S.; Adams, J.M. The Bcl2 family: Regulators of the cellular life-or-death switch. Nat. Rev. Cancer 2002, 2, 647–656. [Google Scholar] [CrossRef]
- Ziyadeh, F.; Wolf, G. Pathogenesis of the Podocytopathy and Proteinuria in Diabetic Glomerulopathy. Curr. Diabetes Rev. 2008, 4, 39–45. [Google Scholar] [CrossRef]
- Lei, J.; Zhao, L.; Zhang, Y.; Wu, Y.; Liu, Y. High Glucose-Induced Podocyte Injury Involves Activation of Mammalian Target of Rapamycin (mTOR)-Induced Endoplasmic Reticulum (ER) Stress. Cell. Physiol. Biochem. 2018, 45, 2431–2443. [Google Scholar] [CrossRef]
- Susztak, K.; Raff, A.C.; Schiffer, M.; Böttinger, E.P. Glucose-Induced Reactive Oxygen Species Cause Apoptosis of Podocytes and Podocyte Depletion at the Onset of Diabetic Nephropathy. Diabetes 2006, 55, 225–233. [Google Scholar] [CrossRef] [PubMed]
- Djedjibegovic, J.; Marjanovic, A.; Panieri, E.; Saso, L. Ellagic Acid-Derived Urolithins as Modulators of Oxidative Stress. Oxidative Med. Cell. Longev. 2020, 2020, 5194508. [Google Scholar] [CrossRef]
- Kannan, K.; Jain, S.K. Oxidative stress and apoptosis. Pathophysiology 2000, 7, 153–163. [Google Scholar] [CrossRef]
- Mariño, G.; Niso-Santano, M.; Baehrecke, E.H.; Kroemer, G. Self-consumption: The interplay of autophagy and apoptosis. Nat. Rev. Mol. Cell Biol. 2014, 15, 81–94. [Google Scholar] [CrossRef] [PubMed]
- Jung, S.; Jeong, H.; Yu, S.-W. Autophagy as a decisive process for cell death. Exp. Mol. Med. 2020, 52, 921–930. [Google Scholar] [CrossRef]
- Tagawa, A.; Yasuda, M.; Kume, S.; Yamahara, K.; Nakazawa, J.; Chin-Kanasaki, M.; Araki, H.; Araki, S.; Koya, D.; Asanuma, K.; et al. Impaired Podocyte Autophagy Exacerbates Proteinuria in Diabetic Nephropathy. Diabetes 2016, 65, 755–767. [Google Scholar] [CrossRef]
- Audzeyenka, I.; Rogacka, D.; Piwkowska, A.; Angielski, S.; Jankowski, M. Viability of primary cultured podocytes is associated with extracellular high glucose-dependent autophagy downregulation. Mol. Cell. Biochem. 2017, 430, 11–19. [Google Scholar] [CrossRef]
- Ma, T.; Zhu, J.; Chen, X.; Zha, D.; Singhal, P.C.; Ding, G. High glucose induces autophagy in podocytes. Exp. Cell Res. 2013, 319, 779–789. [Google Scholar] [CrossRef]
- Lenoir, O.; Jasiek, M.; Hénique, C.; Guyonnet, L.; Hartleben, B.; Bork, T.; Chipont, A.; Flosseau, K.; Bensaada, I.; Schmitt, A.; et al. Endothelial cell and podocyte autophagy synergistically protect from diabetes-induced glomerulosclerosis. Autophagy 2015, 11, 1130–1145. [Google Scholar] [CrossRef]
- Al-Harbi, S.A.; Abdulrahman, A.O.; Zamzami, M.A.; Khan, M.I. Urolithins: The Gut Based Polyphenol Metabolites of Ellagitannins in Cancer Prevention, a Review. Front. Nutr. 2021, 8, 647582. [Google Scholar] [CrossRef]
- Boakye, Y.D.; Groyer, L.; Heiss, E.H. An increased autophagic flux contributes to the anti-inflammatory potential of urolithin A in macrophages. Biochim. Biophys. Acta Gen. Subj. 2018, 1862, 61–70. [Google Scholar] [CrossRef]
- Kroemer, G.; Mariño, G.; Levine, B. Autophagy and the Integrated Stress Response. Mol. Cell 2010, 40, 280–293. [Google Scholar] [CrossRef]
- Hayashi, D.; Wang, L.; Ueda, S.; Yamanoue, M.; Ashida, H.; Shirai, Y. The mechanisms of ameliorating effect of a green tea polyphenol on diabetic nephropathy based on diacylglycerol kinase α. Sci. Rep. 2020, 10, 11790. [Google Scholar] [CrossRef]
- Pan, Q.-R.; Ren, Y.-L.; Zhu, J.-J.; Hu, Y.-J.; Zheng, J.-S.; Fan, H.; Xu, Y.; Wang, G.; Liu, W.-X. Resveratrol Increases Nephrin and Podocin Expression and Alleviates Renal Damage in Rats Fed a High-Fat Diet. Nutrients 2014, 6, 2619–2631. [Google Scholar] [CrossRef]
- González-Sarrías, A.; Espín, J.-C.; Tomás-Barberán, F.A.; García-Conesa, M.-T. Gene expression, cell cycle arrest and MAPK signalling regulation in Caco-2 cells exposed to ellagic acid and its metabolites, urolithins. Mol. Nutr. Food Res. 2009, 53, 686–698. [Google Scholar] [CrossRef]
- Cerdá, B.; Espín, J.C.; Parra, S.; Martínez, P.; Tomás-Barberán, F.A. The potent in vitro antioxidant ellagitannins from pomegranate juice are metabolised into bioavailable but poor antioxidant hydroxy–6H–dibenzopyran–6–one derivatives by the colonic microfloraof healthy humans. Eur. J. Nutr. 2004, 43, 205–220. [Google Scholar] [CrossRef]
- Raimundo, A.F.; Ferreira, S.; Tomás-Barberán, F.A.; Santos, C.N.; Menezes, R. Urolithins: Diet-Derived Bioavailable Metabolites to Tackle Diabetes. Nutrients 2021, 13, 4285. [Google Scholar] [CrossRef]
- Ávila-Gálvez, M.A.; Giménez-Bastida, J.A.; González-Sarrías, A.; Espín, J.C. Tissue deconjugation of urolithin A glucuronide to free urolithin A in systemic inflammation. Food Funct. 2019, 10, 3135–3141. [Google Scholar] [CrossRef]
- Bobowska, A.; Granica, S.; Filipek, A.; Melzig, M.F.; Moeslinger, T.; Zentek, J.; Kruk, A.; Piwowarski, J.P. Comparative studies of urolithins and their phase II metabolites on macrophage and neutrophil functions. Eur. J. Nutr. 2021, 60, 1957–1972. [Google Scholar] [CrossRef]
- Giacco, F.; Brownlee, M. Oxidative Stress and Diabetic Complications. Circ. Res. 2010, 107, 1058–1070. [Google Scholar] [CrossRef] [PubMed]
- Liberal, J.; Carmo, A.; Gomes, C.; Cruz, M.T.; Batista, M.T. Urolithins impair cell proliferation, arrest the cell cycle and induce apoptosis in UMUC3 bladder cancer cells. Investig. New Drugs 2017, 35, 671–681. [Google Scholar] [CrossRef]
- Qiu, Z.; Zhou, J.; Zhang, C.; Cheng, Y.; Hu, J.; Zheng, G. Antiproliferative effect of urolithin A, the ellagic acid-derived colonic metabolite, on hepatocellular carcinoma HepG2.2.15 cells by targeting Lin28a/let-7a axis. Braz. J. Med. Biol. Res. 2018, 51, e7220. [Google Scholar] [CrossRef]
- Lin, J.S.; Susztak, K. Podocytes: The Weakest Link in Diabetic Kidney Disease? Curr. Diab. Rep. 2016, 16, 45. [Google Scholar] [CrossRef]
- Li, J.; Ling, Y.; Yin, S.; Yang, S.; Kong, M.; Li, Z. Baicalin serves a protective role in diabetic nephropathy through preventing high glucose-induced podocyte apoptosis. Exp. Ther. Med. 2020, 20, 367–374. [Google Scholar] [CrossRef] [PubMed]
- Sandau, K.B.; Brüne, B. Up-regulation of Bcl-2 by redox signals in glomerular mesangial cells. Cell Death Differ. 2000, 7, 118–125. [Google Scholar] [CrossRef]
- Amstad, P.A.; Liu, H.; Ichimiya, M.; Berezesky, I.K.; Trump, B.F.; Buhimschi, I.A.; Gutierrez, P.L. BCL-2 is involved in preventing oxidant-induced cell death and in decreasing oxygen radical production. Redox Rep. 2001, 6, 351–362. [Google Scholar] [CrossRef]
- Denton, D.; Kumar, S. Autophagy-dependent cell death. Cell Death Differ. 2019, 26, 605–616. [Google Scholar] [CrossRef]
- Luo, S.; Rubinsztein, D.C. Atg5 and Bcl-2 provide novel insights into the interplay between apoptosis and autophagy. Cell Death Differ. 2007, 14, 1247–1250. [Google Scholar] [CrossRef] [PubMed]
- Fan, Y.-J.; Zong, W.-X. The cellular decision between apoptosis and autophagy. In Beyond Apoptosis: Cellular Outcomes of Cancer Therapy; CRC Press: Boca Raton, FL, USA, 2012. [Google Scholar] [CrossRef]
- Popgeorgiev, N.; Jabbour, L.; Gillet, G. Subcellular Localization and Dynamics of the Bcl-2 Family of Proteins. Front. Cell Dev. Biol. 2018, 6, 13. [Google Scholar] [CrossRef]
- Mizushima, N.; Yoshimori, T.; Levine, B. Methods in Mammalian Autophagy Research. Cell 2010, 140, 313–326. [Google Scholar] [CrossRef]
- Zhang, X.; Chen, S.; Huang, K.; Le, W. Why should autophagic flux be assessed? Acta Pharmacol. Sin. 2013, 34, 595–599. [Google Scholar] [CrossRef]
- Nakaso, K.; Yoshimoto, Y.; Nakano, T.; Takeshima, T.; Fukuhara, Y.; Yasui, K.; Araga, S.; Yanagawa, T.; Ishii, T.; Nakashima, K. Transcriptional activation of p62/A170/ZIP during the formation of the aggregates: Possible mechanisms and the role in Lewy body formation in Parkinson’s disease. Brain Res. 2004, 1012, 42–51. [Google Scholar] [CrossRef]
- Kikuchi, H.; Harata, K.; Madhyastha, H.; Kuribayashi, F. Ellagic acid and its fermentative derivative urolithin A show reverse effects on the gp91-phox gene expression, resulting in opposite alterations in all-trans retinoic acid-induced superoxide generating activity of U937 cells. Biochem. Biophys. Rep. 2021, 25, 100891. [Google Scholar] [CrossRef]
- Cisneros-Zevallos, L.; Bang, W.Y.; Delgadillo-Puga, C. Ellagic Acid and Urolithins A and B Differentially Regulate Fat Accumulation and Inflammation in 3T3-L1 Adipocytes While Not Affecting Adipogenesis and Insulin Sensitivity. Int. J. Mol. Sci. 2020, 21, 2086. [Google Scholar] [CrossRef]
- Fu, A.; Cohen-Kaplan, V.; Avni, N.; Livneh, I.; Ciechanover, A.; Ben-Neriah, Y.; Schulman, B.A. p62-containing, proteolytically active nuclear condensates, increase the efficiency of the ubiquitin-proteasome system. Proc. Natl. Acad. Sci. USA 2021, 118, e2107321118. [Google Scholar] [CrossRef]
- Li, X.; Chuang, P.Y.; D’Agati, V.D.; Dai, Y.; Yacoub, R.; Fu, J.; Xu, J.; Taku, O.; Premsrirut, P.K.; Holzman, L.B.; et al. Nephrin Preserves Podocyte Viability and Glomerular Structure and Function in Adult Kidneys. J. Am. Soc. Nephrol. 2015, 26, 2361–2377. [Google Scholar] [CrossRef]
- Verma, R.; Venkatareddy, M.; Kalinowski, A.; Li, T.; Kukla, J.; Mollin, A.; Cara-Fuentes, G.; Patel, S.R.; Garg, P. Nephrin is necessary for podocyte recovery following injury in an adult mature glomerulus. PLoS ONE 2018, 13, e0198013. [Google Scholar] [CrossRef]
- Wiggins, R.-C. The spectrum of podocytopathies: A unifying view of glomerular diseases. Kidney Int. 2007, 71, 1205–1214. [Google Scholar] [CrossRef]
- Doné, S.C.; Takemoto, M.; He, L.; Sun, Y.; Hultenby, K.; Betsholtz, C.; Tryggvason, K. Nephrin is involved in podocyte maturation but not survival during glomerular development. Kidney Int. 2008, 73, 697–704. [Google Scholar] [CrossRef]
- Li, Q.; Li, K.; Chen, Z.; Zhou, B. Anti-renal fibrosis and anti-inflammation effect of urolithin B, ellagitannin-gut microbial-derived metabolites in unilateral ureteral obstruction rats. J. Funct. Foods 2020, 65, 103748. [Google Scholar] [CrossRef]
- Doublier, S.; Salvidio, G.; Lupia, E.; Ruotsalainen, V.; Verzola, D.; Deferrari, G.; Camussi, G. Nephrin Expression Is Reduced in Human Diabetic Nephropathy. Diabetes 2003, 52, 1023–1030. [Google Scholar] [CrossRef] [PubMed]
- Li, C.; Siragy, H.M. High Glucose Induces Podocyte Injury via Enhanced (Pro)renin Receptor-Wnt-β-Catenin-Snail Signaling Pathway. PLoS ONE 2014, 9, e89233. [Google Scholar] [CrossRef] [PubMed]
- Lu, X.-Y.; Liu, B.-C.; Cao, Y.-Z.; Song, C.; Su, H.; Chen, G.; Klein, J.D.; Zhang, H.-X.; Wang, L.-H.; Ma, H.-P. High glucose reduces expression of podocin in cultured human podocytes by stimulating TRPC6. Am. J. Physiol. Physiol. 2019, 317, F1605–F1611. [Google Scholar] [CrossRef]
- Wang, D. Discrepancy between mRNA and protein abundance: Insight from information retrieval process in computers. Comput. Biol. Chem. 2008, 32, 462–468. [Google Scholar] [CrossRef]
- Perl, K.; Ushakov, K.; Pozniak, Y.; Yizhar-Barnea, O.; Bhonker, Y.; Shivatzki, S.; Geiger, T.; Avraham, K.B.; Shamir, R. Reduced changes in protein compared to mRNA levels across non-proliferating tissues. BMC Genom. 2017, 18, 305. [Google Scholar] [CrossRef]
- Schwanhäusser, B.; Busse, D.; Li, N.; Dittmar, G.; Schuchhardt, J.; Wolf, J.; Chen, W.; Selbach, M. Global quantification of mammalian gene expression control. Nature 2011, 473, 337–342. [Google Scholar] [CrossRef]
- Moritz, C.P.; Mühlhaus, T.; Tenzer, S.; Schulenborg, T.; Friauf, E. Poor transcript-protein correlation in the brain: Negatively correlating gene products reveal neuronal polarity as a potential cause. J. Neurochem. 2019, 149, 582–604. [Google Scholar] [CrossRef]
- Quack, I.; Woznowski, M.; Potthoff, S.A.; Palmer, R.; Königshausen, E.; Sivritas, S.; Schiffer, M.; Stegbauer, J.; Vonend, O.; Rump, L.C.; et al. PKCα Mediates β-Arrestin2-dependent Nephrin Endocytosis in Hyperglycemia. J. Biol. Chem. 2011, 286, 12959–12970. [Google Scholar] [CrossRef]
- Martin, C.E.; Petersen, K.A.; Aoudjit, L.; Tilak, M.; Eremina, V.; Hardy, W.R.; Quaggin, S.E.; Takano, T.; Jones, N. ShcA Adaptor Protein Promotes Nephrin Endocytosis and Is Upregulated in Proteinuric Nephropathies. J. Am. Soc. Nephrol. 2018, 29, 92–103. [Google Scholar] [CrossRef] [PubMed]
- Qin, X.-S.; Tsukaguchi, H.; Shono, A.; Yamamoto, A.; Kurihara, H.; Doi, T. Phosphorylation of Nephrin Triggers Its Internalization by Raft-Mediated Endocytosis. J. Am. Soc. Nephrol. 2009, 20, 2534–2545. [Google Scholar] [CrossRef] [PubMed]
- Savi, M.; Bocchi, L.; Mena, P.; Dall’Asta, M.; Crozier, A.; Brighenti, F.; Stilli, D.; Del Rio, D. In vivo administration of urolithin A and B prevents the occurrence of cardiac dysfunction in streptozotocin-induced diabetic rats. Cardiovasc. Diabetol. 2017, 16, 80. [Google Scholar] [CrossRef] [PubMed]


 p < 0.05 vs. 10 µM UA,
  p < 0.01 vs. 10 µM UA, # p < 0.05 vs. respective NG group, & p < 0.01 vs. respective NG 10 µM UA, && p < 0.005 vs. NG Control. The values are mean ± SEM (n = 4 for (B,C), n = 3 for (E,F)).
p < 0.05 vs. 10 µM UA, p < 0.01 vs. 10 µM UA, # p < 0.05 vs. respective NG group, & p < 0.01 vs. respective NG 10 µM UA, && p < 0.005 vs. NG Control. The values are mean ± SEM (n = 4 for (B,C), n = 3 for (E,F)).
p < 0.01 vs. 10 µM UA, # p < 0.05 vs. respective NG group, & p < 0.01 vs. respective NG 10 µM UA, && p < 0.005 vs. NG Control. The values are mean ± SEM (n = 4 for (B,C), n = 3 for (E,F)).
p < 0.05 vs. 10 µM UA, p < 0.01 vs. 10 µM UA, # p < 0.05 vs. respective NG group, & p < 0.01 vs. respective NG 10 µM UA, && p < 0.005 vs. NG Control. The values are mean ± SEM (n = 4 for (B,C), n = 3 for (E,F)).


Publisher’s Note: MDPI stays neutral with regard to jurisdictional claims in published maps and institutional affiliations. |
© 2022 by the authors. Licensee MDPI, Basel, Switzerland. This article is an open access article distributed under the terms and conditions of the Creative Commons Attribution (CC BY) license (https://creativecommons.org/licenses/by/4.0/).
Share and Cite
Kotewicz, M.; Krauze-Baranowska, M.; Daca, A.; Płoska, A.; Godlewska, S.; Kalinowski, L.; Lewko, B. Urolithins Modulate the Viability, Autophagy, Apoptosis, and Nephrin Turnover in Podocytes Exposed to High Glucose. Cells 2022, 11, 2471. https://doi.org/10.3390/cells11162471
Kotewicz M, Krauze-Baranowska M, Daca A, Płoska A, Godlewska S, Kalinowski L, Lewko B. Urolithins Modulate the Viability, Autophagy, Apoptosis, and Nephrin Turnover in Podocytes Exposed to High Glucose. Cells. 2022; 11(16):2471. https://doi.org/10.3390/cells11162471
Chicago/Turabian StyleKotewicz, Milena, Mirosława Krauze-Baranowska, Agnieszka Daca, Agata Płoska, Sylwia Godlewska, Leszek Kalinowski, and Barbara Lewko. 2022. "Urolithins Modulate the Viability, Autophagy, Apoptosis, and Nephrin Turnover in Podocytes Exposed to High Glucose" Cells 11, no. 16: 2471. https://doi.org/10.3390/cells11162471