Article

Aberrant Expression of COX-2 and FOXG1 in Infrapatellar Fat Pad-Derived ASCs from Pre-Diabetic Donors

1
Center for Stem Cell Research and Regenerative Medicine, Tulane University School of Medicine, New Orleans, LA 70112, USA
2
Departments of Orthopaedic Surgery and Bioengineering, Stanford University School of Medicine, Stanford, CA 94305, USA
3
Center for Cellular and Molecular Engineering, Department of Orthopaedic Surgery, University of Pittsburgh School of Medicine, Pittsburgh, PA 15213, USA
*
Author to whom correspondence should be addressed.
Present address: Department of Microbiology, Immunology, and Genetics, University of North Texas Health Science Center, Fort Worth, TX 76107, USA.
Present address: Institute for Tissue Engineering and Regenerative Medicine, The Chinese University of Hong Kong, Shatin, Hong Kong SAR 999077, China.
Cells 2022, 11(15), 2367; https://doi.org/10.3390/cells11152367
Submission received: 26 February 2022 / Revised: 25 July 2022 / Accepted: 26 July 2022 / Published: 1 August 2022
(This article belongs to the Collection Research on Adipose Stem Cells)

Abstract

:
Osteoarthritis (OA) is a degenerative joint disease resulting in limited mobility and severe disability. Type II diabetes mellitus (T2D) is a weight-independent risk factor for OA, but a link between the two diseases has not been elucidated. Adipose stem cells (ASCs) isolated from the infrapatellar fat pad (IPFP) may be a viable regenerative cell for OA treatment. This study analyzed the expression profiles of inflammatory and adipokine-related genes in IPFP-ASCs of non-diabetic (Non-T2D), pre-diabetic (Pre-T2D), and T2D donors. Pre-T2D ASCs exhibited a substantial decrease in levels of mesenchymal markers CD90 and CD105 with no change in adipogenic differentiation compared to Non-T2D and T2D IPFP-ASCs. In addition, Cyclooxygenase-2 (COX-2), Forkhead box G1 (FOXG1) expression and prostaglandin E2 (PGE2) secretion were significantly increased in Pre-T2D IPFP-ASCs upon stimulation by interleukin-1 beta (IL-1β). Interestingly, M1 macrophages exhibited a significant reduction in expression of pro-inflammatory markers TNFα and IL-6 when co-cultured with Pre-T2D IPFP-ASCs. These data suggest that the heightened systemic inflammation associated with untreated T2D may prime the IPFP-ASCs to exhibit enhanced anti-inflammatory characteristics via suppressing the IL-6/COX-2 signaling pathway. In addition, the elevated production of PGE2 by the Pre-T2D IPFP-ASCs may also suggest the contribution of pre-diabetic conditions to the onset and progression of OA.

1. Introduction

Symptomatic osteoarthritis (OA) in the knee is one of the leading global causes of physical disability. It affects approximately 14 million people in the USA and millions more across the globe [1,2]. The knee joint comprises multiple tissues, including cartilage, subchondral bone, synovial membrane, and the infrapatellar fat pad (IPFP). OA results from the disruption of cartilage homeostasis and osteophyte formation within the synovial capsule [3]. Disease pathology extends beyond the articular cartilage and subchondral bone to include chronic inflammation. Thus, OA is described as a whole joint disorder [4,5,6]. Furthermore, age-associated overuse or traumatic injury are often the initiators of OA [7,8]. Still, long-term inflammation is often highlighted as the driving force behind ECM degradation [9].
A primary hallmark of OA is the presence of chronic inflammation within the synovial joint and surrounding tissues [4,6,10]. While the exact tissue source(s) and the composition of the proinflammatory factors in knee OA are still under investigation, focusing primarily on the synovium, other joint tissues, such as the IPFP, are also hypothesized to play a critical role [10]. Increased levels of proinflammatory cytokines, in particular interleukin (IL)-1β, IL-6, and tumor necrosis factor α (TNFα), are found in the synovial fluid of OA patients [11,12]. Moreover, IL-1β and TNFα stimulate their production and induce the expression of IL-6, IL-8, and prostaglandin production by chondrocytes [13,14]. The increased expression of mediators of inflammation induces the expression of matrix metalloproteases (MMPs) in chondrocytes. The MMPs drive the destruction of the ECM, as indicated by elevated collagen and proteoglycan breakdown [13,15].
Additionally, inflammation inhibits the chondrocytes’ production of collagen type II and proteoglycans. Most patients with knee OA also exhibit synovitis, suggesting synovial inflammation is central in OA progression [16]. The synovium is a source of circulating immune cells that direct cartilage breakdown in OA. While inflammation of the cartilage and synovium is well characterized in OA, it is not evident that the high levels of proinflammatory mediators found in the synovial fluid of OA patients result from production by the synovium and chondrocytes exclusively. Many OA patients have detectable inflammation in other joint tissues. The IPFP may be one potential source of proinflammatory mediators in knee OA [17].
Studies have demonstrated that adipose tissue reservoirs throughout the body are active endocrine production sites that contribute to systemic inflammation [18]. Patients diagnosed with type II diabetes mellitus (T2D) have elevated IL-6 and TNFα in their serum [19]. T2D is classified as a weight-independent risk factor for OA, suggesting a link between T2D-mediated adipose dysfunction and OA [20,21]. OA patients also exhibit elevated synovial concentrations of adipokines, such as adiponectin (ADIPOQ) and leptin (LEP) [22,23]. When exposed to LEP, cartilage explants and isolated chondrocytes demonstrated heightened expression of IL-1β, MMP-9, and MMP-13 [23,24]. Cartilage does not produce ADIPOQ or LEP, making it unclear what tissue is responsible for their increased concentration in synovial fluid. Due to its adjacency to the synovial fluid, the IPFP could be the source of OA modifying cytokines; however, to our knowledge, this direct link has not been established, nor has the IPFP from T2D patients been investigated.
As an extension of this concept, stem/progenitor cells isolated from adipose depots have also shown variation in differentiation potential and inflammation-related properties [25]. Due to their inherent anti-inflammatory properties and heightened chondrogenic potential compared to subcutaneous derived ASCs, ASCs derived from IPFP (IPFP-ASCs) are often highlighted as a potential therapeutic cell source for OA [26,27]. However, treatment of OA with the injection of ASCs has resulted in mixed outcomes, often demonstrating only transient therapeutic benefits, such as pain alleviation and improved mobility [28]. Therefore, it is plausible to think that the characteristics of the ASC donor may influence their therapeutic benefits. In general, stem cell differentiation potential and immunomodulation properties are susceptible to donor physiologic factors, such as tissue site, age, obesity, disease (e.g., T2D) and gender [25,29,30,31,32]. While IPFP-ASCs from OA patients maintain their chondrogenic differentiation potential, the impact of T2D on their differentiation potential or their immunomodulatory properties is unknown [33].
Chronic inflammation of the IPFP, often associated with OA, is characterized by fibrosis, hyperplasia and neural ingrowth [17,34,35]. However, little is known about the inflammatory microenvironment of OA IPFP and the effect of intercellular interaction and communication (direct or paracrine) on ASC differentiation potential. Studies have shown that IPFP-ASCs have increased chondrogenic potential compared to subcutaneous ASCs and no OA impact on the chondrogenic potential of IPFP-ASCs has been noted [36,37]. However, another study by Stocco et al. demonstrated changes in the immunotypic profile of IPFP-ASCs isolated from OA patients, suggestive of an impaired ability by IPFP-ASCs to modulate OA-related inflammation. To our knowledge, no study has investigated the combined impact of OA and T2D on IPFP-ASCs. Thus, investigating the impact of T2D on the biologic properties of IPFP and IPFP-derived ASCs is essential for understanding their therapeutic potential in the setting of OA.
The goals of the research studies presented in this paper were to (a) characterize the stemness properties of IPFP-ASCs isolated from non-diabetic (Non-T2D), pre-diabetic (Pre-T2D), and diabetic (T2D) patients and (b) determine the levels of expression of inflammatory mediators and adipokines in IL-1B stimulated IPFP-ASCs and adipocytes and in a co-culture system with monocyte-derived macrophages.

2. Materials and Methods

2.1. IPFP-ASC Isolation and Expansion

A total of nine IPFP explants were collected from patients undergoing total knee arthroplasty at Stanford Hospital. The samples were collected with Institutional Review Board approval and the patient’s knowledge and consent. The patient characteristics and diabetic status are listed in Table 1. Their primary care physician determined the diabetic status of each donor. IPFP-ASCs were isolated as previously described [38]. Briefly, IPFP samples were minced in 30 mL sterile 1X phosphate-buffered saline (PBS, Hyclone, Logan, UT, USA). An equal volume of digestion solution, 0.1% type I collagenase (Worthington Biochemical, Lakewood, NJ, USA) and 1% bovine serum albumin (Sigma-Aldrich, St. Louis, MO, USA) in 1X PBS, was added and samples were incubated at 37 °C. After one hour, growth medium consisting of Dulbecco’s Modified Eagle’s Medium Nutrient Mixture F-12 Ham (1:1 mixture) (DMEM/F-12, Gibco, Gaithersburg, MD, USA), supplemented with 10% fetal bovine serum (FBS, Hyclone, Logan, UT, USA) and 1% antibiotic/antimycotic (Anti/Anti, Gibco) was added to the samples. After centrifugation at 300× g for 5 min, the resulting cell pellets were suspended in growth medium and plated on 150 cm2 Nunc plates (ThermoFisher Scientific, Pittsburgh, PA, USA). After 48 h, the plates were washed with 1X PBS, and the adherent cells were expanded in growth medium to 70% confluency before being passaged at 400 cells/cm2. Sub-confluent ASCs (<~70%) from passages 3–4 were used for all experiments.

2.2. Flow Cytometry

The expression of ASC cell surface markers was assessed by flow cytometry. IPFP-ASCs were washed in 1X PBS before being blocked in Fc block (ThermoFisher Scientific). Cells were immunostained for 30 min. with conjugated antibodies against CD90 (Ext/Em: 488/530) (Cat #: 11-0909-42) (EBioscience, San Diego, CA, USA), CD73 (Ext/Em: 488/560) (Cat #: 550257) (BD Pharmingen), CD105 (Ext/Em: 633/670) (Cat #: 17-1057-41) (EBioscience), CD3 (Ext/Em: 488/630) (Cat #: 61-4724-82) (EBioscience), CD14 (Ext/Em: 488/670) (Cat #: IM2640U) (Beckman Coulter), CD31 (Ext/Em: 488/770) (Cat #: 25-0349-41) (EBioscience), CD45 (Ext/Em: 630/710) (Cat #: A71117) (Beckman Coulter). All antibodies were diluted 1:1000 from commercial concentrations. Samples were analyzed with a Gallios Flow Cytometer (Beckman Coulter, Brea, CA, USA) with Kaluza software (Beckman Coulter). A minimum of 10,000 events were captured and analyzed for each sample.

2.3. Colony-Forming Unit Assay (CFU)

The ASCs were analyzed for self-renewal activity by a colony-forming unit fibroblast (CFU-F) assay. The cells were seeded onto a 6-well NUNC cell culture plate at 100 cells/well. The cells were cultured in growth medium for 14 days, with the medium being refreshed once after seven days. After 14 days, the wells were washed with 1X PBS and stained with 3% (w/v) crystal violet (Sigma-Aldrich). To monitor the number of cells capable of self-renewal, the number of colonies greater than 3 mm2 in diameter was counted and divided by the total number of cells seeded.

2.4. Osteogenic and Adipogenic Differentiation

Each IPFP line was differentiated along adipogenic and osteogenic lineages to assess the differentiation potential of each line. Briefly, 20,000 cells/cm2 were seeded onto a 6-well NUNC cell culture plate. The cells were allowed to reach 100% confluency in the growth medium before being replaced with an osteogenic or adipogenic differentiation medium (AdipoQual (AQ); Obatala Sciences, New Orleans, LA, USA). Osteogenic Media (OM) consisted of 89% DMEM-F12, 10% FBS, and 1% Anti/Anti supplemented with 10 nM Dexamethasone, 20 mM β-glycerophosphate, 50 µM L-Ascorbic Acid 2-phosphate (Sigma-Aldrich). The differentiation medium was replaced every 3–4 days for 28 days.
After differentiation in adipogenic medium, each well was washed with 1X PBS, fixed for 1 h in 4% Paraformaldehyde (PFA) and then stained in a 0.5% filtered solution of Oil Red O (Sigma-Aldrich) for 10 min. Oil Red O was extracted from the cultures using 100% isopropanol to quantify staining. The absorbance at 584 nm was measured using a SynergyTM HTX Multi-Mode Microplate Reader (BioTek, Winooski, VT, USA). Absorbance values were normalized to total protein content and determined using a Pierce BCA kit (ThermoFisher Scientific). RNA and conditioned media were collected and stored at −80 °C·for future analysis.
After differentiation in osteogenic media, each well was washed with deionized water and fixed for 1 h in 4% PFA before being stained with 5% Alizarin Red for 20 min (Sigma-Aldrich). Images were then acquired at 20× magnification on a Nikon Eclipse TE200 microscope equipped with Nikon Digital Camera DXM1200F and Nikon ACT-1 software version 2.7 (Nikon, Melville, NY, USA).

2.5. Co-Culture of ASCs with Monocyte-Derived Macrophages

Human whole blood was purchased from the Stanford Blood Center. Monocytes were isolated from these samples using EasySep Human Monocyte Isolation (STEMCELL Technologies, Vancouver, BC, Canada), according to the manufacturer’s protocol. Macrophage differentiation of monocytes was carried out by plating the cells at 1 × 10⁵ cells/cm2 in the bottom well of a Corning Transwell and culturing them in growth medium supplemented with 100 ng/mL macrophage colony-stimulating factor (MCSF, R&D Systems, Minneapolis, MN, USA) for six days. A pro-inflammatory (M1) phenotype was induced by treating the macrophages with both 20 ng/mL interferon-gamma (INF-γ, R&D systems and 10 ng/mL lipopolysaccharides (LPS, R&D systems) for 48 h. An anti-inflammatory (M2) phenotype was induced by treating the macrophages with 20 ng/mL IL-4 (R&D Systems). All experiments were conducted with pooled IPFP ASC lines from three patients. A total of 0.25 million IPFP-ASCs were seeded on the 0.4 μm pore insert of Transwell culture plates and allowed to acclimate for 24 h in growth medium before the inserts were placed in co-culture with the M0, M1, or M2 macrophages. Then, the co-cultures were cultured for 72 h before the media and RNA were collected from the IPFP-ASCs and the macrophages for analysis by RT-PCR.

2.6. IL-1β Induction

IPFP-ASCs were cultured to 70% confluency in growth medium for six days, with the medium refreshed after three days. The medium was then replaced with growth medium supplemented with 10 ng/mL IL-1β and the cells were cultured for an additional 24 h (PeproTech, Rocky Hill, NJ, USA). RNA and conditioned media were collected for future analysis.

2.7. Quantitative Polymerase Chain Reaction (qPCR)

RNA extraction of all samples was done using RNeasy Microkit (Qiagen, Germantown, MD, USA) according to the manufacturer’s protocol. Then, reverse transcription was done with 1 μg of RNA using a High-Capacity cDNA Reverse Transcription Kit containing RNase Inhibitor (ThermoFisher Scientific).
qPCR was performed with SsoAdvanced Universal SYBR Green Supermix (Bio-Rad, Hercules, CA, USA) with custom primers purchased from Integrated DNA Technologies (IDT, Newark, NJ, USA). Gene-specific primer sequences are listed in Table 2. The fold change in gene expression was calculated using the -∆∆CT method and the expression of the glyceraldehyde 3-phosphate dehydrogenase (GAPDH) was used as a housekeeping gene. The reference group for all experiments was Non-T2D IPFP-ASCs.

2.8. Enzyme-Linked Immunosorbent Assay (ELISA)

The conditioned cell culture media samples were cleared by centrifugation at 1000× g for 1 min and stored at −80 °C until use. Then, the media samples were brought to room temperature before analysis using a PGE2 ELISA kit according to the manufacturer’s protocols (Pierce BCA kit, ThermoFisher Scientific). Absorbance at 450 nm was measured using a SynergyTM HTX Multi-Mode Microplate Reader. The ELISA data were expressed as a function of total protein content.

2.9. Statistical Analysis

Statistical analyses were performed using GraphPad 8.3 software (GraphPad). Statistical significance between 7-day confluent control and experimental groups was determined using two-tailed Student’s t-tests. Statistical significance between non-T2D, pre-T2D, and T2D experimental groups was determined using ordinary one-way ANOVA with Tukey posthoc analysis. All data represent the mean ± standard error, and all experiments were performed in triplicates. Significance was assessed as p < 0.05 and is denoted by *, with ** for p < 0.01, *** for p < 0.001, and **** for p < 0.0001.

3. Results

3.1. Altered Cell Surface Antigen Expression in Pre-T2D IPFP ASCs

Standard ASC characterization methods were used to assess the stemness of IPFP-ASCs. All groups of IPFP-ASCs exhibited fibroblastic cell morphology similar to subcutaneous ASCs (data not shown) after the first passage. The profiling of cell surface markers by flow cytometry demonstrated robust expression of CD90 and CD105 (~95%) and reduced CD73 (~75%) expression in Non-T2D and T2D IPFP-ASCs (Figure 1A) along with undetectable expression of CD3, CD14, CD31, and CD45 cell surface markers (Figure 1A, Supplementary Figure S1). Pre-T2D IPFP-ASCs demonstrated a significant reduction in CD90 and CD105 compared to Non-T2D and T2D IPFP-ASCs without a corresponding increase in CD3, CD14, CD31, or CD45 expression (Figure 1A, Supplementary Figure S1).
Furthermore, Pre-T2D IPFP-ASCs tended to exhibit increased CFU activity compared to Non-T2D IPFP-ASCs, while T2D IPFP-ASCs showed significantly elevated CFU activity compared to Non-T2D IPFP-ASCs (Figure 1B). Adipogenic differentiation of all samples for 28 days resulted in the expected increase in expression of peroxisome proliferator-activated receptor (PPARγ), glucose transporter type 4 (GLUT4), adiponectin (ADIPOQ), and perilipin (PL1N) (Figure 1C–F). No differences in the expression levels of PPARγ, GLUT4, ADIPOQ, or PL1N were noted among the groups. Oil Red O staining of adipogenic differentiated IPFP-ASCs illustrated accumulation of neutral lipid droplets after culture for 28 days (Figure 2A–C). Quantification of the Oil Red O staining revealed no significant differences in the levels of lipid accumulation among adipocytes differentiated from Non-T2D, Pre-T2D, and T2D cells (Figure 2D). In addition, there were no notable differences in osteogenic differentiation between Non-T2D, Pre-T2D, and T2D sample groups (Supplementary Figure S2).

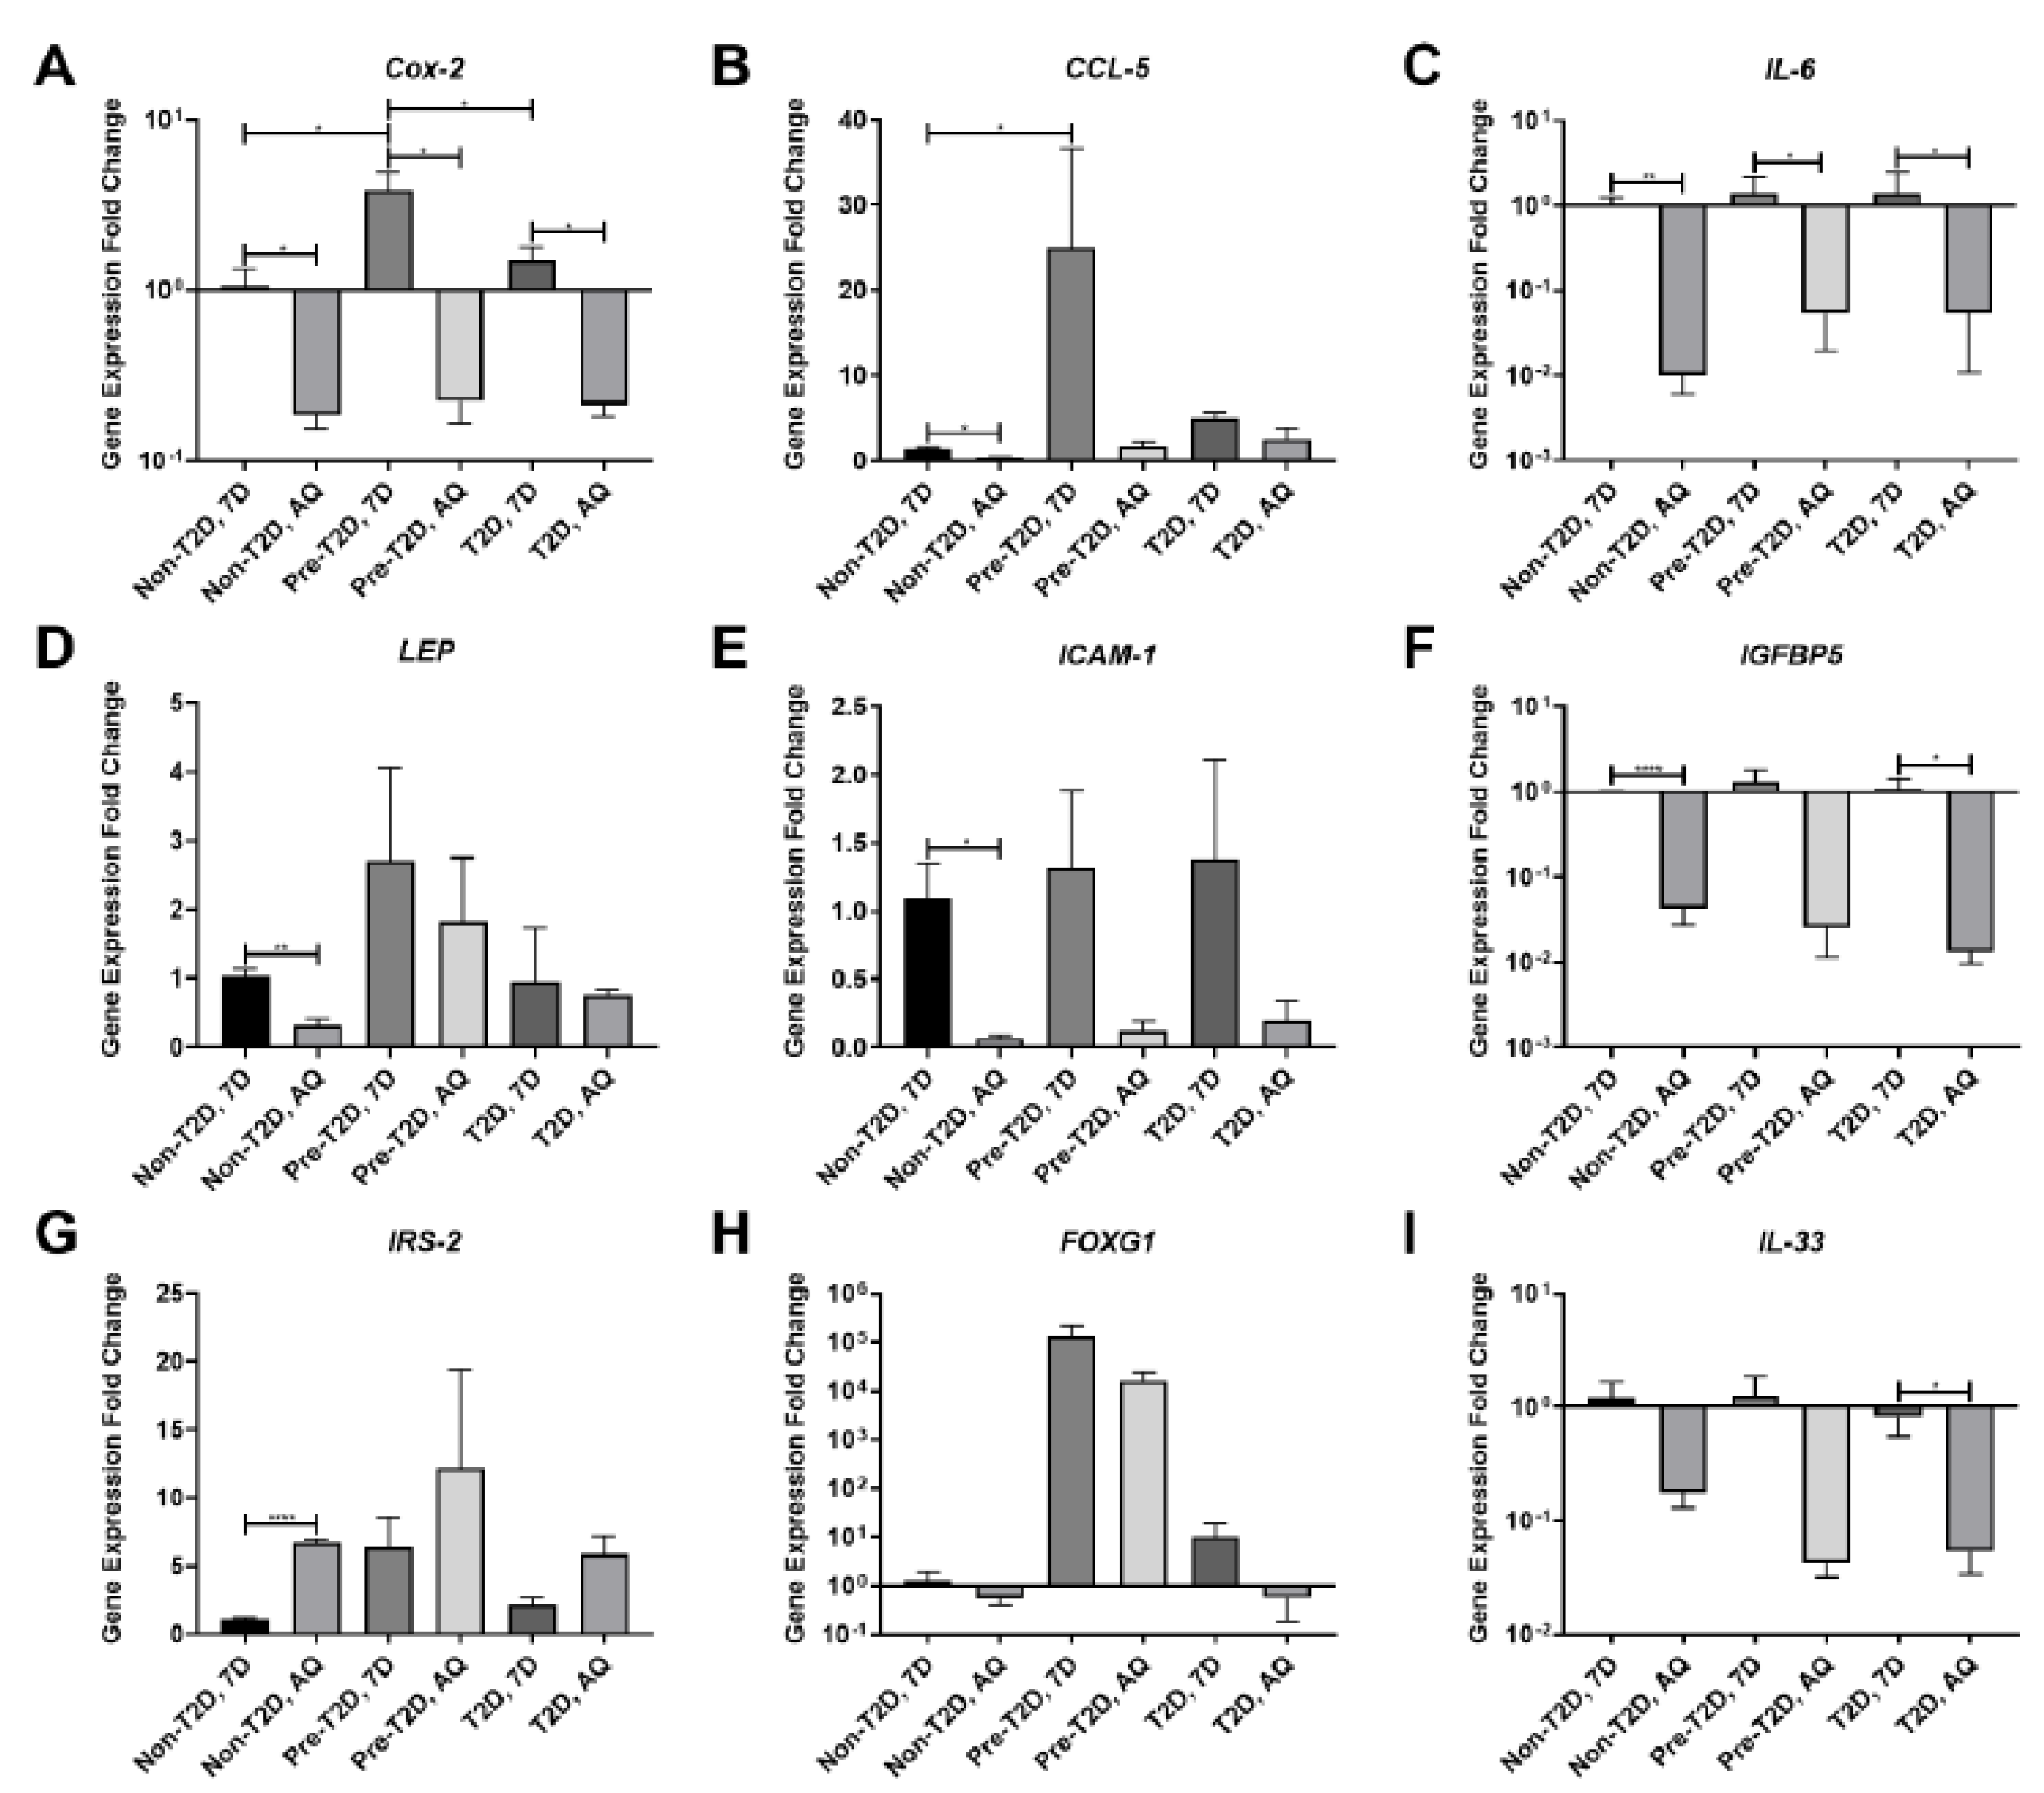
3.2. Decreased COX-2 and IL-6 Gene Expression in Adipogenically Differentiated IPFP-ASCs

Analysis of the levels of gene expression for inflammatory mediators and diabetes-associated signaling factors, including COX-2, chemokine ligand 5 (CCL-5), IL-6, LEP, intercellular adhesion molecule 1 (ICAM-1), insulin-like growth factor-binding protein 5 (IGFBP5), insulin receptor substrate 2 (IRS-2), forkhead box G1 (FOXG1), and IL-33 in Non-T2D, Pre-T2D, and T2D IPFP-ASCs demonstrated significant increases in the mRNA levels for both COX-2 and CCL-5 in undifferentiated Pre-T2D samples compared to non-T2D and T2D samples (Figure 3A,B). After adipogenic differentiation, a significant decrease in IL-6 and COX-2 gene expression was noted in all groups compared to their undifferentiated state (Figure 3A,C). Substantial reductions in mRNA expression levels were detected for LEP, CCL-5, ICAM-1, and IGFBP5, and an increase in IRS-2 in differentiated Non-T2D IPFP-ASCs compared to Non-T2D IPFP-ASCs (Figure 3B,D–G) was detected. Interestingly, FOXG1 gene expression increased in undifferentiated and differentiated Pre-T2D IPFP-ASCs compared to Non-T2D and T2D ASCs (Figure 3H). Finally, significantly suppressed expression of both IL-33 and IGFBP5 was noted in differentiated T2D IPFP-ASCs compared to undifferentiated T2D-IPFP ASCs (Figure 3F,I).

3.3. Increased COX-2, IL-6 and FOXG1 Gene Expression in IL-1β Stimulated Pre-T2D IPFP-ASCs

Exposure of ASCs to IL-1β is a standard technique to induce proinflammatory degenerative features in vitro models. It was used in these studies to simulate an OA-like inflammatory environment [39]. After IL-1β stimulation, IPFP-ASCs exhibited significant increases in the expression of both IL-6 and COX-2 in all three groups compared to their respective unstimulated counterparts (Figure 4A,C). Additionally, there was a significant increase in IL-1β expression and a decrease in TNFα expression in IL-1β stimulated Non-T2D and T2D IPFP-ASC sample groups (Figure 4D,E). T2D IPFP-ASCs exhibited a significant increase in the expression of IL-33 compared to their undifferentiated controls (Figure 4I). Interestingly, the expression of IL-10, considered a potent anti-inflammatory cytokine, was significantly reduced in IL-1β stimulated Non-T2D IPFP-ASCs compared to IPFP-ASC control. However, IL-1β significantly stimulated IL-10 expression in T2D IPFP-ASCs compared to their non-IL-1β treated controls (Figure 4F). Furthermore, after IL-1β stimulation, there was a significant increase in IL-10 expression in T2D IPFP-ASCs compared to Non-T2D and Pre-T2D IPFP-ASCs (Figure 4F). Expression levels of COX-2, IRS-2, and FOXG1 were also significantly elevated in IL-1β stimulated Pre-T2D IPFP-ASCs compared to IL-1β stimulated Non-T2D and T2D IPFP-ASCS (Figure 4A,G,H). In addition, TNFα expression was significantly increased in IL-1β stimulated Pre-T2D IPFP-ASCs compared to Non-T2D IPFP-ASCs (Figure 4D).

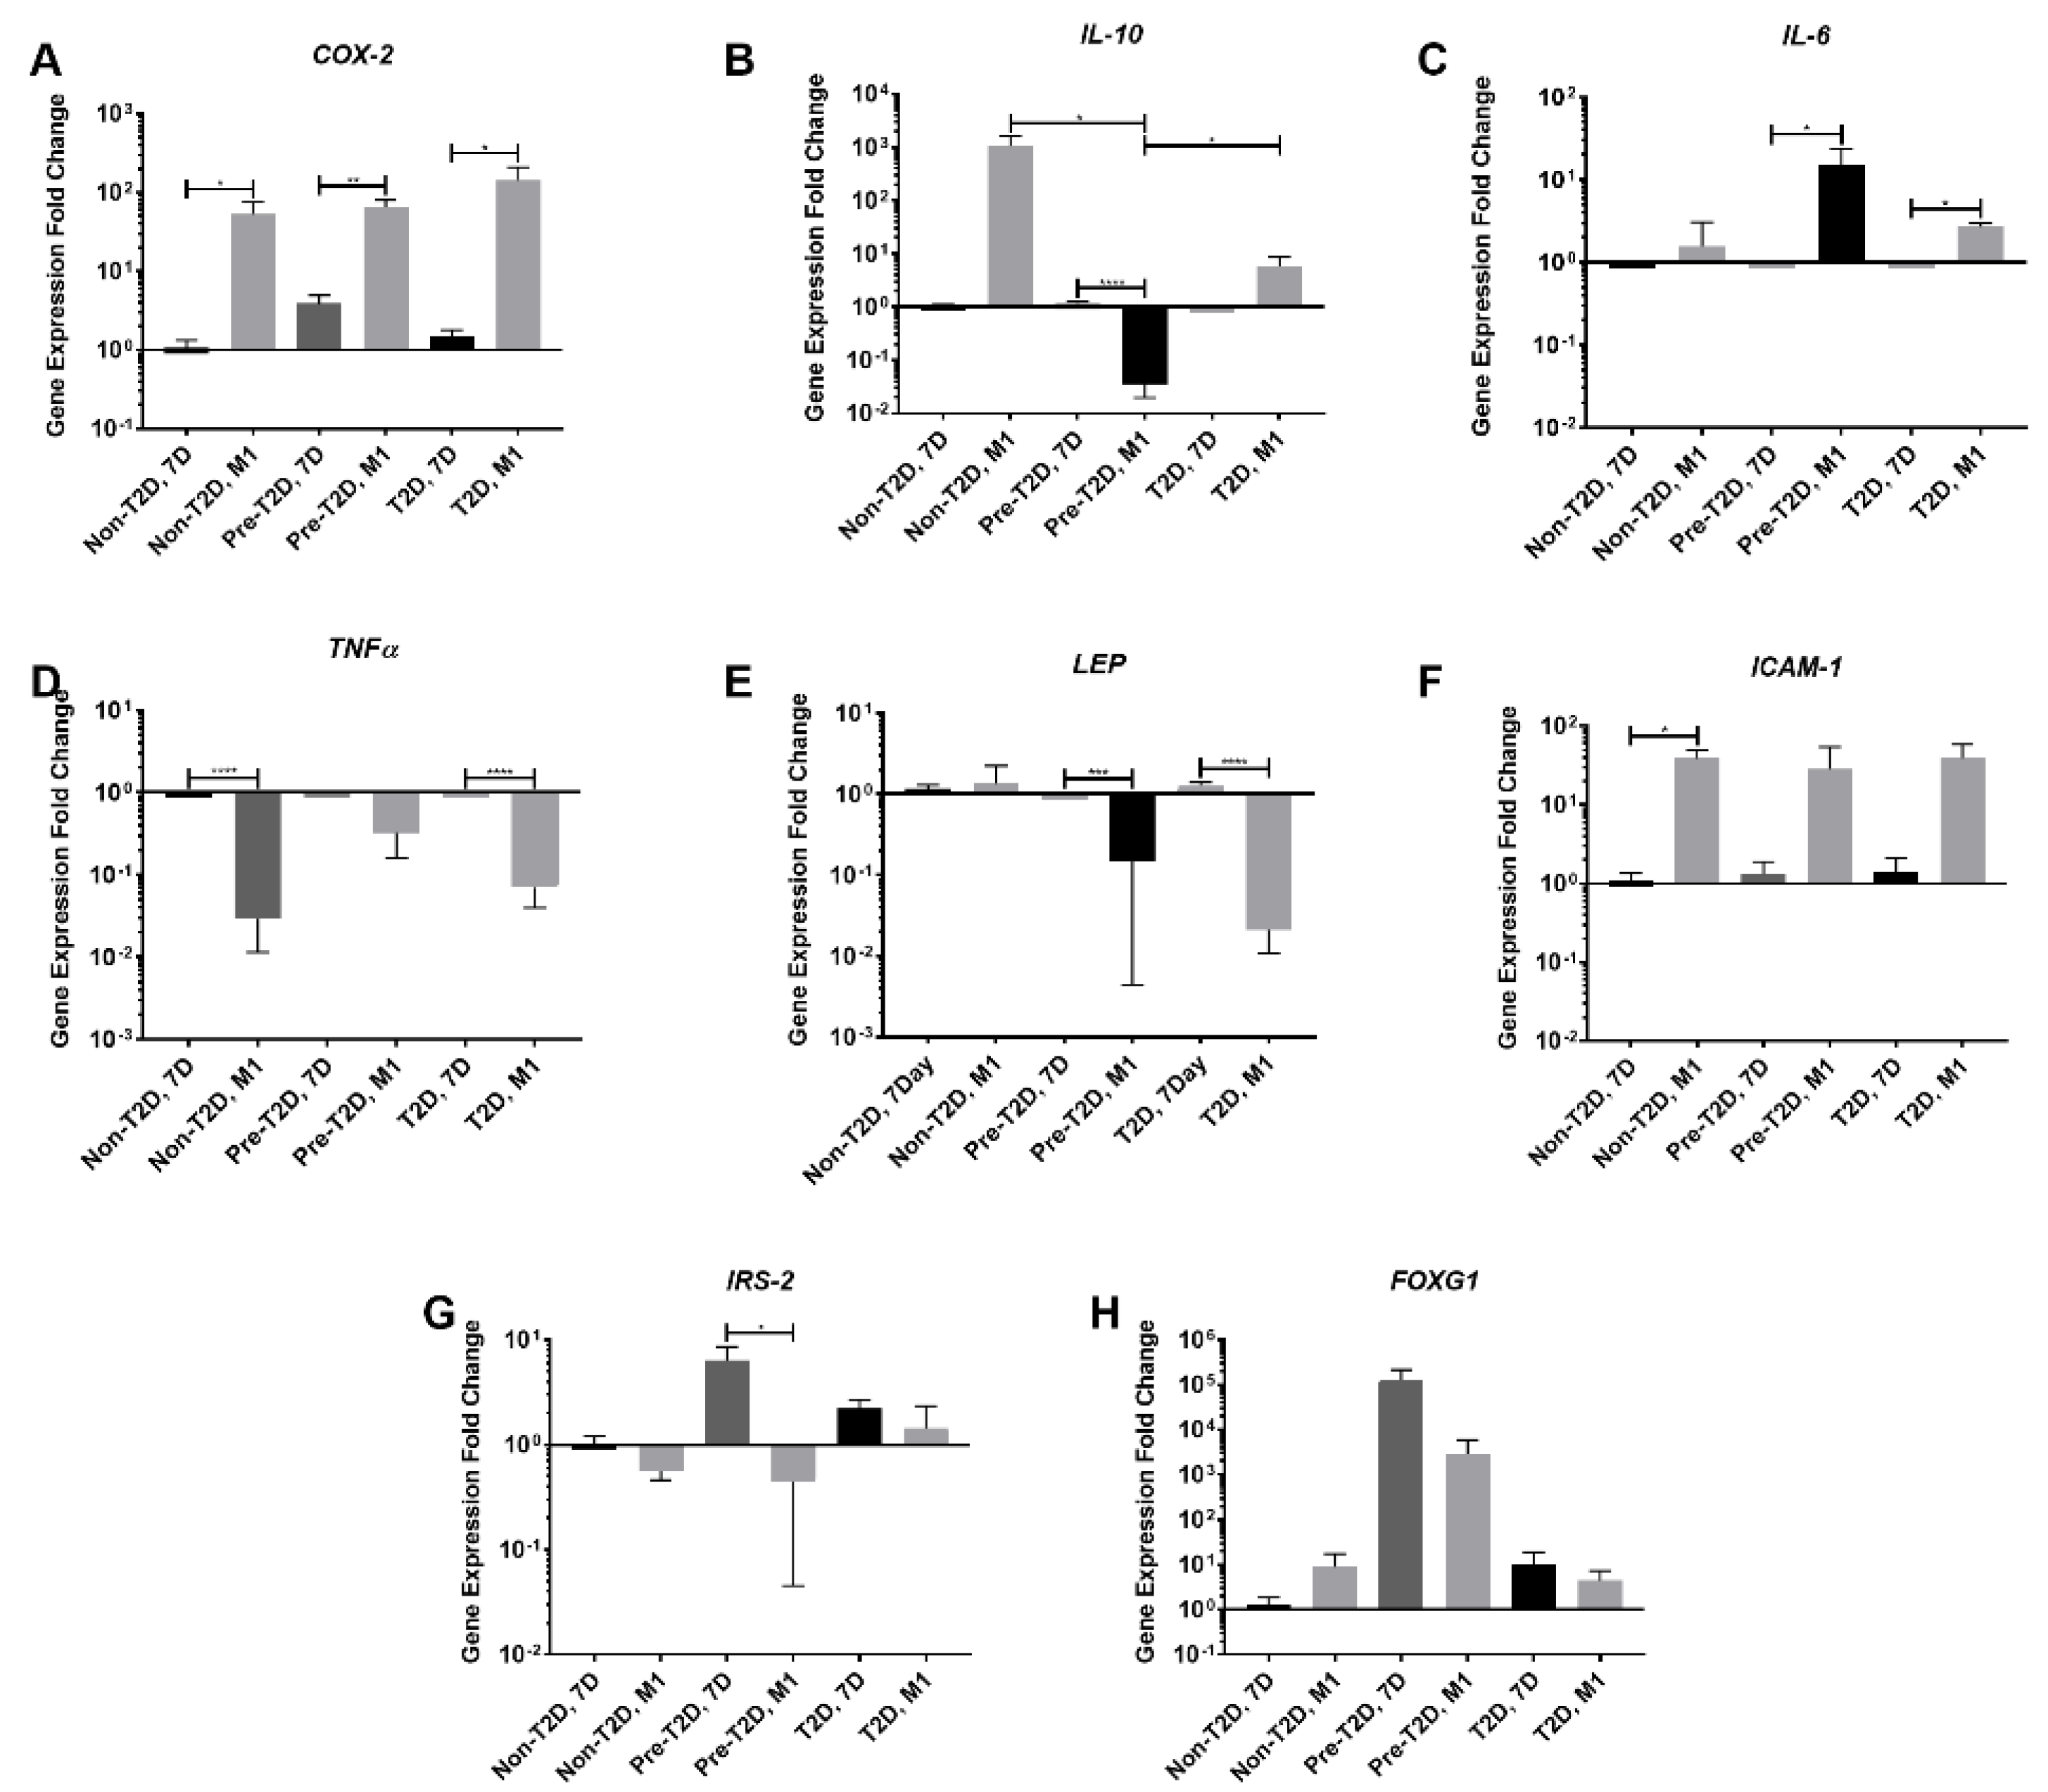
3.4. Reduced Expression of TNFα and IL-6 in M1 Macrophages Co-Cultured with Pre-T2D IPFP-ASCs

The activity of synovial macrophages is a crucial component in OA progression, and ASCs are known to modulate their activity [4]. Decreased levels of expression of both TNFα and IL-6 mRNAs were detected in M1 macrophages co-cultured with Pre-T2D and T2D IPFP-ASCs (Figure 5A,C). However, when co-cultured with Pre-T2D IPFP-ASCs, TNFα and IL-6 mRNA expression levels in M1 cells were equivalent to the levels observed in M0 and M2 macrophages (Figure 5A,C). Conversely, there was a significant decrease in IL-10 gene expression by M1 macrophages co-cultured with Pre-T2D IPFP-ASCs, compared to co-cultured M0 or M2 macrophages (Figure 5D).

3.5. Decreased Expression of Leptin and IL-10 and Increased Expression of COX-2 and FOXG1 in Pre-T2D IPFP-ASCs Co-Cultured with M1 Macrophages

When co-cultured with M1 macrophages, Pre-T2D and T2D IPFP-ASCs exhibited a significant decrease in LEP expression and a significant increase in IL-6 expression compared to naïve IPFP-ASCs (Figure 6C,E); Pre-T2D IPFP-ASCs also demonstrated a significant decrease in IL-10 and IRS-2 expression compared to naïve IPFP-ASCs (Figure 6B,G). Additionally, IL-10 expression levels in Pre-T2D IPFP-ASCs decreased significantly compared to Non-T2D and T2D IPFP-ASCs when co-cultured with M1 macrophages (Figure 6B). The Non-T2D IPFP-ASCs and T2D IPFP-ASCs showed a significant decrease in TNFα expression compared to their naïve control when co-cultured with M1 macrophages (Figure 6D). COX-2 expression by Non-T2D, Pre-T2D, and T2D IPFP-ASCs was significantly increased after co-culture with M1-induced macrophages (Figure 6A). Moreover, ICAM1 expression was significantly elevated in Non-T2D IPFP-ASCs co-culture with M1 macrophages (Figure 6F). FOXG1 expression was increased in Pre-T2D IPFP-ASCs compared to Non-T2D and T2D IPFP ASCs (Figure 6H). After co-culture with M2-induced macrophages, IPFP-ASCs exhibited a significant decrease in TNFα, IL-1β, and IL-6 (Supplementary Figure S3).

3.6. Increased PGE2 Secretion by Pre-T2D IPFP-ASCs

COX-2, a synthase for PGE2, is a common target for nonsteroidal anti-inflammatory drugs (NSAIDs) prescribed to OA patients [39,40]. A significant decrease in PGE2 levels was detected in the conditioned medium of T2D IPFP-ASCs, whereas Non-T2D IPFP-ASCs and Pre-T2D IPFP-ASCs showed increased PGE2 production (Figure 7A). Adipogenic differentiation of the three cell types revealed no significant difference in the production of PGE2 (Figure 7B). However, IL-1β stimulation of Pre-T2D IPFP-ASCs showed significantly more PGE2 production than stimulated Non-T2D and T2D IPFP-ASCs (Figure 7C). No significant differences were detected when co-cultured with M1 macrophages; however, Pre-T2D IPFP-ASCs showed higher concentrations (Figure 7D). All samples co-cultured with M2-induced macrophages had undetectable levels of PGE2 (data not shown).

4. Discussion

The data presented in this study demonstrate that IPFP-ASCs derived from Pre-T2D patients have a distinct expression of the pattern of COX-2 when compared to IPFP-ASCs isolated from Non-T2D and T2D patients. When co-cultured with M1 macrophages, Pre-T2D IPFP-ASCs demonstrated an increase in IL-6 gene expression compared to Non-T2D and T2D IPFP-ASCs. In addition, M1 macrophages showed reduced gene expression of TNFα and IL-6 after exposure to Pre-T2D IPFP-ASCs. Traditionally, samples collected from T2D patients represent the impact of type II diabetes mellitus on IPFP-ASCs [41]; however, a requirement for knee replacement surgery is that each patient must have their diabetes well controlled before surgery. Our data suggest that drugs administered to treat T2D could potentially impact experimental outcomes. Goldman et al. found in a long-term patient study that lifestyle changes and Metformin, a commonly prescribed treatment for T2D patients, are associated with decreases in adiponectin, leptin, and IL-6 serum levels [42].
Furthermore, Jenkins et al. found that serum IL-10 and LEP levels decreased in a T2D rat model after exercise treatment and delivery of Metformin [43]. Commonly, preparation for total knee arthroplasty for T2D patients entails an aggressive treatment program to bring their T2D symptoms under control, which raises concern over the effect of treatment on the inflammatory properties of ASCs. Therefore, we included a third sample group of patients diagnosed as pre-diabetic by their primary care physicians. This group was included because they have been diagnosed with heightened serum glucose levels, a potential proinflammatory condition, but have not yet received extensive treatments for T2D.
Most of the disparate properties of IPFP-ASC were described when comparing the Pre-T2D samples and the other two groups. While the cell surface markers CD73, CD90, and CD105, are expressed by ASCs, the non-T2D and T2D cell populations exhibited robust CD73, CD90 and CD105. However, a significant reduction in CD90 and CD105 was detected in the pre-T2D cells without a corresponding increase in other markers. Nawrocka et al. demonstrated that T2D ASCs isolated from subcutaneous adipose tissue (ScAT-ASCs) have similar expression of CD90, CD73, and CD105 to Non-T2D ScAT-ASCs [44]. However, Ferrer et al. found a decrease in CD90, CD73, and CD105 of ScAT-ASCs isolated from a murine T2D model [45]. This is the first investigation into CD90, CD73, and CD105 expression of human ASCs derived from adipose collected from Pre-T2D patients. We hypothesize that changes in cell surface markers by Pre-T2D IPFP-ASCs could result from microenvironmental changes in the adipose tissue depot due to the onset of T2D. The decrease in CD105 expression has been associated with the differentiation of ASCs [45]. Thus, changes in the cellular composition of the IPFP after T2D initiation could partially be accounted for by IPFP-ASC differentiation. The sub-population of Pre-T2D IPFP-ASCs negative for CD90, CD73, and CD105 could be in the beginning stages of differentiation. Bi-lineage differentiation assays revealed no notable differences in adipogenic or osteogenic differentiation potential of Pre-T2D IPFP-ASCs compared to Non-T2D IPFP-ASCs. However, a decrease in differentiation potential may have been detected if the changes in cell surface markers indicated the beginning stages of differentiation.
Notably, COX-2 expression was increased in Pre-T2D IPFP-ASCs compared to Non-T2D and T2D IPFP-ASCs in an unstimulated state and again after IL-1β stimulation. The COX-2 enzyme is responsible for PGE2 synthesis [46,47]. When stimulated with IL-1β, PGE2 concentrations in Pre-T2D conditioned media were significantly higher as compared to media conditioned by Non-T2D and T2D IPFP-ASCs. Human cartilage explants exhibited a PGE2 dose-dependent response towards the elevated expression of MMP-13 and ADAMTS-5, typically found at elevated levels in OA synovial fluids [48,49]. For this reason, COX-2 inhibitors such as celecoxib are common medications prescribed to OA patients to reduce local inflammation, and PGE2 function is largely considered catabolic in cartilage tissue [47,48]. The increased expression of COX-2 and concentration of PGE2 by Pre-T2D IPFP-ASCs suggests heightened concentrations of PGE2 in the IPFP that would diffuse into the joint space. Long-term disruptive synovial PGE2 concentration in Pre-T2D patients could induce a more catabolic state within cartilage and increase the risk of OA after joint injury.
Synovial macrophages play an essential role in cartilage catabolism and the persistence of the inflammatory state within cartilage in OA [4,50]. Macrophages are broadly classified into three functional categories, a resting (M0) phenotype, a pro-inflammatory (M1) phenotype and an anti-inflammatory (M2) phenotype [51]. It is commonly believed that OA patients have increased M1 activity by synovial macrophages, which may be linked to aberrant immunomodulation by IPFP-ASCs in T2D patients. When co-cultured with M1 macrophages, Pre-T2D IPFP-ASCs exhibited increased expression of IL-6 and a decrease in IL-10, suggesting they promote increased M1 induction of macrophages in an inflammatory environment. In fact, after co-culture with Pre-T2D IPFP-ASCs, M2 macrophages exhibited an altered cytokine expression pattern towards an M1 phenotype. In addition, PGE2 expression has been found to increase the anti-inflammatory properties of ASCs through an IL-6-dependent pathway [52,53]. Although COX-2 expression levels were not found to be different between Non-T2D, Pre-T2D, and T2D IPFP ASCs co-cultured with M1 macrophages, there was a significant increase in IL-6 expression. The adjacency of the IPFP to the synovium has led to the belief that the IPFP and the synovium may act as a morpho-functional unit, as reviewed by Macchi [54].
Furthermore, Stocco et al. demonstrated increased expression of HLA-DR, Fas, and FasL by IPFP-ASCs isolated from OA patients, indicating a response of the IPFP to synovial inflammation [55]. We hypothesize that IPFP-ASCs are primed toward increasing COX-2 expression in Pre-T2D patients by exposure to chronic low-grade inflammation associated with diabetes. While higher COX-2 expression increases the anti-inflammatory potential of IPFP-ASCs, the elevated PGE2 concentrations in the IPFP may induce a more catabolic state in cartilage. Future work will focus on balancing COX-2 expression in IPFP-ASC and synovial PGE2 activity.
Pre-T2D IPFP ASCs also demonstrated a robust increase (fold change >1000) in FOXG1 expression compared to Non-T2D IPFP ASCs in all experimental conditions, reaching significance after IL-1β stimulation. FOXG1 is a known inhibitor of FOXO and inhibits the PI3K pathway, a major downstream pathway of insulin receptors [56,57]. Loss of FOXO expression has been implicated in the maintenance of insulin resistance in T2D patients, as reviewed by Maiese et al., but little is known about the mechanism of action [58]. Because the FOXG1/FOXO mode of action in diabetes has yet to be elucidated, it is difficult to say what functional role FOXG1 plays in IPFP-ASCs. However, increased FOXG1 expression does imply that Pre-T2D IPFP-ASCs are exhibiting a diabetes-related genotype. In addition, there is evidence of nerve ingrowth into the cartilage and osteochondral junction in mid to late-stage OA, possibly in an attempt to regulate cartilage degradation [59]. The IPFP also contains nociceptive receptors responsive to IL-1β, IL-6, and TNFα [34,60]. FOXG1 expression in ASCs is commonly studied as a transcription factor for neuronal differentiation [61]. Thus, the upregulation of FOXG1 may suggest an increase in neuronal Pre-T2D IPFP-ASC differentiation potential that could account for increased pain and sensitivity experienced by OA patients.
These studies have established critical transcriptional differences between Non-T2D IPFP-ASCs, Pre-T2D IPFP-ASCs, and T2D IPFP-ASCs that suggest the Pre-T2D condition increases the sensitivity of IPFP-ASCs to a proinflammatory environment. However, many differences between Non-T2D IPFP-ASCs and Pre-T2D IPFP-ASCs were not found in T2D IPFP-ASCs. As noted above, typical T2D treatments have successfully reduced serum levels of LEP and IL-6. Similarly, T2D therapies appear to be effective in returning the expression of LEP and IL-6 by IPFP-ASCs to levels found in Non-T2D, suggesting that earlier T2D intervention may be required, especially in patients who also exhibit OA symptoms.
While all cell types exhibited clonogenic ability, the T2D IPFP-ASCs had significantly increased clonogenic efficiency than the Non-T2D IPFP-ASCs. Nawrocka et al. demonstrated that T2D ScAT-ASCs had suppressed clonogenic expression more than Non-T2D Sc-AT-ASCs. In contrast, Cramer et al. found that long-term high glucose exposure does not significantly impact the clonogenic ability of ASCs [29]. Previously, the same group demonstrated that exposure to basic fibroblast growth factor (bFGF) ameliorates T2D-associated changes in clonogenic ability by ScAT-ASCs; however, bFGF was not investigated in this study [44] Other limitations include (1) lack of information from the clinician about the patient’s treatment which might influence the stemness of IPFP-ASCs and (2) all cells were isolated from patients undergoing knee arthroplasty in response to severe OA symptoms. (3) OA-associated synovial inflammation may have obscured potential differences between Non-T2D, Pre-T2D, and T2D patients due to the overlap of inflammatory pathways between T2D and OA.
The data presented here demonstrate both catabolic and anabolic alterations in Pre-T2D IPFP-ASCs, leading to uncertainty about the overall effect of T2D on OA. Future studies will utilize these characterized IPFP-ASC populations co-cultured with osteoblasts, chondrocytes, and synovial fibroblasts to investigate adipose-mediated diabetic complications associated with OA and the impact of diabetes on chondrocyte activity. This can be done using standard transwell cultures and our previously published OA knee microphysiological system [39,62,63].

5. Conclusions

The observations reported here suggest that IPFP-ASCs may contribute to an enhanced immune response through the increased expression of COX-2 and IL-6 when stimulated with IL-1β or co-cultured with M1 macrophages. Moreover, Pre-T2D IPFP-ASCs have elevated expression of COX-2 and enhanced production of PGE2 under inflammatory conditions. Our data suggest that while IPFP-ASCs may have therapeutic potential due to their anti-inflammatory and differentiation properties, exposure to a pro-inflammatory environment, e.g., IL-1β stimulation and diabetic status, may reduce these therapeutic properties.

Supplementary Materials

The following supporting information can be downloaded at: https://www.mdpi.com/article/10.3390/cells11152367/s1, Figure S1: Decreased expression of CD90, CD73, and CD105 by Pre-T2D IPFP-ASCs; Figure S2: Alizarin Red representative image of IPFP-ASCs cultured in pro-osteogenic media for 28 days; Figure S3: Decreased TNFα, IL-1β, and IL-6 expression by M2 stimulated macrophages after co-culture with Pre-T2D IPFP-ASCs.

Author Contributions

B.T.O., T.A.M., M.P.L. and C.J.I. conducted all experiments and data analyses. B.T.O. and S.A.-G. wrote the manuscript. B.A.B., H.L., R.S.T. and S.B.G. designed all experimental procedures, supervised the project, and revised the manuscript. C.R., M.R.-L., Z.L. and S.A.-G. contributed to implementing the research and/or the results. All the authors edited the manuscript. All authors have read and agreed to the published version of the manuscript.

Funding

This work was supported by the National Institutes of Health (UG3/UH3 TR0021360) and the National Science Foundation (DGE-1144646).

Institutional Review Board Statement

The study was conducted in accordance with the Declaration of Helsinki and was approved by the Institutional Review Board of Stanford University (IRB approval #43908). A second IRB approval as an exempt protocol was obtained from the North Texas IRB.

Informed Consent Statement

Not applicable.

Data Availability Statement

Not applicable.

Acknowledgments

The authors would like to thank Alan Tucker in the Tulane University Center for Stem Cell Research Flow Cytometry core for his expertise.

Conflicts of Interest

The authors declare no conflict of interest.

References

  1. Deshpande, B.R.; Katz, J.N.; Solomon, D.H.; Yelin, E.H.; Hunter, D.J.; Messier, S.P.; Suter, L.G.; Losina, E. Number of persons with symptomatic knee osteoarthritis in the US: Impact of race and ethnicity, age, sex, and obesity. Arthritis Care Res. 2016, 68, 1743–1750. [Google Scholar] [CrossRef] [PubMed]
  2. Cross, M.; Smith, E.; Hoy, D.; Nolte, S.; Ackerman, I.; Fransen, M.; Bridgett, L.; Williams, S.; Guillemin, F.; Hill, C.L.; et al. The global burden of hip and knee osteoarthritis: Estimates from the global burden of disease 2010 study. Ann. Rheum. Dis. 2014, 73, 1323–1330. [Google Scholar] [CrossRef]
  3. Goldring, S.R.; Goldring, M.B. Clinical aspects, pathology and pathophysiology of osteoarthritis. J. Musculoskelet. Neuronal. Interact. 2006, 6, 376–378. [Google Scholar] [PubMed]
  4. Bondeson, J.; Wainwright, S.D.; Lauder, S.; Amos, N.; Hughes, C.E. The role of synovial macrophages and macrophage-produced cytokines in driving aggrecanases, matrix metalloproteinases, and other destructive and inflammatory responses in osteoarthritis. Arthritis Res. Ther. 2006, 8, R187. [Google Scholar] [CrossRef]
  5. Song, I.H.; Althoff, C.E.; Hermann, K.G.; Scheel, A.K.; Knetsch, T.; Schoenharting, M.; Werner, C.; Burmester, G.R.; Backhaus, M. Knee osteoarthritis. Efficacy of a new method of contrast-enhanced musculoskeletal ultrasonography in detection of synovitis in patients with knee osteoarthritis in comparison with magnetic resonance imaging. Ann. Rheum. Dis. 2008, 67, 19–25. [Google Scholar] [CrossRef] [PubMed]
  6. Krasnokutsky, S.; Belitskaya-Lévy, I.; Bencardino, J.; Samuels, J.; Attur, M.; Regatte, R.; Rosenthal, P.; Greenberg, J.; Schweitzer, M.; Abramson, S.B.; et al. Quantitative magnetic resonance imaging evidence of synovial proliferation is associated with radiographic severity of knee osteoarthritis. Arthritis Rheum. 2011, 63, 2983–2991. [Google Scholar] [CrossRef]
  7. Chen, D.; Shen, J.; Zhao, W.; Wang, T.; Han, L.; Hamilton, J.L.; Im, H.J. Osteoarthritis: Toward a comprehensive understanding of pathological mechanism. Bone Res. 2017, 5, 16044. [Google Scholar] [CrossRef]
  8. Rezuş, E.; Burlui, A.; Cardoneanu, A.; Macovei, L.A.; Tamba, B.I.; Rezuş, C. From pathogenesis to therapy in knee osteoarthritis: Bench-to-bedside. Int. J. Mol. Sci. 2021, 22, 2697. [Google Scholar] [CrossRef]
  9. Buschemeyer, W.C., 3rd; Freedland, S.J. Obesity and prostate cancer: Epidemiology and clinical implications. Eur. Urol. 2007, 52, 331–343. [Google Scholar] [CrossRef]
  10. Jiang, L.F.; Fang, J.H.; Wu, L.D. Role of infrapatellar fat pad in pathological process of knee osteoarthritis: Future applications in treatment. World J. Clin. Cases 2019, 7, 2134–2142. [Google Scholar] [CrossRef] [PubMed]
  11. Sohn, D.H.; Sokolove, J.; Sharpe, O.; Erhart, J.C.; Chandra, P.E.; Lahey, L.J.; Lindstrom, T.M.; Hwang, I.; Boyer, K.A.; Andriacchi, T.P.; et al. Plasma proteins present in osteoarthritic synovial fluid can stimulate cytokine production via Toll-like receptor 4. Arthritis Res. Ther. 2012, 14, R7. [Google Scholar] [CrossRef] [PubMed]
  12. Kaneko, S.; Satoh, T.; Chiba, J.; Ju, C.; Inoue, K.; Kagawa, J. Interleukin-6 and interleukin-8 levels in serum and synovial fluid of patients with osteoarthritis. Cytokines Cell Mol. Ther. 2000, 6, 71–79. [Google Scholar] [CrossRef] [PubMed]
  13. Goldring, M.B.; Birkhead, J.R.; Suen, L.F.; Yamin, R.; Mizuno, S.; Glowacki, J.; Arbiser, J.L.; Apperley, J.F. Interleukin-1 beta-modulated gene expression in immortalized human chondrocytes. J. Clin. Investig. 1994, 94, 2307–2316. [Google Scholar] [CrossRef] [PubMed]
  14. Westacott, C.I.; Atkins, R.M.; Dieppe, P.A.; Elson, C.J. Tumor necrosis factor-alpha receptor expression on chondrocytes isolated from human articular cartilage. J. Rheumatol. 1994, 21, 1710–1715. [Google Scholar] [PubMed]
  15. Xue, J.; Wang, J.; Liu, Q.; Luo, A. Tumor necrosis factor-α induces ADAMTS-4 expression in human osteoarthritis chondrocytes. Mol. Med. Rep. 2013, 8, 1755–1760. [Google Scholar] [CrossRef]
  16. Pearle, A.D.; Scanzello, C.R.; George, S.; Mandl, L.A.; DiCarlo, E.F.; Peterson, M.; Sculco, T.P.; Crow, M.K. Elevated high-sensitivity C-reactive protein levels are associated with local inflammatory findings in patients with osteoarthritis. Osteoarthr. Cartil. 2007, 15, 516–523. [Google Scholar] [CrossRef]
  17. Ballegaard, C.; Riis, R.G.; Bliddal, H.; Christensen, R.; Henriksen, M.; Bartels, E.M.; Lohmander, L.S.; Hunter, D.J.; Bouert, R.; Boesen, M. Knee pain and inflammation in the infrapatellar fat pad estimated by conventional and dynamic contrast-enhanced magnetic resonance imaging in obese patients with osteoarthritis: A cross-sectional study. Osteoarthr. Cartil. 2014, 22, 933–940. [Google Scholar] [CrossRef]
  18. Hotamisligil, G.S. Inflammation, metaflammation and immunometabolic disorders. Nature 2017, 542, 177. [Google Scholar] [CrossRef] [PubMed]
  19. Katsuki, A.; Sumida, Y.; Murashima, S.; Murata, K.; Takarada, Y.; Ito, K.; Fujii, M.; Tsuchihashi, K.; Goto, H.; Nakatani, K.; et al. Serum levels of tumor necrosis factor-alpha are increased in obese patients with noninsulin-dependent diabetes mellitus. J. Clin. Endocrinol. Metab. 1998, 83, 859–862. [Google Scholar] [CrossRef] [PubMed]
  20. Yusuf, E.; Nelissen, R.G.; Ioan-Facsinay, A.; Stojanovic-Susulic, V.; DeGroot, J.; van Osch, G.; Middeldorp, S.; Huizinga, T.W.; Kloppenburg, M. Association between weight or body mass index and hand osteoarthritis: A systematic review. Ann. Rheum. Dis. 2010, 69, 761–765. [Google Scholar] [CrossRef]
  21. Schett, G.; Kleyer, A.; Perricone, C.; Sahinbegovic, E.; Iagnocco, A.; Zwerina, J.; Lorenzini, R.; Aschenbrenner, F.; Berenbaum, F.; D’Agostino, M.A.; et al. Diabetes is an independent predictor for severe osteoarthritis: Results from a longitudinal cohort study. Diabetes Care 2013, 36, 403–409. [Google Scholar] [CrossRef]
  22. Presle, N.; Pottie, P.; Dumond, H.; Guillaume, C.; Lapicque, F.; Pallu, S.; Mainard, D.; Netter, P.; Terlain, B. Differential distribution of adipokines between serum and synovial fluid in patients with osteoarthritis. Contribution of joint tissues to their articular production. Osteoarthr. Cartil. 2006, 14, 690–695. [Google Scholar] [CrossRef] [PubMed]
  23. Simopoulou, T.; Malizos, K.N.; Iliopoulos, D.; Stefanou, N.; Papatheodorou, L.; Ioannou, M.; Tsezou, A. Differential expression of leptin and leptin’s receptor isoform (Ob-Rb) mRNA between advanced and minimally affected osteoarthritic cartilage; effect on cartilage metabolism. Osteoarthr. Cartil. 2007, 15, 872–883. [Google Scholar] [CrossRef] [PubMed]
  24. Hui, W.; Litherland, G.J.; Elias, M.S.; Kitson, G.I.; Cawston, T.E.; Rowan, A.D.; Young, D.A. Leptin produced by joint white adipose tissue induces cartilage degradation via upregulation and activation of matrix metalloproteinases. Ann. Rheum. Dis. 2012, 71, 455–462. [Google Scholar] [CrossRef]
  25. Sakaguchi, Y.; Sekiya, I.; Yagishita, K.; Muneta, T. Comparison of human stem cells derived from various mesenchymal tissues: Superiority of synovium as a cell source. Arthritis Rheum. 2005, 52, 2521–2529. [Google Scholar] [CrossRef]
  26. Lee, W.S.; Kim, H.J.; Kim, K.I.; Kim, G.B.; Jin, W. Intra-Articular Injection of Autologous Adipose Tissue-Derived Mesenchymal Stem Cells for the Treatment of Knee Osteoarthritis: A Phase IIb, Randomized, Placebo-Controlled Clinical Trial. Stem Cells Transl. Med. 2019, 8, 504–511. [Google Scholar] [CrossRef] [PubMed]
  27. Koh, Y.G.; Choi, Y.J. Infrapatellar fat pad-derived mesenchymal stem cell therapy for knee osteoarthritis. Knee 2012, 19, 902–907. [Google Scholar] [CrossRef]
  28. Ter Huurne, M.; Schelbergen, R.; Blattes, R.; Blom, A.; de Munter, W.; Grevers, L.C.; Jeanson, J.; Noël, D.; Casteilla, L.; Jorgensen, C.; et al. Antiinflammatory and chondroprotective effects of intraarticular injection of adipose-derived stem cells in experimental osteoarthritis. Arthritis Rheum. 2012, 64, 3604. [Google Scholar] [CrossRef] [PubMed]
  29. Cramer, C.; Freisinger, E.; Jones, R.K.; Slakey, D.P.; Dupin, C.L.; Newsome, E.R.; Alt, E.U.; Izadpanah, R. Persistent high glucose concentrations alter the regenerative potential of mesenchymal stem cells. Stem Cells Dev. 2010, 19, 1875–1884. [Google Scholar] [CrossRef] [PubMed]
  30. Choudhery, M.S.; Badowski, M.; Muise, A.; Pierce, J.; Harris, D.T. Donor age negatively impacts adipose tissue-derived mesenchymal stem cell expansion and differentiation. J. Transl. Med. 2014, 12, 8. [Google Scholar] [CrossRef] [PubMed]
  31. Dufrane, D. Impact of Age on Human Adipose Stem Cells for Bone Tissue Engineering. Cell Transpl. 2017, 26, 1496–1504. [Google Scholar] [CrossRef] [PubMed]
  32. Silva, K.R.; Côrtes, I.; Liechocki, S.; Carneiro, J.R.; Souza, A.A.; Borojevic, R.; Maya-Monteiro, C.M.; Baptista, L.S. Characterization of stromal vascular fraction and adipose stem cells from subcutaneous, preperitoneal and visceral morbidly obese human adipose tissue depots. PLoS ONE 2017, 12, e0174115. [Google Scholar] [CrossRef]
  33. Skalska, U.; Kontny, E. Adipose-derived mesenchymal stem cells from infrapatellar fat pad of patients with rheumatoid arthritis and osteoarthritis have comparable immunomodulatory properties. Autoimmunity 2016, 49, 124–131. [Google Scholar] [CrossRef]
  34. Bohnsack, M.; Meier, F.; Walter, G.; Hurschler, C.; Schmolke, S.; Wirth, C.; Rühmann, O. Distribution of substance-P nerves inside the infrapatellar fat pad and the adjacent synovial tissue: A neurohistological approach to anterior knee pain syndrome. Arch. Orthop. Trauma Surg. 2005, 125, 592–597. [Google Scholar] [CrossRef]
  35. Klein-Wieringa, I.R.; de Lange-Brokaar, B.J.E.; Yusuf, E.; Andersen, S.N.; Kwekkeboom, J.C.; Kroon, H.M.; van Osch, G.J.V.M.; Zuurmond, A.-M.; Stojanovic-Susulic, V.; Nelissen, R.G.H.H.; et al. Inflammatory cells in patients with endstage knee osteoarthritis: A comparison between the synovium and the infrapatellar fat pad. J. Rheumatol. 2016, 43, 771. [Google Scholar] [CrossRef]
  36. Liu, Y.; Buckley, C.T.; Almeida, H.V.; Mulhall, K.J.; Kelly, D.J. Infrapatellar fat pad- derived stem cells maintain their chondrogenic capacity in disease and can be used to engineer cartilaginous grafts of clinically relevant dimensions. Tissue Eng. Part A 2014, 20, 3050. [Google Scholar] [CrossRef] [PubMed]
  37. Skalska, U.; Kontny, E.; Prochorec-Sobieszek, M.; Maśliński, W. Intra-articular adipose-derived mesenchymal stem cells from rheumatoid arthritis patients maintain the function of chondrogenic differentiation. Rheumatology 2012, 51, 1757–1764. [Google Scholar] [CrossRef] [PubMed]
  38. Bunnell, B.A.; Flaat, M.; Gagliardi, C.; Patel, B.; Ripoll, C. Adipose-derived stem cells: Isolation, expansion and differentiation. Methods 2008, 45, 115–120. [Google Scholar] [CrossRef] [PubMed]
  39. Lin, Z.; Li, Z.; Li, E.N.; Li, X.; Del Duke, C.J.; Shen, H.; Hao, T.; O’Donnell, B.; Bunnell, B.A.; Goodman, S.B.; et al. Osteochondral tissue chip derived from iPSCs: Modeling OA pathologies and testing drugs. Front. Bioeng. Biotechnol. 2019, 7, 411. [Google Scholar] [CrossRef]
  40. Arendt-Nielsen, L.; Egsgaard, L.L.; Petersen, K.K. Evidence for a central mode of action for etoricoxib (COX-2 inhibitor) in patients with painful knee osteoarthritis. Pain 2016, 157, 1634–1644. [Google Scholar] [CrossRef] [PubMed]
  41. Alicka, M.; Major, P.; Wysocki, M.; Marycz, K. Adipose-derived mesenchymal stem cells isolated from patients with type 2 diabetes show reduced “stemness” through an altered secretome profile, impaired anti-oxidative protection, and mitochondrial dynamics deterioration. J. Clin. Med. 2019, 8, 765. [Google Scholar] [CrossRef] [PubMed]
  42. Goldberg, R.B.; Bray, G.A.; Marcovina, S.M.; Mather, K.J.; Orchard, T.J.; Perreault, L.; Temprosa, M. Non-traditional biomarkers and incident diabetes in the Diabetes Prevention Program: Comparative effects of lifestyle and metformin interventions. Diabetologia 2019, 62, 58–69. [Google Scholar] [CrossRef]
  43. Jenkins, N.T.; Padilla, J.; Arce-Esquivel, A.A.; Bayless, D.S.; Martin, J.S.; Leidy, H.J.; Booth, F.W.; Rector, R.S.; Laughlin, M.H. Effects of endurance exercise training, metformin, and their combination on adipose tissue leptin and IL-10 secretion in OLETF rats. J. Appl. Physiol. 2012, 113, 1873–1883. [Google Scholar] [CrossRef] [PubMed]
  44. Nawrocka, D.; Kornicka, K.; Szydlarska, J.; Marycz, K. Basic fibroblast growth factor inhibits apoptosis and promotes proliferation of adipose-derived mesenchymal stromal cells isolated from patients with type 2 diabetes by reducing cellular oxidative stress. Oxid. Med. Cell. Longev. 2017, 2017, 3027109. [Google Scholar] [CrossRef]
  45. Mohsen-Kanson, T.; Hafner, A.-L.; Wdziekonski, B.; Villageois, P.; Chignon-Sicard, B.; Dani, C. Expression of cell surface markers during self-renewal and differentiation of human adipose-derived stem cells. Biochem. Bioph. Res. Commun. 2013, 430, 871–875. [Google Scholar] [CrossRef] [PubMed]
  46. Martel-Pelletier, J.; Pelletier, J.P.; Fahmi, H. Cyclooxygenase-2 and prostaglandins in articular tissues. Semin. Arthritis Rheum. 2003, 33, 155–167. [Google Scholar] [CrossRef]
  47. Anderson, G.D.; Hauser, S.D.; McGarity, K.L.; Bremer, M.E.; Isakson, P.C.; Gregory, S.A. Selective inhibition of cyclooxygenase (COX)-2 reverses inflammation and expression of COX-2 and interleukin 6 in rat adjuvant arthritis. J. Clin. Investig. 1996, 97, 2672–2679. [Google Scholar] [CrossRef]
  48. Attur, M.; Al-Mussawir, H.E.; Patel, J.; Kitay, A.; Dave, M.; Palmer, G.; Pillinger, M.H.; Abramson, S.B. Prostaglandin E2 exerts catabolic effects in osteoarthritis cartilage: Evidence for signaling via the EP4 receptor. J. Immunol. 2008, 181, 5082–5088. [Google Scholar] [CrossRef] [PubMed]
  49. Wang, X.; Li, F.; Fan, C.; Wang, C.; Ruan, H. Analysis of isoform specific ERK signaling on the effects of interleukin-1β on COX-2 expression and PGE2 production in human chondrocytes. Biochem. Biophys. Res. Commun. 2010, 402, 23–29. [Google Scholar] [CrossRef]
  50. Griffin, T.M.; Scanzello, C.R. Innate inflammation and synovial macrophages in osteoarthritis pathophysiology. Clin. Exp. Rheumatol. 2019, 37 (Suppl. S120), 57–63. [Google Scholar] [PubMed]
  51. Murray, P.J.; Allen, J.E.; Biswas, S.K.; Fisher, E.A.; Gilroy, D.W.; Goerdt, S.; Gordon, S.; Hamilton, J.A.; Ivashkiv, L.B.; Lawrence, T.; et al. Macrophage activation and polarization: Nomenclature and experimental guidelines. Immunity 2014, 41, 14–20. [Google Scholar] [CrossRef] [PubMed]
  52. Bouffi, C.; Bony, C.; Courties, G.; Jorgensen, C.; Noël, D. IL-6-dependent PGE2 secretion by mesenchymal stem cells inhibits local inflammation in experimental arthritis. PLoS ONE 2010, 5, e14247. [Google Scholar] [CrossRef] [PubMed]
  53. Yañez, R.; Oviedo, A.; Aldea, M.; Bueren, J.A.; Lamana, M.L. Prostaglandin E2 plays a key role in the immunosuppressive properties of adipose and bone marrow tissue-derived mesenchymal stromal cells. Exp. Cell Res. 2010, 316, 3109–3123. [Google Scholar] [CrossRef] [PubMed]
  54. Macchi, V.; Stocco, E.; Stecco, C.; Belluzzi, E.; Favero, M.; Porzionato, A.; De Caro, R. The infrapatellar fat pad and the synovial membrane: An anatomo-functional unit. J. Anat. 2018, 233, 146–154. [Google Scholar] [CrossRef] [PubMed]
  55. Stocco, E.; Barbon, S.; Piccione, M.; Belluzzi, E.; Petrelli, L.; Pozzuoli, A.; Ramonda, R.; Rossato, M.; Favero, M.; Ruggieri, P.; et al. Infrapatellar Fat Pad Stem Cells Responsiveness to Microenvironment in Osteoarthritis: From Morphology to Function. Front. Cell Dev. Biol. 2019, 7, 323. [Google Scholar] [CrossRef]
  56. Arden, K.C. FoxO: Linking new signaling pathways. Mol. Cell 2004, 14, 416–418. [Google Scholar] [CrossRef]
  57. Wang, L.; Wang, J.; Jin, T.; Zhou, Y.; Chen, Q. FoxG1 facilitates proliferation and inhibits differentiation by downregulating FoxO/Smad signaling in glioblastoma. Biochem. Biophys. Res. Commun. 2018, 504, 46–53. [Google Scholar] [CrossRef]
  58. Maiese, K. FoxO transcription factors and regenerative pathways in diabetes mellitus. Curr. Neurovasc. Res. 2015, 12, 404–413. [Google Scholar] [CrossRef]
  59. Suri, S.; Gill, S.E.; Massena de Camin, S.; McWilliams, D.F.; Wilson, D.; Walsh, D.A. Neurovascular invasion at the osteochondral junction and in osteophytes in osteoarthritis. Ann. Rheum. Dis. 2007, 66, 1423. [Google Scholar] [CrossRef]
  60. Sommer, C.; Kress, M. Recent findings on how proinflammatory cytokines cause pain: Peripheral mechanisms in inflammatory and neuropathic hyperalgesia. Neurosci. Lett. 2004, 361, 184–187. [Google Scholar] [CrossRef]
  61. Hu, F.; Sun, B.; Xu, P.; Zhu, Y.; Meng, X.H.; Teng, G.J.; Xiao, Z.D. MiR-218 induces neuronal differentiation of ASCs in a temporally sequential manner with fibroblast growth factor by regulation of the wnt signaling pathway. Sci. Rep. 2017, 7, 39427. [Google Scholar] [CrossRef] [PubMed]
  62. O’Donnell, B.T.; Al-Ghadban, S.; Ives, C.J.; L’Ecuyer, M.P.; Monjure, T.A.; Romero-Lopez, M.; Li, Z.; Goodman, S.B.; Lin, H.; Tuan, R.S.; et al. Adipose tissue-derived stem cells retain their adipocyte differentiation potential in three-dimensional hydrogels and bioreactors. Biomolecules 2020, 10, 1070. [Google Scholar] [CrossRef] [PubMed]
  63. Romero-López, M.; Li, Z.; Rhee, C.; Maruyama, M.; Pajarinen, J.; O’Donnell, B.; Lin, T.H.; Lo, C.W.; Hanlon, J.; Dubowitz, R.; et al. Macrophage effects on mesenchymal stem cell osteogenesis in a three-dimensional in vitro bone model. Tissue Eng. Part A 2020, 26, 1099–1111. [Google Scholar] [CrossRef]
Figure 1. Decreased expression of CD90, CD73, and CD105 on Pre-T2D IPFP-ASCs. (A) Flow cytometry for CD90 and CD105 demonstrated decreased expression in Pre-T2D IPFP-ASCs compared to those from Non-T2D and T2D groups (n = 3, * p < 0.05). (B) CFU assay illustrated increased self-renewal properties in T2D IPFP-ASCs compared to Non-T2D (n = 3, * p < 0.05). (CF) RT-qPCR for common adipokines in ASCs and adipocyte differentiated ASCs demonstrated no significant difference in adipogenic potential between Non-T2D, Pre-T2D, and T2D IPFP-ASCs (n = 3, * p < 0.05, *** p < 0.001, **** p < 0.0001). Non-T2D IPFP ASCs 7-Day is the control Group set as 1. Non-T2D: IPFP-ASCs from donors without Type II diabetes mellitus, Pre-T2D: IPFP-ASCs from donors with pre-Type II diabetes mellitus, T2D: IPFP-ASCs from donors with type II diabetes mellitus, 7D: Confluent ASCs, AQ: Adipocyte Differentiated ASCs.
Cells 11 02367 g001
Figure 2. No significant differences in adipogenesis between IPFP-ASCS isolated from Non-T2D, Pre-T2D, and T2D donors. (AC) Oil Red O representative image of IPFP-ASC cultured in AdipoQual media for 28 Days (Scale Bar: 100 μm). (D) Isopropanol destaining of IPFP-ASCs cultured for 28 days in growth media or AdipoQual Media for 28 days (n = 3, * p < 0.05, ** p < 0.01,). Non-T2D: Non-Type II diabetes mellitus, Pre-T2D: Pre-Type II diabetes mellitus, T2D: Type II diabetes mellitus.
Cells 11 02367 g002
Figure 3. (A–I) Decreased expression of pro-inflammatory cytokines by IPFP-ASCs after adipocyte differentiation. (n = 3, * p < 0.05, ** p < 0.01, **** p < 0.0001). Non-T2D: Non-Type II diabetes mellitus, Pre-T2D: Pre-Type II diabetes mellitus, T2D: Type II diabetes mellitus.
Cells 11 02367 g003
Figure 4. (A–I) Increased expression of COX-2 in Pre-T2D IPFP-ASCs compared to Non-T2D and T2D IPFP-ASCs before and after IL-1β treatment. (n = 3, * p < 0.05, ** p < 0.01, *** p < 0.001). Non-T2D: Non-Type II diabetes mellitus, Pre-T2D: Pre-Type II diabetes mellitus, T2D: Type II diabetes mellitus.
Cells 11 02367 g004
Figure 5. Decreased TNFα and IL-6 expression by M1 macrophages after co-culture with Pre-T2D IPFP-ASCs. (AD) Macrophage mRNA expression determined by RT-qPCR (n = 3, * p < 0.05, ** p < 0.01, *** p < 0.001, **** p < 0.0001). Control Group: M0 Macrophages Co-cultured with Non-T2D-IPFP ASCsNon-T2D: Non-Type II diabetes mellitus, Pre-T2D: Pre-Type II diabetes mellitus, T2D: Type II diabetes mellitus.
Cells 11 02367 g005
Figure 6. Increased IL-6 and Cox-2 expression by Pre-T2D and T2D IPFP-ASCs after co-culture with M1 Macrophages. (AH) IPFP-ASC mRNA expression determined by RT-PCR (n = 3, * p < 0.05, ** p < 0.01, *** p < 0.001, **** p < 0.0001). Reference Group: Non-T2D, 7 Day. Non-T2D: Non-Type II diabetes mellitus, Pre-T2D: Pre-Type II diabetes mellitus, T2D: Type II diabetes mellitus.
Cells 11 02367 g006
Figure 7. Increased PGE2 concentration in Pre-T2D IPFP-ASC conditioned media after induction with IL-1β. (A–D) PGE2 Concentration as determined by ELISA per total protein content as determined by BCA (n = 3, * p < 0.05). Non-T2D: Non-Type II diabetes mellitus, Pre-T2D: Pre-Type II diabetes mellitus, T2D: Type II diabetes mellitus.
Cells 11 02367 g007
Table 1. Information on IPFP Donors.
GroupAgeBody Mass Index (BMI)
Non-Diabetic (Non-T2D, n = 3)65.7 ± 8.732.1 ± 9.0
Pre-Diabetic (Pre-T2D, n = 3)65.7 ± 4.5036.6 ± 6.0
Diabetic (T2D, n = 3)53.3 ± 11.332.1 ± 3.6
Table 2. Primer Sequences for RT-PCR.
NameForward (5′-3′)Reverse (5′-3′)
GAPDHTGGTGCTCAGTGTAGCCCAGGGACCTGACCTGCCGTCTAG
PPARγAGGCGAGGGCGATCTTGCCCATCATTAAGGAATTCATGTCATA
ADIPOQAACATGCCCATTCGCTTTACAGAGGCTGACCTTCACATCC
LEPGAAGACCACATCCACACACGAGCTCAGCCAGACCCATCTA
FABP4AGCACCATAACCTTAGATGGGGCGTGGAAGTGACGCCTTTCA
PL1NACAAGTTCAGTGAGGTAGCCTTGGTTGAGGAGACAG
LPLGAGATTTCTCTGTATGGCACTGCTGCAAATGAGACACTTTCTC
FOXG1GGCAAGGGCAACTACTGGATCTGAGTCAACACGGAGCTGT
IRS2TCTCAGGAAAAGCAGCGAGGTCACGTCGATGGCGATGTAG
IL-33GCCTTGTGTTTCAAGCTGGGCCAAAGGCAAAGCACTCCAC
ICAM-1ACCATCTACAGCTTTCCGGCCAATCCCTCTCGTCCAGTCG
IGFBP5AAGCCTCCCTCACTCTCCATTTCCTCCCCACATCGACTCT
IL-1βTCCCCAGCCCTTTTGTTGATTAGAACCAAATGTG
TNFαTCTTCTCGAACCCCGAGTGACCTCTGATGGCACCACCA
CCL-5CCCCATATTCCTCGGACACCTCCTTGACCTGTGGACGACT
COX-2TTGCTGGCAGGGTTGCTGGTGGTACATCTGCCTGCTCTGGTCAATCGAA
Publisher’s Note: MDPI stays neutral with regard to jurisdictional claims in published maps and institutional affiliations.

