
Quantitative Proteomics Reveals Significant Differences between Mouse Brain Formations in Expression of Proteins Involved in Neuronal Plasticity during Aging

 , , ,
, , ,
Abstract
: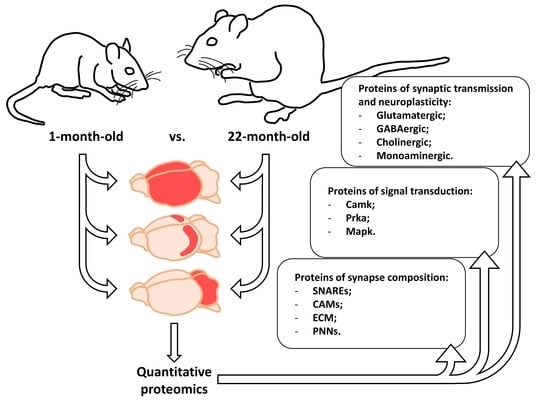
1. Introduction
2. Materials and Methods
2.1. Animals and Preparation of Tissues
2.2. Preparation of Tissue Lysates
2.3. Multi-Enzyme Digestion Filter-Aided Sample Preparation (MED FASP)
2.4. Liquid Chromatography-Tandem Mass Spectrometry
2.5. Proteomic Data Analysis
2.6. Statistical Analysis
3. Results
4. Glutamatergic Transmission
4.1. Gria
4.2. Grin
4.3. Grid
4.4. Grik
4.5. Grm
5. GABAergic Transmission
6. GABAA–Gabr
6.1. Gabra (subunit α)
6.2. Gabrb (subunit β)
6.3. Gabrg (subunit γ)
6.4. Gabrd (subunit δ)
7. GABAb–Gabbr
8. Gad
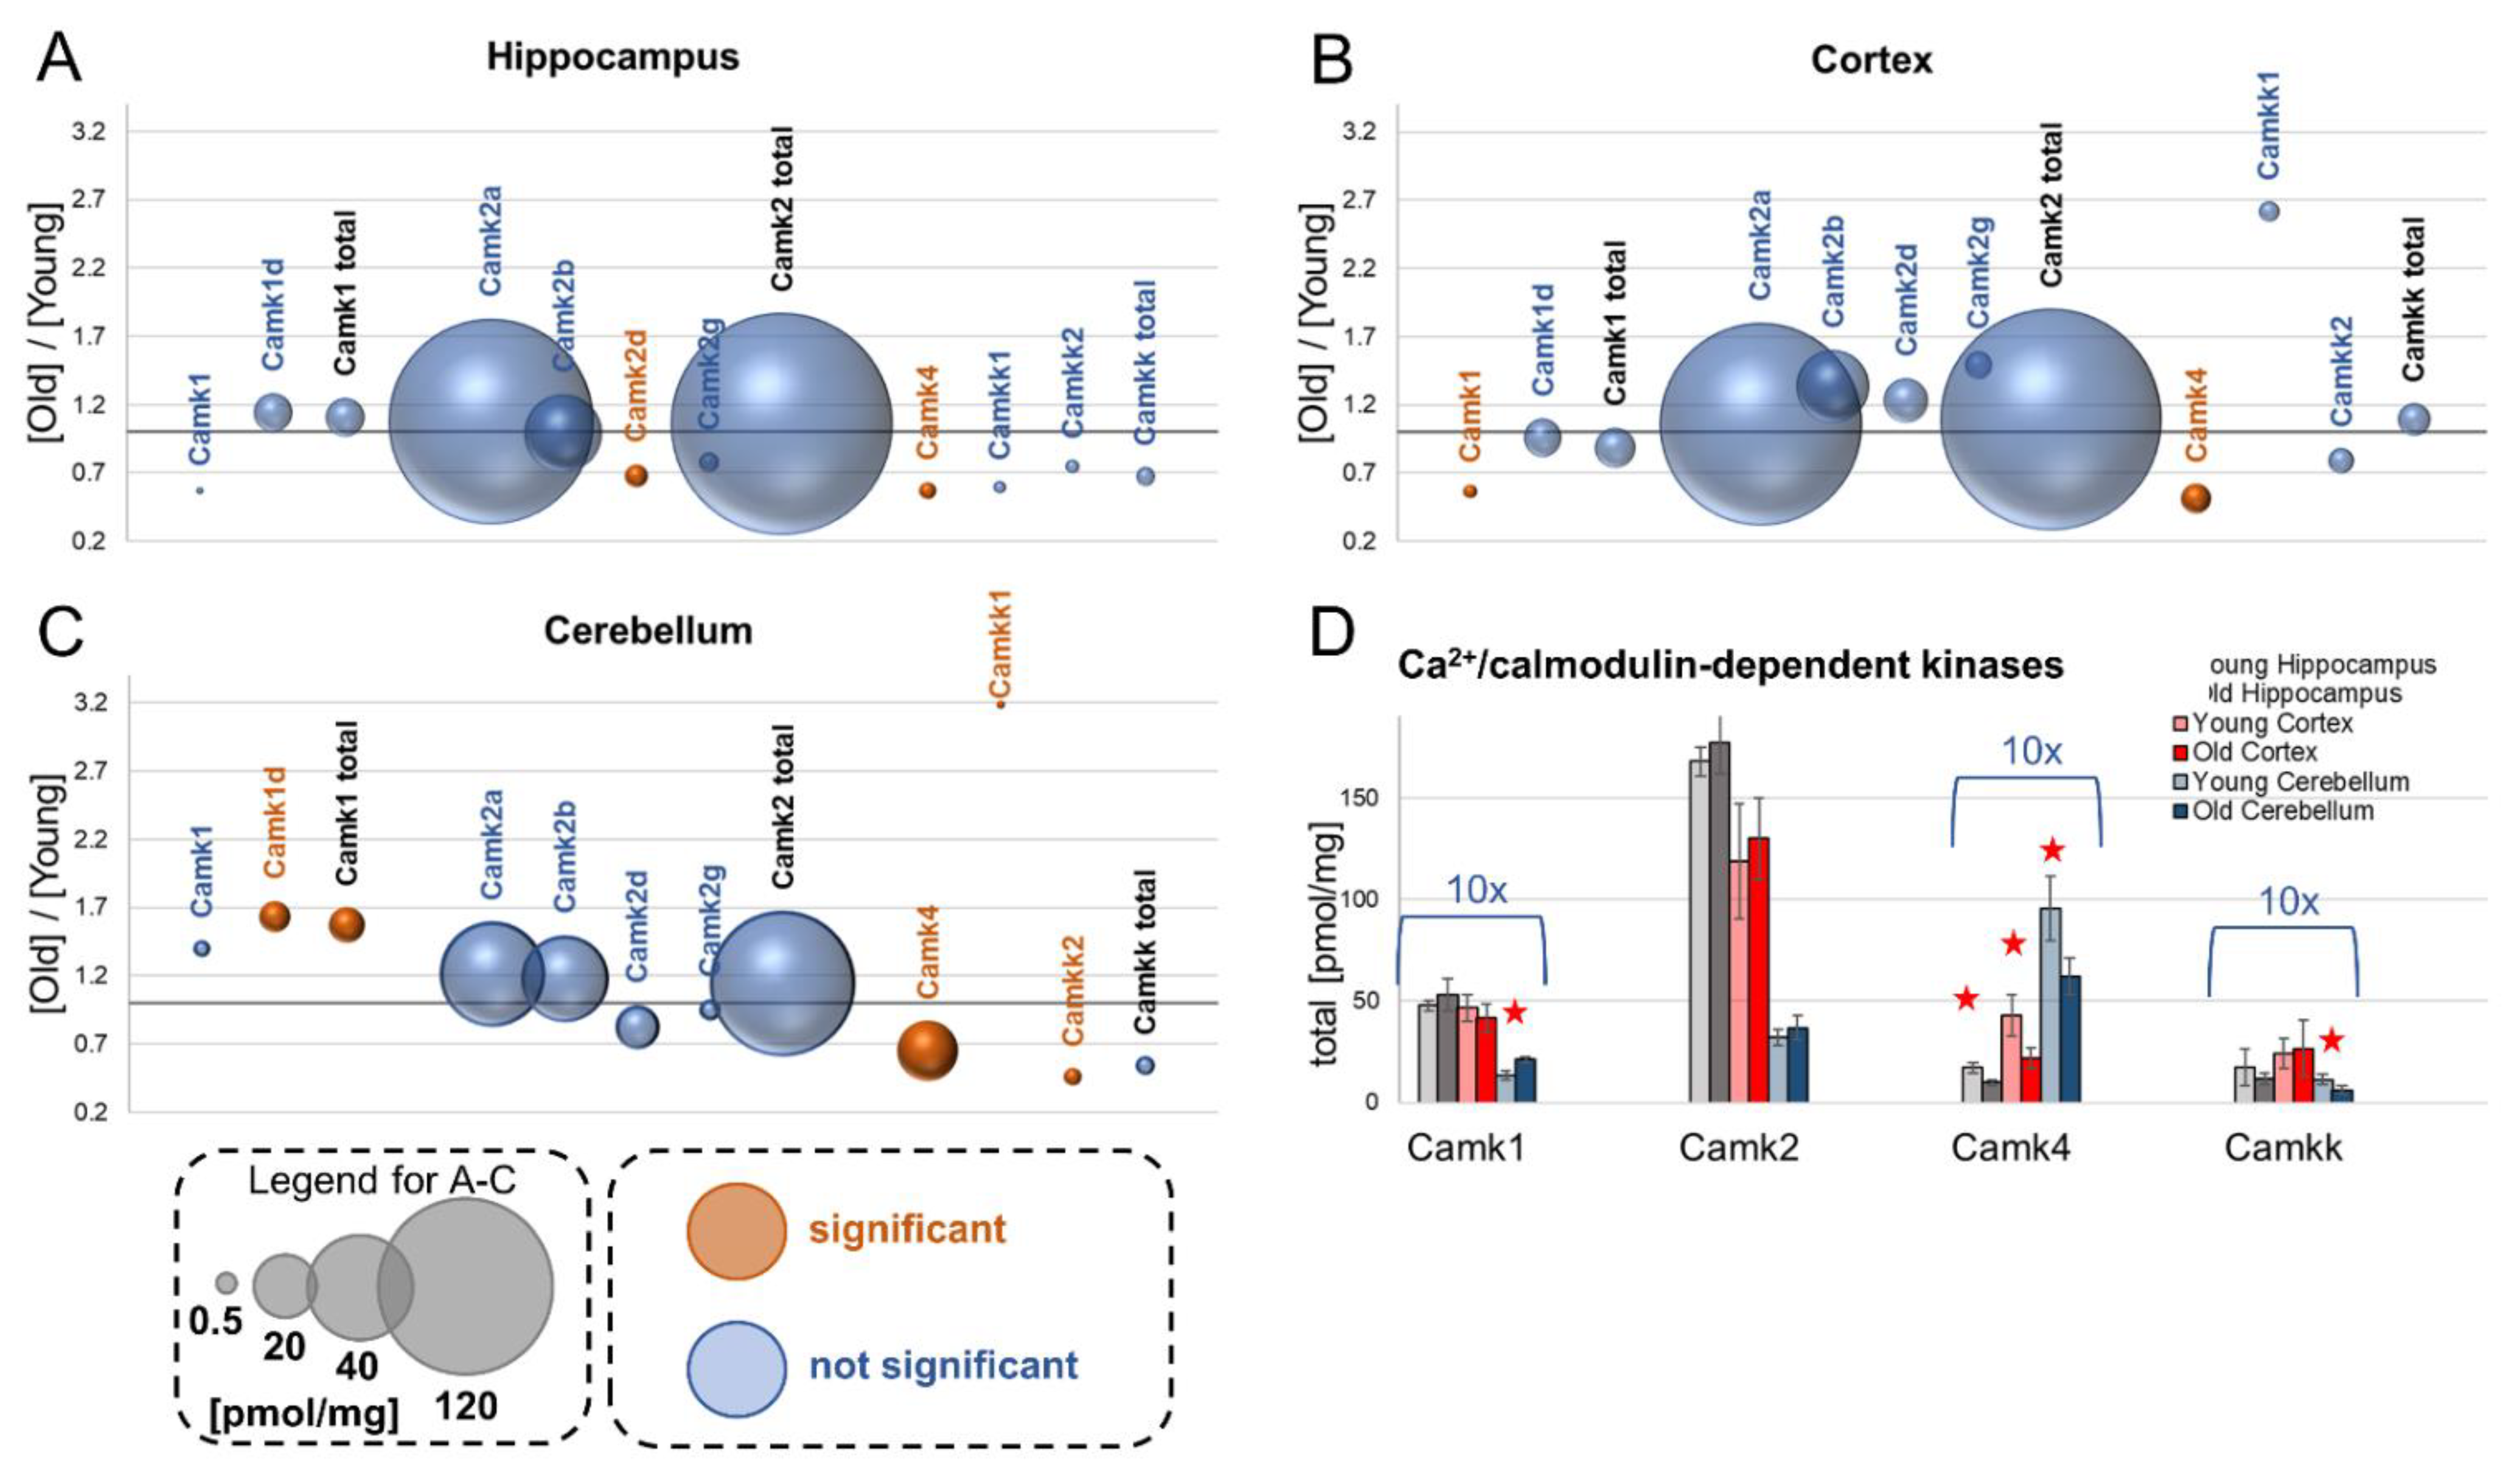
9. Calcium/Calmodulin-Dependent Kinases
9.1. Camk1
9.2. Camk2
9.3. Camk4
9.4. Camkk
10. Prka–cAMP-Dependent Protein Kinase (PKA)
10.1. PKA Catalytic Subunits—Prkac
10.2. PKA regulatory subunits—Prkar
11. Mitogen-Activated Protein Kinases—Mapk
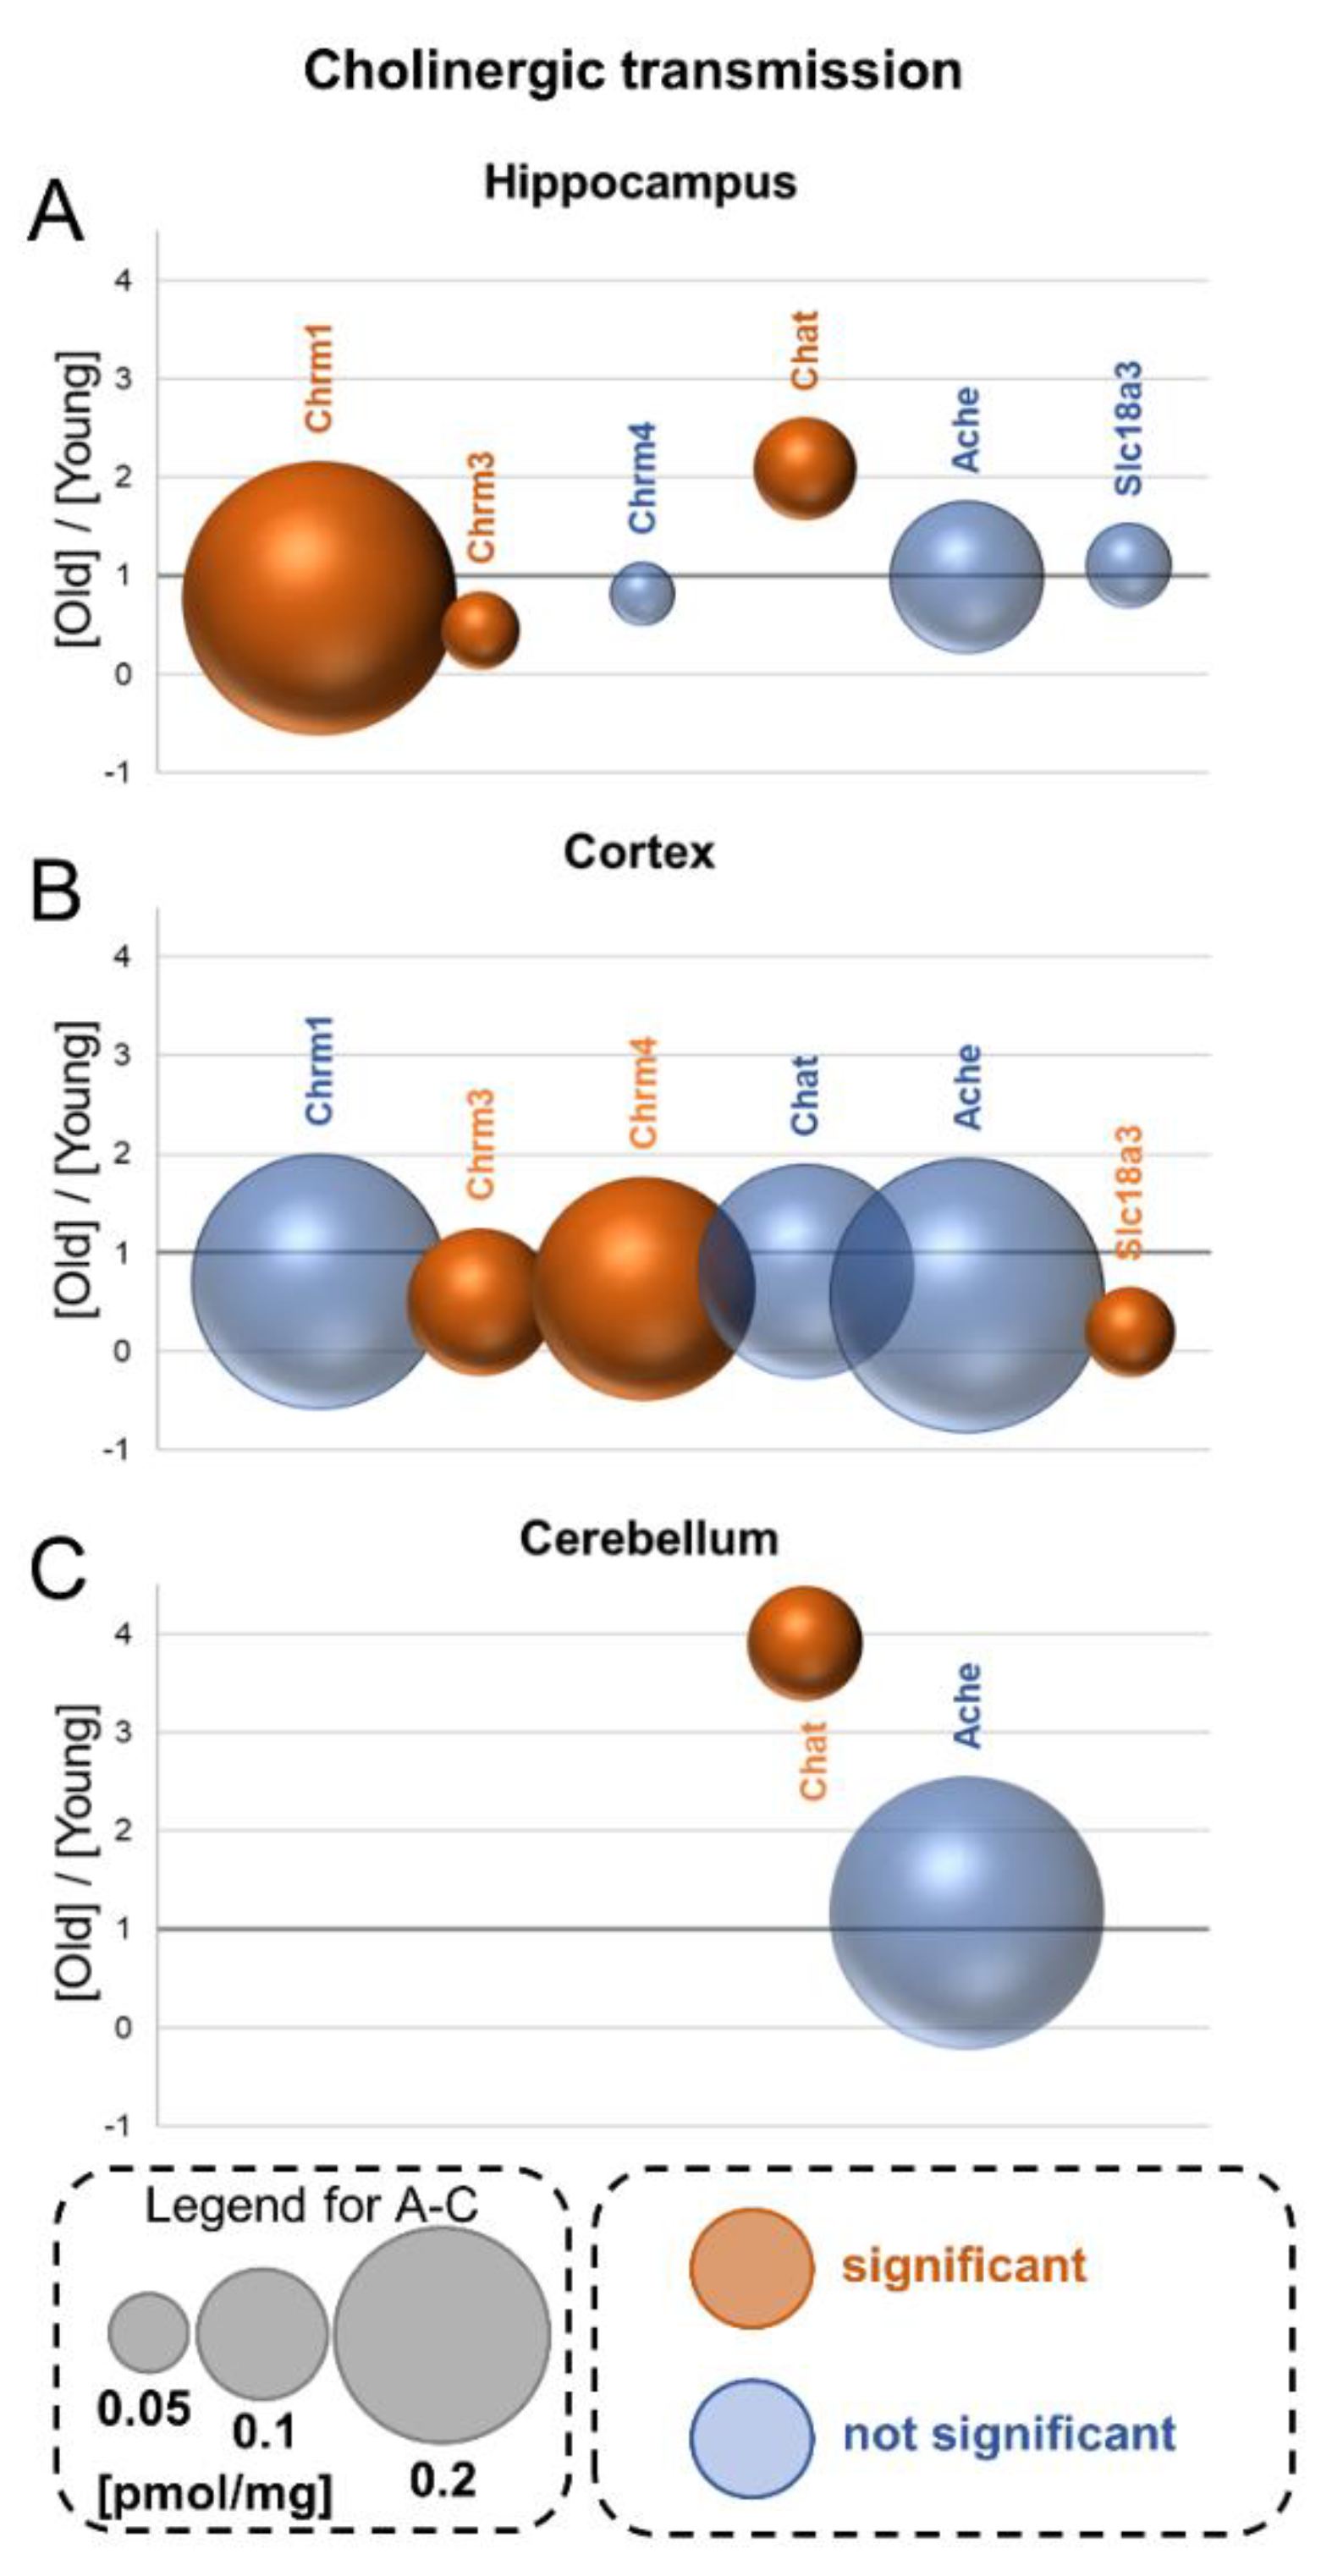
12. Cholinergic Transmission
12.1. Muscarinic Receptors—Chrm
12.2. Acetylcholine Metabolism
12.3. Vesicular Acetylcholine Transporter—Slc18a3
13. Monoamines Receptors, Signal Transmission and Metabolism
13.1. Receptors
13.2. Monoamine Reuptake
14. Monoamine Deactivation
14.1. Monoamine Oxidase—Mao
14.2. Catechol O-Methyltransferase—Comt
15. Monoamine Synthesis
15.1. Tryptophan Hydroxylase 2—Tph2
15.2. Tyrosine Hydroxylase—Th
15.3. Aromatic-L-amino-acid decarboxylase—Ddc
16. Signal Transduction
16.1. Adenylyl Cyclase—Adcy
16.2. Phospholipase C—Plc
17. Cytomatrix Active Zone—CAZ
18. Postsynaptic Density—PSD
19. Trans-Synaptic Cell Adhesion Molecules—CAMs
20. Extracellular Matrix (ECM) Perineuronal Net (PNN) Proteins
21. Discussion
22. Conclusions
Supplementary Materials
Author Contributions
Funding
Institutional Review Board Statement
Informed Consent Statement
Data Availability Statement
Conflicts of Interest
References
- Harada, C.N.; Natelson Love, M.C.; Triebel, K.L. Normal cognitive aging. Clin. Geriatr. Med. 2013, 29, 737–752. [Google Scholar] [CrossRef] [PubMed] [Green Version]
- Pannese, E. Morphological changes in nerve cells during normal aging. Brain Struct. Funct. 2011, 216, 85–89. [Google Scholar] [CrossRef] [PubMed]
- Morrison, J.H.; Hof, P.R. Life and death of neurons in the aging brain. Science 1997, 278, 412–419. [Google Scholar] [CrossRef] [Green Version]
- Murman, D.L. The Impact of Age on Cognition. Semin. Hear. 2015, 36, 111–121. [Google Scholar] [CrossRef] [PubMed]
- Masliah, E.; Mallory, M.; Hansen, L.; DeTeresa, R.; Terry, R.D. Quantitative synaptic alterations in the human neocortex during normal aging. Neurology 1993, 43, 192–197. [Google Scholar] [CrossRef]
- Burke, S.N.; Barnes, C.A. Neural plasticity in the ageing brain. Nat. Rev. Neurosci. 2006, 7, 30–40. [Google Scholar] [CrossRef]
- Li, S.C.; Rieckmann, A. Neuromodulation and aging: Implications of aging neuronal gain control on cognition. Curr. Opin. Neurobiol. 2014, 29, 148–158. [Google Scholar] [CrossRef]
- Duda, P.; Wójcicka, O.; Wiśniewski, J.R.; Rakus, D. Global quantitative TPA-based proteomics of mouse brain structures reveals significant alterations in expression of proteins involved in neuronal plasticity during aging. Aging 2018, 10, 1682–1697. [Google Scholar] [CrossRef]
- Yang, S.; Liu, T.; Li, S.; Zhang, X.; Ding, Q.; Que, H.; Yan, X.; Wei, K.; Liu, S. Comparative proteomic analysis of brains of naturally aging mice. Neuroscience 2008, 154, 1107–1120. [Google Scholar] [CrossRef]
- Walther, D.M.; Mann, M. Accurate Quantification of More Than 4000 Mouse Tissue Proteins Reveals Minimal Proteome Changes During Aging. Mol. Cell. Proteom. 2011, 10, M110.004523. [Google Scholar] [CrossRef] [PubMed] [Green Version]
- Jiang, C.H.; Tsien, J.Z.; Schultz, P.G.; Hu, Y. The effects of aging on gene expression in the hypothalamus and cortex of mice. Proc. Natl. Acad. Sci. USA 2001, 98, 1930–1934. [Google Scholar] [CrossRef] [PubMed] [Green Version]
- Weindruch, R.; Prolla, T.A.; Lee, C.-K. Gene-expression profile of the ageing brain in mice. Nat. Genet. 2000, 25, 294–297. [Google Scholar]
- Gostomska-Pampuch, K.; Drulis-Fajdasz, D.; Gizak, A.; Wiśniewski, J.R.; Rakus, D. Absolute Proteome Analysis of Hippocampus, Cortex and Cerebellum in Aged and Young Mice Reveals Changes in Energy Metabolism. Int. J. Mol. Sci. 2021, 22, 6188. [Google Scholar] [CrossRef] [PubMed]
- Wiśniewski, J.R.; Gaugaz, F.Z. Fast and sensitive total protein and peptide assays for proteomic analysis. Anal. Chem. 2015, 87, 4110–4116. [Google Scholar] [CrossRef]
- Wiśniewski, J.R. Quantitative Evaluation of Filter Aided Sample Preparation (FASP) and Multienzyme Digestion FASP Protocols. Anal. Chem. 2016, 88, 5438–5443. [Google Scholar] [CrossRef] [Green Version]
- Wiśniewski, J.R.; Mann, M. Consecutive proteolytic digestion in an enzyme reactor increases depth of proteomic and phosphoproteomic analysis. Anal. Chem. 2012, 84, 2631–2637. [Google Scholar] [CrossRef]
- Vizcaíno, J.A.; Deutsch, E.W.; Wang, R.; Csordas, A.; Reisinger, F.; Ríos, D.; Dianes, J.A.; Sun, Z.; Farrah, T.; Bandeira, N.; et al. ProteomeXchange provides globally coordinated proteomics data submission and dissemination. Nat. Biotechnol. 2014, 32, 223–226. [Google Scholar] [CrossRef] [PubMed]
- Cox, J.; Mann, M. MaxQuant enables high peptide identification rates, individualized p.p.b.-range mass accuracies and proteome-wide protein quantification. Nat. Biotechnol. 2008, 26, 1367–1372. [Google Scholar] [CrossRef]
- Wiśniewski, J.R.; Ostasiewicz, P.; Duś, K.; Zielińska, D.F.; Gnad, F.; Mann, M. Extensive quantitative remodeling of the proteome between normal colon tissue and adenocarcinoma. Mol. Syst. Biol. 2012, 8, 611. [Google Scholar] [CrossRef]
- Wiśniewski, J.R.; Rakus, D. Multi-enzyme digestion FASP and the ’Total Protein Approach’-based absolute quantification of the Escherichia coli proteome. J. Proteom. 2014, 109, 322–331. [Google Scholar] [CrossRef] [PubMed] [Green Version]
- Safferling, M.; Tichelaar, W.; Kümmerle, G.; Jouppila, A.; Kuusinen, A.; Keinänen, K.; Madden, D.R. First images of a glutamate receptor ion channel: Oligomeric state and molecular dimensions of GluRB homomers. Biochemistry 2001, 40, 13948–13953. [Google Scholar] [CrossRef]
- Rebola, N.; Srikumar, B.N.; Mulle, C. Activity-dependent synaptic plasticity of NMDA receptors. J. Physiol. 2010, 588, 93–99. [Google Scholar] [CrossRef]
- Rambhadran, A.; Gonzalez, J.; Jayaraman, V. Subunit arrangement in N-methyl-D-aspartate (NMDA) receptors. J. Biol. Chem. 2010, 285, 15296–15301. [Google Scholar] [CrossRef] [Green Version]
- Kakegawa, W.; Miyoshi, Y.; Hamase, K.; Matsuda, S.; Matsuda, K.; Kohda, K.; Emi, K.; Motohashi, J.; Konno, R.; Zaitsu, K.; et al. D-Serine regulates cerebellar LTD and motor coordination through the δ glutamate receptor. Nat. Neurosci. 2011, 14, 603–613. [Google Scholar] [CrossRef]
- Jaskotski, F.; Coussen, F.; Nagarajan, N.; Normand, E.; Rosenmund, C.; Mulle, C. Subunit Composition and Alternative Splicing Regulate Membrane Delivery of Kainate Receptors. J. Neurosci. 2004, 24, 2506–2515. [Google Scholar] [CrossRef] [Green Version]
- Ruiz, A. Kainate receptors with a metabotropic signature enhance hippocampal excitability by regulating the slow after-hyperpolarization in CA3 pyramidal neurons. Adv. Exp. Med. Biol. 2011, 717, 59–68. [Google Scholar] [PubMed]
- Goetz, T.; Arslan, A.; Wisden, W.; Wulff, P. GABAA receptors: Structure and function in the basal ganglia. Prog. Brain Res. 2007, 160, 21–41. [Google Scholar] [PubMed] [Green Version]
- Frangaj, A.; Fan, Q.R. Structural biology of GABAB receptor. Neuropharmacology 2018, 136, 68–79. [Google Scholar] [CrossRef]
- White, J.H.; Wise, A.; Main, M.J.; Green, A.; Fraser, N.J.; Disney, G.H.; Barnes, A.A.; Emson, P.; Foord, S.M.; Marshall, F.H. Heterodimerization is required for the formation of a functional GABA(B) receptor. Nature 1998, 396, 679–682. [Google Scholar] [CrossRef] [PubMed]
- Wu, H.; Jin, Y.; Buddhala, C.; Osterhaus, G.; Cohen, E.; Jin, H.; Wei, J.; Davis, K.; Obata, K.; Wu, J.Y. Role of glutamate decarboxylase (GAD) isoform, GAD65, in GABA synthesis and transport into synaptic vesicles-Evidence from GAD65-knockout mice studies. Brain Res. 2007, 1154, 80–83. [Google Scholar] [CrossRef] [PubMed]
- Sweatt, J.D. Neural plasticity and behavior–sixty years of conceptual advances. J. Neurochem. 2016, 139, 179–199. [Google Scholar] [CrossRef] [PubMed]
- Wayman, G.A.; Lee, Y.-S.; Tokumitsu, H.; Silva, A.; Soderling, T.R.; Soderling, T.R. Calmodulin-Kinases: Modulators of Neuronal Development and Plasticity. Neuron 2008, 59, 914–931. [Google Scholar] [CrossRef] [Green Version]
- Erondu, N.E.; Kennedy, M.B. Regional distribution of type II Ca2+/calmodulin-dependent protein kinase in rat brain. J. Neurosci. 1985, 5, 3270–3277. [Google Scholar] [CrossRef] [Green Version]
- Baudry, M.; Zhu, G.; Liu, Y.; Wang, Y.; Briz, V.; Bi, X. Multiple cellular cascades participate in long-term potentiation and in hippocampus-dependent learning. Brain Res. 2015, 1621, 73–81. [Google Scholar] [CrossRef] [PubMed] [Green Version]
- Peng, S.; Zhang, Y.; Zhang, J.; Wang, H.; Ren, B. ERK in learning and memory: A review of recent research. Int. J. Mol. Sci. 2010, 11, 222–232. [Google Scholar] [CrossRef] [Green Version]
- Riederer, P.; Konradi, C.; Schay, V.; Kienzl, E.; Birkmayer, G.; Danielczyk, W.; Sofic, E.; Youdim, M.B. Localization of MAO-A and MAO-B in human brain: A step in understanding the therapeutic action of L-deprenyl. Adv. Neurol. 1987, 45, 111–118. [Google Scholar]
- Exton, J.H. Phospholipases. In Encyclopedic Reference of Molecular Pharmacology; Springer: Berlin/Heidelberg, Germany, 2004; pp. 733–739. [Google Scholar]
- Gundelfinger, E.D.; Fejtova, A. Molecular organization and plasticity of the cytomatrix at the active zone. Curr. Opin. Neurobiol. 2012, 22, 423–430. [Google Scholar] [CrossRef] [PubMed]
- Ungermann, C.; Kümmel, D. Structure of membrane tethers and their role in fusion. Traffic 2019, 20, 479–490. [Google Scholar] [CrossRef] [PubMed]
- Sheng, M.; Kim, E. The postsynaptic organization of synapses. Cold Spring Harb. Perspect. Biol. 2011, 3, a005678. [Google Scholar] [CrossRef] [Green Version]
- Siddiqui, T.J.; Craig, A.M. Synaptic organizing complexes. Curr. Opin. Neurobiol. 2011, 21, 132–143. [Google Scholar] [CrossRef] [Green Version]
- Lilja, J.; Ivaska, J. Integrin activity in neuronal connectivity. J. Cell Sci. 2018, 131, 212803. [Google Scholar] [CrossRef] [PubMed] [Green Version]
- Tai, C.Y.; Kim, S.A.; Schuman, E.M. Cadherins and synaptic plasticity. Curr. Opin. Cell Biol. 2008, 20, 567–575. [Google Scholar] [CrossRef]
- Maguschak, K.A.; Ressler, K.J. The dynamic role of beta-catenin in synaptic plasticity. Neuropharmacology 2012, 62, 78–88. [Google Scholar] [CrossRef] [PubMed] [Green Version]
- Klein, R. Eph/ephrin signaling in morphogenesis, neural development and plasticity. Curr. Opin. Cell Biol. 2004, 16, 580–589. [Google Scholar] [CrossRef] [PubMed]
- Wang, X.; Liu, D.; Huang, H.Z.; Wang, Z.H.; Hou, T.Y.; Yang, X.; Pang, P.; Wei, N.; Zhou, Y.F.; Dupras, M.J.; et al. A Novel MicroRNA-124/PTPN1 Signal Pathway Mediates Synaptic and Memory Deficits in Alzheimer’s Disease. Biol. Psychiatry 2018, 83, 395–405. [Google Scholar] [CrossRef]
- Südhof, T.C. The presynaptic active zone. Neuron 2012, 75, 11–25. [Google Scholar] [CrossRef] [Green Version]
- Roppongi, R.T.; Karimi, B.; Siddiqui, T.J. Role of LRRTMs in synapse development and plasticity. Neurosci. Res. 2017, 116, 18–28. [Google Scholar] [CrossRef]
- Soler-Llavina, G.J.; Arstikaitis, P.; Morishita, W.; Ahmad, M.; Südhof, T.C.; Malenka, R.C. Leucine-rich repeat transmembrane proteins are essential for maintenance of long-term potentiation. Neuron 2013, 79, 439–446. [Google Scholar] [CrossRef] [Green Version]
- Südhof, T.C. Towards an Understanding of Synapse Formation. Neuron 2018, 100, 276–293. [Google Scholar] [CrossRef] [Green Version]
- Woelfle, R.; D’Aquila, A.L.; Lovejoy, D.A. Teneurins, TCAP, and Latrophilins: Roles in the Etiology of Mood Disorders. Transl. Neurosci. 2016, 7, 17–23. [Google Scholar] [CrossRef]
- O’Sullivan, M.L.; de Wit, J.; Savas, J.N.; Comoletti, D.; Otto-Hitt, S.; Yates, J.R.; Ghosh, A. FLRT Proteins Are Endogenous Latrophilin Ligands and Regulate Excitatory Synapse Development. Neuron 2012, 73, 903–910. [Google Scholar] [CrossRef] [PubMed] [Green Version]
- Glasgow, S.D.; Ruthazer, E.S.; Kennedy, T.E. Guiding synaptic plasticity: Novel roles for netrin-1 in synaptic plasticity and memory formation in the adult brain. J. Physiol. 2021, 599, 493–505. [Google Scholar] [CrossRef]
- Lee, S.J.; Wei, M.; Zhang, C.; Maxeiner, S.; Pak, C.H.; Botelho, S.C.; Trotter, J.; Sterky, F.H.; Südhof, T.C. Presynaptic neuronal pentraxin receptor organizes excitatory and inhibitory synapses. J. Neurosci. 2017, 37, 1062–1080. [Google Scholar] [CrossRef]
- Furuno, T.; Ito, A.; Koma, Y.; Watabe, K.; Yokozaki, H.; Bienenstock, J.; Nakanishi, M.; Kitamura, Y. The Spermatogenic Ig Superfamily/Synaptic Cell Adhesion Molecule Mast-Cell Adhesion Molecule Promotes Interaction with Nerves. J. Immunol. 2005, 174, 6934–6942. [Google Scholar] [CrossRef] [Green Version]
- Jedlicka, P.; Muellerleile, J.; Schwarzacher, S.W. Synaptic Plasticity and Excitation-Inhibition Balance in the Dentate Gyrus: Insights from in Vivo Recordings in Neuroligin-1, Neuroligin-2, and Collybistin Knockouts. Neural. Plast. 2018, 2018, 6015753. [Google Scholar] [CrossRef] [Green Version]
- Duman, J.G.; Tu, Y.K.; Tolias, K.F. Emerging Roles of BAI Adhesion-GPCRs in Synapse Development and Plasticity. Neural. Plast. 2016, 2016, 8301737. [Google Scholar] [CrossRef] [PubMed] [Green Version]
- Connor, S.A.; Ammendrup-Johnsen, I.; Chan, A.W.; Kishimoto, Y.; Murayama, C.; Kurihara, N.; Tada, A.; Ge, Y.; Lu, H.; Yan, R.; et al. Altered Cortical Dynamics and Cognitive Function upon Haploinsufficiency of the Autism-Linked Excitatory Synaptic Suppressor MDGA2. Neuron 2016, 91, 1052–1068. [Google Scholar] [CrossRef] [Green Version]
- Ponomareva, O.Y.; Holmen, I.C.; Sperry, A.J.; Eliceiri, K.W.; Halloran, M.C. Calsyntenin-1 regulates axon branching and endosomal trafficking during sensory neuron development in vivo. J. Neurosci. 2014, 34, 9235–9248. [Google Scholar] [CrossRef] [Green Version]
- Kolarow, R.; Brigadski, T.; Lessmann, V. Postsynaptic secretion of BDNF and NT-3 from hippocampal neurons depends on calcium-calmodulin kinase II signaling and proceeds via delayed fusion pore opening. J. Neurosci. 2007, 27, 10350–10364. [Google Scholar] [CrossRef]
- Ciafrè, S.; Ferraguti, G.; Tirassa, P.; Iannitelli, A.; Ralli, M.; Greco, A.; Chaldakov, G.N.; Rosso, P.; Fico, E.; Messina, M.P.; et al. Nerve growth factor in the psychiatric brain. Riv. Psichiatr. 2020, 55, 4–15. [Google Scholar] [PubMed]
- Li, Y.; Kim, R.; Cho, Y.S.; Song, W.S.; Kim, D.; Kim, K.; Roh, J.D.; Chung, C.; Park, H.; Yang, E.; et al. Lrfn2-mutant mice display suppressed synaptic plasticity and inhibitory synapse development and abnormal social communication and startle response. J. Neurosci. 2018, 38, 5872–5887. [Google Scholar] [CrossRef] [Green Version]
- Aruga, J.; Mikoshiba, K. Identification and characterization of Slitrk, a novel neuronal transmembrane protein family controlling neurite outgrowth. Mol. Cell. Neurosci. 2003, 24, 117–129. [Google Scholar] [CrossRef]
- Avital, A.; Goshen, I.; Kamsler, A.; Segal, M.; Iverfeldt, K.; Richter-Levin, G.; Yirmiya, R. Impaired interleukin-1 signaling is associated with deficits in hippocampal memory processes and neural plasticity. Hippocampus 2003, 13, 826–834. [Google Scholar] [CrossRef] [PubMed] [Green Version]
- Roszkowska, M.; Skupien, A.; Wójtowicz, T.; Konopka, A.; Gorlewicz, A.; Kisiel, M.; Bekisz, M.; Ruszczycki, B.; Dolezyczek, H.; Rejmak, E.; et al. CD44: A novel synaptic cell adhesion molecule regulating structural and functional plasticity of dendritic spines. Mol. Biol. Cell 2016, 27, 4055–4066. [Google Scholar] [CrossRef] [PubMed]
- Williams, M.R.; Markey, J.C.; Doczi, M.A.; Morielli, A.D. An essential role for cortactin in the modulation of the potassium channel Kv1.2. Proc. Natl. Acad. Sci. USA 2007, 104, 17412–17417. [Google Scholar] [CrossRef] [PubMed] [Green Version]
- Hattan, D.; Nesti, E.; Cachero, T.G.; Morielli, A.D. Tyrosine phosphorylation of Kv1.2 Modulates its interaction with the actin-binding protein cortactin. J. Biol. Chem. 2002, 277, 38596–38606. [Google Scholar] [CrossRef] [Green Version]
- Alewine, C.; Kim, B.Y.; Hegde, V.; Welling, P.A. Lin-7 targets the Kir 2.3 channel on the basolateral membrane via a L27 domain interaction with CASK. Am. J. Physiol. Cell Physiol. 2007, 293, C1733–C1741. [Google Scholar] [CrossRef]
- Um, J.W. Synaptic functions of the IQSEC family of ADP-ribosylation factor guanine nucleotide exchange factors. Neurosci. Res. 2017, 116, 54–59. [Google Scholar] [CrossRef]
- Bermingham, J.R.; Shearin, H.; Pennington, J.; O’Moore, J.; Jaegle, M.; Driegen, S.; Van Zon, A.; Darbas, A.; Özkaynak, E.; Ryu, E.J.; et al. The claw paw mutation reveals a role for Lgi4 in peripheral nerve development. Nat. Neurosci. 2006, 9, 76–84. [Google Scholar] [CrossRef]
- Ko, J.; Kim, E. Leucine-rich repeat proteins of synapses. J. Neurosci. Res. 2007, 85, 2824–2832. [Google Scholar] [CrossRef]
- Barberis, A. Postsynaptic plasticity of GABAergic synapses. Neuropharmacology 2020, 169, 107643. [Google Scholar] [CrossRef] [PubMed]
- Kegel, L.; Aunin, E.; Meijer, D.; Bermingham, J.R. LGI proteins in the nervous system. ASN Neuro 2013, 5, 167–181. [Google Scholar] [CrossRef] [PubMed]
- Carulli, D.; Verhaagen, J. An Extracellular Perspective on CNS Maturation: Perineuronal Nets and the Control of Plasticity. Int. J. Mol. Sci. 2021, 22, 2434. [Google Scholar] [CrossRef]
- Klapholz, B.; Brown, N.H. Talin—The master of integrin adhesions. J. Cell Sci. 2017, 130, 2435–2446. [Google Scholar] [CrossRef] [PubMed] [Green Version]
- Tom, V.J.; Doller, C.M.; Malouf, A.T.; Silver, J. Astrocyte-associated fibronectin is critical for axonal regeneration in adult white matter. J. Neurosci. 2004, 24, 9282–9290. [Google Scholar] [CrossRef] [Green Version]
- da Luz, M.H.M.; Pino, J.M.V.; Santos, T.G.; Antunes, H.K.M.; Martins, V.R.; de Souza, A.A.L.; Torquato, R.J.S.; Lee, K.S. Sleep deprivation regulates availability of PrPC and Aβ peptides which can impair interaction between PrPC and laminin and neuronal plasticity. J. Neurochem. 2020, 153, 377–389. [Google Scholar] [CrossRef]
- Iwatsuki, H.; Suda, M. Transient expression of keratin during neuronal development in the adult rabbit spinal ganglion. Anat. Sci. Int. 2010, 85, 46–55. [Google Scholar] [CrossRef] [Green Version]
- Raghunathan, R.; Hogan, J.D.; Labadorf, A.; Myers, R.H.; Zaia, J. A glycomics and proteomics study of aging and Parkinson’s disease in human brain. Sci. Rep. 2020, 10, 12804. [Google Scholar] [CrossRef]
- De Winter, F.; Kwok, J.C.F.; Fawcett, J.W.; Vo, T.T.; Carulli, D.; Verhaagen, J. The Chemorepulsive Protein Semaphorin 3A and Perineuronal Net-Mediated Plasticity. Neural. Plast. 2016, 2016, 3679545. [Google Scholar] [CrossRef] [PubMed] [Green Version]
- Oohashi, T.; Edamatsu, M.; Bekku, Y.; Carulli, D. The hyaluronan and proteoglycan link proteins: Organizers of the brain extracellular matrix and key molecules for neuronal function and plasticity. Exp. Neurol. 2015, 274, 134–144. [Google Scholar] [CrossRef]
- Šekeljić, V.; Andjus, P.R. Tenascin-C and its functions in neuronal plasticity. Int. J. Biochem. Cell Biol. 2012, 44, 825–829. [Google Scholar] [CrossRef] [PubMed]
- Rowlands, D.; Lensjø, K.K.; Dinh, T.; Yang, S.; Andrews, M.R.; Hafting, T.; Fyhn, M.; Fawcett, J.W.; Dick, G. Aggrecan directs extracellular matrix-mediated neuronal plasticity. J. Neurosci. 2018, 38, 10102–10113. [Google Scholar] [CrossRef] [PubMed] [Green Version]
- Daniels, M.P. The role of agrin in synaptic development, plasticity and signaling in the central nervous system. Neurochem. Int. 2012, 61, 848–853. [Google Scholar] [CrossRef] [Green Version]
- Schwarzacher, S.W.; Vuksic, M.; Haas, C.A.; Burbach, G.J.; Sloviter, R.S.; Deller, T. Neuronal hyperactivity induces astrocytic expression of neurocan in the adult rat hippocampus. Glia 2006, 53, 704–714. [Google Scholar] [CrossRef]
- Frischknecht, R.; Seidenbecher, C.I. The crosstalk of hyaluronan-based extracellular matrix and synapses. Neuron. Glia Biol. 2008, 4, 249–257. [Google Scholar] [CrossRef]
- Frischknecht, R.; Seidenbecher, C.I. Brevican: A key proteoglycan in the perisynaptic extracellular matrix of the brain. Int. J. Biochem. Cell Biol. 2012, 44, 1051–1054. [Google Scholar] [CrossRef] [PubMed]
- Ying, Z.; Byun, H.R.; Meng, Q.; Noble, E.; Zhang, G.; Yang, X.; Gomez-Pinilla, F. Biglycan gene connects metabolic dysfunction with brain disorder. Biochim. Biophys. Acta Mol. Basis Dis. 2018, 1864, 3679–3687. [Google Scholar] [CrossRef]
- Röll, S.; Seul, J.; Paulsson, M.; Hartmann, U. Testican-1 is dispensable for mouse development. Matrix Biol. 2006, 25, 373–381. [Google Scholar] [CrossRef]
- Schaeffer, J.; Tannahill, D.; Cioni, J.M.; Rowlands, D.; Keynes, R. Identification of the extracellular matrix protein Fibulin-2 as a regulator of spinal nerve organization. Dev. Biol. 2018, 442, 101–114. [Google Scholar] [CrossRef] [PubMed]
- Malinverno, M.; Carta, M.; Epis, R.; Marcello, E.; Verpelli, C.; Cattabeni, F.; Sala, C.; Mulle, C.; Di Luca, M.; Gardoni, F. Synaptic localization and activity of ADAM10 regulate excitatory synapses through N-cadherin cleavage. J. Neurosci. 2010, 30, 16343–16355. [Google Scholar] [CrossRef]
- Rybnikova, E.; Kaärkkinen, I.; Pelto-Huikko, M.; Huovila, A.P.J. Developmental regulation and neuronal expression of the cellular disintegrin ADAM11 gene in mouse nervous system. Neuroscience 2002, 112, 921–934. [Google Scholar] [CrossRef]
- Hsia, H.E.; Tüshaus, J.; Brummer, T.; Zheng, Y.; Scilabra, S.D.; Lichtenthaler, S.F. Functions of ‘A disintegrin and metalloproteases (ADAMs)’ in the mammalian nervous system. Cell. Mol. Life Sci. 2019, 76, 3055–3081. [Google Scholar] [CrossRef]
- Liu, H.; Shim, A.H.R.; He, X. Structural characterization of the ectodomain of a disintegrin and metalloproteinase-22 (ADAM22), a neural adhesion receptor instead of metalloproteinase. Insights on adam function. J. Biol. Chem. 2009, 284, 29077–29085. [Google Scholar] [CrossRef] [Green Version]
- Souza, I.L.M.; Oliveira, N.H.; Huamaní, P.A.M.; Martin, A.T.S.; Borgonovo, Z.L.M.; Nakao, L.S.; Zanata, S.M. Endocytosis of the non-catalytic ADAM23: Recycling and long half-life properties. Exp. Cell Res. 2021, 398, 112415. [Google Scholar] [CrossRef]
- Liou, J.T.; Sum, D.C.W.; Liu, F.C.; Mao, C.C.; Lai, Y.S.; Day, Y.J. Spatial and temporal analysis of nociception-related spinal cord matrix metalloproteinase expression in a murine neuropathic pain model. J. Chin. Med. Assoc. 2013, 76, 201–210. [Google Scholar] [CrossRef] [PubMed] [Green Version]
- Palpagama, T.H.; Sagniez, M.; Kim, S.; Waldvogel, H.J.; Faull, R.L.; Kwakowsky, A. GabaA receptors are well preserved in the hippocampus of aged mice. eNeuro 2019, 6, ENEURO.0496-18.2019. [Google Scholar] [CrossRef] [PubMed] [Green Version]
- Kumar, S.S.; Bacci, A.; Kharazia, V.; Huguenard, J.R. A developmental switch of AMPA receptor subunits in neocortical pyramidal neurons. J. Neurosci. 2002, 22, 3005–3015. [Google Scholar] [CrossRef] [PubMed] [Green Version]
- Newton, I.G.; Forbes, M.E.; Linville, M.C.; Pang, H.; Tucker, E.W.; Riddle, D.R.; Brunso-Bechtold, J.K. Effects of aging and caloric restriction on dentate gyrus synapses and glutamate receptor subunits. Neurobiol. Aging 2008, 29, 1308–1318. [Google Scholar] [CrossRef] [Green Version]
- Pelkey, K.A.; Chittajallu, R.; Craig, M.T.; Tricoire, L.; Wester, J.C.; McBain, C.J. Hippocampal gabaergic inhibitory interneurons. Physiol. Rev. 2017, 97, 1619–1747. [Google Scholar] [CrossRef]
- Fukushima, H.; Maeda, R.; Suzuki, R.; Suzuki, A.; Nomoto, M.; Toyoda, H.; Wu, L.-J.; Xu, H.; Zhao, M.-G.; Ueda, K.; et al. Upregulation of Calcium/Calmodulin-Dependent Protein Kinase IV Improves Memory Formation and Rescues Memory Loss with Aging. J. Neurosci. 2008, 28, 9910–9919. [Google Scholar] [CrossRef] [Green Version]
- Wang, Y.; Li, S.; Piao, F.; Hong, Y.; Liu, P.; Zhao, Y. Arsenic down-regulates the expression of Camk4, an important gene related to cerebellar LTD in mice. Neurotoxicol. Teratol. 2009, 31, 318–322. [Google Scholar] [CrossRef]
- Ribar, T.J.; Rodriguiz, R.M.; Khiroug, L.; Wetsel, W.C.; Augustine, G.J.; Means, A.R. Cerebellar defects in Ca2+/calmodulin kinase IV-deficient mice. J. Neurosci. 2000, 20, RC107. [Google Scholar] [CrossRef] [PubMed] [Green Version]
- Lee, K.H.; Chatila, T.A.; Ram, R.A.; Thompson, R.F. Impaired Memory of Eyeblink Conditioning in CaMKIV KO Mice. Behav. Neurosci. 2009, 123, 438–442. [Google Scholar] [CrossRef]
- Esteban, J.A.; Shi, S.H.; Wilson, C.; Nuriya, M.; Huganir, R.L.; Malinow, R. PKA phosphorylation of AMPA receptor subunits controls synaptic trafficking underlying plasticity. Nat. Neurosci. 2003, 6, 136–143. [Google Scholar] [CrossRef]
- Wennström, M.; Nielsen, H. Cell adhesion molecules in Alzheimer’s disease. Degener. Neurol. Neuromuscul. Dis. 2012, 2, 65. [Google Scholar]
- Aisa, B.; Gil-Bea, F.J.; Solas, M.; García-Alloza, M.; Chen, C.P.; Lai, M.K.; Francis, P.T.; Ramírez, M.J. Altered NCAM expression associated with the cholinergic system in Alzheimer’s disease. J. Alzheimers Dis. 2010, 20, 659–668. [Google Scholar] [CrossRef]
- Strekalova, H.; Buhmann, C.; Kleene, R.; Eggers, C.; Saffell, J.; Hemperly, J.; Weiller, C.; Müller-Thomsen, T.; Schachner, M. Elevated levels of neural recognition molecule L1 in the cerebrospinal fluid of patients with Alzheimer disease and other dementia syndromes. Neurobiol. Aging 2006, 27, 1–9. [Google Scholar] [CrossRef]
- Reed, M.J.; Damodarasamy, M.; Pathan, J.L.; Erickson, M.A.; Banks, W.A.; Vernon, R.B. The Effects of Normal Aging on Regional Accumulation of Hyaluronan and Chondroitin Sulfate Proteoglycans in the Mouse Brain. J. Histochem. Cytochem. 2018, 66, 697–707. [Google Scholar] [CrossRef] [PubMed]
- Schwartz, N.B.; Domowicz, M.S. Proteoglycans in brain development and pathogenesis. FEBS Lett. 2018, 592, 3791–3805. [Google Scholar] [CrossRef] [PubMed] [Green Version]


| Gene Names | Protein/Protein Group | Synaptic Localization | CAM Partners | Reference |
|---|---|---|---|---|
| Itg | Integrins | Pre and Post | AMPA receptors, Laminin, Talin, Vinculin, Shank | [42] |
| Cdh | Cadherins | Pre and Post | AMPA receptors | [43] |
| Ctnn | Catenins | Pre and Post | PSD, Cadherins, Catenins | [44] |
| Eph | Ephrins | Pre and Post | Fibronectin, Rho GTPases, NMDA receptors, Ephr | [45] |
| Ptpr | Receptor-type tyrosine-protein phosphatases | Post | Glutamate receptors, TrkC, SALMs, Netrin-G | [46] |
| Ppfia | Liprin-alpha | Pre | SNARE complex | [47] |
| Lrrtm | Leucine-rich repeat transmembrane neuronal proteins | Post | Neurexin, HSPGs (heparan sulphate proteoglycan) | [48,49] |
| Nrxn | Neurexins | Pre and Post | Neuroligins, Dystroglycan, Lrrtms, GABAA receptors, Latrophilins | [50] |
| Tenm | Teneurin | Pre | Latrophilins (LPHNs), Dystroglycans | [51] |
| Flrt3 | Leucine-rich repeat transmembrane protein FLRT3 | Pre | Adgrl, Unc5B | [52] |
| Ntng | Netrin | Pre | AMPA receptors, Netrin-G ligand | [53] |
| Nptx | Neuronal pentraxin | Pre | AMPA receptors | [54] |
| Cadm | Cell adhesion molecules (SynCAMs) | Pre and Post | Other Cadm | [55] |
| Nlgn | Neuroligin | Post | Neurexin | [56] |
| Bai3 | Brain-specific angiogenesis inhibitor 3 | Post | Neurexin, Glutamate receptors | [57] |
| Mdga2 | MAM domain-containing glycosylphosphatidylinositol anchor protein 2 | Post | Neuroligin | [58] |
| Clstn | Calsyntenins | Post | Membrane trafficking proteins | [59] |
| Ntrk2 | BDNF/NT-3 growth factor receptor | Post | BDNF, PSD, Ntfk2 | [60] |
| Ntrk3 | NT-3 growth factor receptor | Post | TrkA | [61] |
| Lrfn | Leucine-rich repeat and fibronectin type-III domain (SALMs) | Pre and Post | Ptpr | [62] |
| Slitrk | SLIT and NTRK-like proteins | Post | Ptpr | [63] |
| Il1rap | Interleukin-1 receptor accessory protein | Post | Ptpr | [64] |
| Cd44 | CD44 antigen | Post | Hyaluronan, Collagen, Growth factors, Cytokines, ADAM 17, Rho GTPases | [65] |
| Cttn | Src substrate cortactins | Post | Clathrin | [66] |
| Cttnbp2 | Cortactin-binding protein 2 | Post | Contractin, Potassium channels | [67] |
| Lin7 | Protein lin-7 | Post | BDNF, Potassium channels | [68] |
| Iqsec | IQ motif and SEC7 | Post | PSD, AMPA receptors, Gephyrin | [69] |
| Lgi4 | Leucine-rich repeat LGI Lgi4 | Pre and Post | Mielin | [70] |
| Lgi1 | Leucine-rich repeat LGI Lgi1 | Pre and Post | Potassium channels, ADAM22, PSD95 | [71] |
| Gphn | Gephyrin | Post | GABAA receptors | [72] |
| Gene Names | Protein/Protein Group | Activity | References |
|---|---|---|---|
| Tln | Talin | Adhesion | [75] |
| Fn1 | Fibronectin | Adhesion | [76] |
| Lam | Laminins | Adhesion | [77] |
| Krt | Keratins | Adhesion | [78] |
| Col | Collagens | Adhesion | [79] |
| Sema | Semaphorins | Adhesion | [80] |
| Hapln | Hyaluronan and proteoglycan link proteins | Adhesion | [81] |
| Tnc | Tenascin | Neurite outgrowth | [82] |
| Acan | Aggrecan core protein | Adhesion | [83] |
| Agrn | Agrin | Adhesion | [84] |
| Ncan | Neurocan core protein | Adhesion | [85] |
| Vcan | Versican core protein | Adhesion | [86] |
| Bcan | Brevican core protein | Adhesion | [87] |
| Bgn | Biglycan | Adhesion | [88] |
| Spock2 | Testican-2 | Adhesion | [89] |
| Fmod | Fibromodulin | Adhesion | [90] |
| Adam10 | Disintegrin and metalloproteinase domain-containing protein 10 | Digestion | [91] |
| Adam11 | Disintegrin and metalloproteinase domain-containing protein 11 | Neural adhesion and axon guidance | [92,93] |
| Adam22 | Disintegrin and metalloproteinase domain-containing protein 22 | Neural adhesion | [93,94] |
| Adam23 | Disintegrin and metalloproteinase domain-containing protein 23 | Neural adhesion neurite outgrowth | [93,95] |
| MMP17 | Matrix metalloproteinase-17 | Digestion | [96] |
Publisher’s Note: MDPI stays neutral with regard to jurisdictional claims in published maps and institutional affiliations. |
© 2021 by the authors. Licensee MDPI, Basel, Switzerland. This article is an open access article distributed under the terms and conditions of the Creative Commons Attribution (CC BY) license (https://creativecommons.org/licenses/by/4.0/).
Share and Cite
Drulis-Fajdasz, D.; Gostomska-Pampuch, K.; Duda, P.; Wiśniewski, J.R.; Rakus, D. Quantitative Proteomics Reveals Significant Differences between Mouse Brain Formations in Expression of Proteins Involved in Neuronal Plasticity during Aging. Cells 2021, 10, 2021. https://doi.org/10.3390/cells10082021
Drulis-Fajdasz D, Gostomska-Pampuch K, Duda P, Wiśniewski JR, Rakus D. Quantitative Proteomics Reveals Significant Differences between Mouse Brain Formations in Expression of Proteins Involved in Neuronal Plasticity during Aging. Cells. 2021; 10(8):2021. https://doi.org/10.3390/cells10082021
Chicago/Turabian StyleDrulis-Fajdasz, Dominika, Kinga Gostomska-Pampuch, Przemysław Duda, Jacek Roman Wiśniewski, and Dariusz Rakus. 2021. "Quantitative Proteomics Reveals Significant Differences between Mouse Brain Formations in Expression of Proteins Involved in Neuronal Plasticity during Aging" Cells 10, no. 8: 2021. https://doi.org/10.3390/cells10082021