Article

Comprehensive Omics Analysis of a Novel Small-Molecule Inhibitor of Chemoresistant Oncogenic Signatures in Colorectal Cancer Cell with Antitumor Effects

by
Tse-Hung Huang
1,2,3,4,5,6,†,
Ntlotlang Mokgautsi
7,8,†,
Yan-Jiun Huang
9,10,
Alexander T. H. Wu
11,12,13,14,* and
Hsu-Shan Huang
7,8,15,16,*
1
Department of Traditional Chinese Medicine, Chang Gung Memorial Hospital, Keelung 20401, Taiwan
2
School of Traditional Chinese Medicine, Chang Gung University, Kweishan, Taoyuan 333, Taiwan
3
School of Nursing, National Taipei University of Nursing and Health Sciences, Taipei 112, Taiwan
4
Graduate Institute of Health Industry Technology, Chang Gung University of Science and Technology, Taoyuan 333, Taiwan
5
Research Center for Chinese Herbal Medicine, Chang Gung University of Science and Technology, Taoyuan 333, Taiwan
6
Department & Graduate Institute of Chemical Engineering & Graduate Institute of Biochemical Engineering, Ming Chi University of Technology, New Taipei City 243, Taiwan
7
Ph.D. Program for Cancer Molecular Biology and Drug Discovery, College of Medical Science and Technology, Taipei Medical University and Academia Sinica, Taipei 11031, Taiwan
8
Graduate Institute for Cancer Biology and Drug Discovery, College of Medical Science and Technology, Taipei Medical University, Taipei 11031, Taiwan
9
Division of Colorectal Surgery, Department of Surgery, Taipei Medical University Hospital, Taipei Medical University, Taipei 110, Taiwan
10
Department of Surgery, School of Medicine, College of Medicine, Taipei Medical University, Taipei 110, Taiwan
11
TMU Research Center of Cancer Translational Medicine, Taipei Medical University, Taipei 11031, Taiwan
12
The Ph.D. Program of Translational Medicine, College of Science and Technology, Taipei Medical University, Taipei 11031, Taiwan
13
Clinical Research Center, Taipei Medical University Hospital, Taipei Medical University, Taipei 11031, Taiwan
14
Graduate Institute of Medical Sciences, National Defense Medical Center, Taipei 11490, Taiwan
15
School of Pharmacy, National Defense Medical Center, Taipei 11490, Taiwan
16
Ph.D. Program in Drug Discovery and Development Industry, College of Pharmacy, Taipei Medical University, Taipei 11031, Taiwan
*
Authors to whom correspondence should be addressed.
These authors contributed equally to this work.
Cells 2021, 10(8), 1970; https://doi.org/10.3390/cells10081970
Submission received: 5 July 2021 / Revised: 27 July 2021 / Accepted: 30 July 2021 / Published: 3 August 2021
(This article belongs to the Collection Targeting Cancer Stem Cell)

Abstract

:
Tumor recurrence from cancer stem cells (CSCs) and metastasis often occur post-treatment in colorectal cancer (CRC), leading to chemoresistance and resistance to targeted therapy. MYC is a transcription factor in the nuclei that modulates cell growth and development, and regulates immune response in an antitumor direction by mediating programmed death ligand 1 (PD-L1) and promoting CRC tumor recurrence after adjuvant chemotherapy. However, the molecular mechanism through which c-MYC maintains stemness and confers treatment resistance still remains elusive in CRC. In addition, recent reports demonstrated that CRC solid colon tumors expresses C-X-C motif chemokine ligand 8 (CXCL8). Expression of CXCL8 in CRC was reported to activate the expression of PD-L1 immune checkpoint through c-MYC, this ultimately induces chemoresistance in CRC. Accumulating studies have also demonstrated increased expression of CXCL8, matrix metalloproteinase 7 (MMP7), tissue inhibitor of metalloproteinase 1 (TIMP1), and epithelial-to-mesenchymal transition (EMT) components, in CRC tumors suggesting their potential collaboration to promote EMT and CSCs. TIMP1 is MMP-independent and regulates cell development and apoptosis in various cancer cell types, including CRC. Recent studies showed that TIMP1 cleaves CXCL8 on its chemoattractant, thereby influencing its mechanistic response to therapy. This therefore suggests crosstalk among the c-MYC/CXCL8/TIMP1 oncogenic signatures. In this study, we explored computer simulations through bioinformatics to identify and validate that the MYC/CXCL8/TIMP1 oncogenic signatures are overexpressed in CRC, Moreover, our docking results exhibited putative binding affinities of the above-mentioned oncogenes, with our novel small molecule, RV59, Finally, we demonstrated the anticancer activities of RV59 against NCI human CRC cancer cell lines both as single-dose and dose-dependent treatments, and also demonstrated the MYC/CXCL8/TIMP1 signaling pathway as a potential RV59 drug target.

1. Introduction

Colorectal cancer (CRC) is the 3rd most common cancer [1,2], with approximately 1.8 million cases diagnosed in both males and females in 2020 [3] and second in terms of death rates globally [4]. Approximately 25% of CRC patients exhibites metastatic disease at the diagnostic stage [5]. Current advanced treatment of CRC includes surgery and chemotherapy [6]. Despite these therapeutic efforts, huge challenges remain with regards to treatment responses [7], accumulation of tumor recurrence from cancer stem cells (CSCs), and metastasis often occurs post-treatment, which lead to chemoresistance and resistance to targeted therapy [8,9]. CSCs are able to self-renew and differentiation into heterogeneous cancer cells, subsequently promoting tumor initiation, proliferation, and recurrence [10,11]. Therefore, these limitations underscore the urgency of developing novel effective treatments. Identifying oncogenes responsible for stemness and chemoresistance in CRC is a significant route to new and effective therapeutic interventions [12]. MYC is a transcription factor in nuclei that modulates cell growth and development, and MYC overexpression promotes CRC development and progression [13]. c-MYC is a member of the MYC family, which is commonly expressed in CRC, and regulates cell proliferation, apoptosis, transformation, and therapeutic resistance. In CRC, c-MYC was demonstrated to regulate gene expression which plays an important role as regulator of epithelial stem cells in colon tissue [14,15]. In particular, the activation of Wnt/β-catenin, which is reported to play a major role as promoter of CSCs, serves as a transcriptional factor for c-MYC in the nucleus, which ultimately regulates major functions of CSCs. Therefore, c-MYC serves as one of the core stem cell markers [16,17].
Additionally, high expression levels of c-MYC were demonstrated to regulate antitumor immune responses, by mediating programmed death ligand 1 (PD-L1) and cluster of differentiation 47 (CD47) [18], as well as promoting CRC tumor recurrence after 5-fluorouracil (5-FU)-based adjuvant chemotherapy [19]. Several studies showed that when upregulated, c-MYC activates mitogen-activated protein kinase (MAPK) and rat sarcoma (RAS) signaling, which eventually alters the response to oxaliplatin or vorinostat treatment in breast cancer and CRC patients [20,21]. In addition, c-MYC was also reported to be one of the major stem cell markers in CRC. However, the molecular mechanism through which c-MYC maintains stemness and confers treatment resistance still remains elusive in CRC [19,22]. This therefore illustrates the need for further exploration of its regulatory mechanisms [23,24]. Recent reports demonstrated that solid colon tumors express different kinds of chemokines, including a member of the CXC chemokine family, C-X-C motif chemokine ligand 8 (CXCL8), also known as interleukin (IL)-8 [7,25], In addition, CXCL8 functions as an inflammatory cytokine secreted by immune cells, such as macrophages within the tumor microenvironment (TME) [26,27]. CXCL8 expression in CRC was reported to activate the expression of the immune checkpoint PD-L1 through c-MYC [28]. Moreover, CXCL8 was revealed to play a significant role by promoting tumor formation, progression, and invasion via activating phosphoinositide 3-kinase (PI3K) signaling, which subsequently phosphorylates protein kinase B (PKB) also known as (AKT) and MAPK in breast cancer and CRC [29,30]. In addition, recent reports gradually showed that an increased level of CXCL8 mediates tumor metastasis, stemness, and ultimately induces chemoresistance in CRC [31,32].
Furthermore, study evidence from a microarray analysis also outlined significant differences in several oncogenes between tumor tissues and normal tissues. Interestingly, CXCL8, MMP7, tissue inhibitor of metalloproteinase 1 (TIMP1), and components of the epithelial-to-mesenchymal transition (EMT) were found to be highly expressed in CRC tumors [33]. This suggests that CXCL8/MMP7/TIMP7 oncogenes may collaborate and promote the EMT and colon stem cells [34,35]. TIMP1 is matrix metalloproteinase (MMP)-independent and regulates cell development and apoptosis in various cancer cell types, including CRC [36]. Recent studies showed that TIMP1 cleaves to CXCL8 on its chemoattractant, thereby influencing its mechanisms and responses to therapy [37]. TIMP1 was also reported to participate in various cell functions including proliferation and survival, leading to reduced sensitivity to chemotherapy in colon cancer [37,38,39]. Increased expression of TIPM1 was shown to be associated with poor clinical outcomes in CRC patients compared to normal samples [40]. This therefore suggests crosstalk among c-MYC/CXCL8/TIMP1 oncogenic signatures. In the current study, we used computation studies through a bioinformatics analysis to identify and validate expressions of the c-MYC/CXCL8/TIMP1 signaling pathway in CRC, and used in silico molecular docking to evaluate potential interactions of the RV59 with MYC/CXCL8/TIMP1 signaling. RV59 is a small molecule, a derivative of EGFR inhibitor osimertinib derivative [41,42], which was recently synthesized in our laboratory. The anticancer effects of the RV59 was evaluated using the US National Cancer Institute (NCI)-60 colon cancer cells to single-dose and dose-dependent treatments with RV59 [43].

2. Material and Methods

2.1. Identifying Molecular Targets and Therapeutic Classes of RV59

To predict potential drug targets of RV59, we used computer-based Prediction of Biological Activity Spectra (PASS) (http://way2drug.com/PassOnline/) web resources to predict the spectrum of interactions for known protein kinase inhibitors [44]. Additionally, we applied the Developmental Therapeutics Program (DTP)-COMPARE, a public data-mining website, to predict molecular targets and detect if RV59 retained activity similar to NCI synthetic compounds and standard agents. Herein, we used 50% growth inhibition (GI50), which is the IC50 as an endpoint, and National Safety Code (NSC) number (763967) as a delimiter [45].

2.2. Gene Expression Microarray Data Extraction

In total, three gene expression profiles (GSE41328, GSE44861, and GSE74602) were extracted from the Gene Expression Omnibus (GEO; https://www.ncbi.nlm.nih.gov/geo/). The GEO database, a free public genomic database, stores array data and sequence data. GSE74602 included 10 CRC cancer samples and 10 matched adjacent normal samples [46]; GSE44861 included 56 colon cancer tissues and 55 adjacent noncancerous tissues [47]; and GSE74602 contained 30 CRC carcinoma tissues and 30 adjacent normal cancer tissues [48].

2.3. Validation of MYC/CXCL8/TIMP1 Expression Levels in CRC

Expression levels of the MYC/CXCL8/TIMP1 oncogenes were analyzed with UALCAN (http://ualcan.path.uab.edu/), an open-access public online tool for analysis of The Cancer Genome Atlas (TCGA) [49]. Expression levels of MYC/CXCL8/TIMP1 in CRC samples (red) were compared to adjacent normal samples (blue), with p < 0.05 indicating statistical significance. Furthermore, we used GECO, a gene expression correlation analytical tool, which distinguishes two expression datasets into positive and negative correlations [50], with positive Pearson correlation coefficients and p < 0.05 as statistically significant.

2.4. Protein-Protein Interaction (PPI) Network, Gene Ontology (GO), and Kyoto Encyclopedia of Genes and Genomes (KEGG) Pathway Analyses

Protein interactions were analyzed using the STRING tool (https://string-db.org/) to construct a PPI clustering network [51]. A confidence score >0.7 was considered most significant. The GeneMenia tool (https://genemania.org/) and cytoscape software (version 3.8.2) were used to build gene interactions and PPI networks respectively, and from analysis of the results, the interactive networks were based on gene co-expression, co-localization, genetic interactions, and various pathways involved within the network. The database for annotation, visualization, and integrated discovery (DAVID), (https://david.ncifcrf.gov/.jsp), was used to analyze enriched GO including biological processes and molecular functions involved, with the criterion set to p < 0.05.

2.5. Interpretation of Gene Co-Expression in MYC/CXCL8/TIMP1 Genes Network

Interpretation of gene expression network was analyzed using the Network Analyst 3.0 tool (https://www.networkanalyst.ca/) [52], a comprehensive analytical visual platform which integrates PPI networks and gene co-occurrence networks and interprets gene expression networks. Herein, we used Enrichment Map, a sub-tool of network analyst, with a Bipartite view, to determine the enrichment of coexpressed genes in KEGG pathways [53].

2.6. Correlation Analysis of MYC/CXCL8/TIMP1 Expressions and Tumor Infiltration Levels

Correlations between MYC/CXCL8/TIMP1 expressions and tumor infiltration levels were analyzed with the Tumor Immune Estimation Resource (TIMER) (https://cistrome.shinyapps.io/timer/), an online computational tool used to analyze the nature of tumor immune interactions across a variety of cancers [54]. Herein, we determined correlations of MYC, CXCL8, and TIMP1 with a set of gene markers of immune infiltration cells including CD8+ T cells and macrophages (with p < 0.05). Furthermore, we applied the SCNA statistical module, a sub-tool of TIMER to identify the abundances of tumor infiltrates including CD8+ T cells, macrophages, and dendritic cells (DCs) in colon cancer. The infiltration level was compared to the normal level using a two-sided Wilcoxon rank-sum test.

2.7. Drug Sensitivity Analysis of MYC/CXCL8/TIMP1 Oncogenes

To determine the correlation between MYC/CXCL8/TIMP1 oncogenes and drug sensitivity of the genomics of drug sensitivity in cancer (GDSC) top 30 drugs in pan-cancer, we used the Gene Set Cancer Analysis (GSCA), a web-based tool used to analyze differentially expressed genes (DEGs) and correlation to drug sensitivity [55]. All the drugs approved by the Food and Drug Administration (FDA) were displayed in this analysis.

2.8. Molecular Docking of Protein-Ligand Interactions

In silico molecular docking is a technique used to predict protein-ligand interactions, and this includes detection of the position and orientation of the ligand [56]. In order to evaluate the strength of interactions of RV59 with predicted and selected target genes from PASS and the DTP-compare algorithm, we performed molecular docking of RV59 with the MYC/CXCL8/TIMP1 oncogenes. Crystal structures of MYC (PDB: 6G6K), CXCL8 (PDB:5D14), and TIMP1 (1UEA), were downloaded from the Protein Data Bank (PDB). The 3D structure of RV59 was constructed with the Avogadro molecular visualization tool [57], while the standard inhibitor 3D structures for vorinostat (CID:5311), with a molecular weight (MW: 264.32 g/mol) with molecular formula (C14H2ON2O3), repaxicin (CID:9838712), with a Mw of (283.39 g/mol and molecular formula (C14H21NO3) and ilomastat (CID: 132519), with a Mw of (388.5 g/mol and molecular formula (C20H28N4O4), were all retrieved from PubChem as SDF files. For further processing, we used PyMol software (https://pymol.org/2/) to visualize the ligands and convert them into PDB file format, and these files were subsequently converted into PDBQT format using the computer-based software, autodock (http://autodock.scripps.edu/resources/adt). For visualization and interpretation, docking results were analyzed using Discovery Studio [58].

2.9. Statistical Analysis

Pearson’s correlations were used to assess correlations of MYC/CXCL8/TIMP1 expressions in CRC cancer types. The statistical significance of differentially expressed genes (DEGs) was evaluated using the Wilcoxon test. * p < 0.05 was accepted as being statistically significant.

3. Results

3.1. MYC/CXCL8/TIMP1 Oncogenes Are Potential Drug Targets for RV59

We explored computer-based PASS and DTP-COMPARE, a public data-mining website to predict molecular targets and detect if RV59 retained activities similar to NCI synthetic compounds and standard agents. Similarities between our test compound and correlated drugs are presented as ‘‘Pearson’s Correlation Coefficient” values, where a value of +1 indicates perfect positive correlation and a value of -1 indicates negative similar correlation. Herein, we used GI50 as an endpoint and the NSC number as a delimiter [45], and identified several RV59 druggable genes. Interestingly, MYC, CXCL8, and TIMP1 were among the genes displayed by the prediction tools (Table 1). In addition to these finding, the activities of RV59 on the identified genes, shown by the PASS tool, were classified according to “probability to be active” (Pa) as opposed to “probability to be inactive” (Pi) values, based on the analyzed results (all Pa values were greater than Pi values), indicating the inhibitory activities of the compound on MYC and CXCL8, among other identified activities (Table 2).

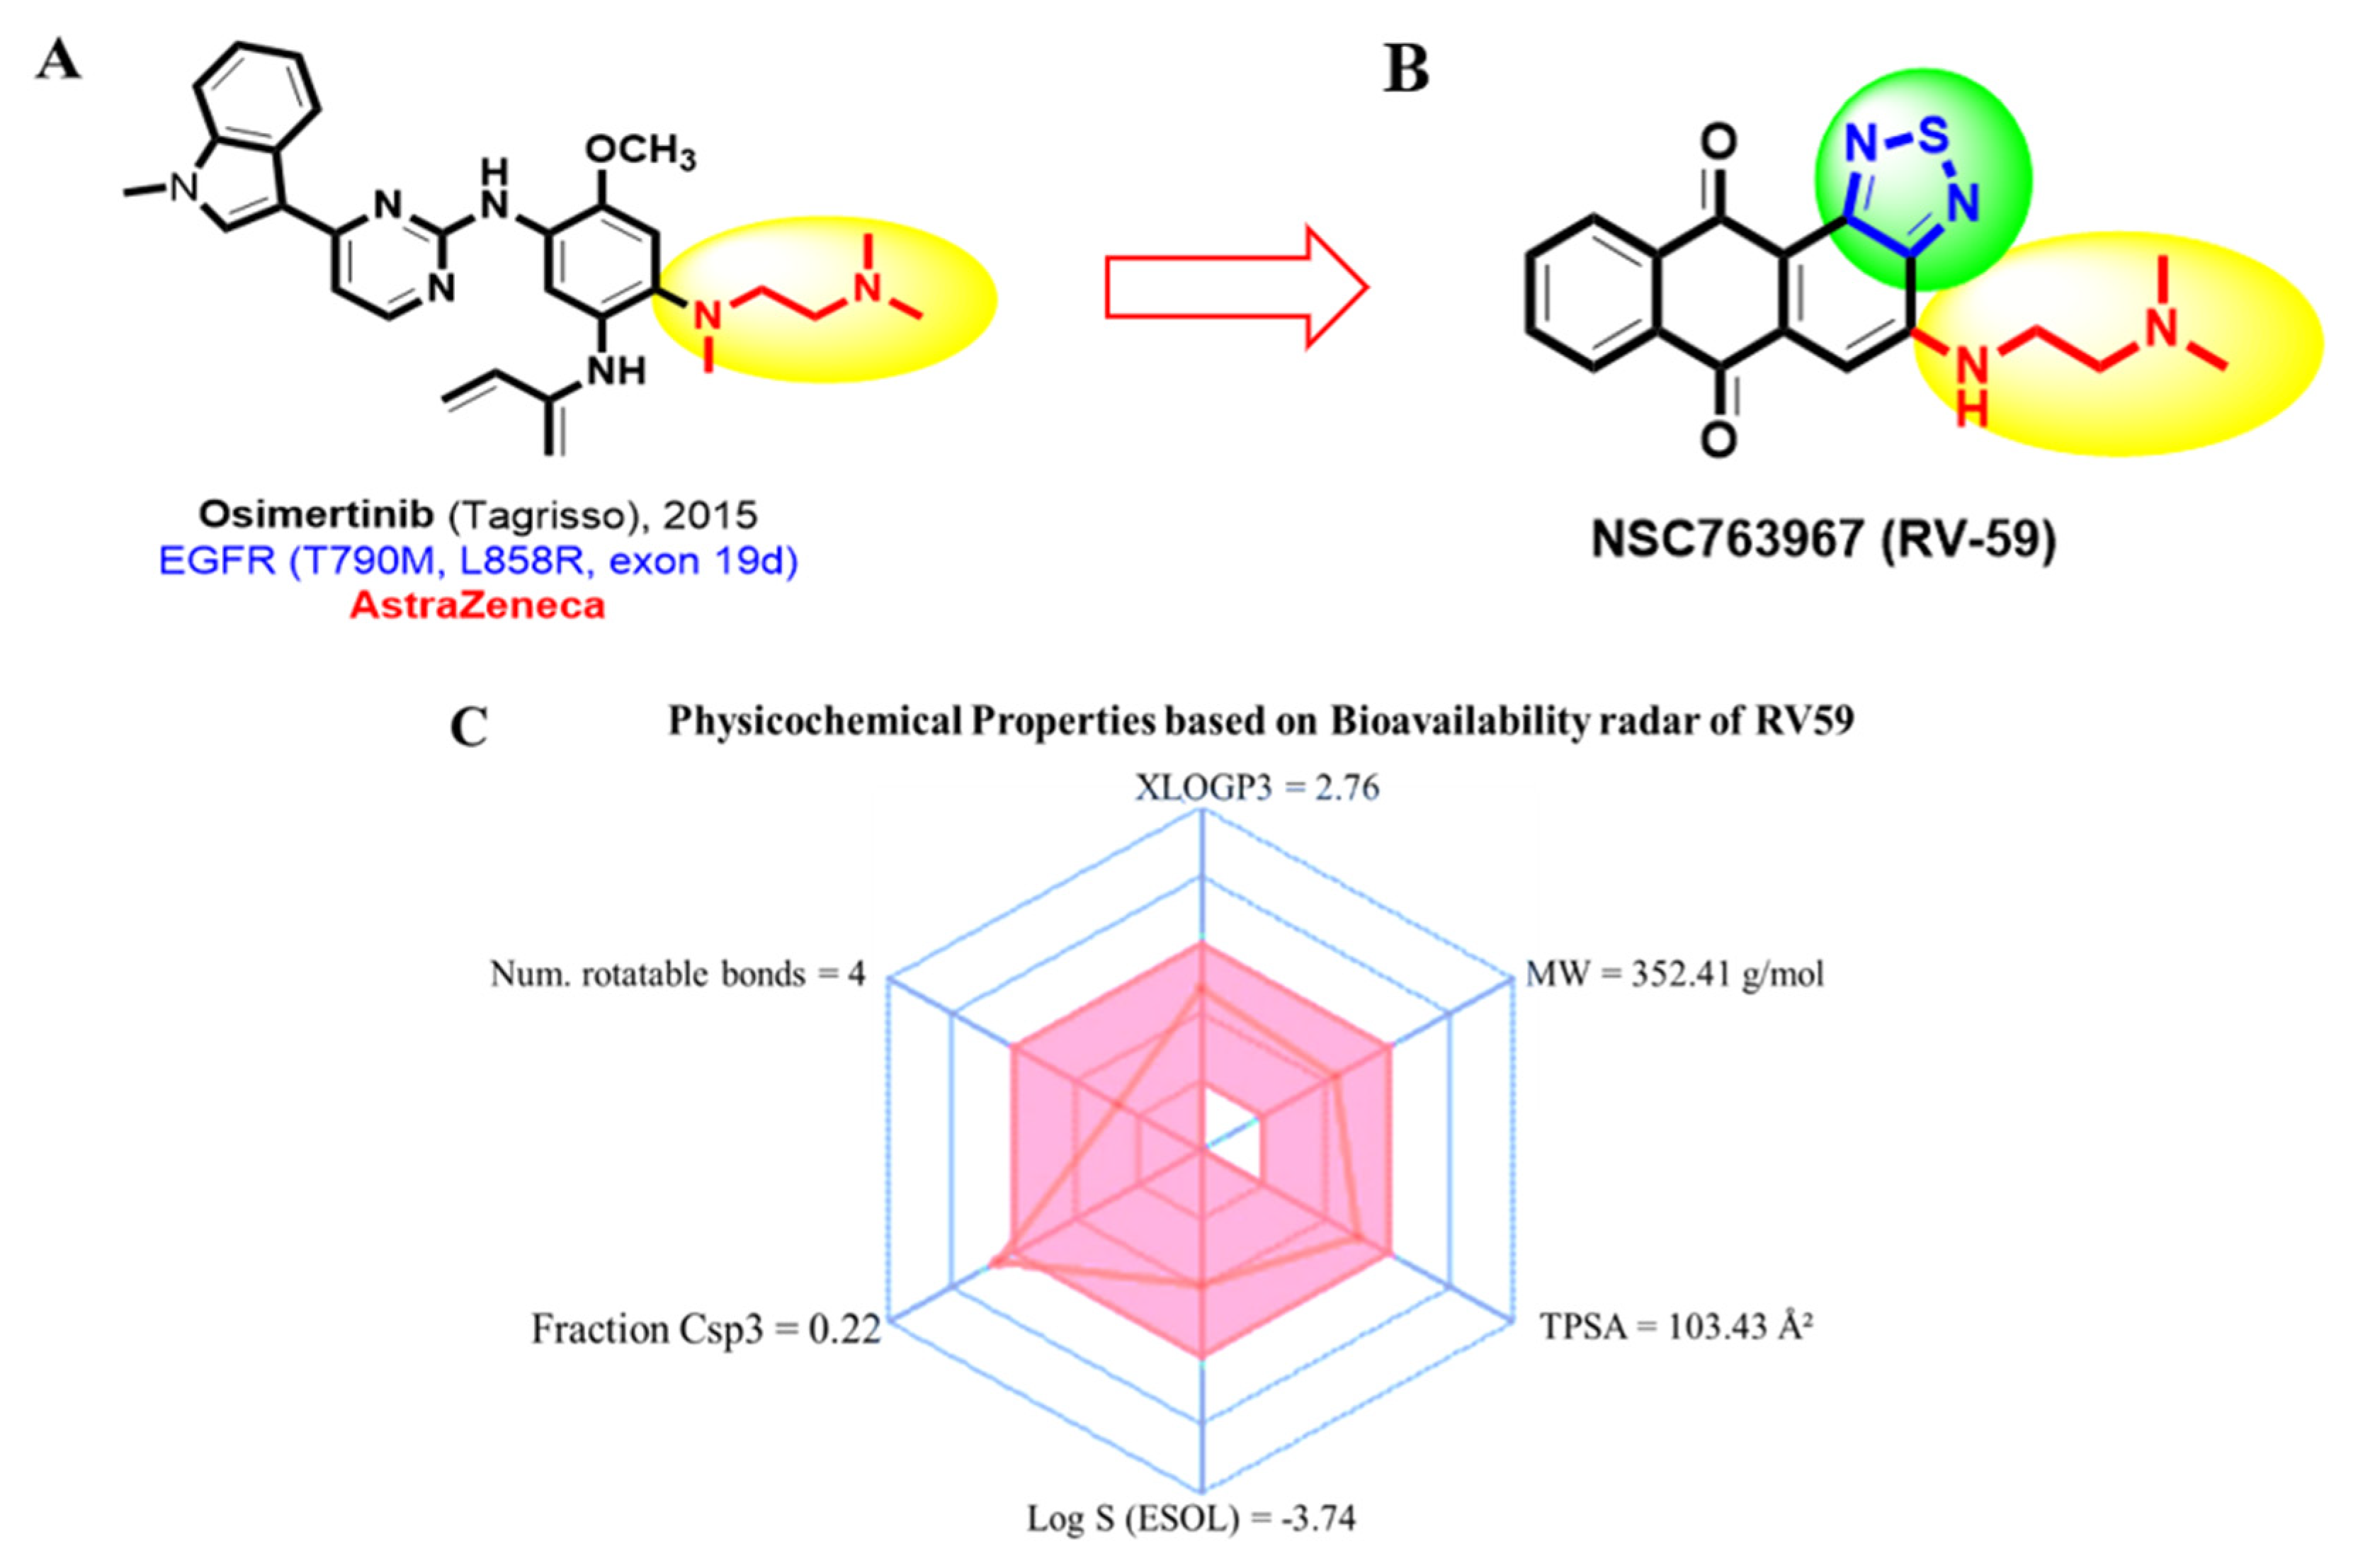
3.2. RV59 Passed the Required Drug-Likeness Criteria

RV59 small molecule, is a derivative of EGFR inhibitor osimertinib (CID: 71496458), which was recently synthesized in our laboratory. Using swissADME, a free web tool to evaluate pharmacokinetics, drug-likeness, and medicinal chemical friendliness of small molecules [47], we assessed the absorption, distribution, metabolism, and excretion (ADME) of RV59. Bioavailability radar displaying all six physical properties of RV59 showed that the compound successfully met the minimum requirements of drug likeness (Figure 1). The criteria are based on the Mw of a compound (Mw recommended value ≤ 500 g/mol), flexibility (number of rotations: recommended value ≤ 10), solubility (log S (ESOL) recommended value 0–6), saturation (fraction Csp3 recommended value ≤ 1), polarity (TPSA recommended value ≤ 140 Å2), and lipophilicity (XLOGP3 recommended value −0.7–5). Moreover, pharmacokinetics (PKs), drug-likeness, and medicinal chemical properties of RV59 (Table 3) indicated that RV59 had good synthetic accessibility of 2.95; this was evaluated according to the range from 1 (easy to make) to 10 (difficult to make). The compound also passed the criteria for Ghose, Veber (GSK), Egan (Pharmacia), and muegge and the Lipinski (Pfizer) rule-of-five of drug likeness and drug discovery. The bioavailability of the compound based on gastrointestinal absorptivity (GIA) indicated a score of 0.55 (55%) which indicates acceptable PK properties.

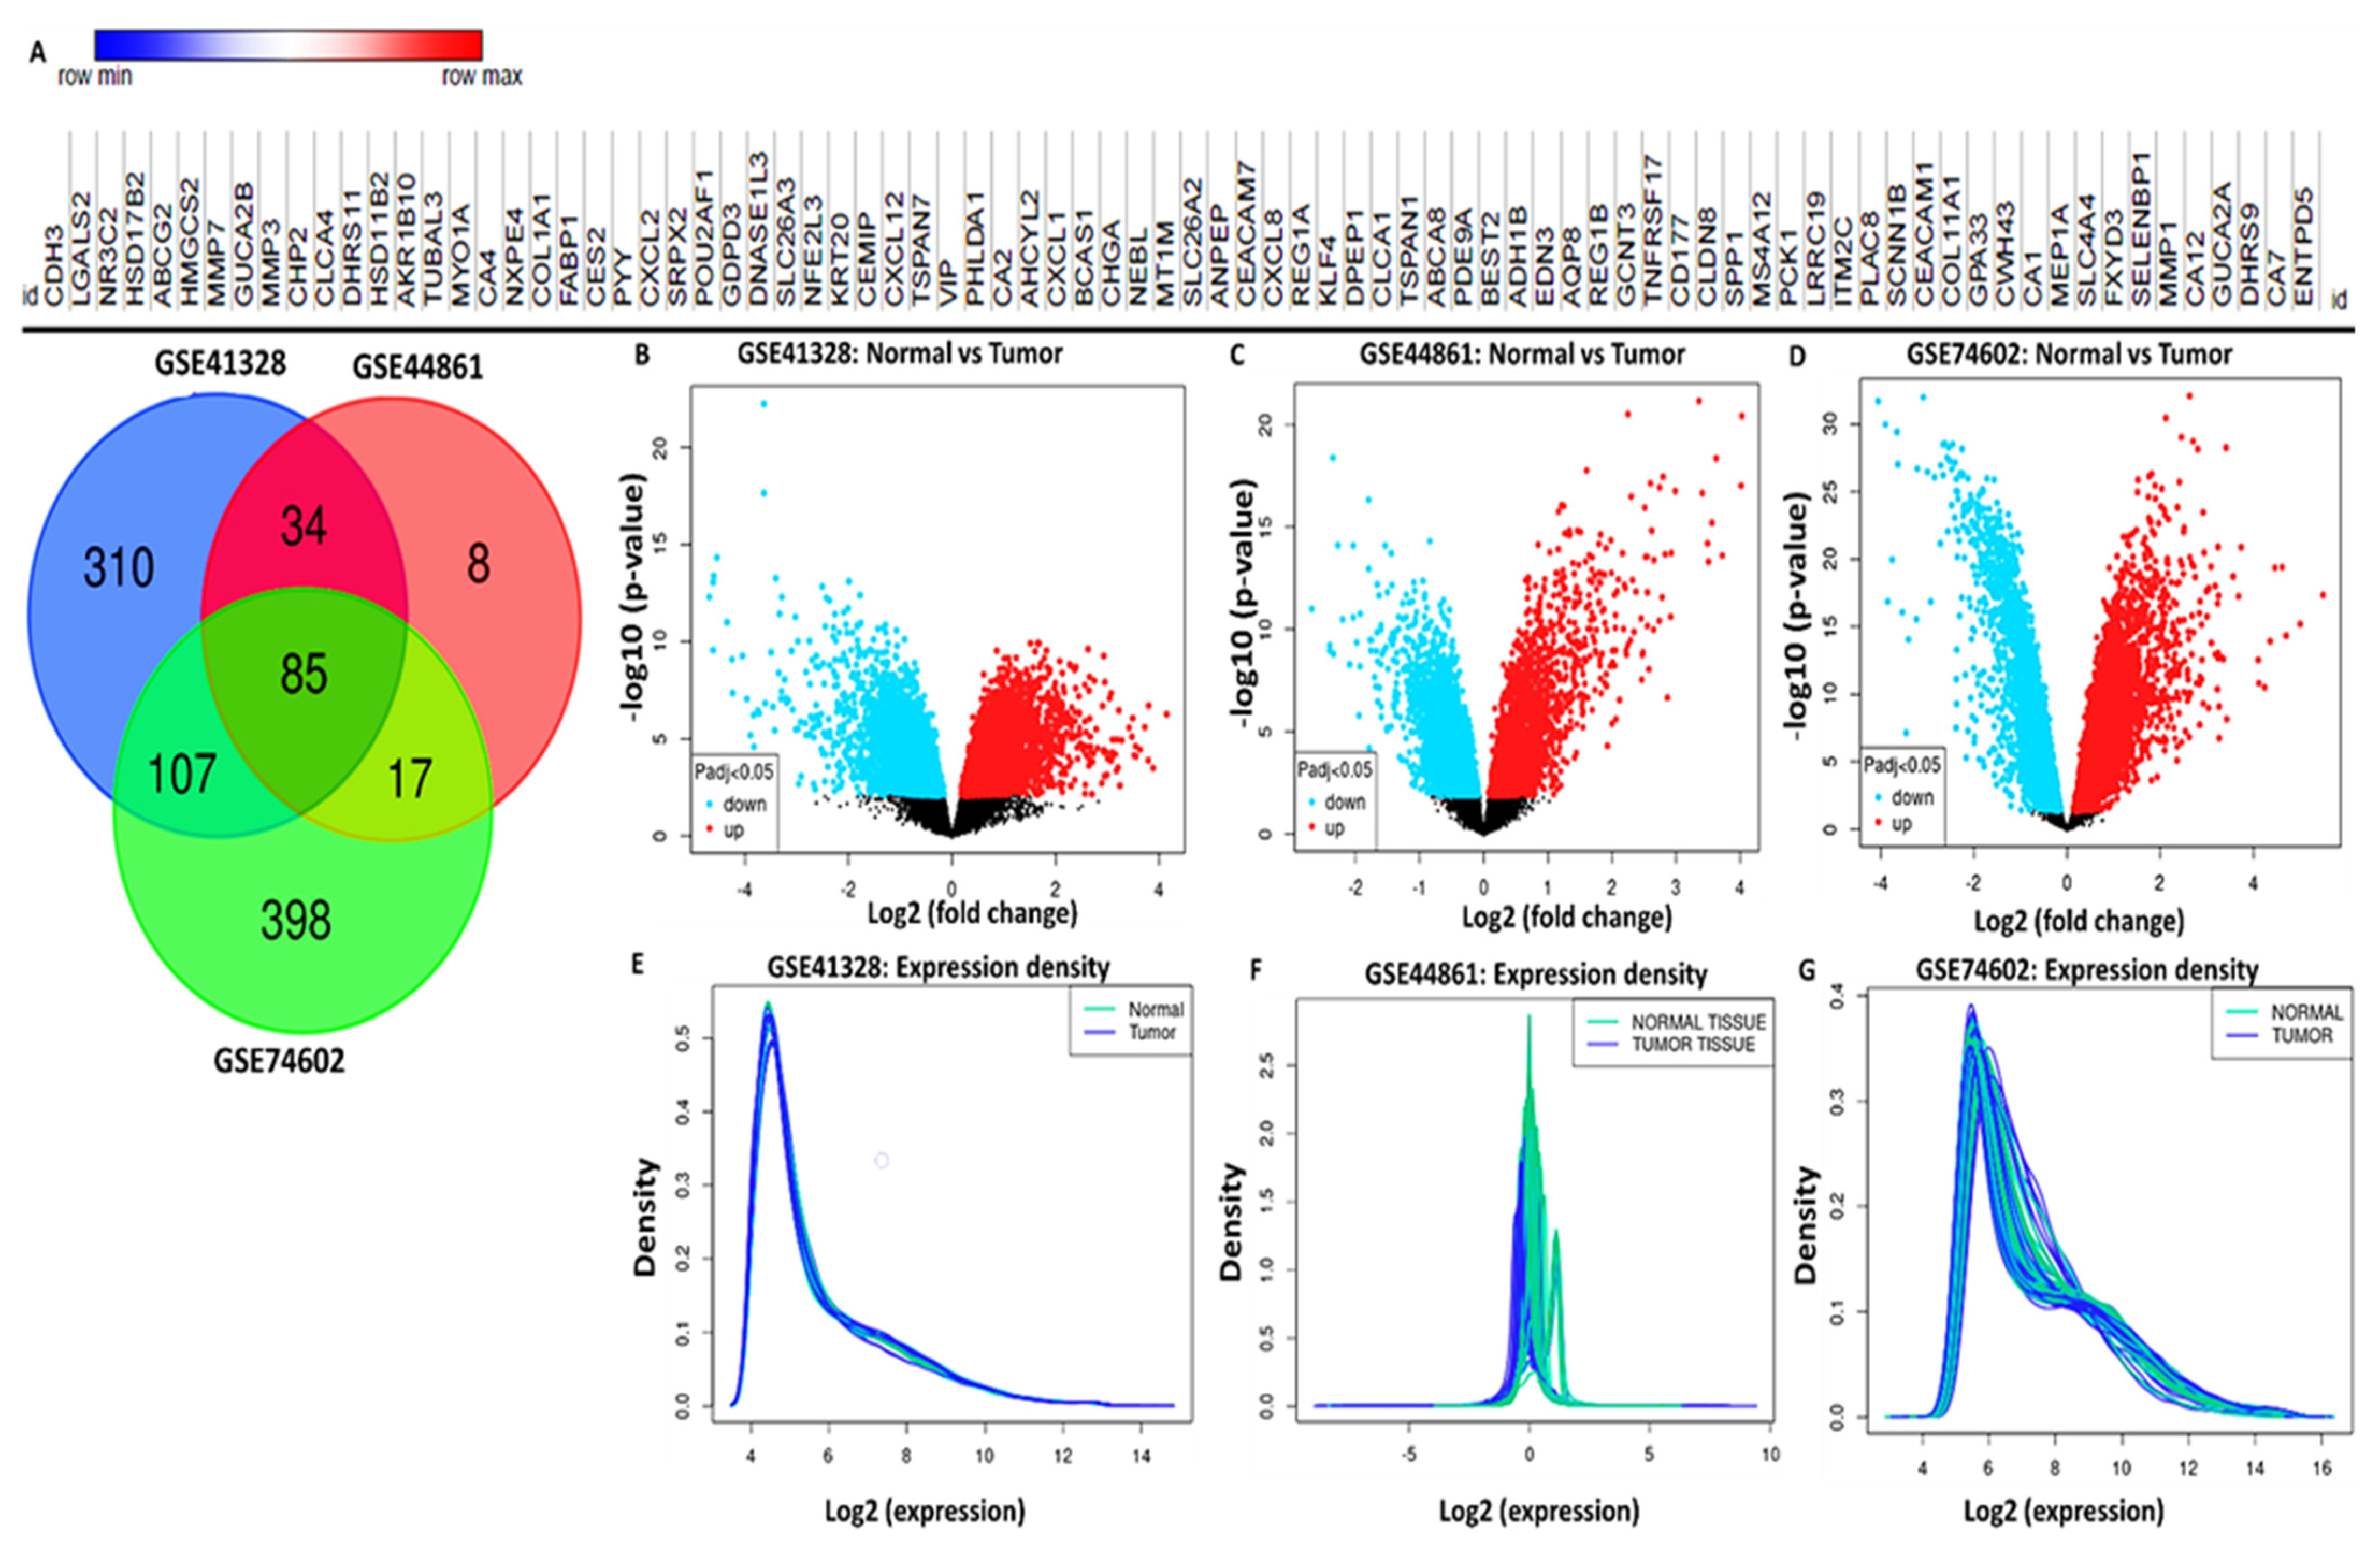
3.3. Identification of Differentially Expressed Genes (DEGs) in CRC

DEGs from the microarray dataset were shown by identifying expressed genes between colon cancer samples and normal samples tallied from separate studies. Results showed that 536, 144, and 607 DEGs were respectively obtained from the GSE41328, GSE44861, and GSE74602 datasets. Eighty-five genes overlapped in these datasets as demonstrated in a Venn diagram (Figure 2A). Red and blue dots in the heatmap and volcano plots respectively represent upregulated and downregulated genes (Figure 2B–D). The expression density curve demonstrated that the expression scales of the three databases were between 0 and 16. Expression values of gene data in GSE41328 and GSE74602 were concentrated around 5 following standardization.

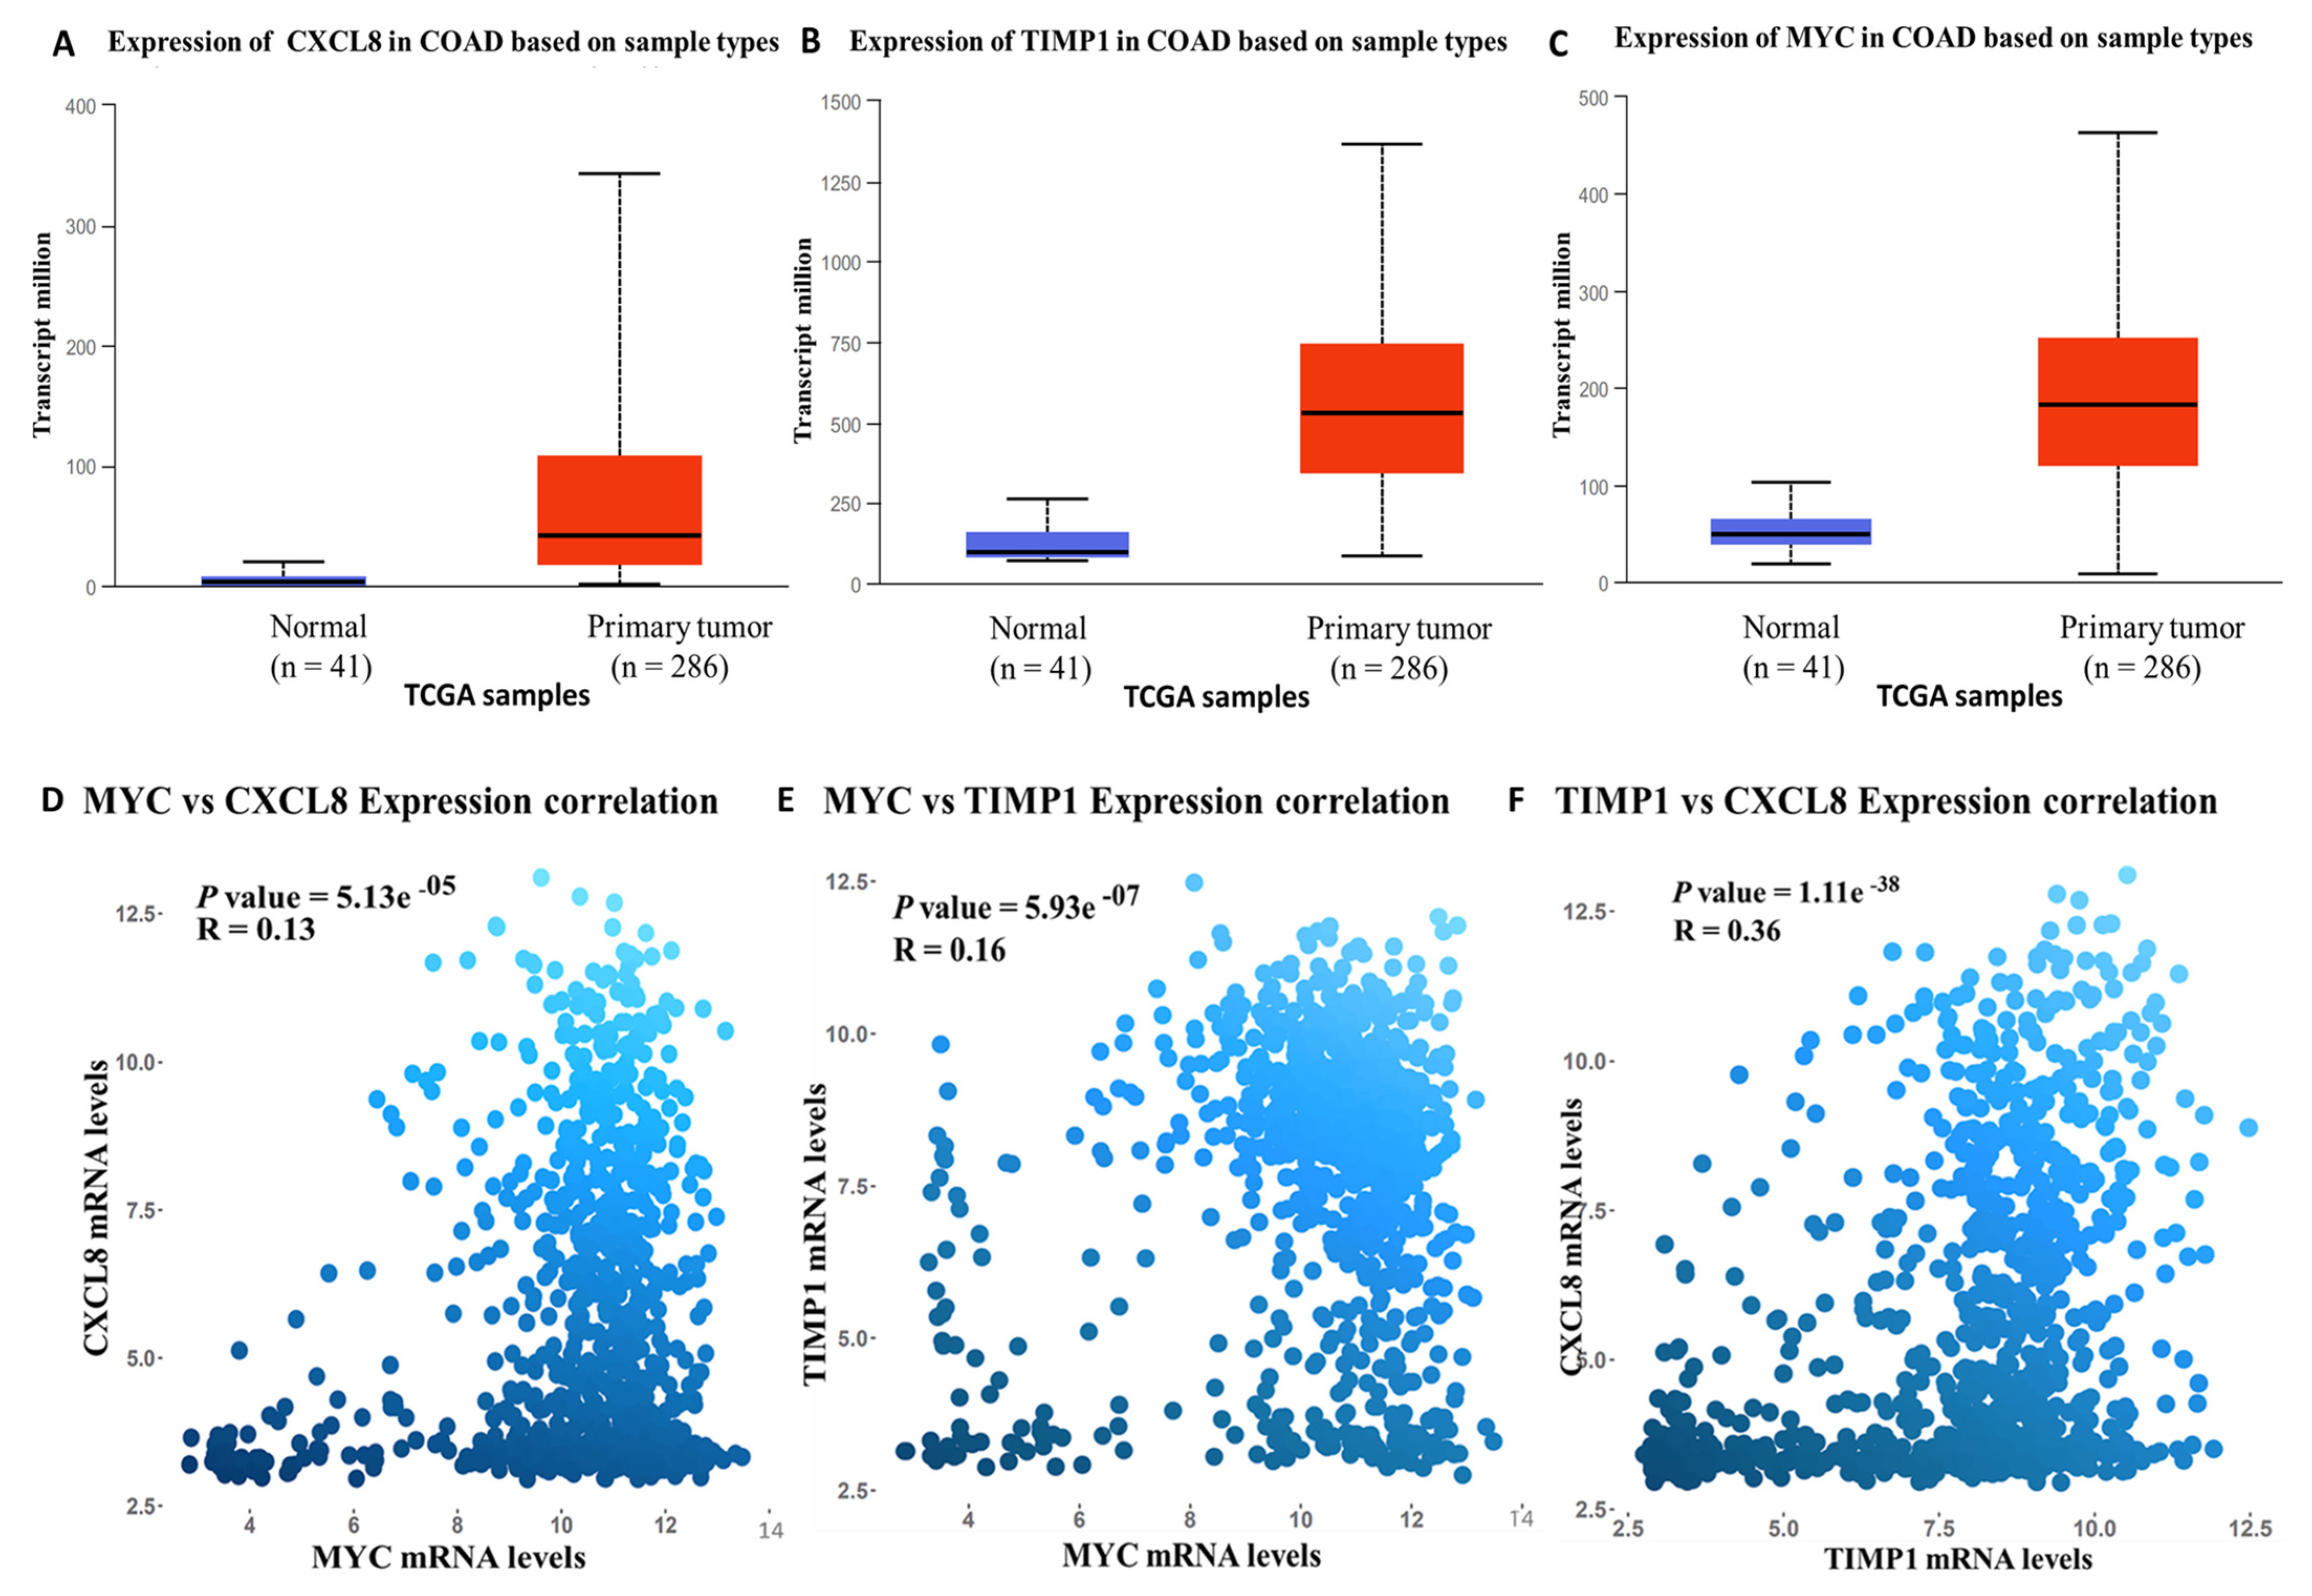
3.4. Validation of MYC/CXCL8/TIMP1 Expression Levels in CRC

Expression levels of the MYC/CXCL8/TIMP1 oncogenes were analyzed using UALCAN (http://ualcan.path.uab.edu/), a comprehensive open-access public online tool for analyzing cancer data [49] Expression levels of the MYC/CXCL8/TIMP1 oncogenes in CRC primary tumor samples (red) were compared to adjacent normal samples (blue), with p < 0.05 considered statistically significant (Figure 3A–C). Interestingly, the analytical results showed high expressions of the MYC/CXCL8/TIMP1 oncogenes in tumor samples compare d to normal samples. Furthermore, we used GECO, a gene expression correlation analytical tool, which displayed positive correlations of MYC with CXCL8, MYC with TIMP1, and TIMP1 with CXCL8. Positive Pearson correlation coefficients and p < 0.05 indicated statistical significance (Figure 3D–F).

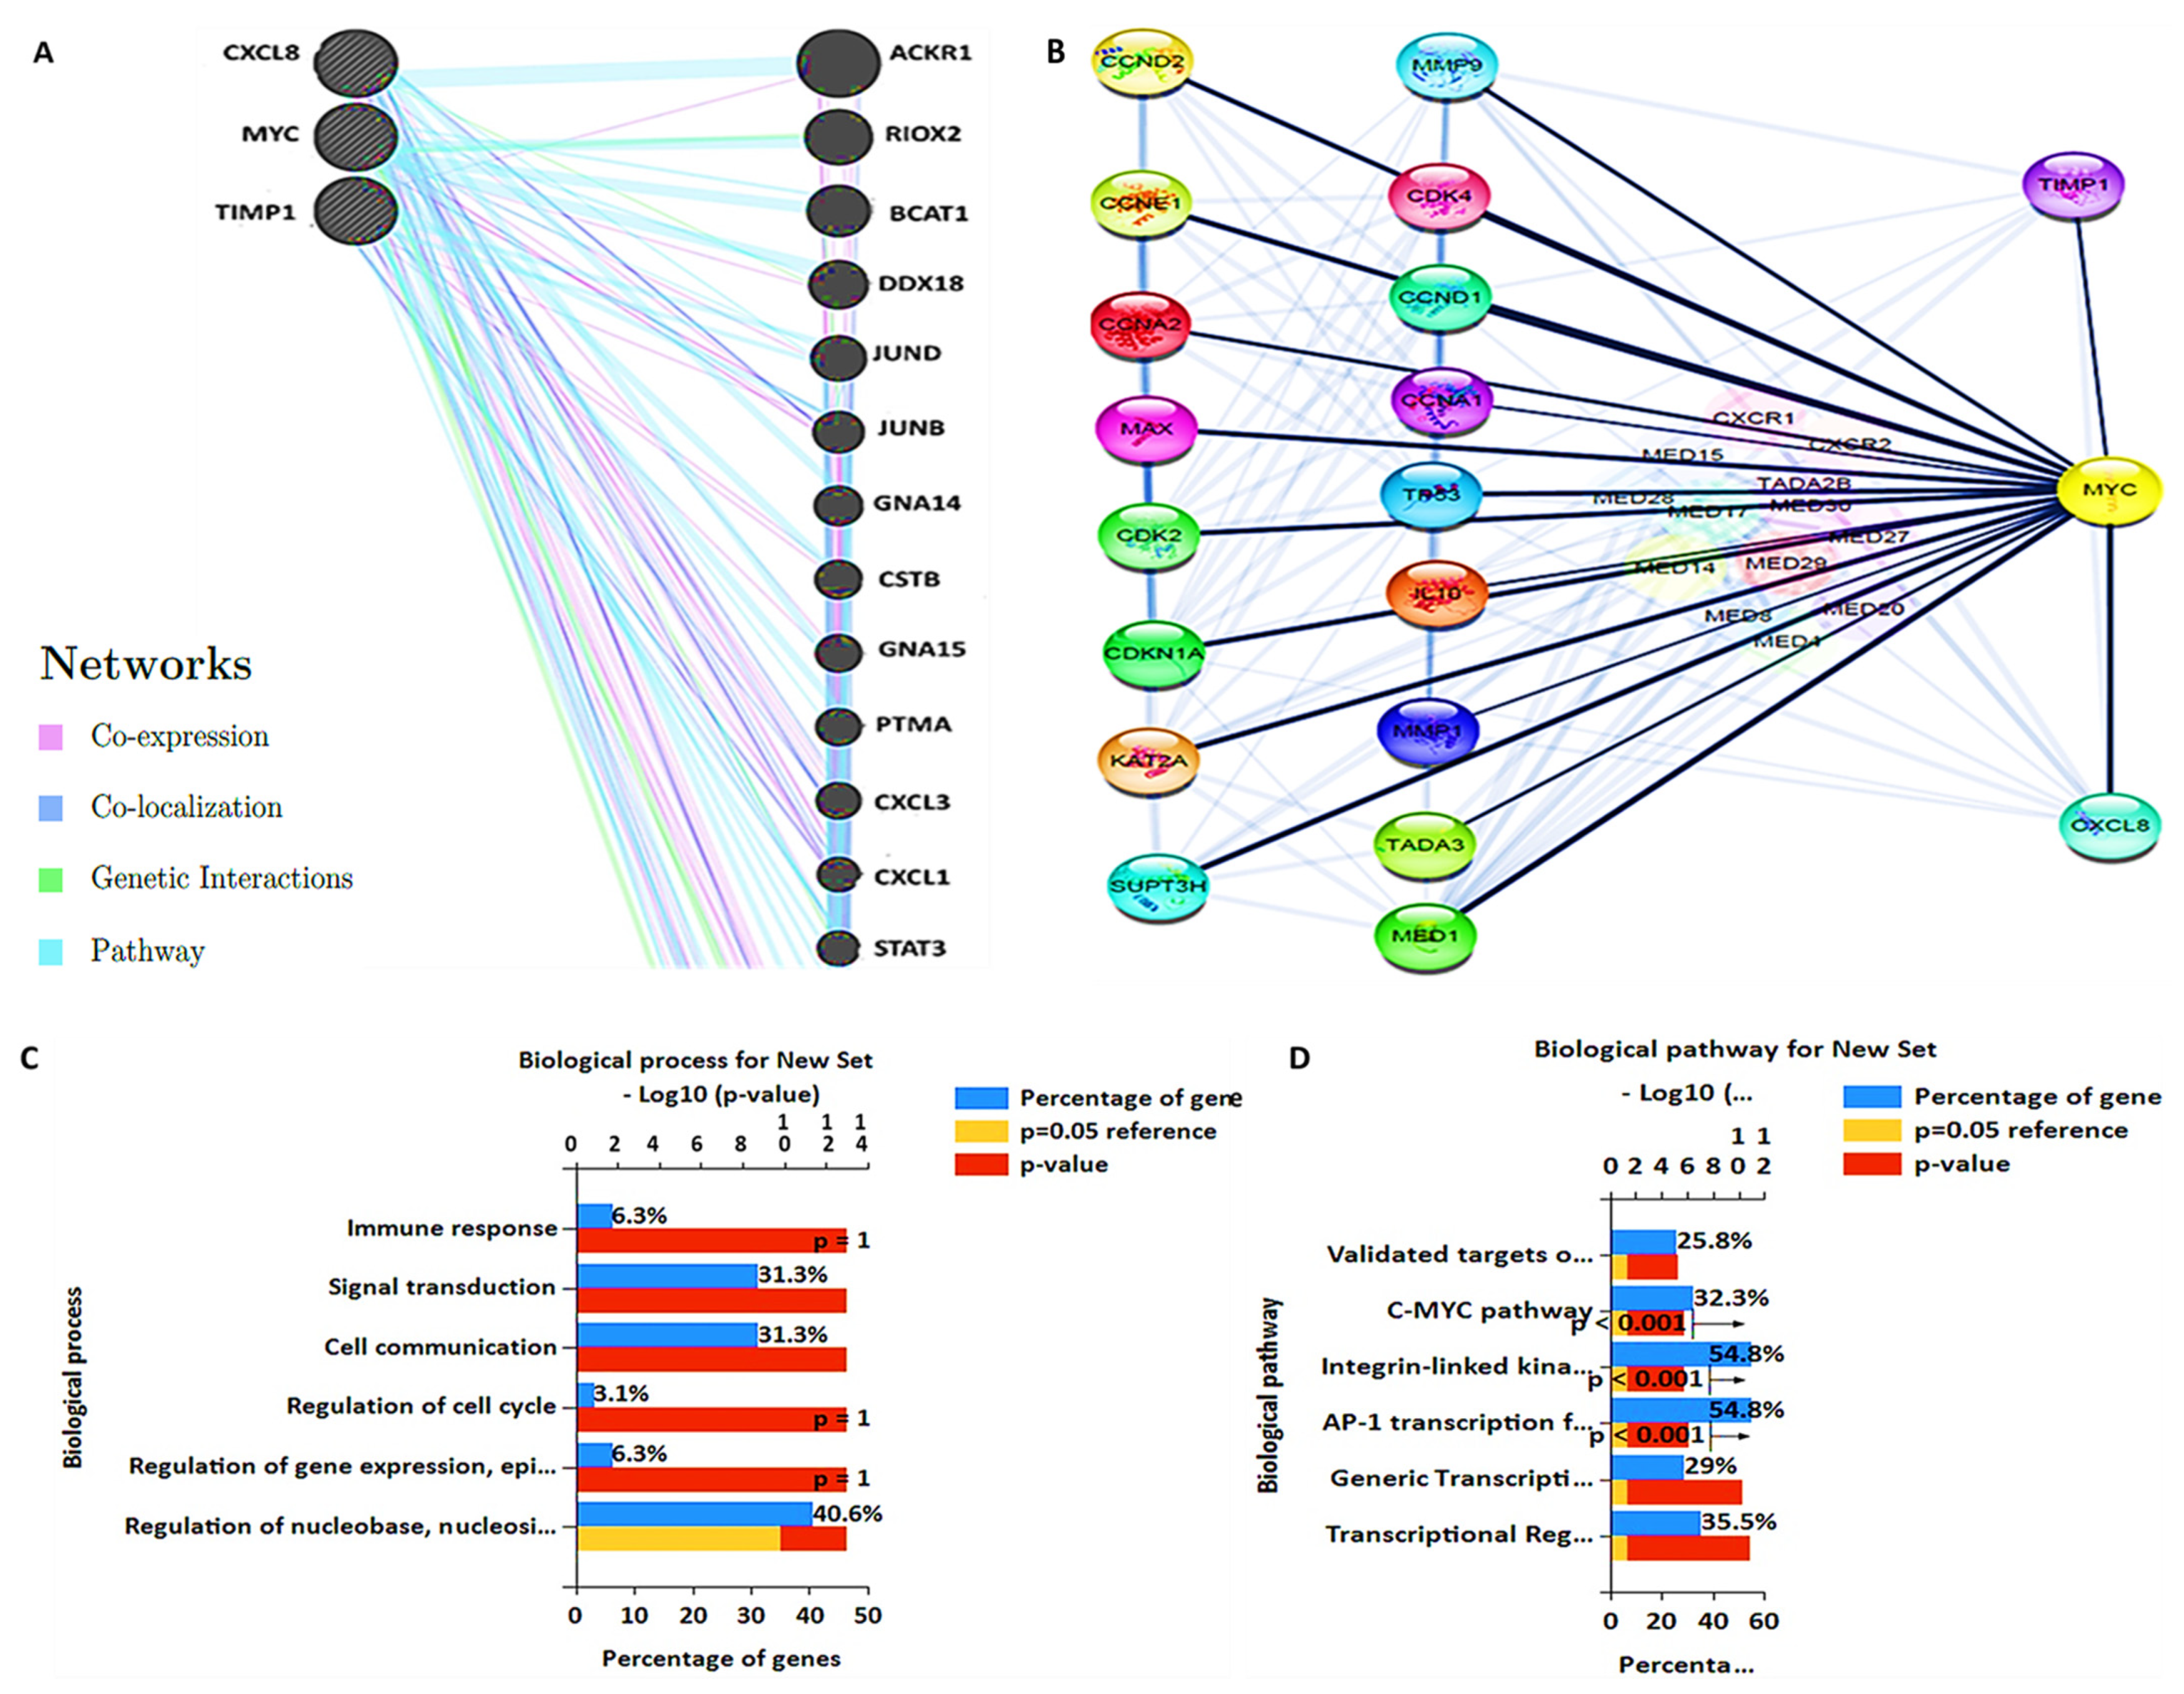
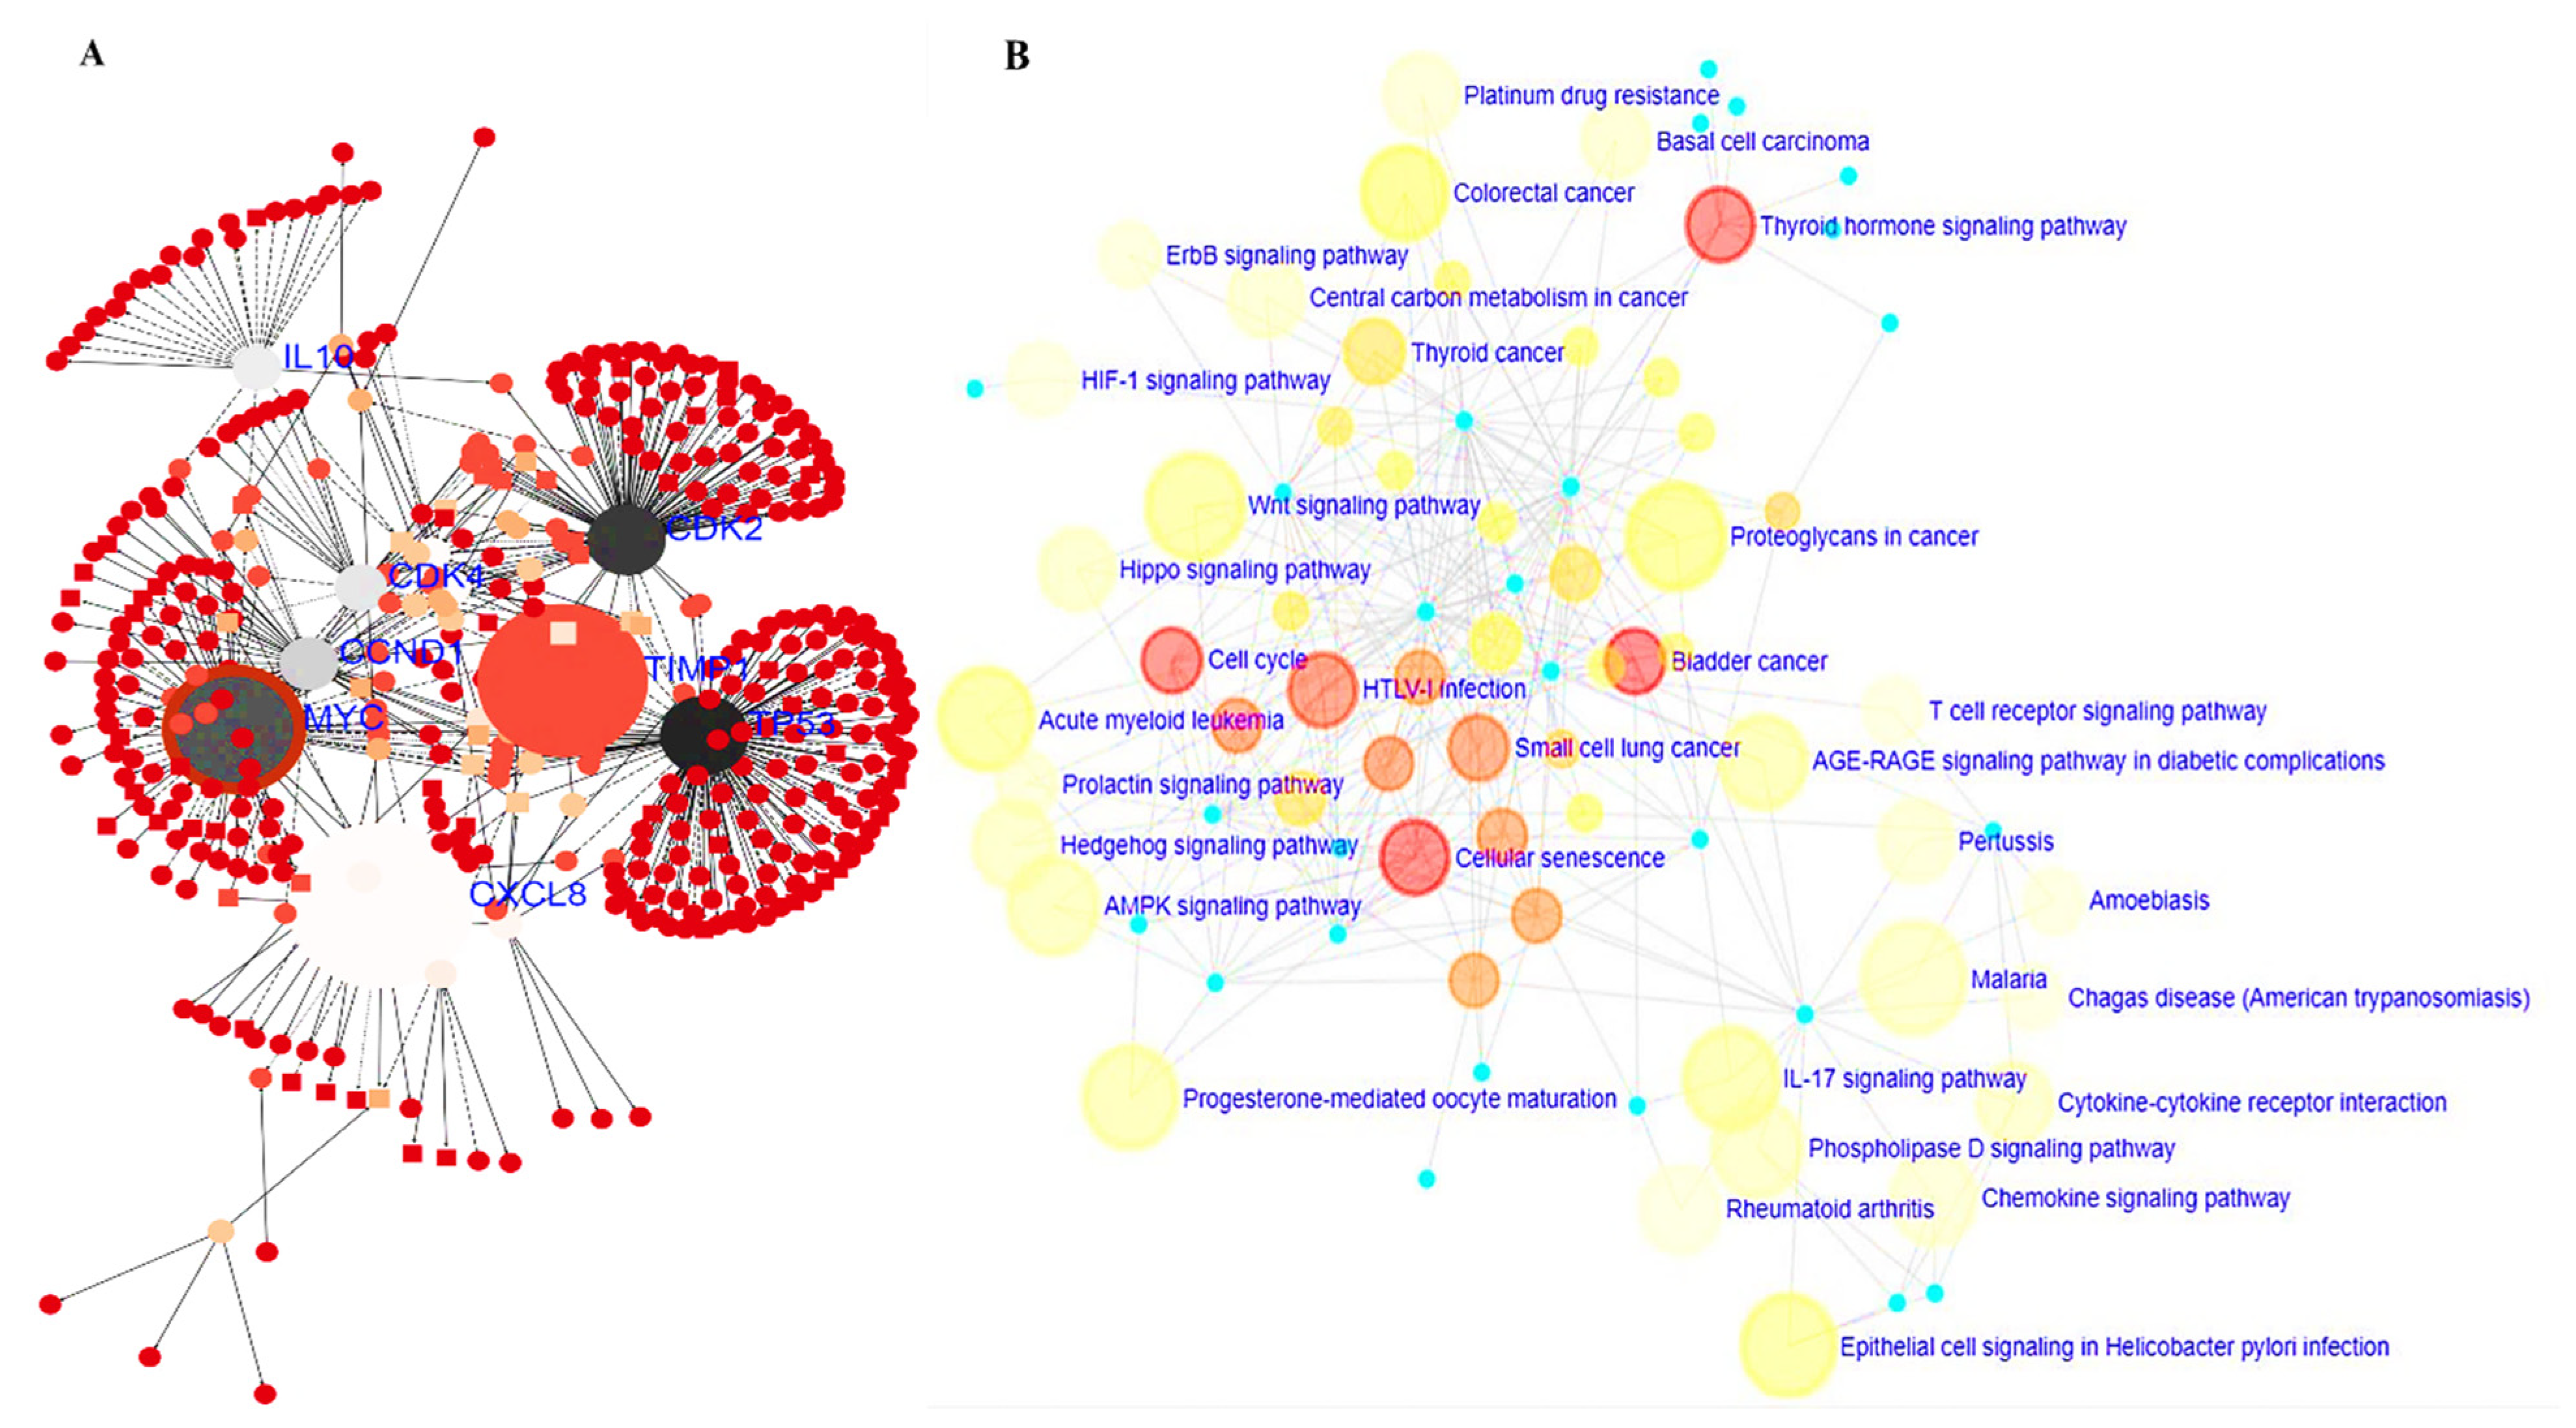
3.5. PPI Network and GO and KEGG Pathway Analysis

A functional interaction analysis was performed with STRING (https://string-db.org/) to construct a PPI clustering network [51]. A confidence score of >0.7 was considered most significant. The GeneMenia tool (https://genemania.org/) and cytoscape software were used to build the PPI network. From analysis of the results, interactive networks were based on gene co-expression, co-localization, genetic interactions, and various pathways involved within the network. In short, we identified interactions of CXCL8 with MYC, TIMP1, MMP9 and ACKR; of MYC with CXCL8, TIMP1, MMP9, CDK4, CCND1, RIOX2, BCAT and DDX18; and of TIMP1 with MYC, CXCL8, MMP9, CCNA2, JUND, and STAT3 (Figure 4A,B). The DAVID database (https://david.ncifcrf.gov/.jsp) was used to analyze the enriched GO including involved biological processes and biological pathways, with the criterion set to p < 0.05 (Figure 4C,D).

3.6. MYC/CXCL8/TIMP1 Gene Co-Expression and Functional Enrichment Analysis

Gene co-expressions displayed the most factors which contributed to functional interactions. Herein, we determined the signaling network and KEGG pathway functional enrichment analysis, and found that the MYC, IL10, TP53, CXCL8, TIMP1, and CDK2 genes were co-expressed and were the most enriched (Figure 5A). Moreover, the KEGG pathway enrichment analysis showed that co-expressed genes exhibited enrichment in the thyroid hormone signaling pathway, bladder cancer, cellular senescence, cell cycle, and HTLC-1 infections (Figure 5B).

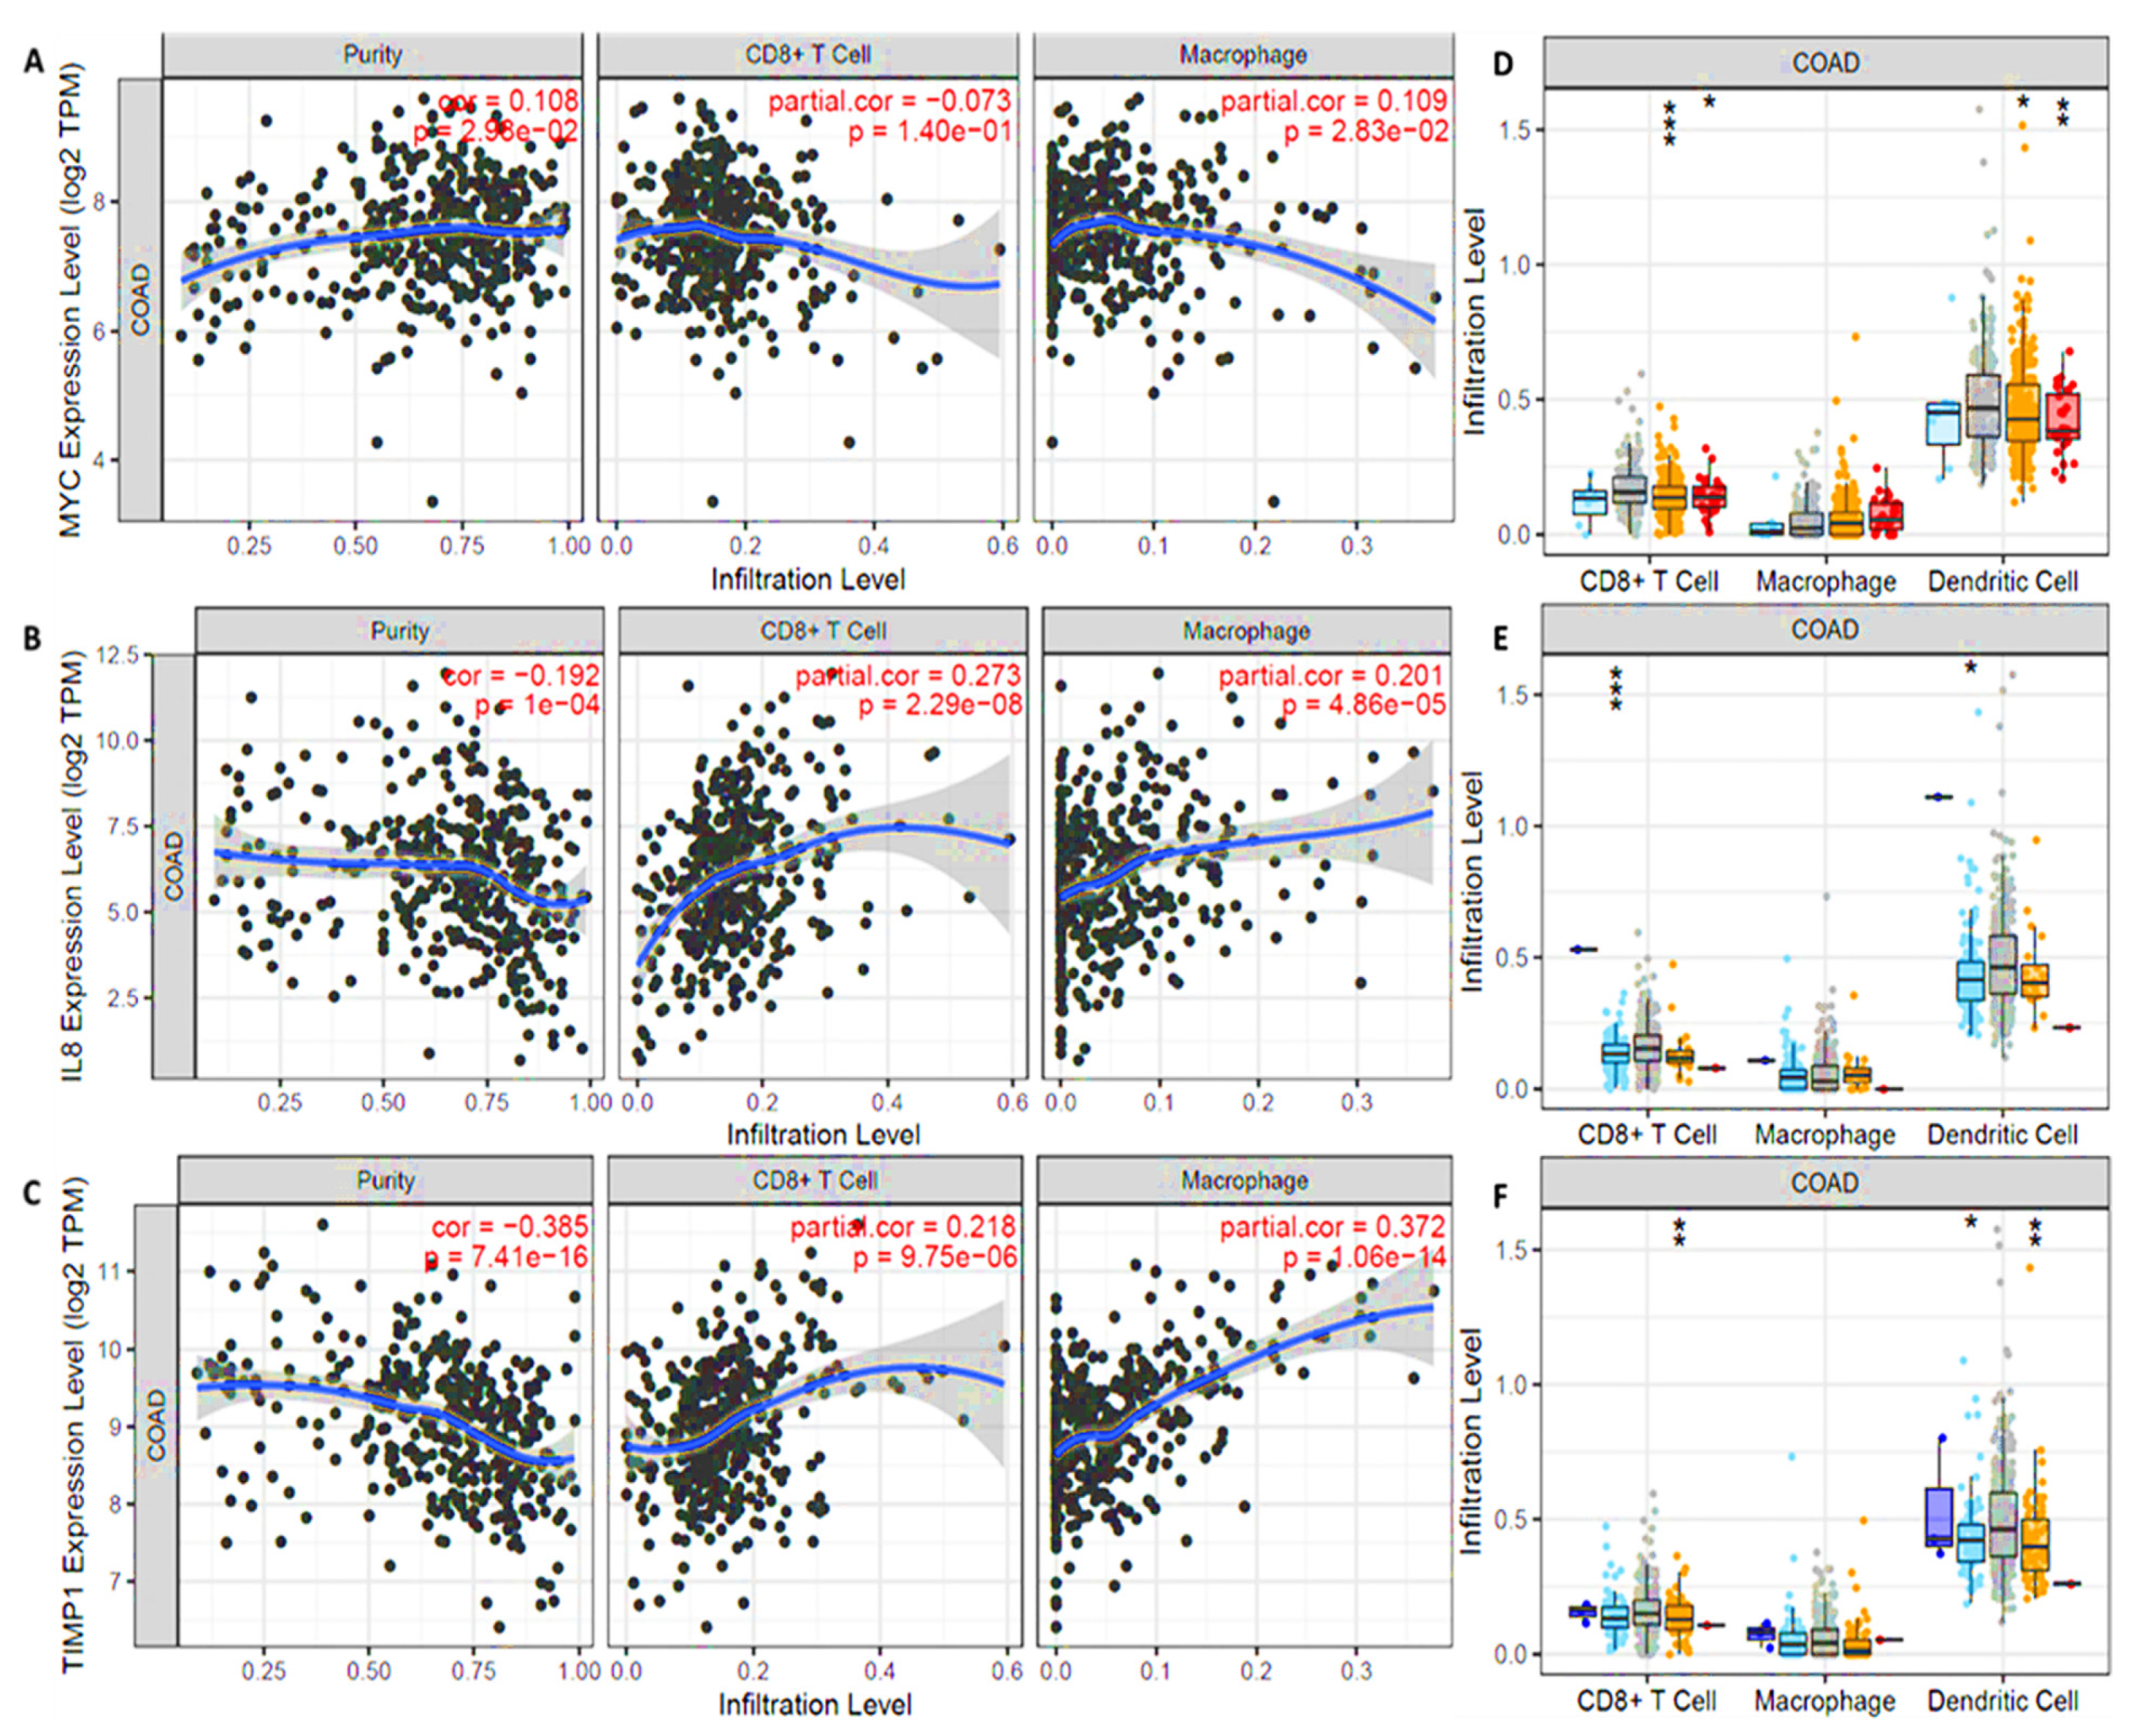
3.7. MYC/CXCL8/TIMP1 Expressions Were Correlated with Immune Cell Infiltration in Both Cancer and Normal Tissues

To identify associations of MYC/CXCL8/TIMP1 expressions with selected immune cells, we applied a correlation analysis between the above-mentioned oncogenes and immune infiltration cells (CD8+ and macrophages), where markers were adjusted by purity. As expected, results showed correlations of immune cell markers in colorectal adenocarcinoma (COAD), specifically CD8+ T cells and M2 macrophages (Figure 6A–C), with p < 0.05 considered significant. Expressions of MYC/CXCL8/TIMP1 were also found to be correlated with infiltrating levels of CD8+ T cells, macrophages, and DCs, and red represents the most significant positive correlations with high amplification, while blue represents negative correlations (Figure 6E–G). The infiltration level was compared to the normal level using a two-sided Wilcoxon rank-sum test.

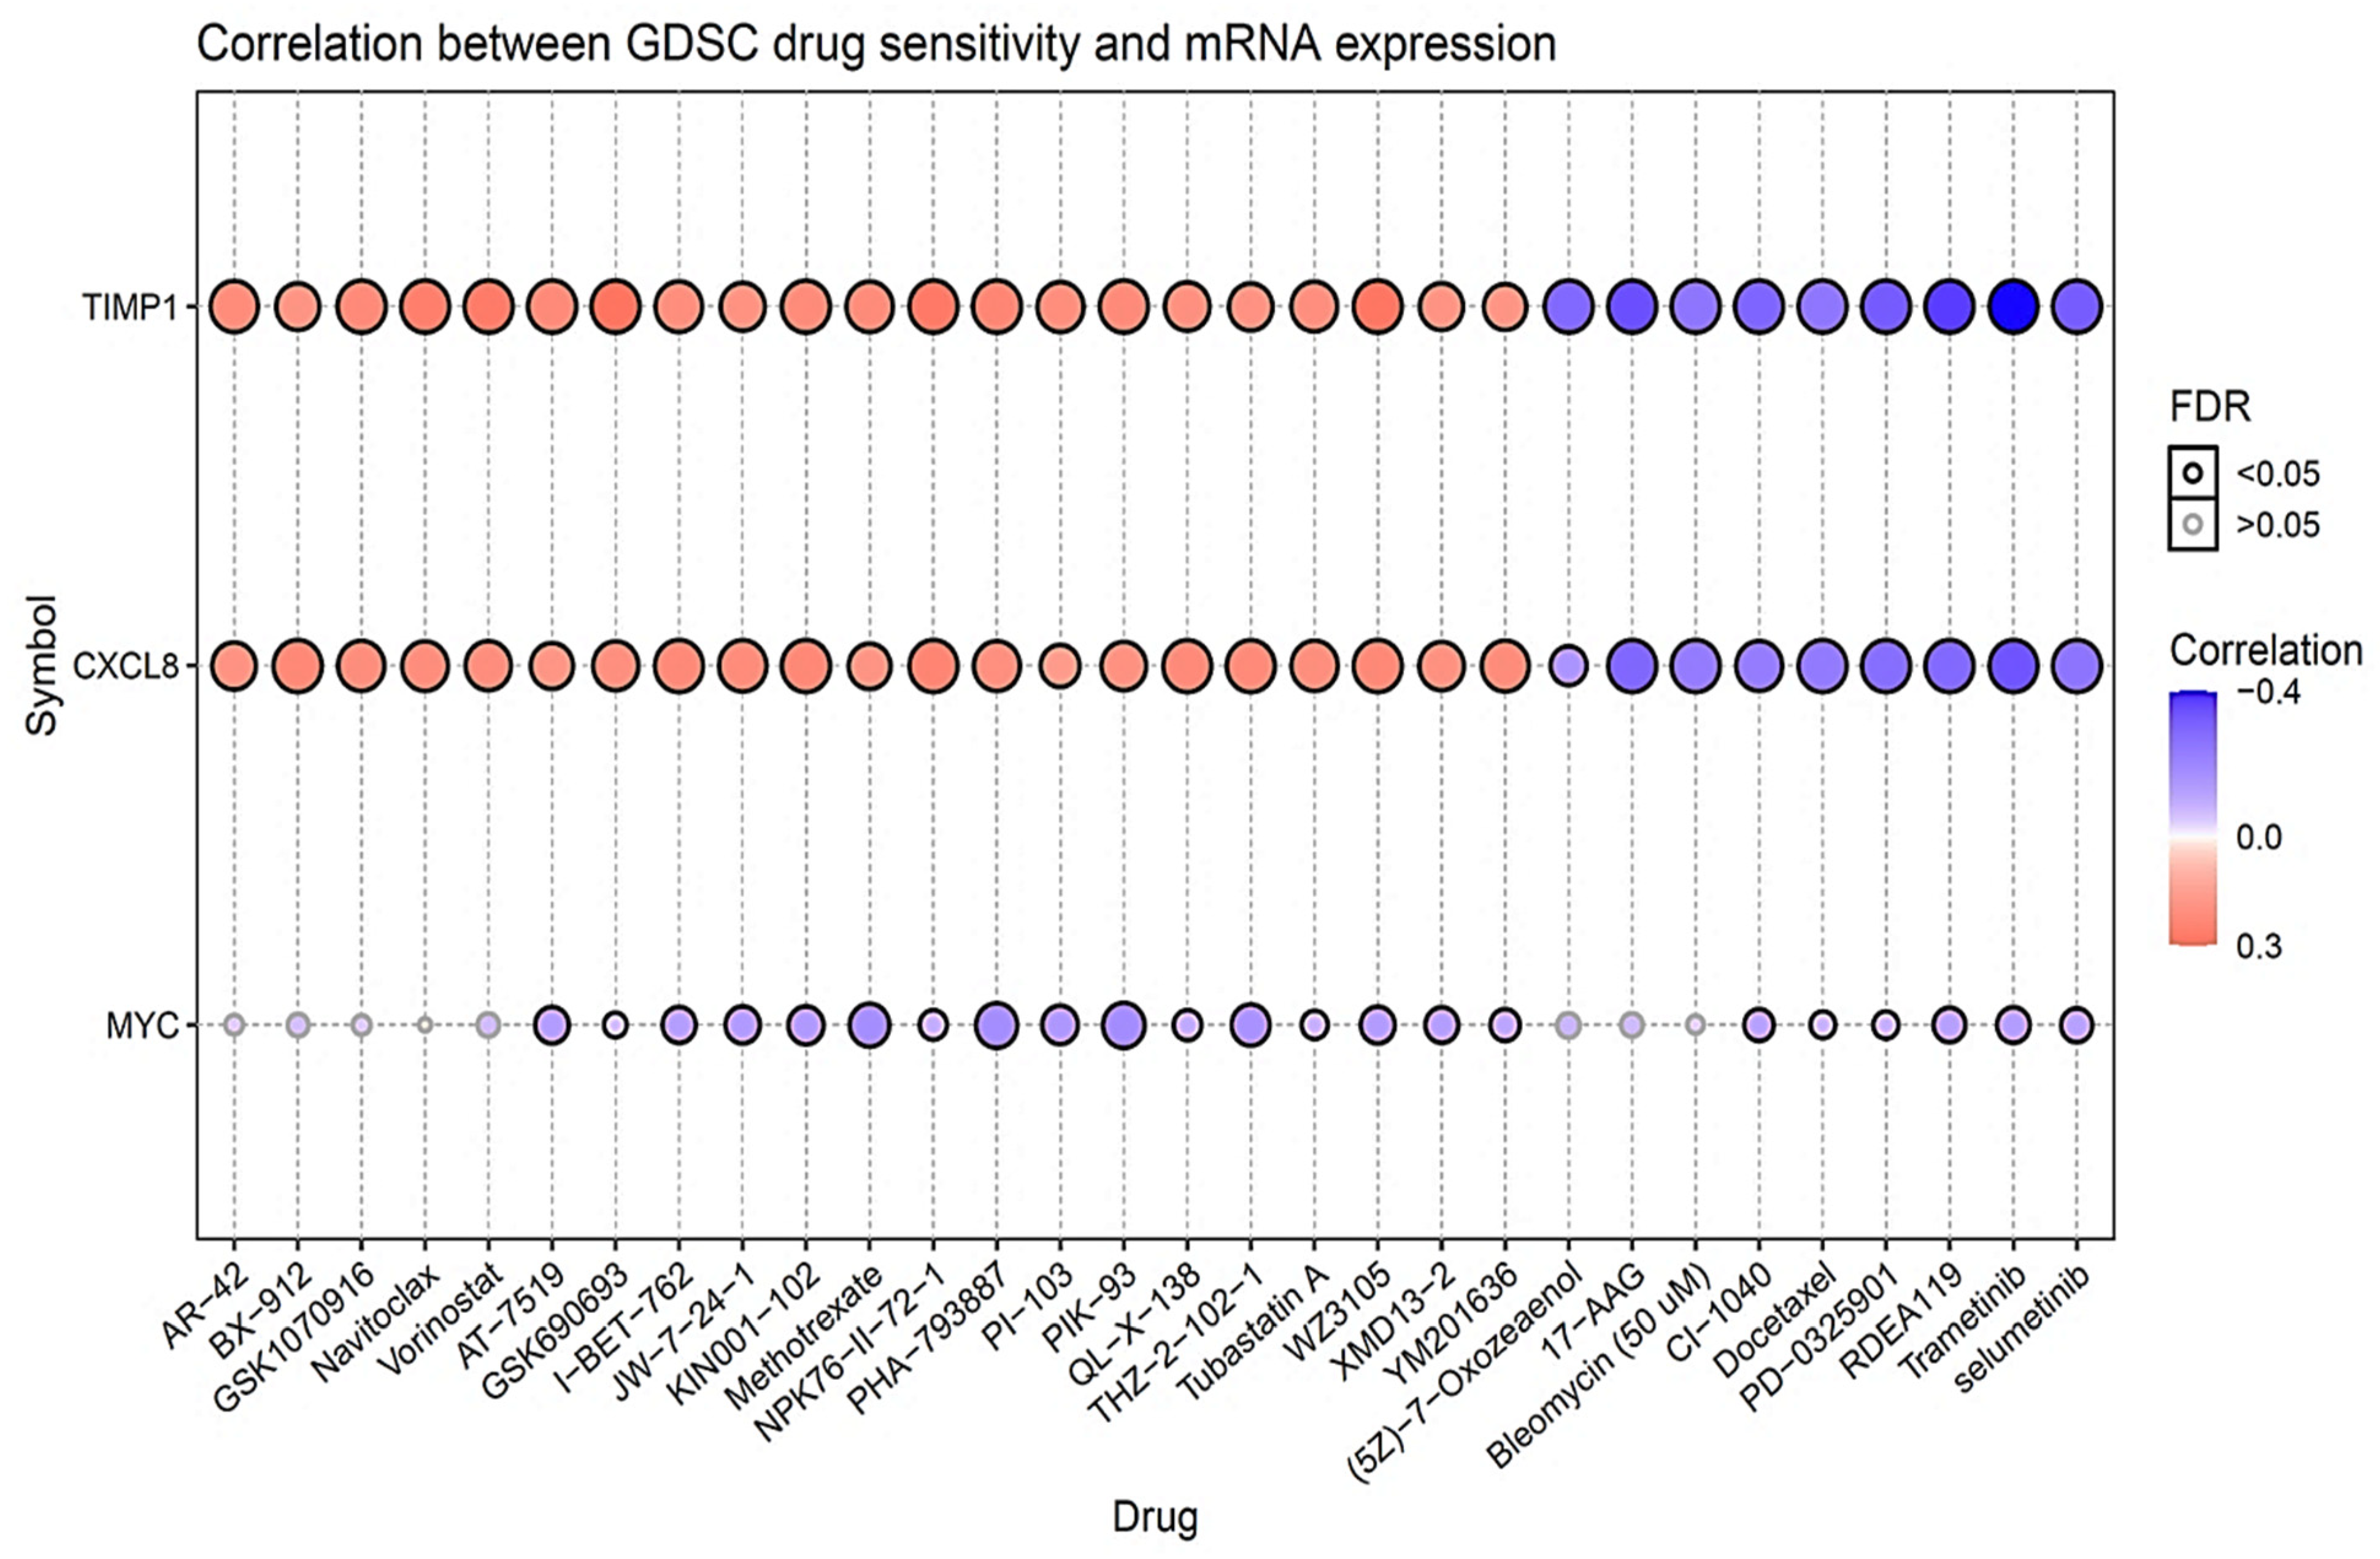
3.8. Drug Sensitivity Analysis of MYC/CXCL8/TIMP1 Oncogenes

To determine the drug sensitivity of MYC, CXCL8 and TIMP1, we used the GSCA tool to analyze the drug response (Figure 7). The correlation coefficients analysis, shows that upregulated gene expression is associated with drug resistance. From our analysis of results, we identified increased mRNA expression levels of MYC, CXCL8 and TIMP1 (indicated in orange bubbles), to be less sensitive to the drugs. Interestingly, high expression levels of MYC, TIMP1 and CXCL8 gene signatures, were shown to be resistance to Bx-912 (PDK-1 inhibitor) [59], navitoclax (Bcl-2 inhibitor) [60], vorinostat (HDAC and MYC inhibitor) [61,62] and tubastatin A (HDAC inhibitor) [63] among other FDA approved drugs.

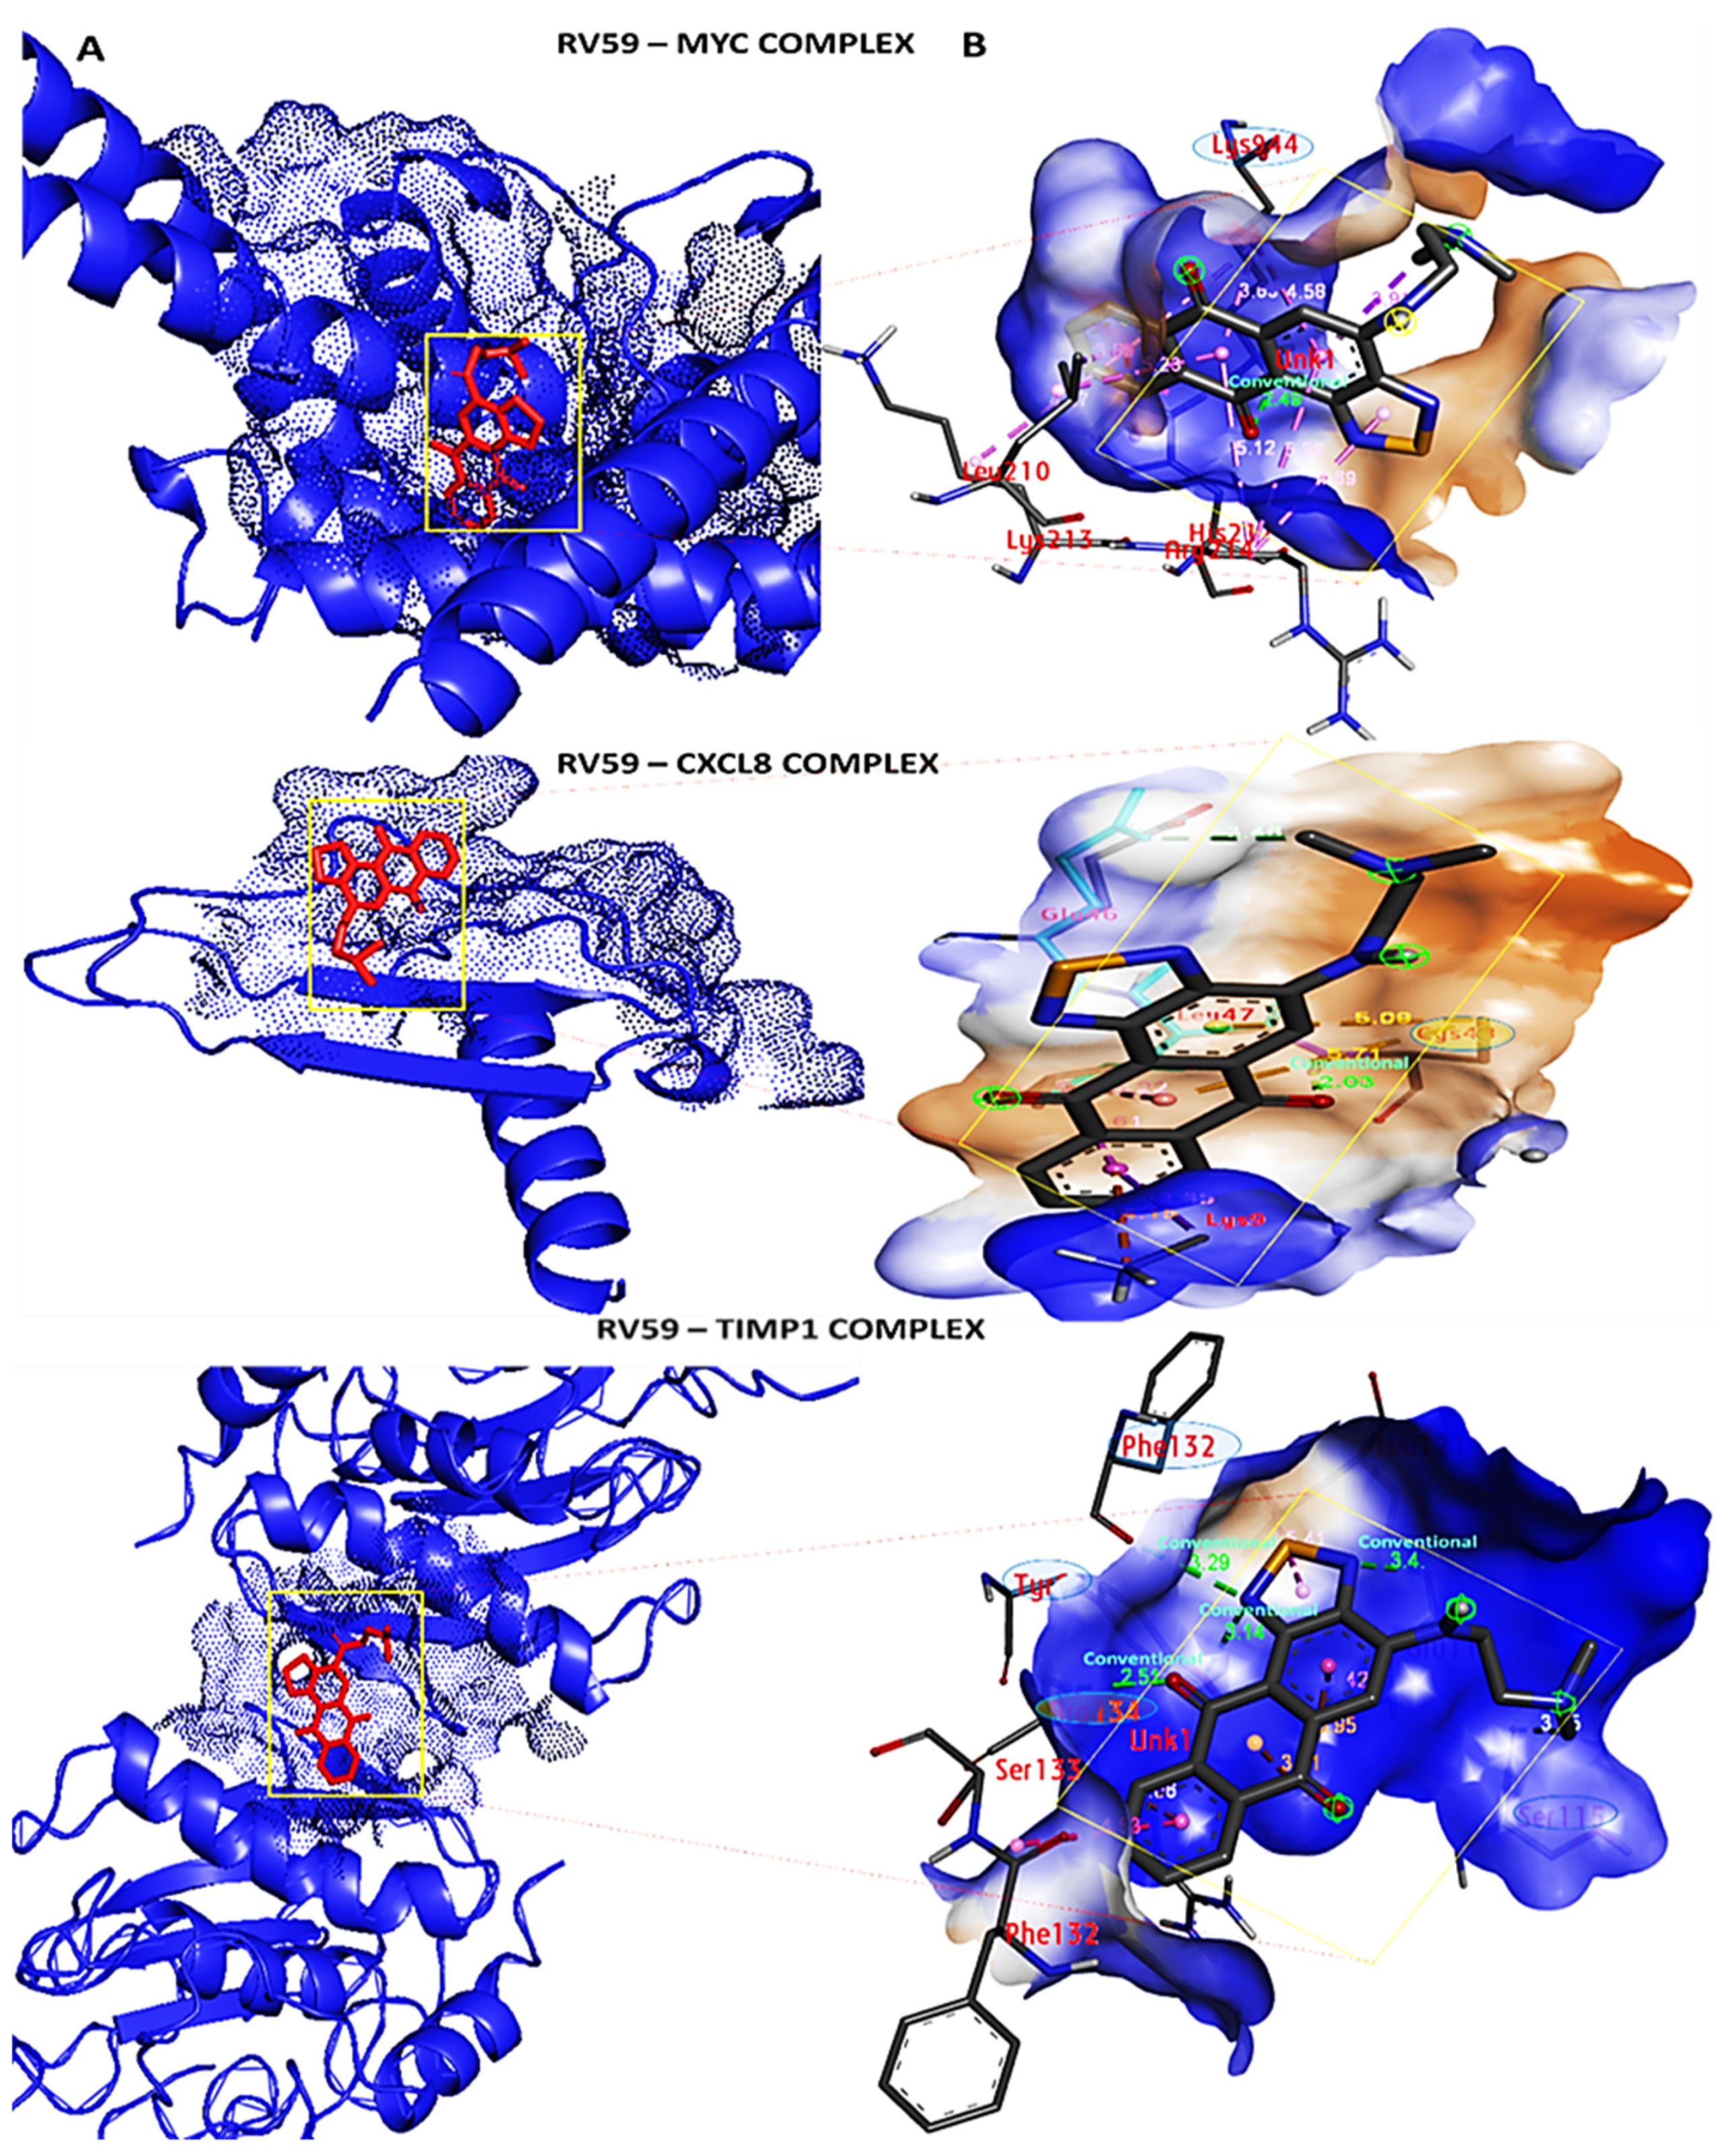
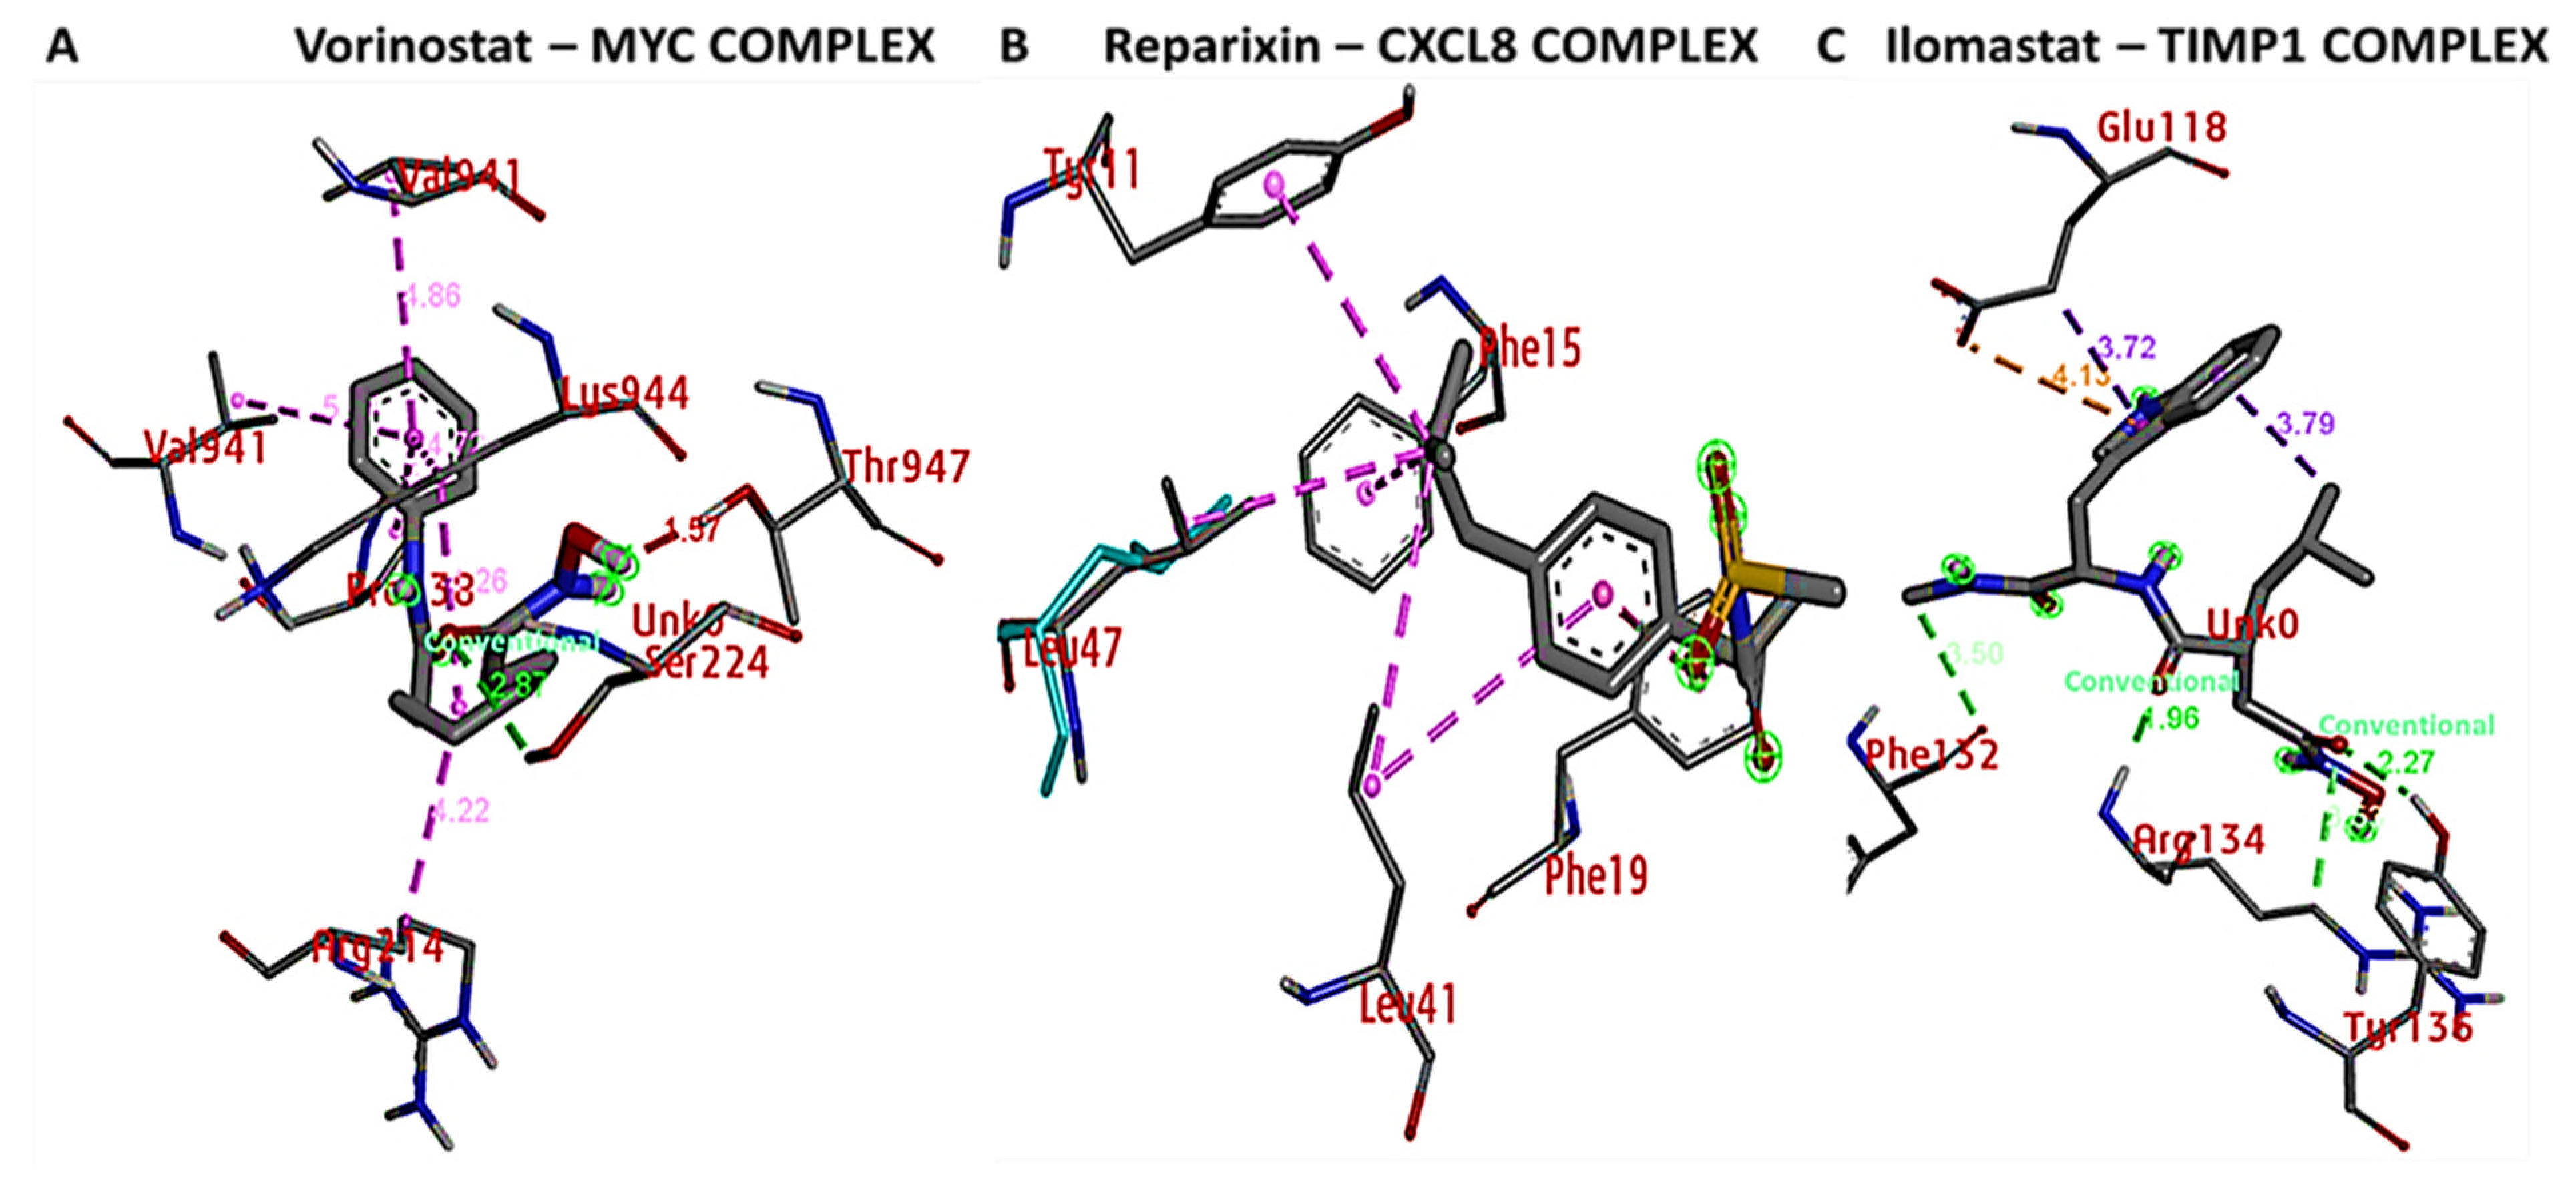
3.9. Docking Results Displayed Strong Binding Energies between RV59 and the MYC/CXCL8/TIMP1 Oncogenes

Results from the in silico molecular docking analysis revealed unique binding affinities of the RV59 compound with selected target genes obtained from the PASS online prediction tool and DPT−COMPARE algorithm. Gibbs free binding energy results were obtained as follows: −7.6 kcal/mol for MYC, −7.7 kcal/mol for CXCL8, and −6.9 kcal/mol for TIMP1. In addition, a visualization analysis showed that docking of the small molecule (ligand) displayed shorter binding distances with the proteins (receptors) of 2.49 Å for MYC, of 2.03 Å for CXCL8, and of 2.51, 3.14, 3.4, and 3.29 Å for TIMP1 (Figure 8A,B). Moreover, we compared results obtained from RV59 docking with standard inhibitors of MYC (vorinostat), CXCL8 (reparixin), and TIMP1 (ilomastat). Interestingly, the standard inhibitors exhibited lower binding energies for MYC (−6.3 kcal/mol) and CXCL8 (−6.3 kcal/mol), with the exception of TIM1 (7.4 kcal/mol), which showed a slightly higher binding energy compared to the RV59 compound (Figure 9A–C). In addition, several interactions were identified for the ligand and protein complex, and these interactions included amino residues, a high number of conventional hydrogen bonds, van der Waals forces, carbon hydrogen bonds, Pi anions, Pi-sigma, Pi-Pi stacked, and amide Pi-stacked as shown in Table 4.

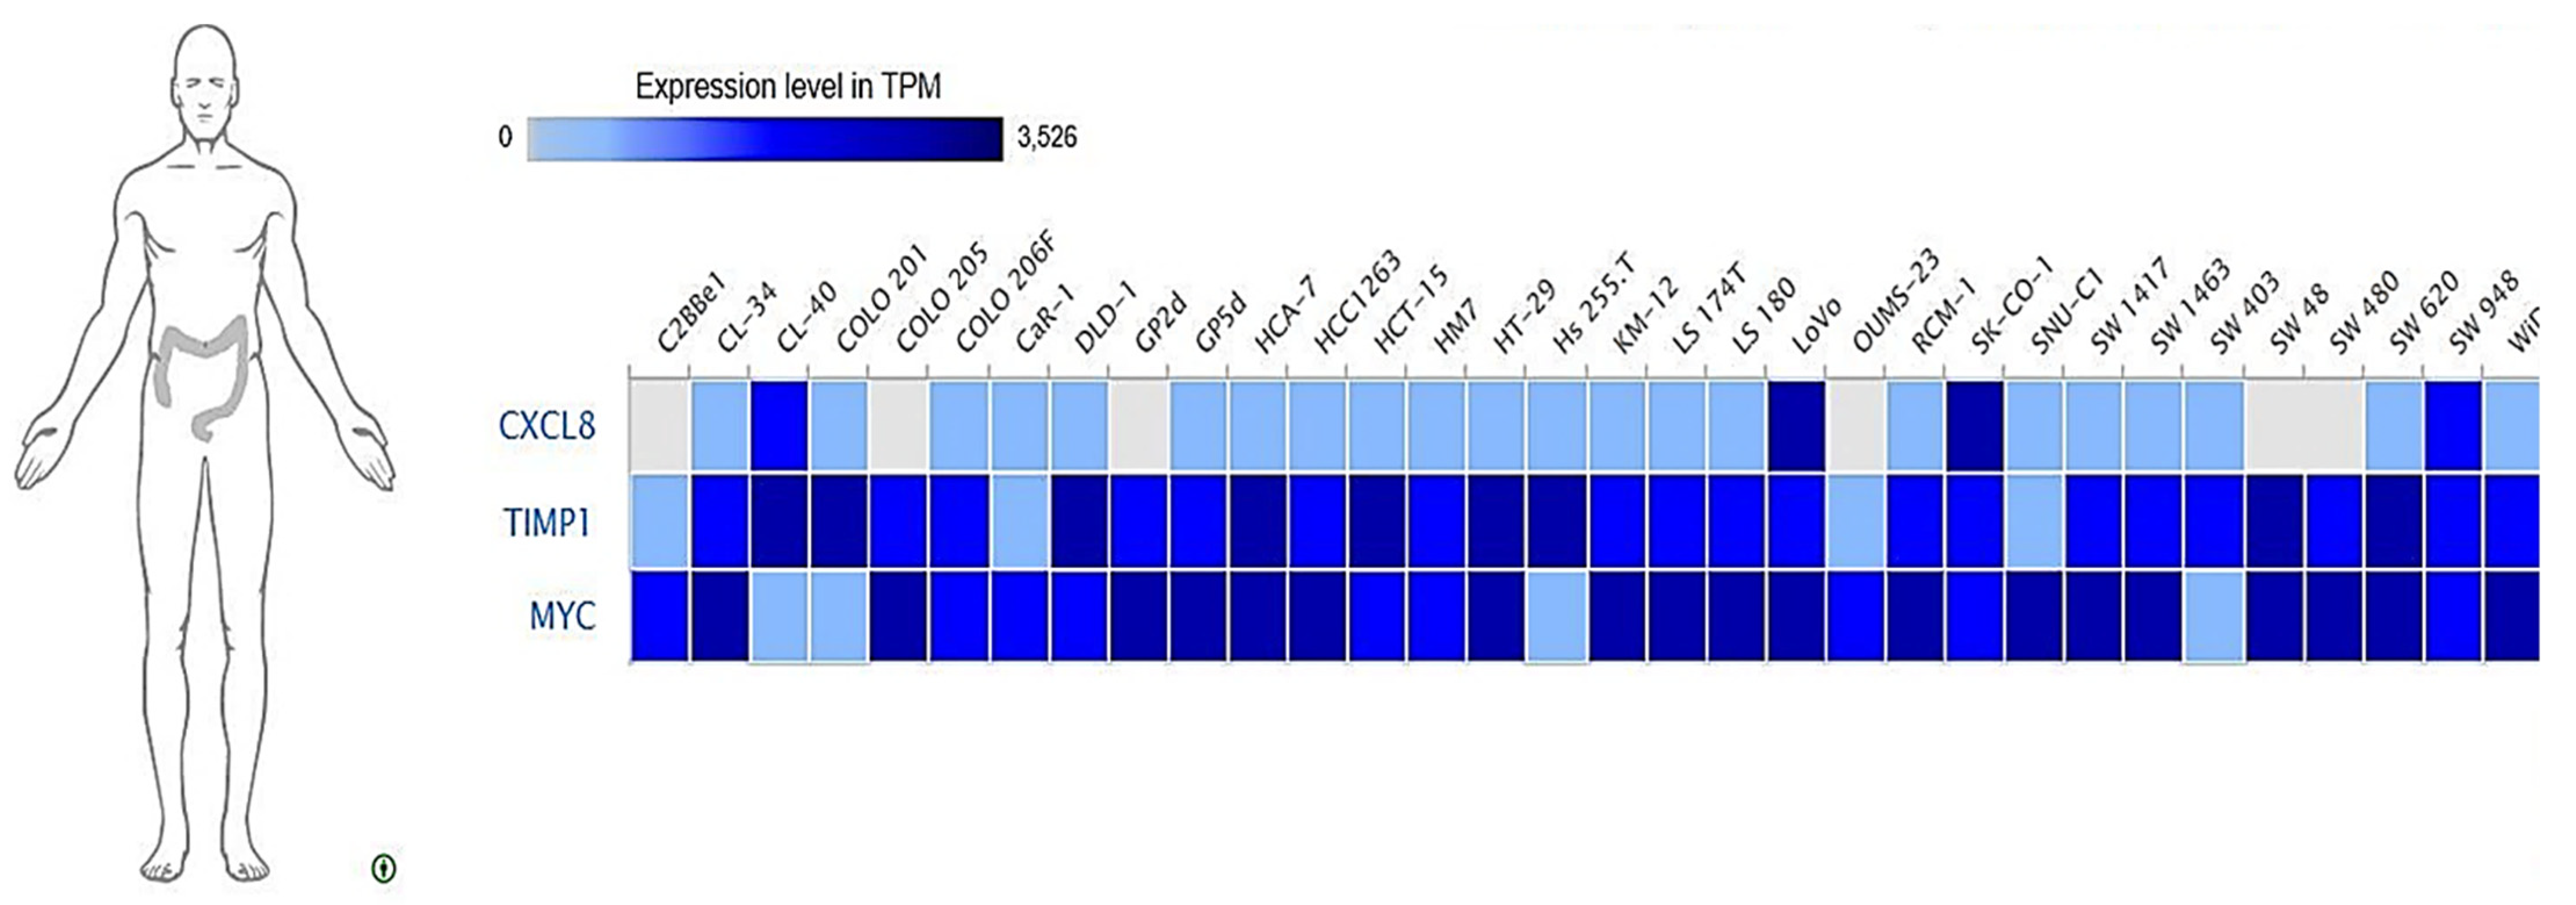
3.10. Expressions of MYC/CXCL8/TIMP1 Oncogenes across Colon Cancer Cell Lines

To identify expression levels of the MYC/CXCL8/TIMP1 oncogenes in different CRC cell lines, we explored the expression database web tool, https://www.ebi.ac.uk/gxa/home [64]. We used the RNA-sequence data of 675 commonly used human cancer cell lines for each gene. Results showed increased expression levels of the MYC/CXCL8/TIMP1 oncogenes across colon cancer cell lines (Figure 10).

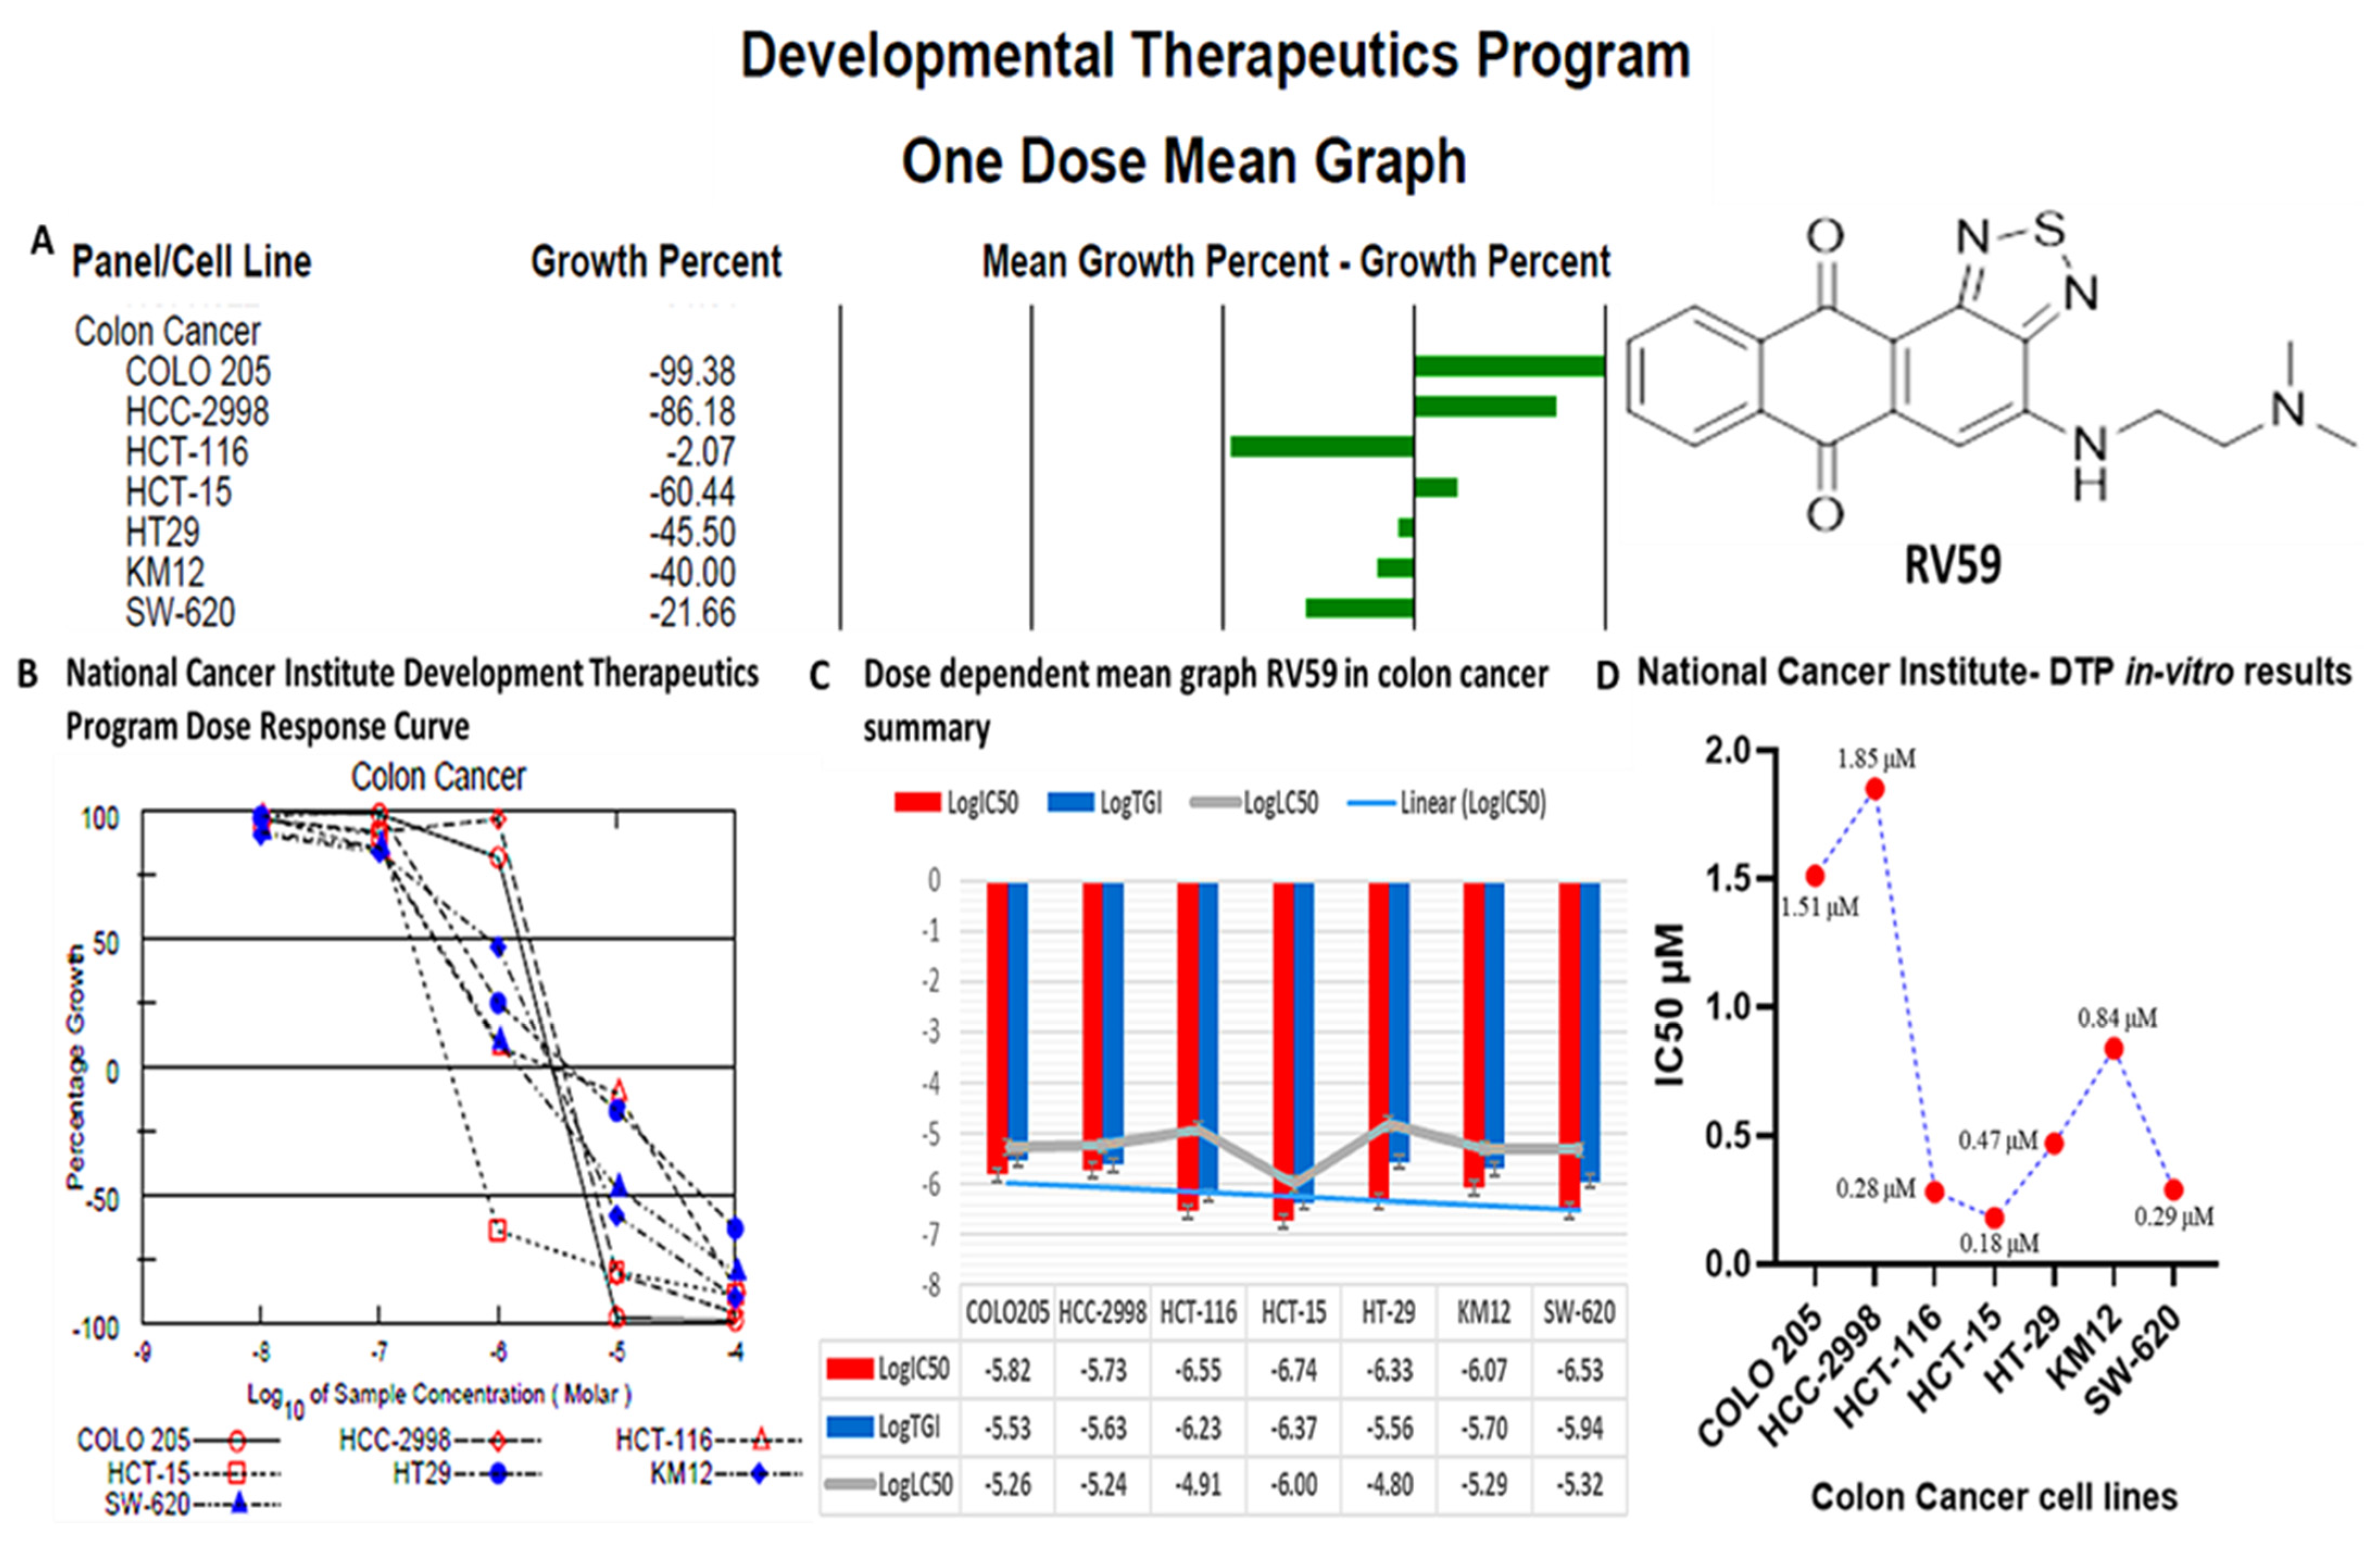
3.11. RV59 Displayed Anti-Proliferative and Cytotoxic Effects in NCI60 Human Colon Cancer Cell Lines

RV59 showed anticancer activities against NCI human colon cancer cell lines (Figure 10). A single-dose treatment was administered at an initial dose of 10 μM, growth percentages revealed RV59 cytotoxic effects on the COLO 205, HCC-2998, and HCT-15 cell lines, and anti-proliferative activities on the HCT-116, HT29, KM12, and SW-620 cell lines (Figure 11A). Since the compound showed potential anticancer effects at an initial dose of 10 μM, further dose-dependent investigations of the compound were performed to measure GI50, tumor growth inhibition (TGI), and 50% lethal concentration (LC50) values. Results showed potential anti-proliferative effects in a dose-dependent manner (Figure 11B,C). Moreover, the in vitro IC50 results ranged 0.18–1.85 μM in the colon cancer cell lines, with HCT-15 being the more responsive at 0.18 μM, followed by HCT116 (at 0.28 μM, SW-620 at 0.29 μM, HT-29 at 0.47 μM, KW12 at 0.84 μM, and COLO 205 (at 1.15 μM, with HCC-2998 at 1.85 μM showing the least responsiveness compared to the aforementioned cell lines (Figure 11D).

4. Discussion

Advanced chemotherapy and targeted therapies still offer limited prolonged overall survival in CRC patients. One of the main causes of poor prognoses in patients is resistance to these therapeutic interventions [65]. Moreover, the molecular mechanisms through which cancer escapes chemotherapy and targeted therapy still remain elusive, mainly due to colon cancer’s heterogenic properties. CRC is often diagnosed at a later, advanced stage, with distant metastasis present in most cases [66]. Therefore, there is a need for novel and effective targeted therapies, to improve patient’s clinical outcomes and resistance in CRC patients. Protein kinases dysregulations have been reported to drive cancer, due to its association with genetic alterations, such as overexpression and mutations. Therefore, they have become pharmaceutical targets over the years [67]. RV59 is a novel small molecule derived in our lab from EGFR inhibitor osimertinib [68]. Our previous studies evaluated the anticancer activities of 20 nitrogen-substituted anthra[1,2-c][1,2,5]thiadiazole-6,11-dione derivatives, on cytoplasmic nuclear location sequence (NLS)-mutated Nrf2-transfecte, which promotes CRC tumor invasion and resistance to 5-flurouracil (5-FU) chemotherapy. Among those 20 compounds, RV59 was more effective, overcame cNrf2-mediated chemoresistance, and suppressed tumor growth in colon cancer cells [69]. However, PK and toxicity analyses were not performed in that study. Further, in another study from our lab, we showed that RV59, exhibited a broad-spectrum of cytotoxicity against various cancer cells, and interestingly, the compound displayed less cytotoxic effects as compared to chemotherapeutic agent, doxorubicin in normal tissues [70].
Herein, we used a bioinformatics simulation study to further expand on that previous study; however, the present study focused more on identifying and validating oncogenes associated with chemoresistance and alteration of oxaliplatin or doxorubicin treatment responses in advanced CRC. Studies showed that accumulation of tumor recurrence from cancer stem cells (CSCs), and metastasis often occur post-treatment in CRC, which leads to therapeutic resistance [65,71]. Using computer-based PASS and DTP-COMPARE drug target predictive tools, we identified MYC/CXCL8/TIMP1 as target genes for RV59; in addition, an analysis of the results also predicted that all probability active (Pa) values were greater that all predicted probability inactive (Pi) values, indicating the inhibitory or antagonistic activities of RV59 on MYC and CXCL8, among other identified activities. In the early stages of drug discovery and development, the disposition of a compound is assessed in terms of its absorption, distribution, metabolism, and excretion (ADME), with the final goal of identifying potential effectiveness of a medicine for patients [72]. After assessing the ADME of RV59, bioavailability radar displaying all six physical properties of the compound, showed that the compound successfully met the minimum requirements of drug-likeness, with an Mw of 352.41 g/mol, flexibility (rotations = 4), solubility (log S (ESOL) = −3.74), saturation (fraction Csp3 = 0.22), polarity (TPSA = 103.43 Å2), and lipophilicity (XLOGP3 = 2.76), and all the values were within recommended values as described in Figure 1. The compound also passed the criteria for Ghose, Veber (GSK), Egan (Pharmacia), and muegge and the Lipinski (Pfizer) rule-of-five of drug likeness and drug discovery. The bioavailability of the compound based on GIA indicated a score of 0.55 (55%), which indicates acceptable PK properties. Moreover, we explored the UALCAN bioinformatics tool, and validated increased expressions of MYC/CXCL8/TIMP1 oncogenic signatures in CRC primary tumors and compared them to adjacent normal samples. The genes also exhibited positive correlations among each other with p < 0.05 indicating statistical significance.
In a further analysis, we determined interactions of the MYC/CXCL8/TIMP1 oncogenes at the protein level. Interestingly, the PPI network analysis from two independent databases showed interactions of all of the proteins with each other, as well as enrichment in GO terms, including biological processes and biological pathways involved in CRC, with p < 0.05 indicating statistical significance (Figure 4). MYC plays significant roles in tumorigenesis and therapeutic resistance [15]. In 2019, Han et al. demonstrated that MYC induces immunogenic cell death of tumor cells, which leads to increased T cell infiltration and upregulation of the PD-L1 immune checkpoint protein in the TME [73].
Additional studies also showed that inhibition of programmed cell death protein 1 (PD1) by pembrolizumab enhanced regulation of cytotoxic T-cell tumoricidal activities, which ultimately leads to increased expression levels of tumor-enhanced CXCL8, which subsequently induces infiltration of tumor-associated macrophages (M2) in the immune system [74,75]. Others showed that the TIMP1 gene derived from tumor cells creates a metastatic niche, to which circulating tumor cells cling and promote CRC metastasis [76]. Hence, these finding validated the potential contribution of the MYC/CXCL8/TIMP1 oncogenic signatures to chemoresistance and resistance to targeted treatment. To identify associations of MYC/CXCL8/TIMP1 gene expressions with selected immune cells in CRC, we applied a correlation analysis between the above-mentioned oncogenes with immune infiltration cells (CD8+ and macrophages), where markers were adjusted by purity. As expected, MYC/CXCL8/TIMP1 gene expression levels displayed associations with tumor purity and were positively correlated with infiltrating levels of CD8+ T cells and macrophages (p < 0.05), and were correlated with the abundances of tumor infiltrates including CD8+ T cells, macrophages and DCs in CRC (Figure 6).
We further predicted protein-ligand interactions using molecular docking between RV59 and the MYC/CXCL8/TIMP1 gene complex, and discovered that RV59 displayed strong binding energies to MYC (−7.6 kcal/mol), CXCL8 (−7.7 kcal/mol), and TIMP1 (−6.9 kcal/mol), and short binding distances with these protein (receptors): MYC (2.49 Å), CXCL8 (2.03 Å), and TIMP1 (2.51, 3.14, 3.4, and 3.29 Å). These results were compared to standard inhibitors of MYC (vorinostat), CXCL8 (reparixin), and TIMP1 (ilomastat). Interestingly, the inhibitors exhibited lower binding energies for MYC (−6.3 kcal/mol) and CXCL8 (−6.3 kcal/mol), with the exception of TIMP1 (7.4 kcal/mol) compared to RV59. Moreover, RV59 showed anticancer activities against NCI human colon cancer cell lines with single-dose treatment of 10 μM, toward the COLO 205, HCC-2998, and HCT-15 cell lines, and anti-proliferative activities toward the HCT-116, HT29, KM12, and SW-620 cell lines, in dose-dependent manners. measured Results of measuring the GI50, TGI, and LC50 levels showed potential anti-proliferative effects in dose-dependent manners (Figure 11B,C). Moreover, the in vitro IC50 results ranged 0.18–1.85 μM on colon cancer cell lines, with HCT-15 cells being the most responsive at 0.18 μM, followed by HCT116 at 0.28 μM, SW-620 at 0.29 μM, HT-29 at 0.47 μM, KW12 at 0.84 μM, and COLO 205 at 1.15 μM, with HCC-2998 cells at 1.85 μM showing the least responsiveness compared to the aforementioned cell lines. This suggests that RV59 exhibits drug-like characteristics, and is a potential oral drug candidate. In summary, the findings from this study revealed the anticancer activities of RV59 in CRC, and highlight additional avenues for RV59 as a potential treatment for CRC chemotherapy and resistance to targeted therapy, particularly by targeting the MYC/CXCL8/TIMP1 signaling pathway. The compound is currently being assessed for its therapeutic potential effectiveness in CRC and breast cancer both in vitro and in vivo in our laboratory.

5. Conclusions

In conclusion, we revealed the anticancer activities of RV59 against NCI human colon cancer cell lines both as a single dose and dose-dependent treatment, and also demonstrated the MYC/CXCL8/TIMP1 signaling pathway, which is responsible for resistance to both chemotherapies and targeted therapies, to be a potential RV59 drug target. Moreover, the in silico molecular docking study exhibited putative binding affinities of RV59 with the above-mentioned oncogenes, which were even higher than the standard inhibitors of these genes. Currently in our lab, there are ongoing cell and animal experiments to evaluate the therapeutic effectiveness of RV59 in CRC and breast cancer.

Author Contributions

N.M. wrote the manuscript; T.-H.H. and Y.-J.H. oversaw the study; H.-S.H. and A.T.H.W. designed and oversaw the study. All authors have read and agreed to the published version of the manuscript.

Funding

Hsu-Shan Huang is funded by the Ministry of Science and Technology (MOST 109-2113-M-038-003 and MOST 110-2314-B-038-120). Alexander TH Wu is funded by the Ministry of Education, Taipei Medical University (DP2-110-21121-03-C-09 and DP2-110-21121-01-H-03-03). Tse-Hung Huang is funded by CMRPG2H0121 and CMRPG2H0362 research grants.

Data Availability Statement

The datasets generated and/or analyzed in this study are available on reasonable request.

Acknowledgments

The authors thank the NCI Developmental Therapeutics Program (DTP) for the 60-cancer-cell-line screening of selected compounds described in this paper, funded by the National Cancer Institute, National Institutes of Health (NIH-NCI). The present study was supported by grants (MOST110-2314-B-038-120) from the Ministry of Science and Technology, Taiwan. We also acknowledged the editing services provided by the Office of Research and Development, Taipei Medical University.

Conflicts of Interest

The authors declare no conflict of interest.

References

  1. Böckelman, C.; Beilmann-Lehtonen, I.; Kaprio, T.; Koskensalo, S.; Tervahartiala, T.; Mustonen, H.; Stenman, U.H.; Sorsa, T.; Haglund, C. Serum MMP-8 and TIMP-1 predict prognosis in colorectal cancer. BMC Cancer 2018, 18, 679. [Google Scholar] [CrossRef]
  2. Bray, F.; Ferlay, J.; Soerjomataram, I.; Siegel, R.L.; Torre, L.A.; Jemal, A. Global cancer statistics 2018: GLOBOCAN estimates of incidence and mortality worldwide for 36 cancers in 185 countries. CA Cancer J. Clin. 2018, 68, 394–424. [Google Scholar] [CrossRef] [Green Version]
  3. Sung, H.; Ferlay, J.; Siegel, R.L.; Laversanne, M.; Soerjomataram, I.; Jemal, A.; Bray, F. Global Cancer Statistics 2020: GLOBOCAN Estimates of Incidence and Mortality Worldwide for 36 Cancers in 185 Countries. CA Cancer J. Clin. 2021, 71, 209–249. [Google Scholar] [CrossRef] [PubMed]
  4. Łukaszewicz-Zając, M.; Mroczko, B. Circulating Biomarkers of Colorectal Cancer (CRC)-Their Utility in Diagnosis and Prognosis. J. Clin. Med. 2021, 10, 2391. [Google Scholar] [CrossRef] [PubMed]
  5. Shibutani, M.; Maeda, K.; Nagahara, H.; Fukuoka, T.; Iseki, Y.; Matsutani, S.; Kashiwagi, S.; Tanaka, H.; Hirakawa, K.; Ohira, M. Tumor-infiltrating Lymphocytes Predict the Chemotherapeutic Outcomes in Patients with Stage IV Colorectal Cancer. In Vivo 2018, 32, 151–158. [Google Scholar] [CrossRef]
  6. Ganesh, K.; Stadler, Z.K.; Cercek, A.; Mendelsohn, R.B.; Shia, J.; Segal, N.H.; Diaz, L.A., Jr. Immunotherapy in colorectal cancer: Rationale, challenges and potential. Nat. Rev. Gastroenterol. Hepatol. 2019, 16, 361–375. [Google Scholar] [CrossRef]
  7. Marcuello, M.; Vymetalkova, V.; Neves, R.P.L.; Duran-Sanchon, S.; Vedeld, H.M.; Tham, E.; van Dalum, G.; Flügen, G.; Garcia-Barberan, V.; Fijneman, R.J.; et al. Circulating biomarkers for early detection and clinical management of colorectal cancer. Mol. Asp. Med. 2019, 69, 107–122. [Google Scholar] [CrossRef] [PubMed]
  8. Zhang, H.L.; Wang, P.; Lu, M.Z.; Zhang, S.D.; Zheng, L. c-Myc maintains the self-renewal and chemoresistance properties of colon cancer stem cells. Oncol. Lett. 2019, 17, 4487–4493. [Google Scholar] [CrossRef] [PubMed] [Green Version]
  9. Anderson, E.C.; Hessman, C.; Levin, T.G.; Monroe, M.M.; Wong, M.H. The role of colorectal cancer stem cells in metastatic disease and therapeutic response. Cancers 2011, 3, 319–339. [Google Scholar] [CrossRef] [PubMed]
  10. Bu, Y.; Cao, D. The origin of cancer stem cells. Front. Biosci. 2012, 4, 819–830. [Google Scholar] [CrossRef] [Green Version]
  11. de Sousa e Melo, F.; Kurtova, A.V.; Harnoss, J.M.; Kljavin, N.; Hoeck, J.D.; Hung, J.; Anderson, J.E.; Storm, E.E.; Modrusan, Z.; Koeppen, H.; et al. A distinct role for Lgr5(+) stem cells in primary and metastatic colon cancer. Nature 2017, 543, 676–680. [Google Scholar] [CrossRef] [PubMed]
  12. Hwang, W.L.; Yang, M.H.; Tsai, M.L.; Lan, H.Y.; Su, S.H.; Chang, S.C.; Teng, H.W.; Yang, S.H.; Lan, Y.T.; Chiou, S.H.; et al. SNAIL regulates interleukin-8 expression, stem cell-like activity, and tumorigenicity of human colorectal carcinoma cells. Gastroenterology 2011, 141, 279–291.e5. [Google Scholar] [CrossRef] [Green Version]
  13. Bommer, G.T.; Fearon, E.R. Role of c-Myc in Apc mutant intestinal phenotype: Case closed or time for a new beginning? Cancer Cell 2007, 11, 391–394. [Google Scholar] [CrossRef] [Green Version]
  14. Takahashi, K.; Yamanaka, S. Induction of pluripotent stem cells from mouse embryonic and adult fibroblast cultures by defined factors. Cell 2006, 126, 663–676. [Google Scholar] [CrossRef] [PubMed] [Green Version]
  15. Dang, C.V. MYC on the path to cancer. Cell 2012, 149, 22–35. [Google Scholar] [CrossRef] [PubMed] [Green Version]
  16. Morin, P.J. beta-catenin signaling and cancer. Bioessays 1999, 21, 1021–1030. [Google Scholar] [CrossRef]
  17. de Sousa, E.M.F.; Colak, S.; Buikhuisen, J.; Koster, J.; Cameron, K.; de Jong, J.H.; Tuynman, J.B.; Prasetyanti, P.R.; Fessler, E.; van den Bergh, S.P.; et al. Methylation of cancer-stem-cell-associated Wnt target genes predicts poor prognosis in colorectal cancer patients. Cell Stem Cell 2011, 9, 476–485. [Google Scholar] [CrossRef] [Green Version]
  18. Casey, S.C.; Tong, L.; Li, Y.; Do, R.; Walz, S.; Fitzgerald, K.N.; Gouw, A.M.; Baylot, V.; Gütgemann, I.; Eilers, M.; et al. MYC regulates the antitumor immune response through CD47 and PD-L1. Science 2016, 352, 227–231. [Google Scholar] [CrossRef] [Green Version]
  19. Kugimiya, N.; Nishimoto, A.; Hosoyama, T.; Ueno, K.; Enoki, T.; Li, T.S.; Hamano, K. The c-MYC-ABCB5 axis plays a pivotal role in 5-fluorouracil resistance in human colon cancer cells. J. Cell Mol. Med. 2015, 19, 1569–1581. [Google Scholar] [CrossRef] [PubMed] [Green Version]
  20. Strippoli, A.; Cocomazzi, A.; Basso, M.; Cenci, T.; Ricci, R.; Pierconti, F.; Cassano, A.; Fiorentino, V.; Barone, C.; Bria, E.; et al. c-MYC Expression Is a Possible Keystone in the Colorectal Cancer Resistance to EGFR Inhibitors. Cancers 2020, 12, 638. [Google Scholar] [CrossRef] [PubMed] [Green Version]
  21. Elbadawy, M.; Usui, T.; Yamawaki, H.; Sasaki, K. Emerging Roles of C-Myc in Cancer Stem Cell-Related Signaling and Resistance to Cancer Chemotherapy: A Potential Therapeutic Target Against Colorectal Cancer. Int J. Mol. Sci. 2019, 20, 2340. [Google Scholar] [CrossRef] [Green Version]
  22. Hermeking, H.; Eick, D. Mediation of c-Myc-induced apoptosis by p53. Science 1994, 265, 2091–2093. [Google Scholar] [CrossRef]
  23. Garte, S.J. The c-myc oncogene in tumor progression. Crit. Rev. Oncog. 1993, 4, 435–449. [Google Scholar]
  24. Jung, J.H.; Jung, D.B.; Kim, H.; Lee, H.; Kang, S.E.; Srivastava, S.K.; Yun, M.; Kim, S.H. Zinc finger protein 746 promotes colorectal cancer progression via c-Myc stability mediated by glycogen synthase kinase 3β and F-box and WD repeat domain-containing 7. Oncogene 2018, 37, 3715–3728. [Google Scholar] [CrossRef] [PubMed]
  25. Wilson, A.J.; Byron, K.; Gibson, P.R. Interleukin-8 stimulates the migration of human colonic epithelial cells in vitro. Clin. Sci. 1999, 97, 385–390. [Google Scholar] [CrossRef]
  26. Kitadai, Y.; Haruma, K.; Sumii, K.; Yamamoto, S.; Ue, T.; Yokozaki, H.; Yasui, W.; Ohmoto, Y.; Kajiyama, G.; Fidler, I.J.; et al. Expression of interleukin-8 correlates with vascularity in human gastric carcinomas. Am. J. Pathol. 1998, 152, 93–100. [Google Scholar] [PubMed]
  27. Setrerrahmane, S.; Xu, H. Tumor-related interleukins: Old validated targets for new anti-cancer drug development. Mol. Cancer 2017, 16, 153. [Google Scholar] [CrossRef]
  28. Sun, L.; Wang, Q.; Chen, B.; Zhao, Y.; Shen, B.; Wang, H.; Xu, J.; Zhu, M.; Zhao, X.; Xu, C.; et al. Gastric cancer mesenchymal stem cells derived IL-8 induces PD-L1 expression in gastric cancer cells via STAT3/mTOR-c-Myc signal axis. Cell Death Dis. 2018, 9, 928. [Google Scholar] [CrossRef] [PubMed]
  29. Ha, H.; Debnath, B.; Neamati, N. Role of the CXCL8-CXCR1/2 Axis in Cancer and Inflammatory Diseases. Theranostics 2017, 7, 1543–1588. [Google Scholar] [CrossRef] [PubMed]
  30. Liu, Q.; Li, A.; Tian, Y.; Wu, J.D.; Liu, Y.; Li, T.; Chen, Y.; Han, X.; Wu, K. The CXCL8-CXCR1/2 pathways in cancer. Cytokine Growth Factor Rev. 2016, 31, 61–71. [Google Scholar] [CrossRef] [Green Version]
  31. Dabkeviciene, D.; Jonusiene, V.; Zitkute, V.; Zalyte, E.; Grigaitis, P.; Kirveliene, V.; Sasnauskiene, A. The role of interleukin-8 (CXCL8) and CXCR2 in acquired chemoresistance of human colorectal carcinoma cells HCT116. Med. Oncol. 2015, 32, 258. [Google Scholar] [CrossRef]
  32. Du, J.; He, Y.; Li, P.; Wu, W.; Chen, Y.; Ruan, H. IL-8 regulates the doxorubicin resistance of colorectal cancer cells via modulation of multidrug resistance 1 (MDR1). Cancer Chemother. Pharm. 2018, 81, 1111–1119. [Google Scholar] [CrossRef]
  33. Kobayashi, T.; Masaki, T.; Nozaki, E.; Sugiyama, M.; Nagashima, F.; Furuse, J.; Onishi, H.; Watanabe, T.; Ohkura, Y. Microarray Analysis of Gene Expression at the Tumor Front of Colon Cancer. Anticancer Res. 2015, 35, 6577–6581. [Google Scholar] [PubMed]
  34. Cheng, X.S.; Li, Y.F.; Tan, J.; Sun, B.; Xiao, Y.C.; Fang, X.B.; Zhang, X.F.; Li, Q.; Dong, J.H.; Li, M.; et al. CCL20 and CXCL8 synergize to promote progression and poor survival outcome in patients with colorectal cancer by collaborative induction of the epithelial-mesenchymal transition. Cancer Lett. 2014, 348, 77–87. [Google Scholar] [CrossRef]
  35. Xu, T.; Jing, C.; Shi, Y.; Miao, R.; Peng, L.; Kong, S.; Ma, Y.; Li, L. microRNA-20a enhances the epithelial-to-mesenchymal transition of colorectal cancer cells by modulating matrix metalloproteinases. Exp. Med. 2015, 10, 683–688. [Google Scholar] [CrossRef] [PubMed] [Green Version]
  36. Egea, V.; Zahler, S.; Rieth, N.; Neth, P.; Popp, T.; Kehe, K.; Jochum, M.; Ries, C. Tissue inhibitor of metalloproteinase-1 (TIMP-1) regulates mesenchymal stem cells through let-7f microRNA and Wnt/β-catenin signaling. Proc. Natl. Acad. Sci. USA 2012, 109, E309–E316. [Google Scholar] [CrossRef] [Green Version]
  37. Egeblad, M.; Werb, Z. New functions for the matrix metalloproteinases in cancer progression. Nat. Rev. Cancer 2002, 2, 161–174. [Google Scholar] [CrossRef] [PubMed]
  38. Sørensen, N.M.; Byström, P.; Christensen, I.J.; Berglund, A.; Nielsen, H.J.; Brünner, N.; Glimelius, B. TIMP-1 is significantly associated with objective response and survival in metastatic colorectal cancer patients receiving combination of irinotecan, 5-fluorouracil, and folinic acid. Clin. Cancer Res. 2007, 13, 4117–4122. [Google Scholar] [CrossRef] [PubMed] [Green Version]
  39. Chirco, R.; Liu, X.W.; Jung, K.K.; Kim, H.R. Novel functions of TIMPs in cell signaling. Cancer Metastasis Rev. 2006, 25, 99–113. [Google Scholar] [CrossRef] [PubMed]
  40. Lee, J.H.; Choi, J.W.; Kim, Y.S. Plasma or serum TIMP-1 is a predictor of survival outcomes in colorectal cancer: A meta-analysis. J. Gastrointest. Liver Dis. 2011, 20, 287–291. [Google Scholar]
  41. Dong, H.; Yin, H.; Zhao, C.; Cao, J.; Xu, W.; Zhang, Y. Design, Synthesis and Biological Evaluation of Novel Osimertinib-Based HDAC and EGFR Dual Inhibitors. Molecules 2019, 24, 2407. [Google Scholar] [CrossRef] [Green Version]
  42. Zhou, P.; Chen, G.; Gao, M.; Wu, J. Design, synthesis and evaluation of the osimertinib analogue (C-005) as potent EGFR inhibitor against NSCLC. Bioorg. Med. Chem. 2018, 26, 6135–6145. [Google Scholar] [CrossRef] [PubMed]
  43. Lee, Y.R.; Chen, T.C.; Lee, C.C.; Chen, C.L.; Ahmed Ali, A.A.; Tikhomirov, A.; Guh, J.H.; Yu, D.S.; Huang, H.S. Ring fusion strategy for synthesis and lead optimization of sulfur-substituted anthra[1,2-c][1,2,5]thiadiazole-6,11-dione derivatives as promising scaffold of antitumor agents. Eur. J. Med. Chem. 2015, 102, 661–676. [Google Scholar] [CrossRef] [PubMed]
  44. Pogodin, P.V.; Lagunin, A.A.; Filimonov, D.A.; Poroikov, V.V. PASS Targets: Ligand-based multi-target computational system based on a public data and naïve Bayes approach. SAR QSAR Environ. Res. 2015, 26, 783–793. [Google Scholar] [CrossRef]
  45. Shoemaker, R.H. The NCI60 human tumour cell line anticancer drug screen. Nat. Rev. Cancer 2006, 6, 813–823. [Google Scholar] [CrossRef]
  46. Lin, G.; He, X.; Ji, H.; Shi, L.; Davis, R.W.; Zhong, S. Reproducibility Probability Score--incorporating measurement variability across laboratories for gene selection. Nat. Biotechnol. 2006, 24, 1476–1477. [Google Scholar] [CrossRef]
  47. Ryan, B.M.; Zanetti, K.A.; Robles, A.I.; Schetter, A.J.; Goodman, J.; Hayes, R.B.; Huang, W.Y.; Gunter, M.J.; Yeager, M.; Burdette, L.; et al. Germline variation in NCF4, an innate immunity gene, is associated with an increased risk of colorectal cancer. Int. J. Cancer 2014, 134, 1399–1407. [Google Scholar] [CrossRef] [PubMed] [Green Version]
  48. Pek, M.; Yatim, S.; Chen, Y.; Li, J.; Gong, M.; Jiang, X.; Zhang, F.; Zheng, J.; Wu, X.; Yu, Q. Oncogenic KRAS-associated gene signature defines co-targeting of CDK4/6 and MEK as a viable therapeutic strategy in colorectal cancer. Oncogene 2017, 36, 4975–4986. [Google Scholar] [CrossRef] [PubMed]
  49. Wei, R.; Qiu, H.; Xu, J.; Mo, J.; Liu, Y.; Gui, Y.; Huang, G.; Zhang, S.; Yao, H.; Huang, X.; et al. Expression and prognostic potential of GPX1 in human cancers based on data mining. Ann. Transl. Med. 2020, 8, 124. [Google Scholar] [CrossRef] [PubMed]
  50. Najafov, J.; Najafov, A. GECO: Gene expression correlation analysis after genetic algorithm-driven deconvolution. Bioinformatics 2019, 35, 156–159. [Google Scholar] [CrossRef]
  51. von Mering, C.; Huynen, M.; Jaeggi, D.; Schmidt, S.; Bork, P.; Snel, B. STRING: A database of predicted functional associations between proteins. Nucleic Acids Res. 2003, 31, 258–261. [Google Scholar] [CrossRef]
  52. Zhou, G.; Soufan, O.; Ewald, J.; Hancock, R.E.W.; Basu, N.; Xia, J. NetworkAnalyst 3.0: A visual analytics platform for comprehensive gene expression profiling and meta-analysis. Nucleic Acids Res. 2019, 47, W234–W241. [Google Scholar] [CrossRef] [PubMed] [Green Version]
  53. Reimand, J.; Isserlin, R.; Voisin, V.; Kucera, M.; Tannus-Lopes, C.; Rostamianfar, A.; Wadi, L.; Meyer, M.; Wong, J.; Xu, C.; et al. Pathway enrichment analysis and visualization of omics data using g:Profiler, GSEA, Cytoscape and EnrichmentMap. Nat. Protoc. 2019, 14, 482–517. [Google Scholar] [CrossRef] [PubMed]
  54. Li, T.; Fan, J.; Wang, B.; Traugh, N.; Chen, Q.; Liu, J.S.; Li, B.; Liu, X.S. TIMER: A Web Server for Comprehensive Analysis of Tumor-Infiltrating Immune Cells. Cancer Res. 2017, 77, e108–e110. [Google Scholar] [CrossRef] [Green Version]
  55. Liu, C.J.; Hu, F.F.; Xia, M.X.; Han, L.; Zhang, Q.; Guo, A.Y. GSCALite: A web server for gene set cancer analysis. Bioinformatics 2018, 34, 3771–3772. [Google Scholar] [CrossRef]
  56. Morris, G.M.; Lim-Wilby, M. Molecular docking. Methods Mol. Biol. 2008, 443, 365–382. [Google Scholar] [CrossRef]
  57. Hanwell, M.D.; Curtis, D.E.; Lonie, D.C.; Vandermeersch, T.; Zurek, E.; Hutchison, G.R. Avogadro: An advanced semantic chemical editor, visualization, and analysis platform. J. Cheminform. 2012, 4, 17. [Google Scholar] [CrossRef] [PubMed] [Green Version]
  58. Temml, V.; Kaserer, T.; Kutil, Z.; Landa, P.; Vanek, T.; Schuster, D. Pharmacophore modeling for COX-1 and -2 inhibitors with LigandScout in comparison to Discovery Studio. Future Med. Chem. 2014, 6, 1869–1881. [Google Scholar] [CrossRef]
  59. Mashukova, A.; Forteza, R.; Wald, F.A.; Salas, P.J. PDK1 in apical signaling endosomes participates in the rescue of the polarity complex atypical PKC by intermediate filaments in intestinal epithelia. Mol. Biol. Cell 2012, 23, 1664–1674. [Google Scholar] [CrossRef]
  60. Mohamad Anuar, N.N.; Nor Hisam, N.S.; Liew, S.L.; Ugusman, A. Clinical Review: Navitoclax as a Pro-Apoptotic and Anti-Fibrotic Agent. Front. Pharm. 2020, 11, 564108. [Google Scholar] [CrossRef]
  61. Herrera-Martínez, M.; Orozco-Samperio, E.; Montaño, S.; Ariza-Ortega, J.A.; Flores-García, Y.; López-Contreras, L. Vorinostat as potential antiparasitic drug. Eur. Rev. Med. Pharm. Sci. 2020, 24, 7412–7419. [Google Scholar] [CrossRef]
  62. Kretzner, L.; Scuto, A.; Dino, P.M.; Kowolik, C.M.; Wu, J.; Ventura, P.; Jove, R.; Forman, S.J.; Yen, Y.; Kirschbaum, M.H. Combining histone deacetylase inhibitor vorinostat with aurora kinase inhibitors enhances lymphoma cell killing with repression of c-Myc, hTERT, and microRNA levels. Cancer Res. 2011, 71, 3912–3920. [Google Scholar] [CrossRef] [Green Version]
  63. Choi, Y.J.; Kang, M.H.; Hong, K.; Kim, J.H. Tubastatin A inhibits HDAC and Sirtuin activity rather than being a HDAC6-specific inhibitor in mouse oocytes. Aging 2019, 11, 1759–1777. [Google Scholar] [CrossRef]
  64. Papatheodorou, I.; Fonseca, N.A.; Keays, M.; Tang, Y.A.; Barrera, E.; Bazant, W.; Burke, M.; Füllgrabe, A.; Fuentes, A.M.; George, N.; et al. Expression Atlas: Gene and protein expression across multiple studies and organisms. Nucleic Acids Res. 2018, 46, D246–D251. [Google Scholar] [CrossRef] [PubMed]
  65. Van der Jeught, K.; Xu, H.C.; Li, Y.J.; Lu, X.B.; Ji, G. Drug resistance and new therapies in colorectal cancer. World J. Gastroenterol 2018, 24, 3834–3848. [Google Scholar] [CrossRef]
  66. Yaeger, R.; Kotani, D.; Mondaca, S.; Parikh, A.R.; Bando, H.; Van Seventer, E.E.; Taniguchi, H.; Zhao, H.; Thant, C.N.; de Stanchina, E.; et al. Response to Anti-EGFR Therapy in Patients with BRAF non-V600-Mutant Metastatic Colorectal Cancer. Clin. Cancer Res. 2019, 25, 7089–7097. [Google Scholar] [CrossRef] [Green Version]
  67. Roskoski, R., Jr. Properties of FDA-approved small molecule protein kinase inhibitors: A 2020 update. Pharm. Res. 2020, 152, 104609. [Google Scholar] [CrossRef]
  68. Gao, H.; Yang, Z.; Yang, X.; Rao, Y. Synthesis and evaluation of osimertinib derivatives as potent EGFR inhibitors. Bioorg. Med. Chem. 2017, 25, 4553–4559. [Google Scholar] [CrossRef]
  69. Shen, C.J.; Lin, P.L.; Lin, H.C.; Cheng, Y.W.; Huang, H.S.; Lee, H. RV-59 suppresses cytoplasmic Nrf2-mediated 5-fluorouracil resistance and tumor growth in colorectal cancer. Am. J. Cancer Res. 2019, 9, 2789–2796. [Google Scholar]
  70. Ali, A.A.A.; Lee, Y.-R.; Wu, A.T.H.; Yadav, V.K.; Yu, D.-S.; Huang, H.-S. Structure-based strategies for synthesis, lead optimization and biological evaluation of N-substituted anthra[1,2-c][1,2,5]thiadiazole-6,11-dione derivatives as potential multi-target anticancer agents. Arab. J. Chem. 2021, 14, 102884. [Google Scholar] [CrossRef]
  71. Sahin, I.H.; Akce, M.; Alese, O.; Shaib, W.; Lesinski, G.B.; El-Rayes, B.; Wu, C. Immune checkpoint inhibitors for the treatment of MSI-H/MMR-D colorectal cancer and a perspective on resistance mechanisms. Br. J. Cancer 2019, 121, 809–818. [Google Scholar] [CrossRef]
  72. Daina, A.; Michielin, O.; Zoete, V. SwissADME: A free web tool to evaluate pharmacokinetics, drug-likeness and medicinal chemistry friendliness of small molecules. Sci. Rep. 2017, 7, 42717. [Google Scholar] [CrossRef] [PubMed] [Green Version]
  73. Han, H.; Jain, A.D.; Truica, M.I.; Izquierdo-Ferrer, J.; Anker, J.F.; Lysy, B.; Sagar, V.; Luan, Y.; Chalmers, Z.R.; Unno, K.; et al. Small-Molecule MYC Inhibitors Suppress Tumor Growth and Enhance Immunotherapy. Cancer Cell 2019, 36, 483–497.e415. [Google Scholar] [CrossRef] [PubMed]
  74. Zhang, M.; Huang, L.; Ding, G.; Huang, H.; Cao, G.; Sun, X.; Lou, N.; Wei, Q.; Shen, T.; Xu, X.; et al. Interferon gamma inhibits CXCL8-CXCR2 axis mediated tumor-associated macrophages tumor trafficking and enhances anti-PD1 efficacy in pancreatic cancer. J. Immunother. Cancer 2020, 8, e000308. [Google Scholar] [CrossRef] [Green Version]
  75. Ogawa, E.; Sato, Y.; Minagawa, A.; Okuyama, R. Pathogenesis of psoriasis and development of treatment. J. Derm. 2018, 45, 264–272. [Google Scholar] [CrossRef] [Green Version]
  76. Seubert, B.; Grünwald, B.; Kobuch, J.; Cui, H.; Schelter, F.; Schaten, S.; Siveke, J.T.; Lim, N.H.; Nagase, H.; Simonavicius, N.; et al. Tissue inhibitor of metalloproteinases (TIMP)-1 creates a premetastatic niche in the liver through SDF-1/CXCR4-dependent neutrophil recruitment in mice. Hepatology 2015, 61, 238–248. [Google Scholar] [CrossRef]
Figure 1. RV59 met the drug-likeness requirements. (A) RV59 small molecule, derivative of EGFR inhibitor (B) osimertinib (CID: 71496458). (C) Bioavailability radar displaying all six drug likeness physical properties of RV59; Mw of 352.41 g/mol, flexibility (rotations = 4), solubility (log S (ESOL) = −3.74), saturation (frac Table 3 = 0.22), polarity (TPSA = 103.43 Å2), and lipophilicity (XLOGP3 = 2.76).
Cells 10 01970 g001
Figure 2. Identification of differentially expressed genes (DEGs) from the GSE41328, GSE44861, and GSE74602 microarray datasets. (A) Heat map and Venn diagram of 85 selected overlapping DEGs. (BD) Volcano plots of DEGs from the three datasets with red and blue dots respectively representing upregulated and downregulated genes, with p < 0.05 and |logFC| ≥ 1 statistically significant between normal colon tissues and tumor tissues. (EG) Expression density curve showing that expressions of the three databases ranged 0–16. Expression values of gene data in GSE41328 and GSE74602 were concentrated around 5 following standardization.
Cells 10 01970 g002
Figure 3. Increased expression levels of MYC/CXCL8/TIMP1 signatures were associated with poor clinical outcomes in colon cancer. (A) MYC, (B) TIMP1, and (C) MYC expression levels in primary tumors compared to normal tissues, with p < 0.05 considered statistically significant. Correlation analysis showing positive correlations of (D) MYC with CXCL8, (E) MYC with TIMP1, and (F) TIMP1 with CXCL8. Positive Pearson correlation coefficients and p < 0.05 indicated statistical significance.
Cells 10 01970 g003
Figure 4. Protein−protein interactions displayed co−expression in the MYC/CXCL8/TIMP1 network. (A,B) Interactive networks based on gene co-expression, co-localization, genetic interactions, and various pathways involved within the network. In short, we identified interactions of CXCL8 with MYC, TIMP1, MMP9, and ACKR; of MYC with CXCL8, TIMP1, MMP9, CDK4, CCND1, RIOX2, BCAT, and DDX18; and of TIMP1 with MYC, CXCL8, MMP9, CCNA2, JUND, and STAT3. (C,D) Enrichment of gene ontology (GO) including biological processes and biological pathways involved in colorectal cancer, with the criterion set to p < 0.05 as statistically significant.
Cells 10 01970 g004
Figure 5. MYC/CXCL8/TIMP1 oncogenes co-occurred and contributed to functional relationships. (A) Signaling network analysis, showing that co-expressions of the MYC, IL10, TP53, CXCL8, TIMP1, and CDK2 genes were more enriched. (B) KEGG pathway enrichment analysis showed that co-expressed genes exhibited enrichment in the thyroid hormone signaling pathway, bladder cancer, cellular senescence, cell cycle, and HTLC-1 infections.
Cells 10 01970 g005
Figure 6. MYC/CXCL8/TIMP1 expressions correlated with immune infiltrating cells in (COAD). (A) MYC, (B) CXLC8, and (C) TIMP1 expression levels displayed associations with tumor purity and were positively correlated with infiltrating levels of CD8+ T cells and macrophages. p < 0.05 was considered statistically significant. (D) MYC, (E) CXLC8, and (F) TIMP1 expressions were correlated with abundances of tumor infiltrates including CD8+ T cells, macrophages, and dendritic cells in colon cancer. Red represents significant positive correlations with high amplification, while blue represents negative correlations. The infiltration level was compared to the normal level using a two-sided Wilcoxon rank-sum test. p-value Significant Codes: 0 ≤ *** < 0.001 ≤ ** < 0.01 ≤ * < 0.05 ≤ . < 0.1.
Cells 10 01970 g006
Figure 7. Drug sensitivity of MYC/CXCL8/TIMP1 oncogenes from GSCA. The figures show the correlation between genomics of drug sensitivity in cancer (GDSC) from FDA approved drugs. The positive Spearman correlation coefficient (orange bubbles), indicates that increased gene expression level is resistant to the drug, as compared to negative correlation shown in (blue), which indicates the sensitivity of the drug.
Cells 10 01970 g007
Figure 8. Molecular docking profiles of RV59 with the MYC/CXCL8/TIMP1 oncogenic signatures. (A) 3D representation showing strong binding affinities of RV59 with MYC at −7.6 kcal/mol, CXCL8 at −7.7 kcal/mol, and TIMP1 at −6.9 kcal/mol. (B) 2D visualization of docking analysis of RV59 (ligand) displaying interactions between active side residues through conventional hydrogen bonding (green) with LYS944 for MYC; LYS48 for CXCL8; and PHE132, TYR99, GLU118, and ARG134 for TIMP1. Short binding distances were also shown with the protein (receptors), MYC (2.49 Å), CXCL8 (2.03 Å), and TIMP1 (2.51, 3.14, 3.4, and 3.29 Å). Results were further stabilized by other interactions, including high amino acid residues, van der Waals forces, carbon-hydrogen bonds, Pi-anions, Pi-sigma, Pi-Pi stacked, and amide Pi-stacked as shown in the accompanying Table 4.
Cells 10 01970 g008
Figure 9. Docking profiles of the MYC/CXCL8/TIMP1 oncogenes in complex with their respective inhibitors of vorinostat, reparixin, and ilomastat. (A) MYC-vorinostat complex displaying conventional hydrogen bonding with Gibbs free energy of 2.87 kcal/mol. (B) CXCL8-reparixin complex showing no conventional hydrogen bonding (green) and no putative binding energies. (C) TIMP1-ilomastat complex showing conventional hydrogen bonding with binding energies of 1.96 and 2.27 kcal/mol. These results suggest that RV59 displayed a more-interactive property with MYC/CXCL8/TIMP1 oncogenic signatures compared to their standard inhibitors. Results were further stabilized by other interactions, including high amino acid residues, van der Waals forces, carbon hydrogen bonds, Pi-anions, Pi-sigma, Pi-Pi stacked, and amide Pi-stacked as shown in the accompanying Table 4.
Cells 10 01970 g009
Figure 10. Shows increased expressions of MYC/CXCL8/TIMP1 oncogenic signatures across a panel of colon cancer cell lines.
Cells 10 01970 g010
Figure 11. RV59 displayed anti-proliferative and cytotoxic effects in NC-I60 human colon cancer cell lines. (A) A single-dose treatment administered at 10 μM, revealed growth percentage cytotoxic effects of RV59 on the COLO 205, HCC-2998, and HCT-15 cell lines, and anti-proliferative activities on the HCT-116, HT29, KM12, and SW-620 cell lines. (B,C) Dose-dependent responses of colon cancer cell lines evaluated using the 50% growth inhibition (GI50), tumor growth inhibition (TGI), and 50% lethal concentration (LC50). (D) In vitro IC50 results ranged 0.18–1.85 μM on colon cancer cell lines, with HCT-15 being the most responsive at 0.18 μM, followed by HCT116 at 0.28 μM, SW-620 at 0.29 μM, HT-29 at 0.47 μM, KW12 (0.84 μM), and COLO 205 at 1.15 μM, with HCC-2998 showing the least responsiveness compared to the aforementioned cell lines at 1.85 μM.
Cells 10 01970 g011
Table 1. Correlations of RV59 with NCI synthetic compounds and standard anticancer agents that share similar anticancer fingerprints and mechanisms.
NCI-Synthetic Compounds NCI-Standard Agents ArrayCGH-Gray
RankrCCLCTarget DescriptorrCCLCTarget DescriptorrCCLCTarget Descriptor
10.6503-Nitro-5-Formylisoxazole0.5158Trimetrexate0.2757MET
20.5858CI.497000.4959Methotrexate0.2757CDK4
30.5657Tryptanthrin0.4658Dichloroali lawsone0.255YES1
40.5558Tolonium Chloride0.46585HP0.1853DRD3
50.5457Metoprine (USAN)0.4659Cyclocytidine0.1355TP53
60.5445Bafilomycin Deriv0.4259Thioguanine0.1355WNT1
70.5353Brilliant cresyl blue0.4158Hycanthone0.1155MYC
80.5246Bafilomycin Antibiotic0.445Tetraplatin0.1157AKT1
90.5241Lapachol0.458Cytosine arabinoside0.156ABR
100.5158Piroctone olamine0.3858Pyrazofurin0.156CCND1
r, Pearson’s correlation coefficient values range from −1 to +1 (the higher the positive number, the more positive correlation); CCLC, common cell lines count.
Table 2. Prediction of Biological Activity Spectra (PASS) of the RV59 compound.
PaPiActivity
0.4770.029MYC inhibitor
0.3750.166Catenin beta inhibitor
0.3020.139MAP kinase stimulant
0.2380.086Antineoplastic (colon cancer)
0.1130.058Protein kinase (CK1) inhibitor
0.2680.227MAP kinase 8 inhibitor
0.2100.174Transcription factor NF kappa A inhibitor
0.1430.110Protein kinase (CK1) delta inhibitor
0.1360.109Acetylcholine M2 receptor antagonist
0.1460.134Chemokine (C-X-C motif) ligand 8 (CXCL8) antagonist
Pa > Pi, Pa, probability to be active; Pi, probability to be inactive.
Table 3. Pharmacokinetics, drug-likeness, and medicinal chemistry of RV59.
PharmacokineticsGI Absorption (High)BBB (Low)
Drug-likeness (Yes to all)Lipinski, Ghose, Veber, Egan, Muegge
Bioavailability score55%
Medical ChemistrySynthetic accessibility:2.95
Pharmacokinetics displayed high gastrointestinal absorptivity (GIA) and low blood-brain barrier (BBB) permeability; drug-likeness, the compound passed all the criteria for Ghose, Veber (GSK), Egan (Pharmacia), and muegge, and the Lipinski (Pfizer) rule-of-five of drug likeness and drug discovery. The bioavailability of the compound based on GIA indicated a score of 0.55 (55%) and synthetic accessibility of 2.95 evaluated according to the range from 1 (easy to make) to 10 (difficult to make).
Table 4. Analytical summary table showing interactions of RV59 with the MYC/CXCL8/TIMP1 oncogenic signatures compared the standard inhibitors of these genes.
RV59Standard Inhibitotrs
RV59-MYC Complex
(ΔG = −7.6 Kcal/mol)
Vorinostat-MYC Complex
(ΔG = −6.3 Kcal/mol)
Type of interactions and number of bondsdistance of interacting
Amino acids
Type of interactions and number of bondsdistance of interacting
Amino acid
Conventional Hydrogen bond (1)LYS944 (2.49 Å)Conventional Hydrogen bond (1)SER (2.87Å)
Pi sigmaLEU217Van der Waals forcesLEU94, SER221, LUE225, LYS213, ASP220, VAL940
Pi-pi stackedHIS217AlkylARG214, LYS944
Pi-AlkylARG214,LYS213
RV59-CXCL8 Complex
(ΔG = −7.7 Kcal/mol)
Reparixinx-CXCL8 Complex
(ΔG = −6.3 Kcal/mol)
Type of interactions and number of bondsdistance of interacting
Amino acids
Type of interactions and number of bondsdistance of interacting
Amino acids
Conventional Hydrogen bond (1)CYS47 (2.03 Å)Van der Waals forcesASP43, ARG45
Carbon hydrogen bondGLU46Pi-pi stackedPHE19
Pi-cationLYS9AlkylLEU41, TYR11
Pi-AlkylLEU47Pi-AlkylLEU47, PHE15
RV59-TIMP1 Complex
(ΔG = −6.9 Kcal/mol)
Ilomastat-TIMP1 Complex
(ΔG = −7.4 Kcal/mol)
Type of interactions and number of bondsdistance of interacting
Amino acids
Type of interactions and number of bondsdistance of interacting Amino acids
Conventional Hydrogen bond (4)PHE132 (3.29 Å),
TRY99 (3.41 Å),
GLU118 (3.4 Å),
ARG134 (2.51 Å)
Conventional Hydrogen bond (2)ARG134, TYR136
Carbon hydrogen bondSER133Van der WaalsTHR131, TYR99, GLU118, ASP114, GLU125, LYS122
Pi-cationSER115Carbon hydrogen bondPHE132
Pi-AlkylPHE132Pi-AnionGLU118
Publisher’s Note: MDPI stays neutral with regard to jurisdictional claims in published maps and institutional affiliations.

