
β-(1→4)-Mannobiose Acts as an Immunostimulatory Molecule in Murine Dendritic Cells by Binding the TLR4/MD-2 Complex

 , and
, and 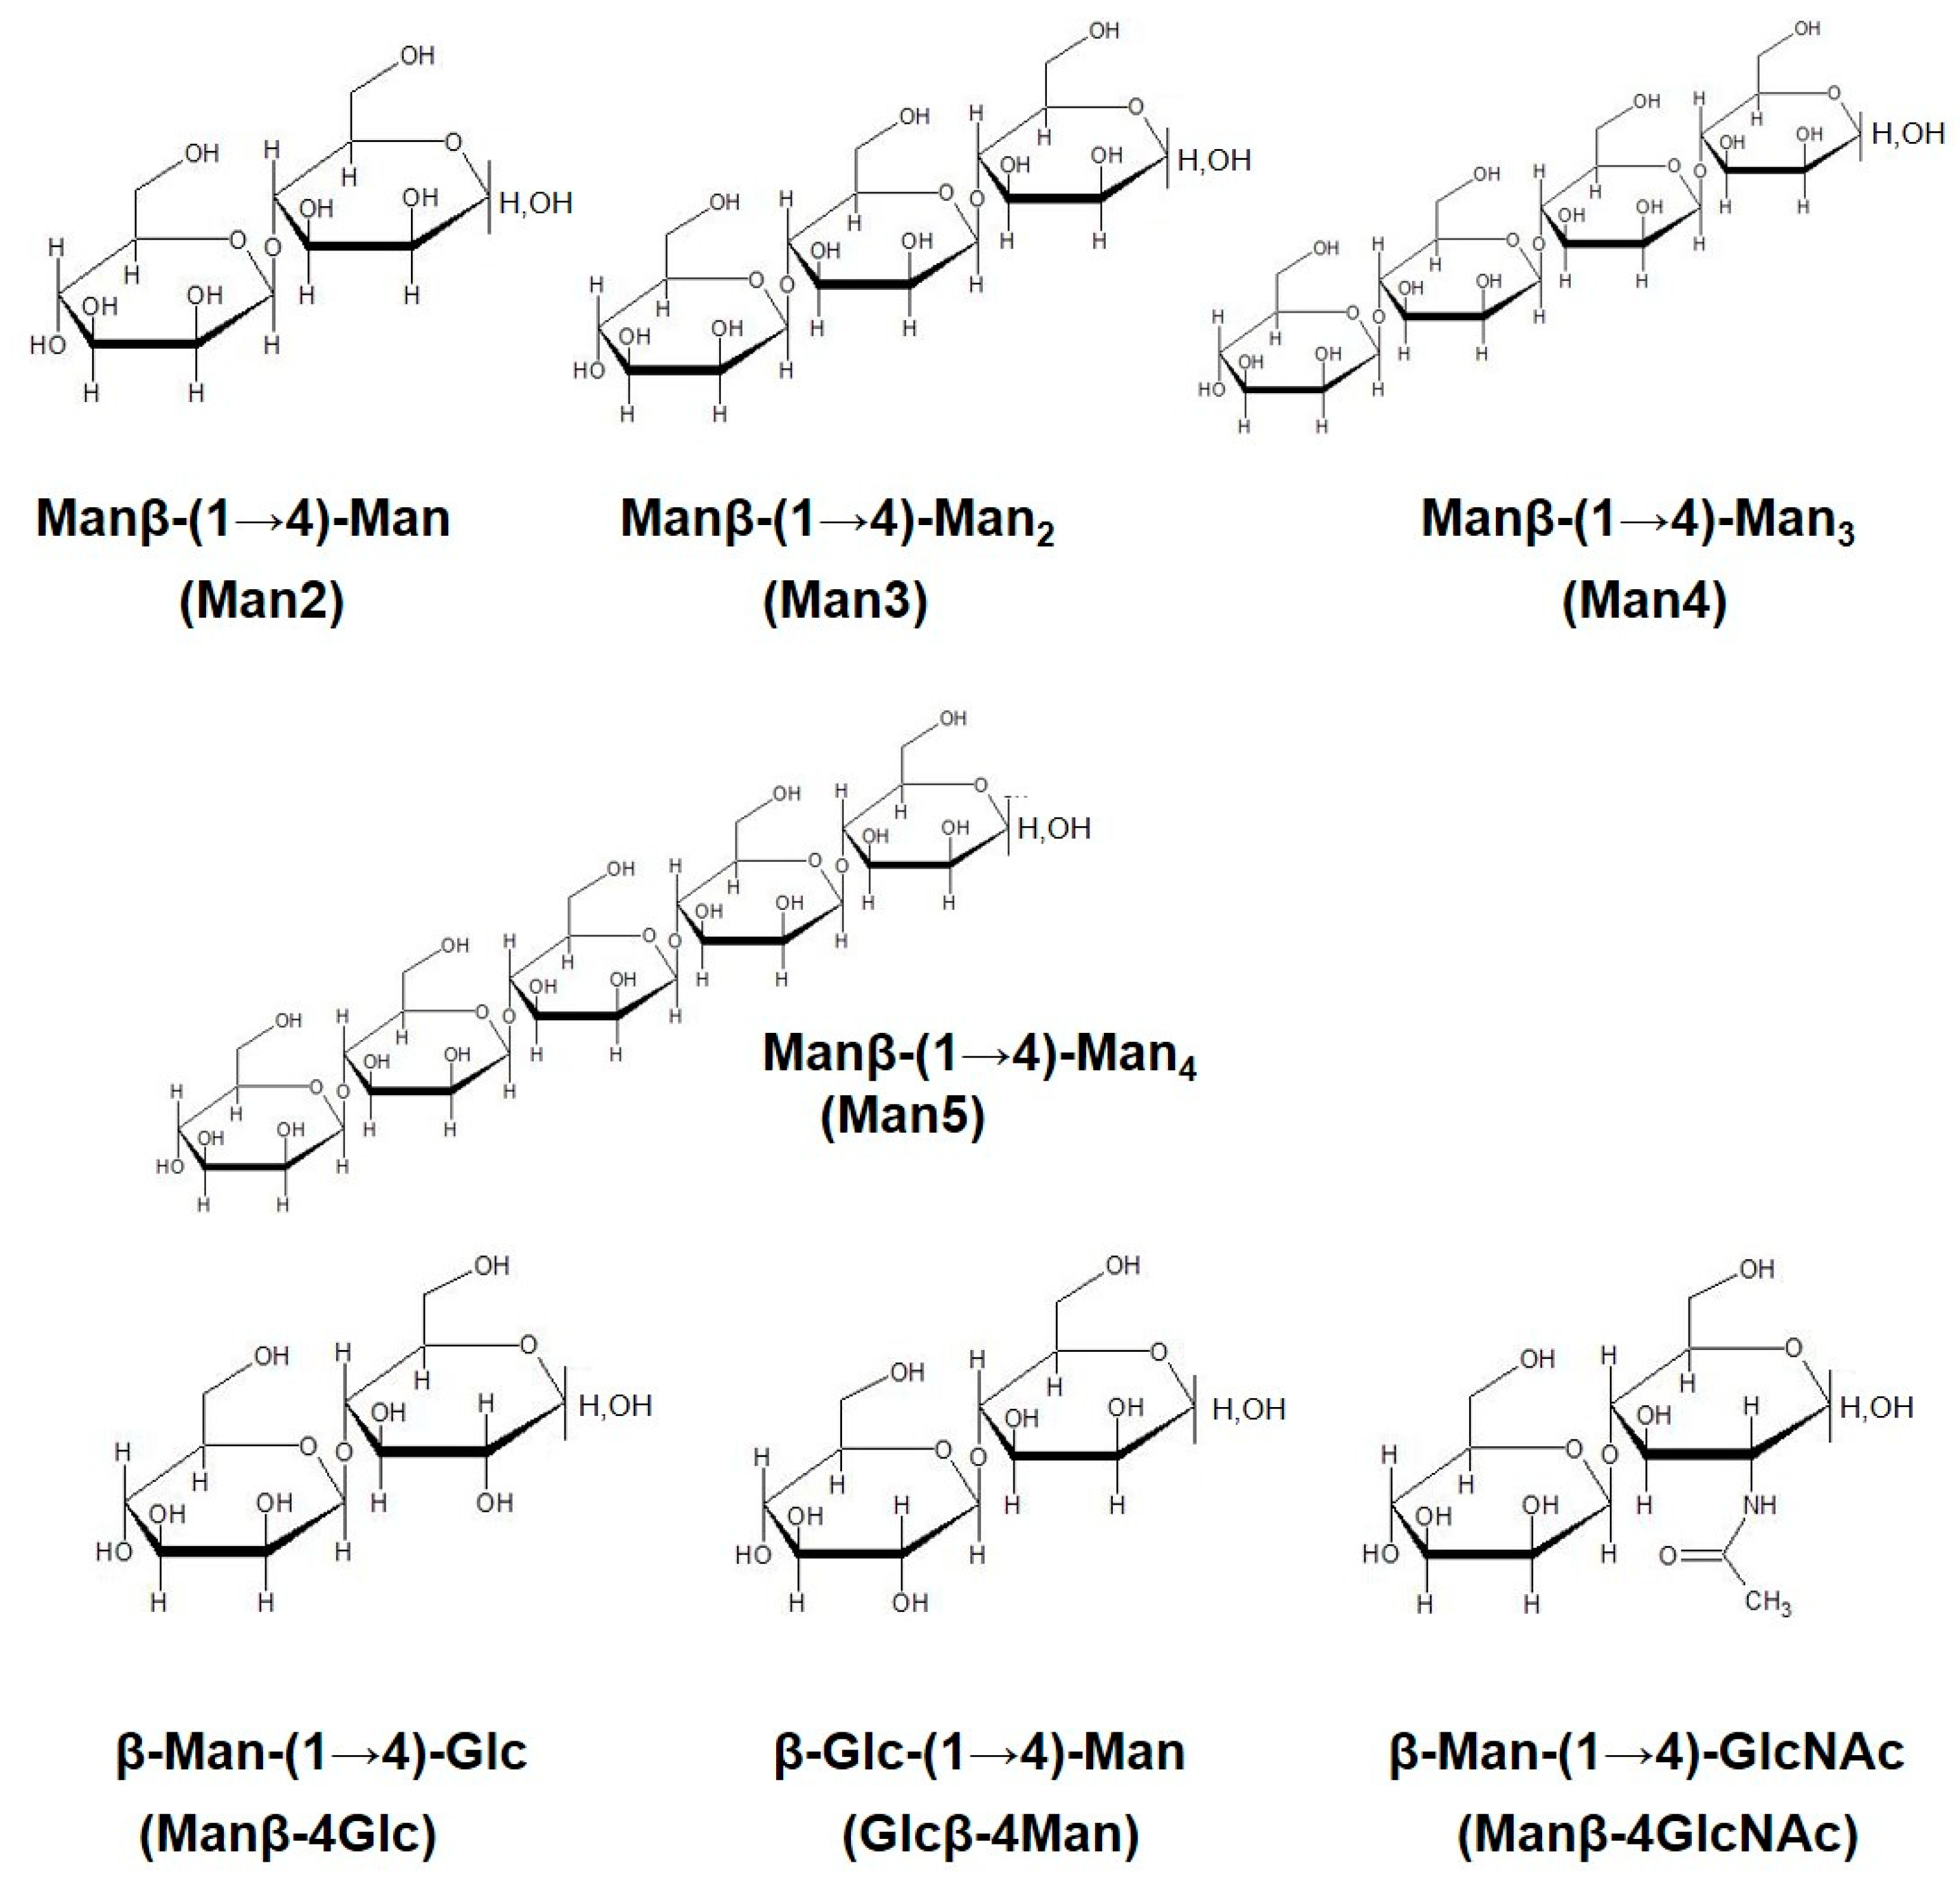
Abstract
:1. Introduction
2. Materials and Methods
2.1. Preparation of β-Mannooligosaccharides
2.2. Animals
2.3. Cell Culture
2.4. Cell Stimulation Assay
2.5. Fluorescence-Activated Cell Sorting (FACS) Analysis
2.6. Cytokine ELISA
2.7. SDS-PAGE and Western Blotting
2.8. Analysis of Metabolic State of BMDCs
2.9. Assessment of T-Cell Stimulatory Capacity of Man2-Stimulated BMDCs
2.10. Statistical Analysis
3. Results
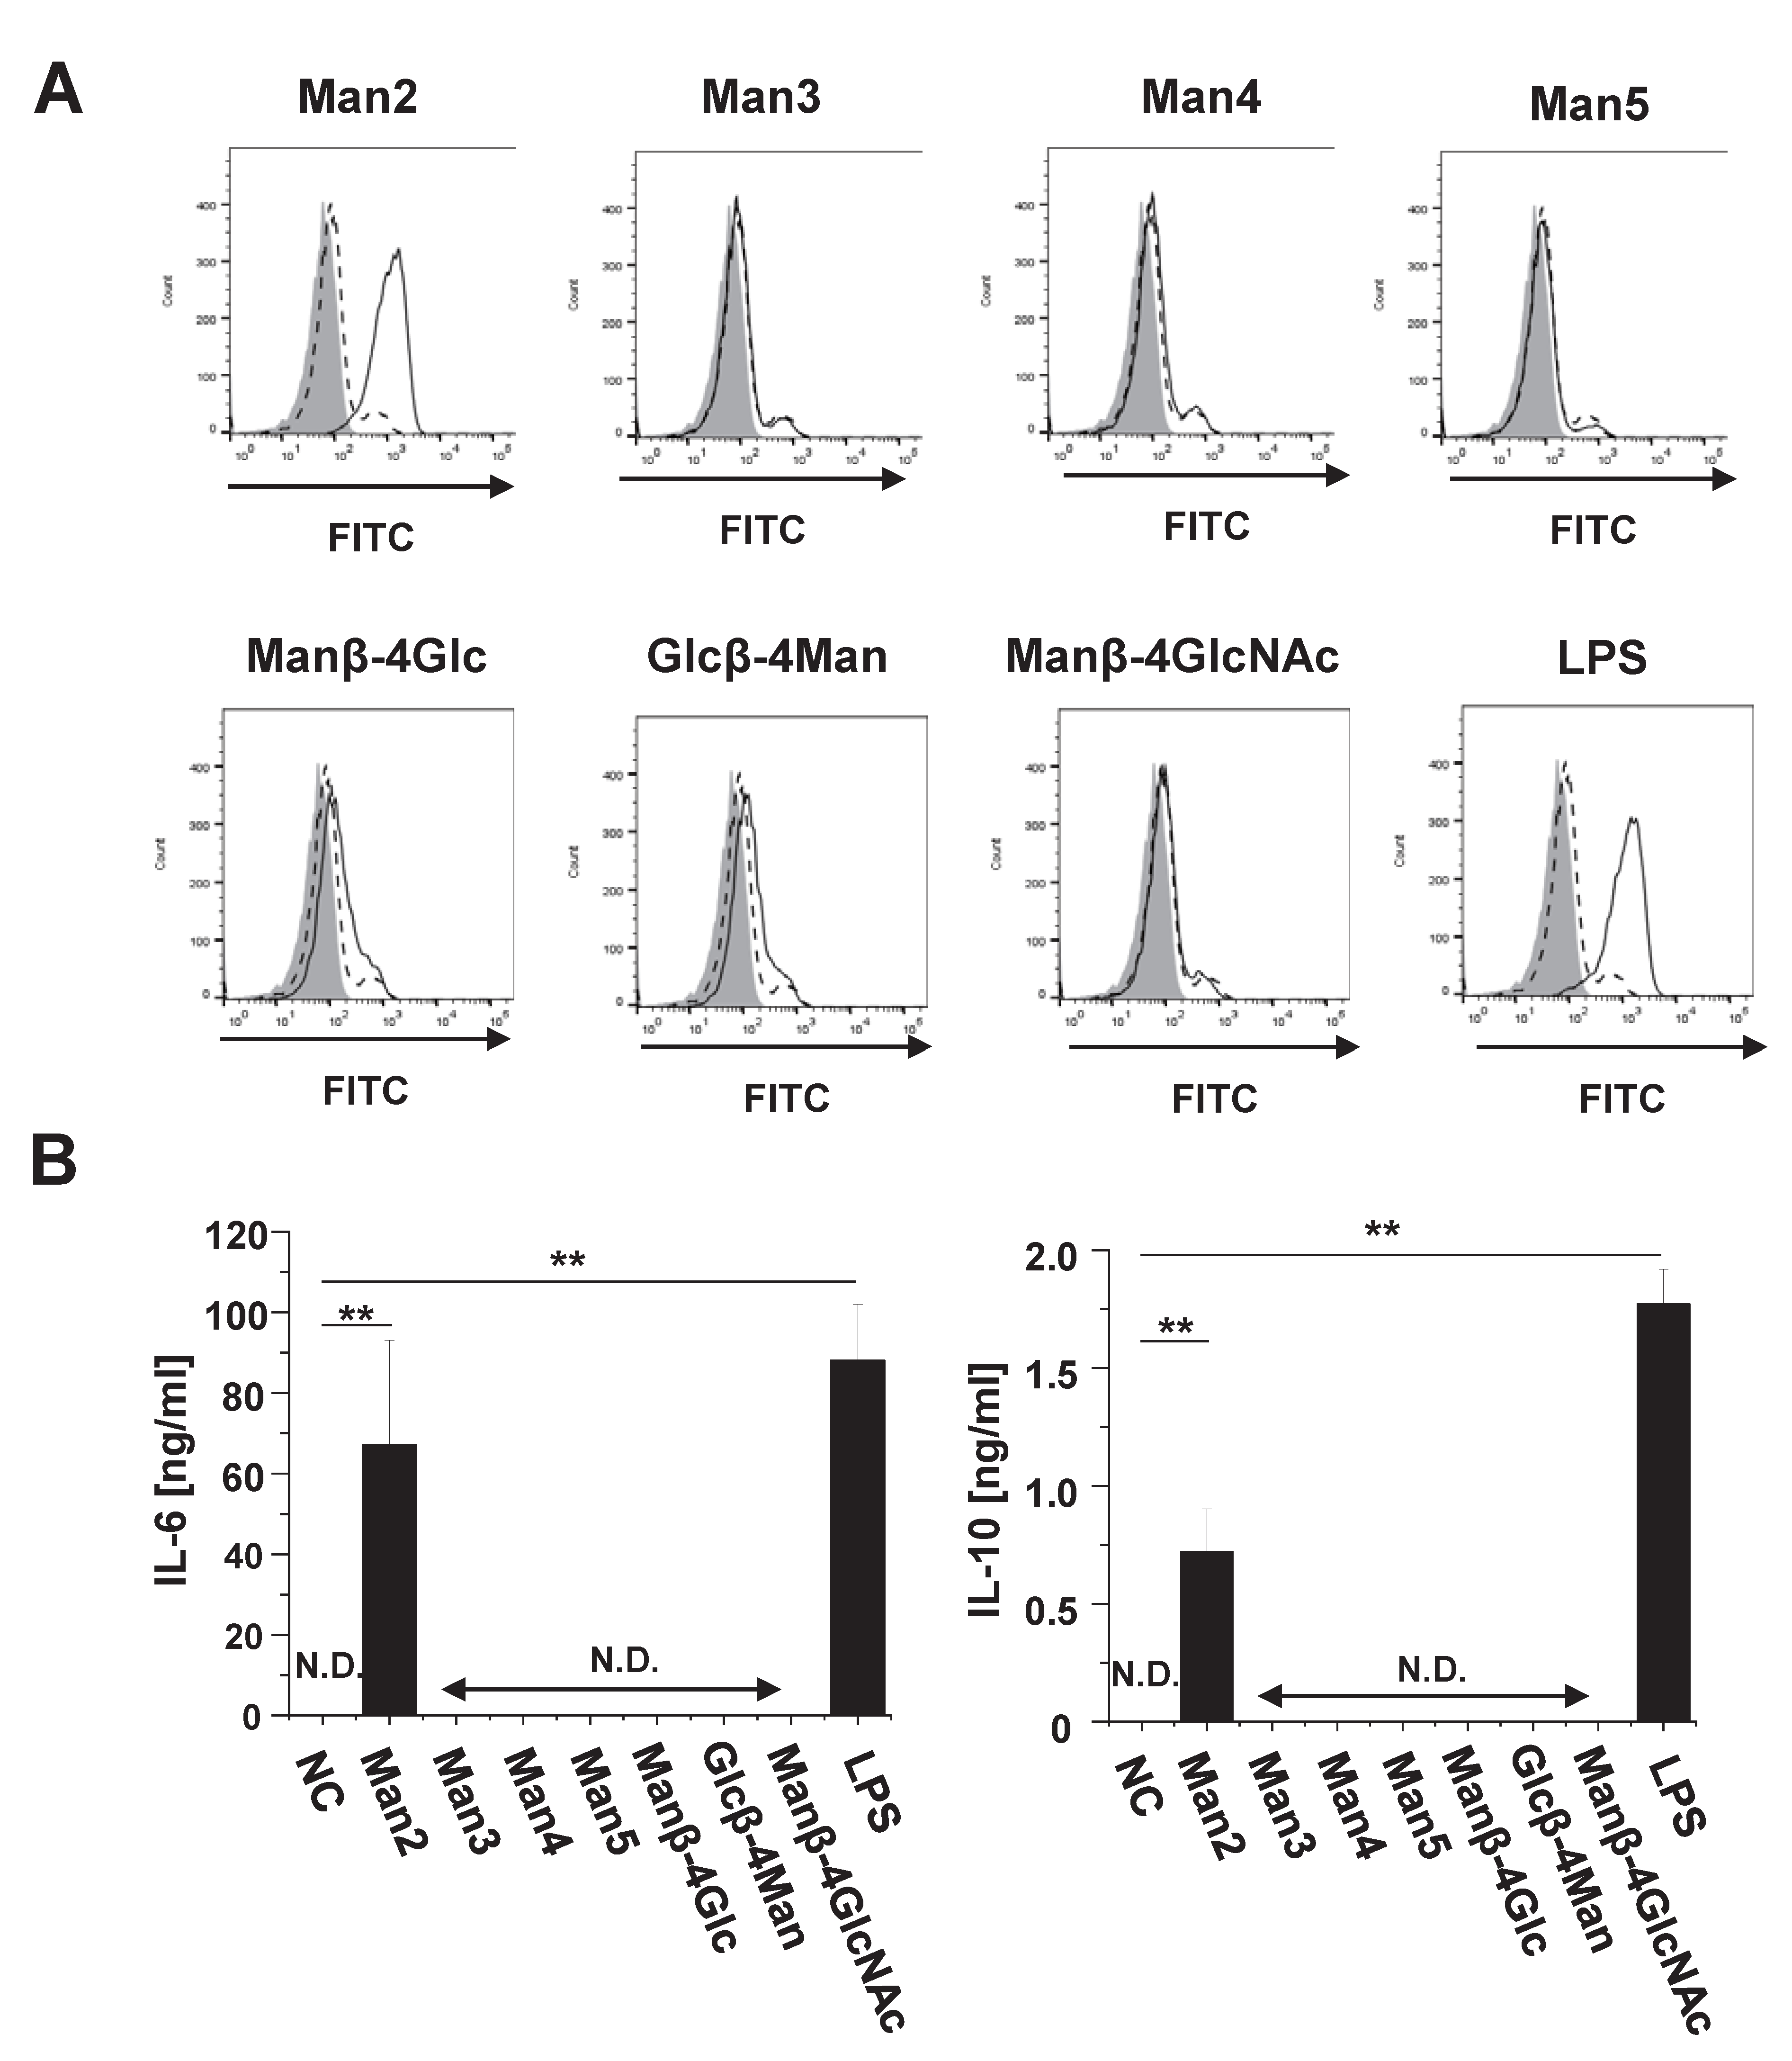
3.1. Man2 Induces Expression of Co-Stimulatory Molecule and Production of Cytokine in RAW264.7 Cells
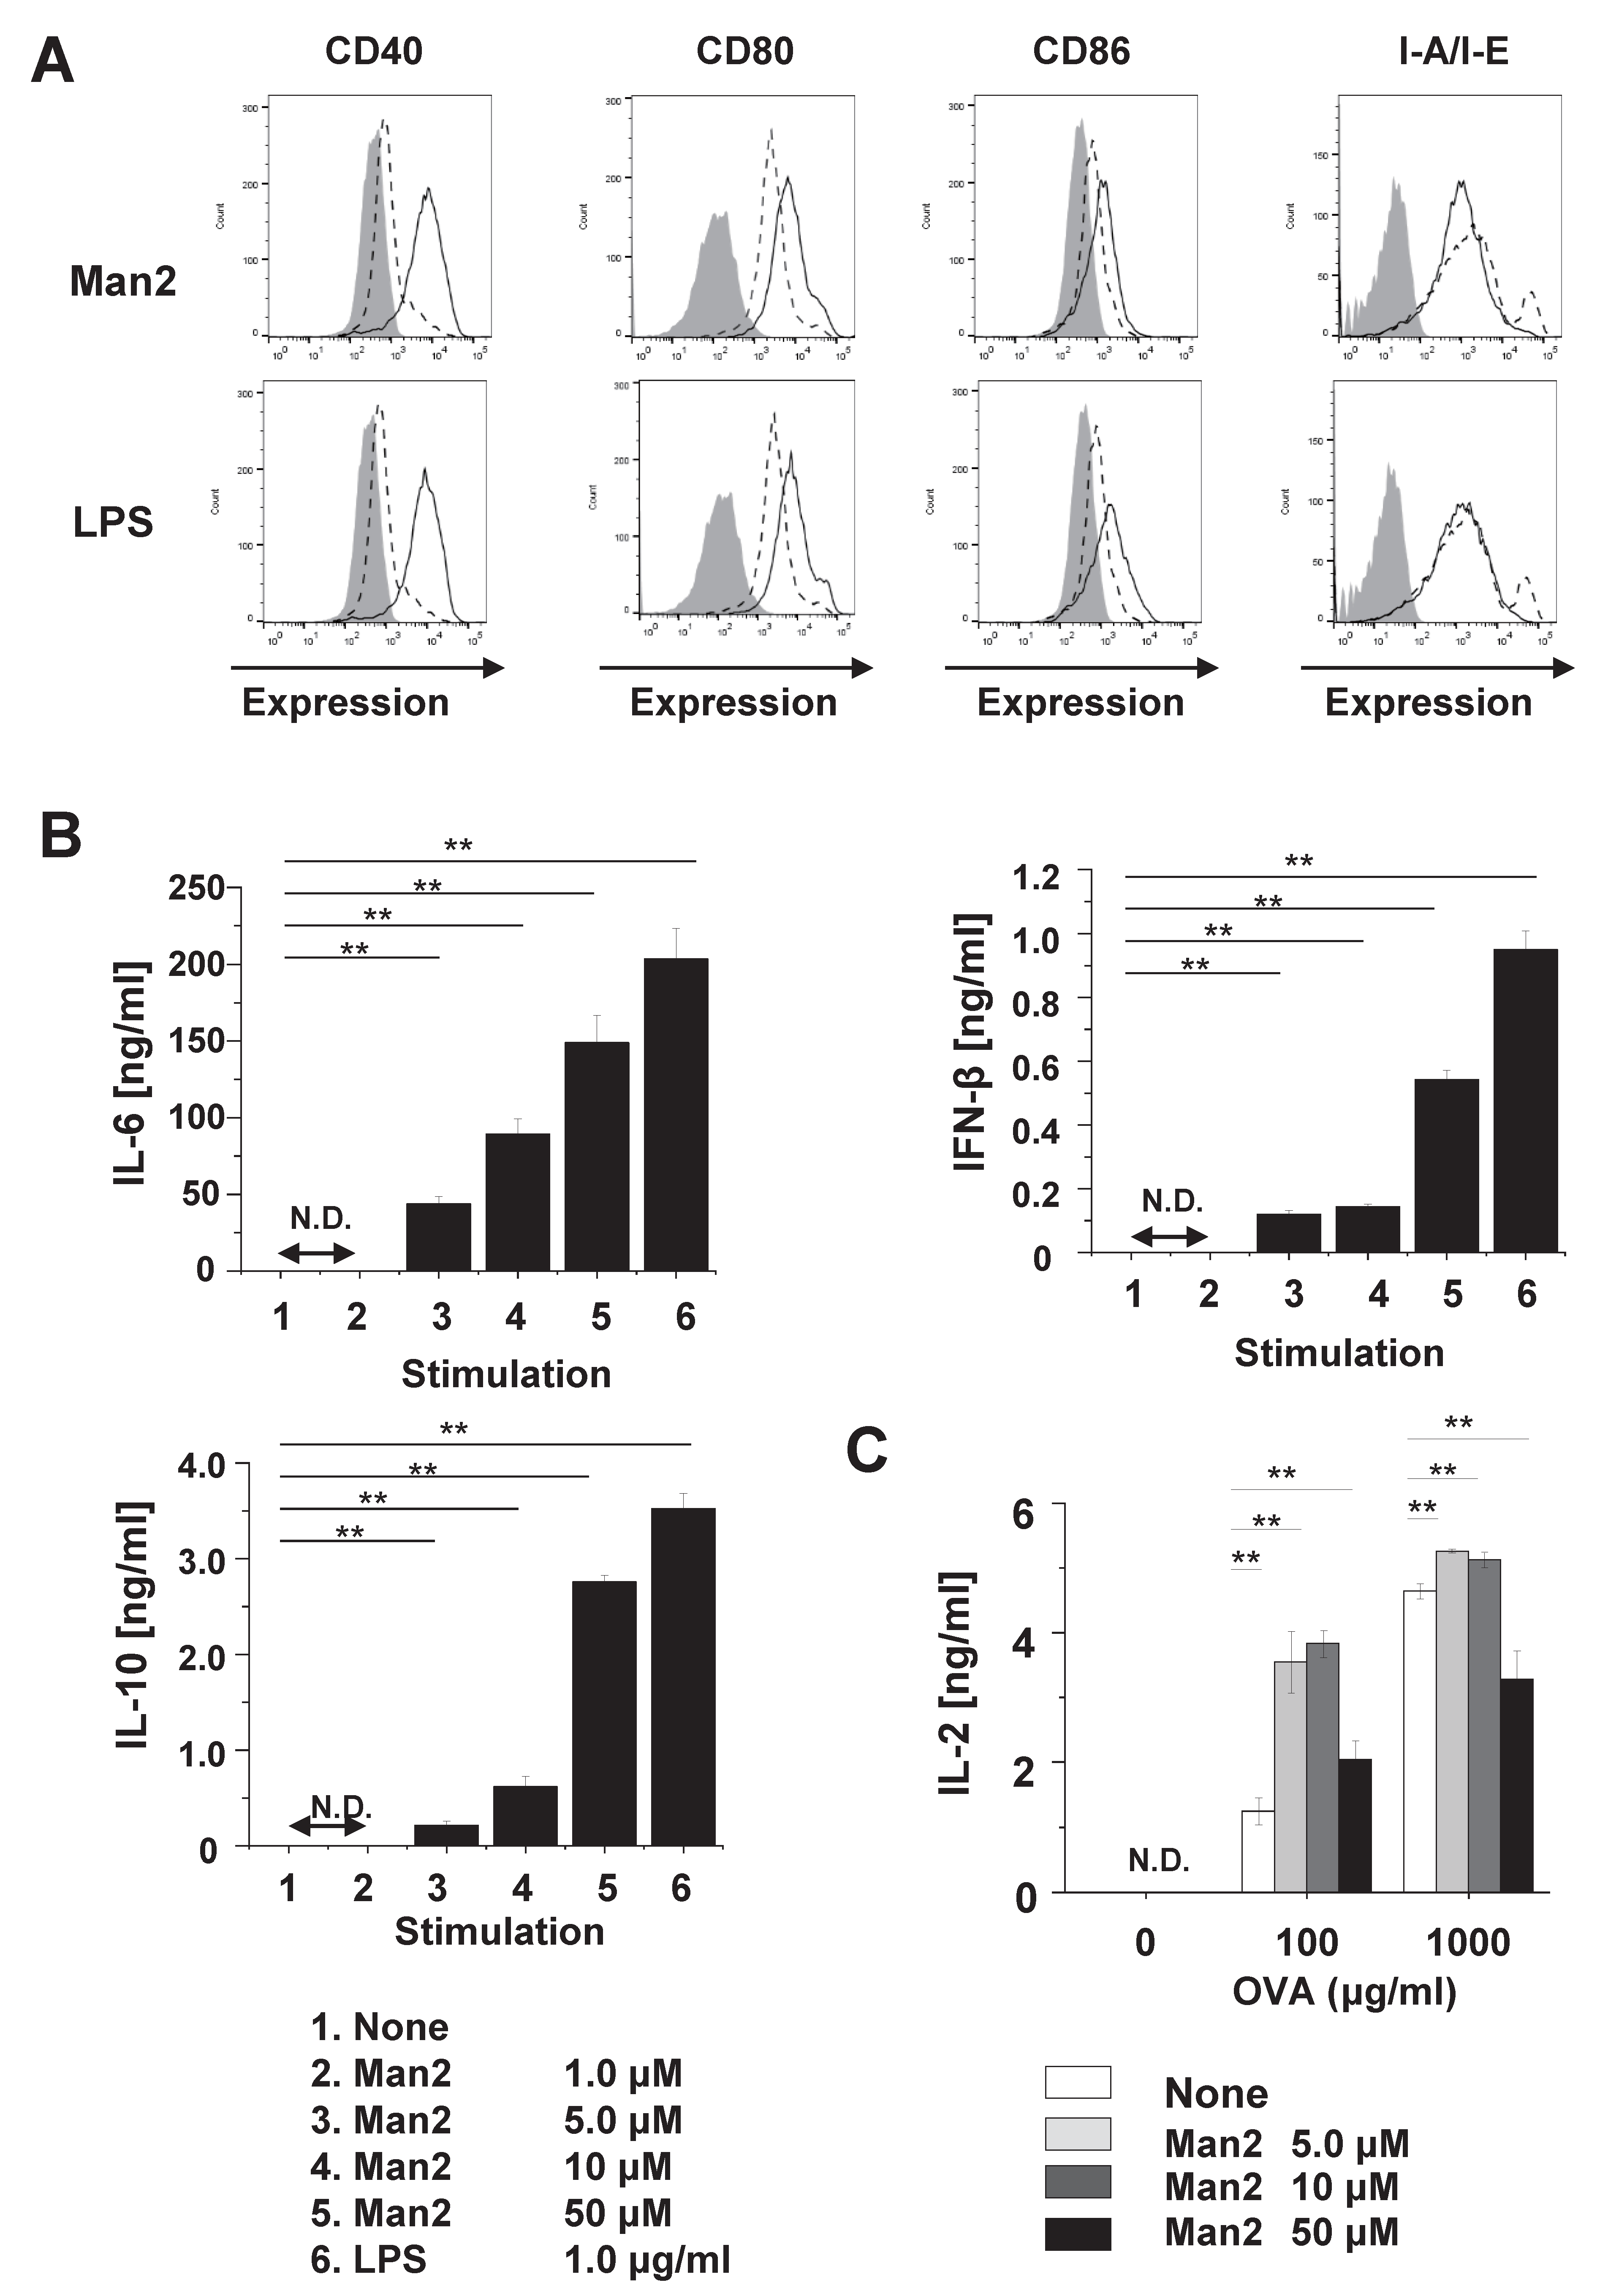
3.2. Man2 Enhances T-Cell Stimulatory Capacity of BMDCs
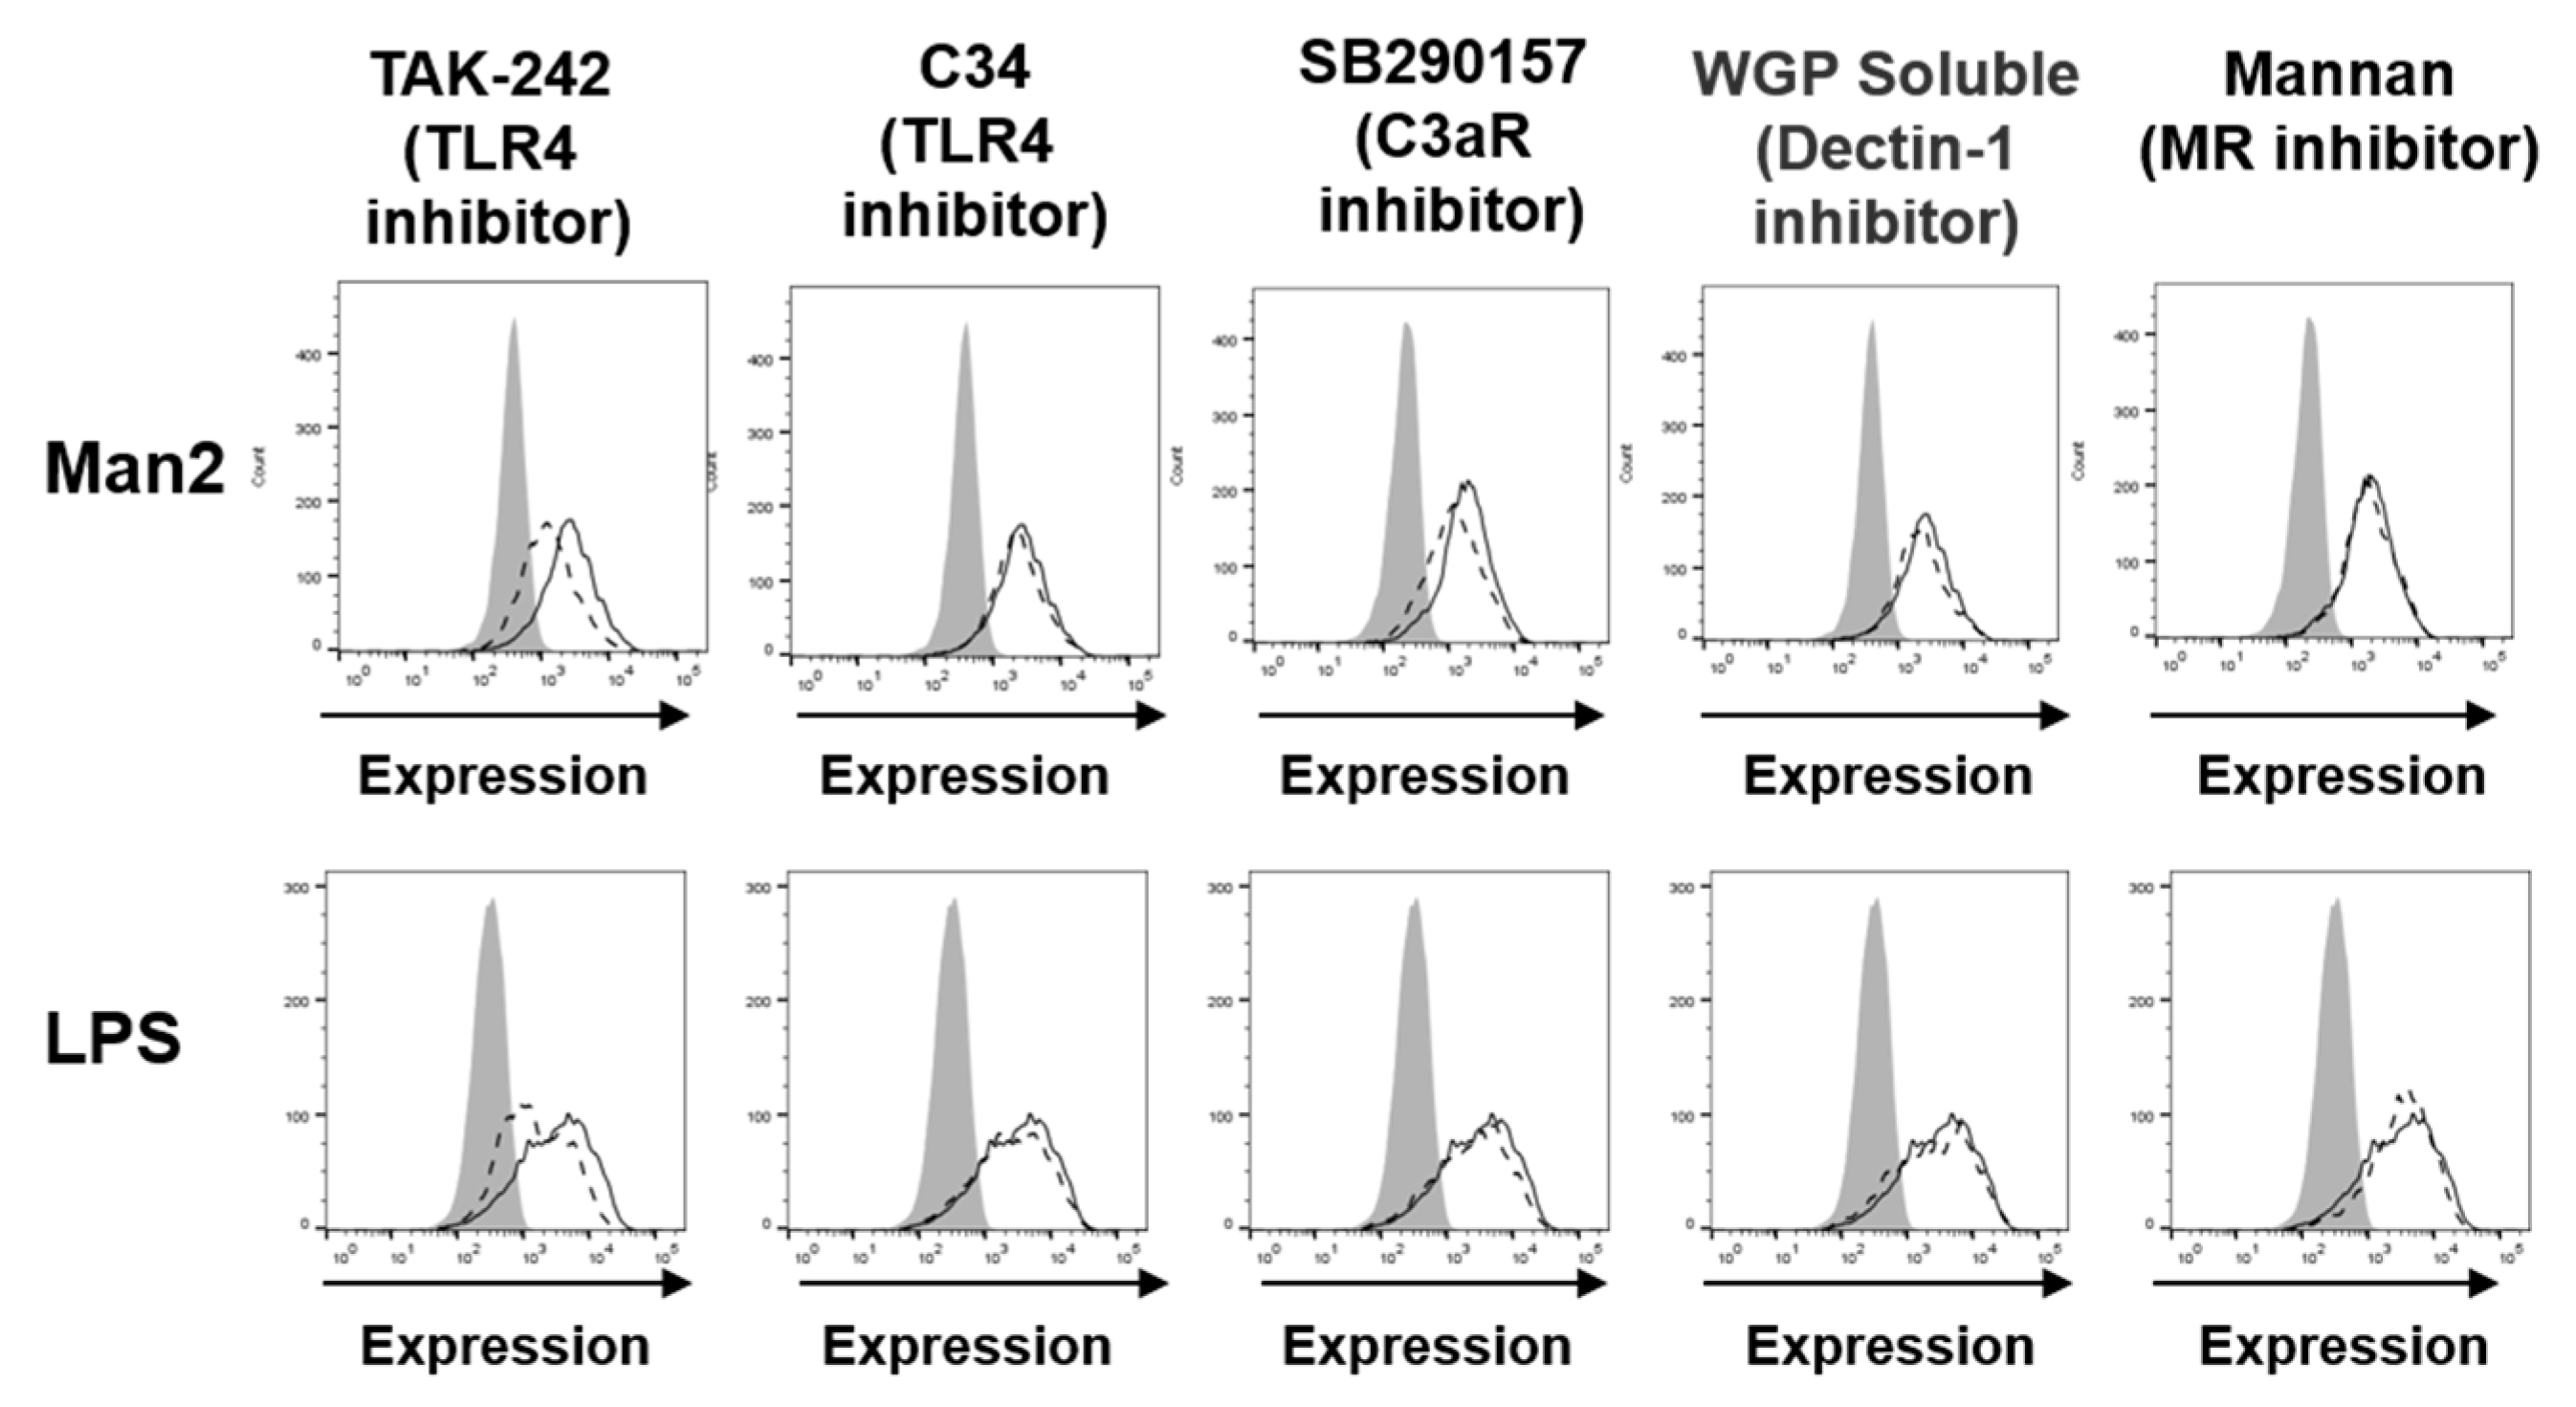
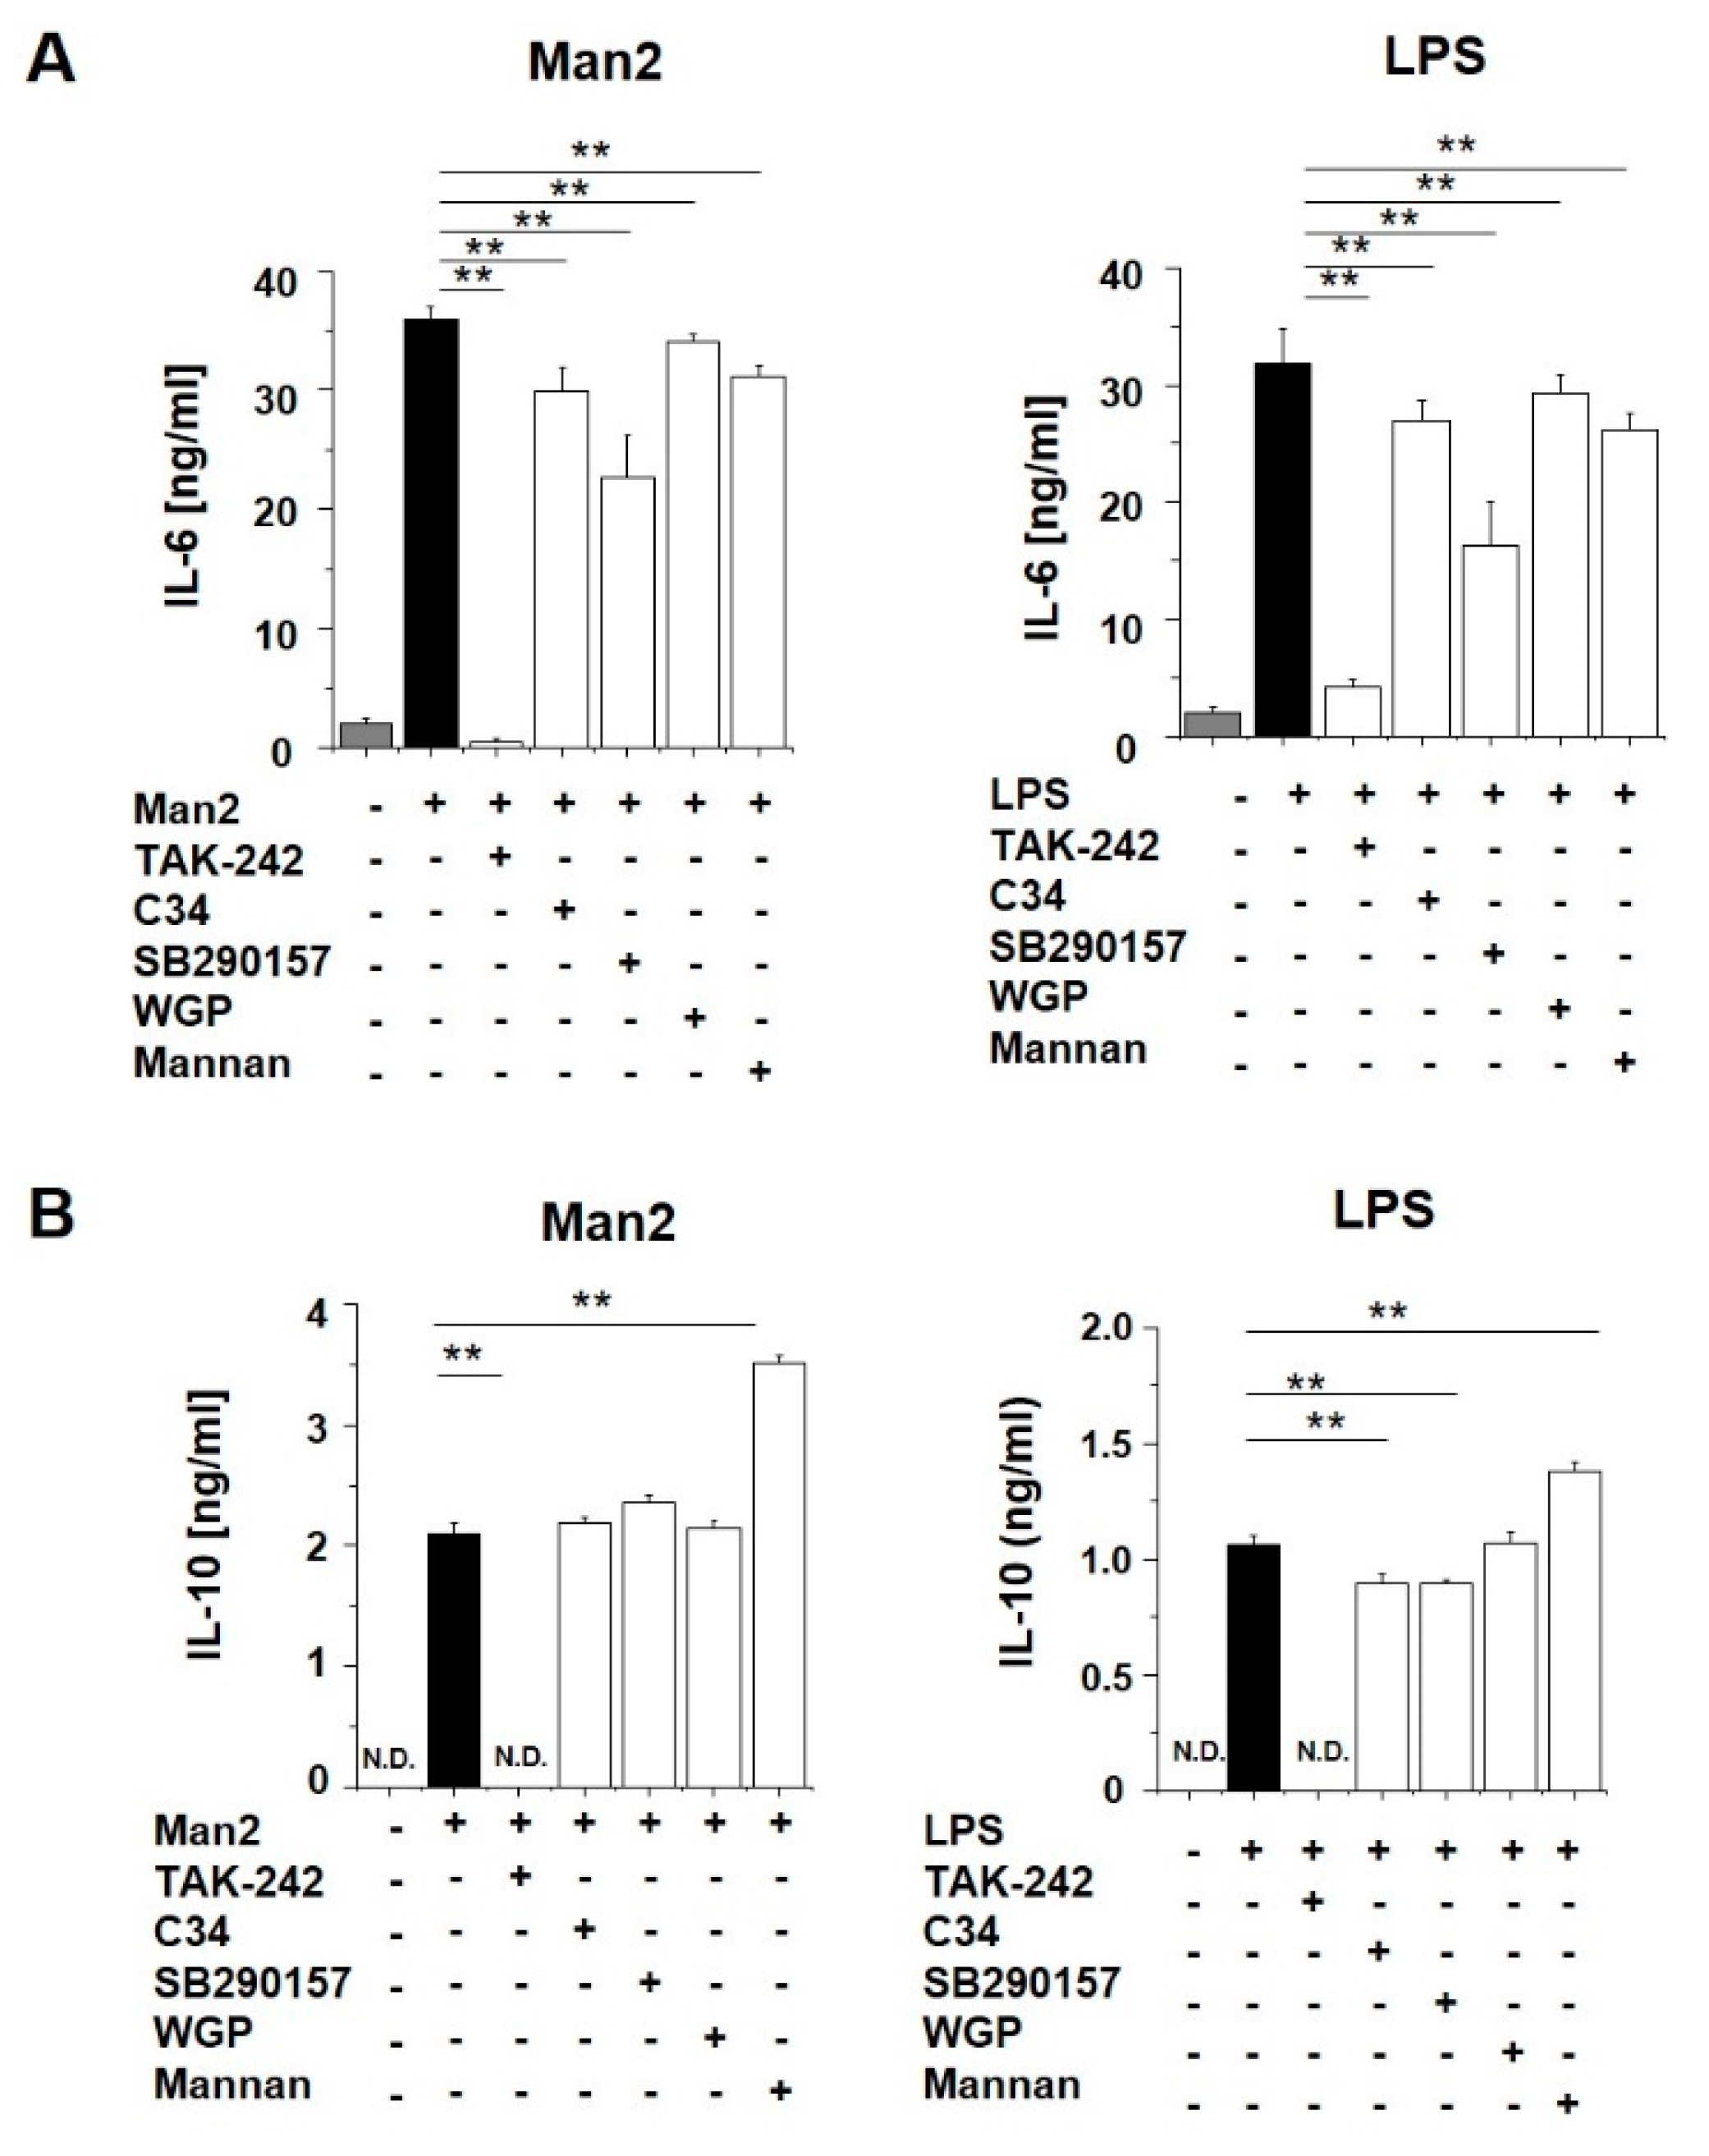
3.3. Man2 Activates BMDCs via TLR4 and C3aR Engagement
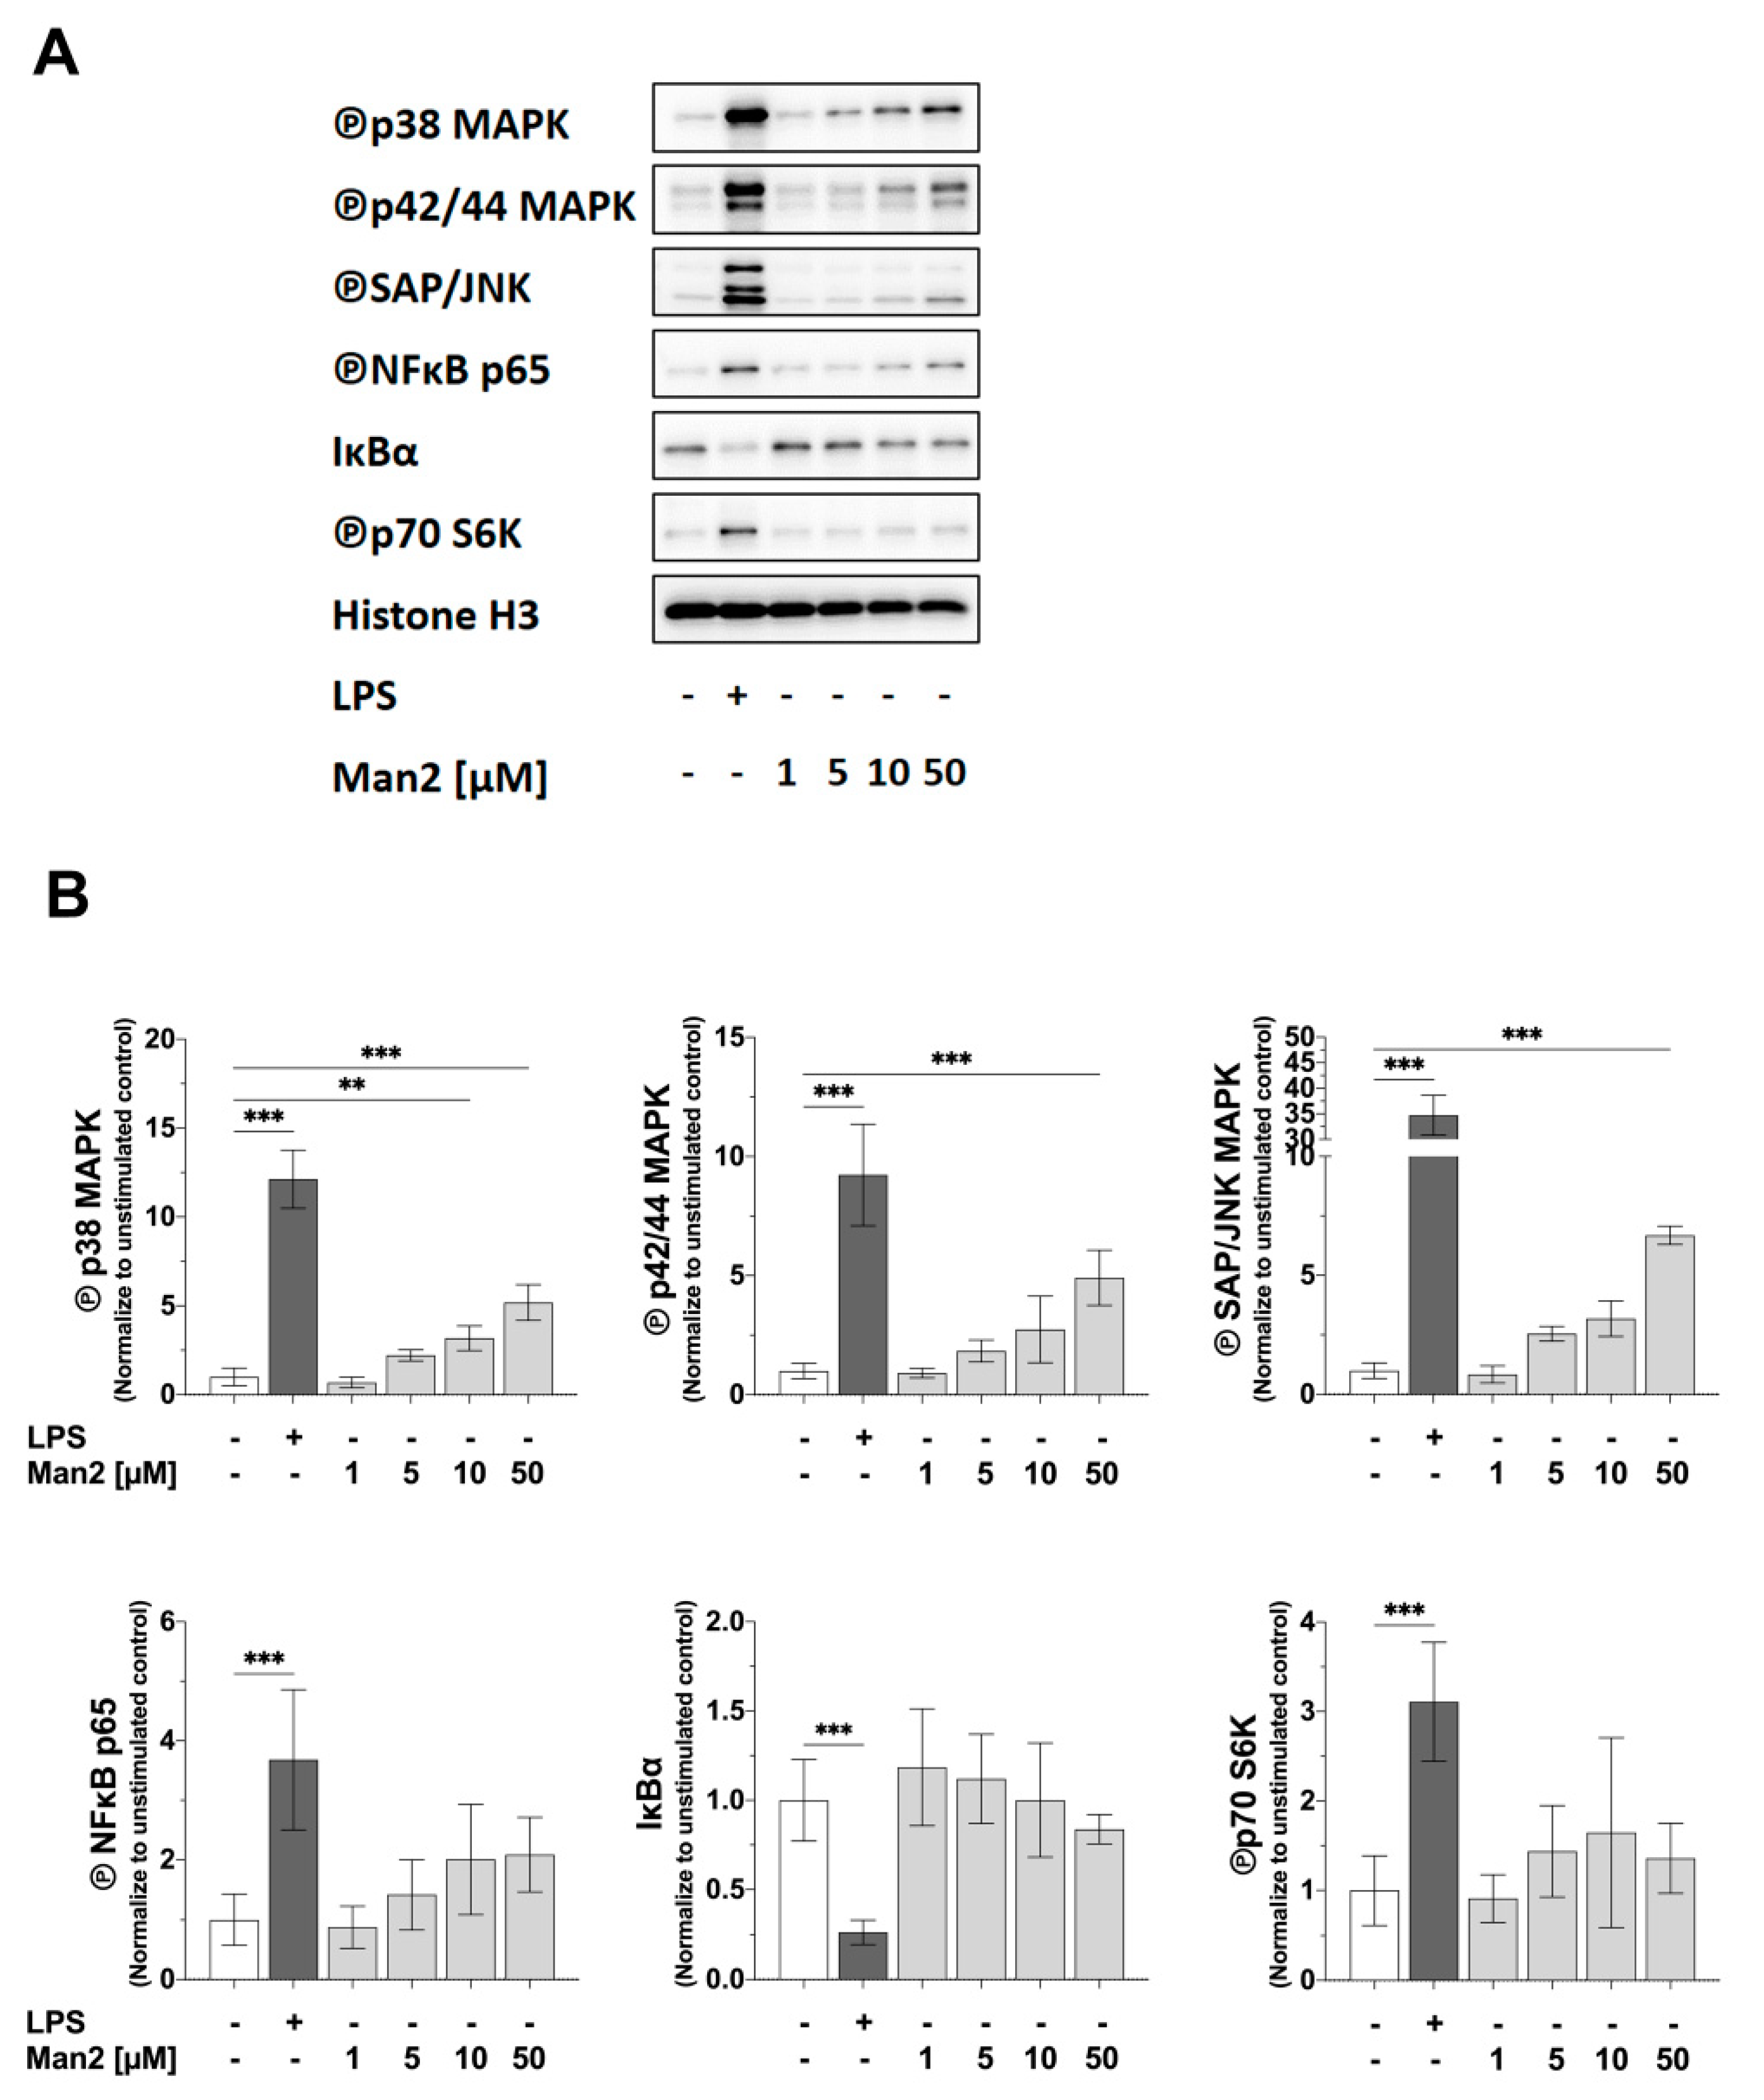
3.4. Man2 Activates MAPKs and NF-κB in BMDCs
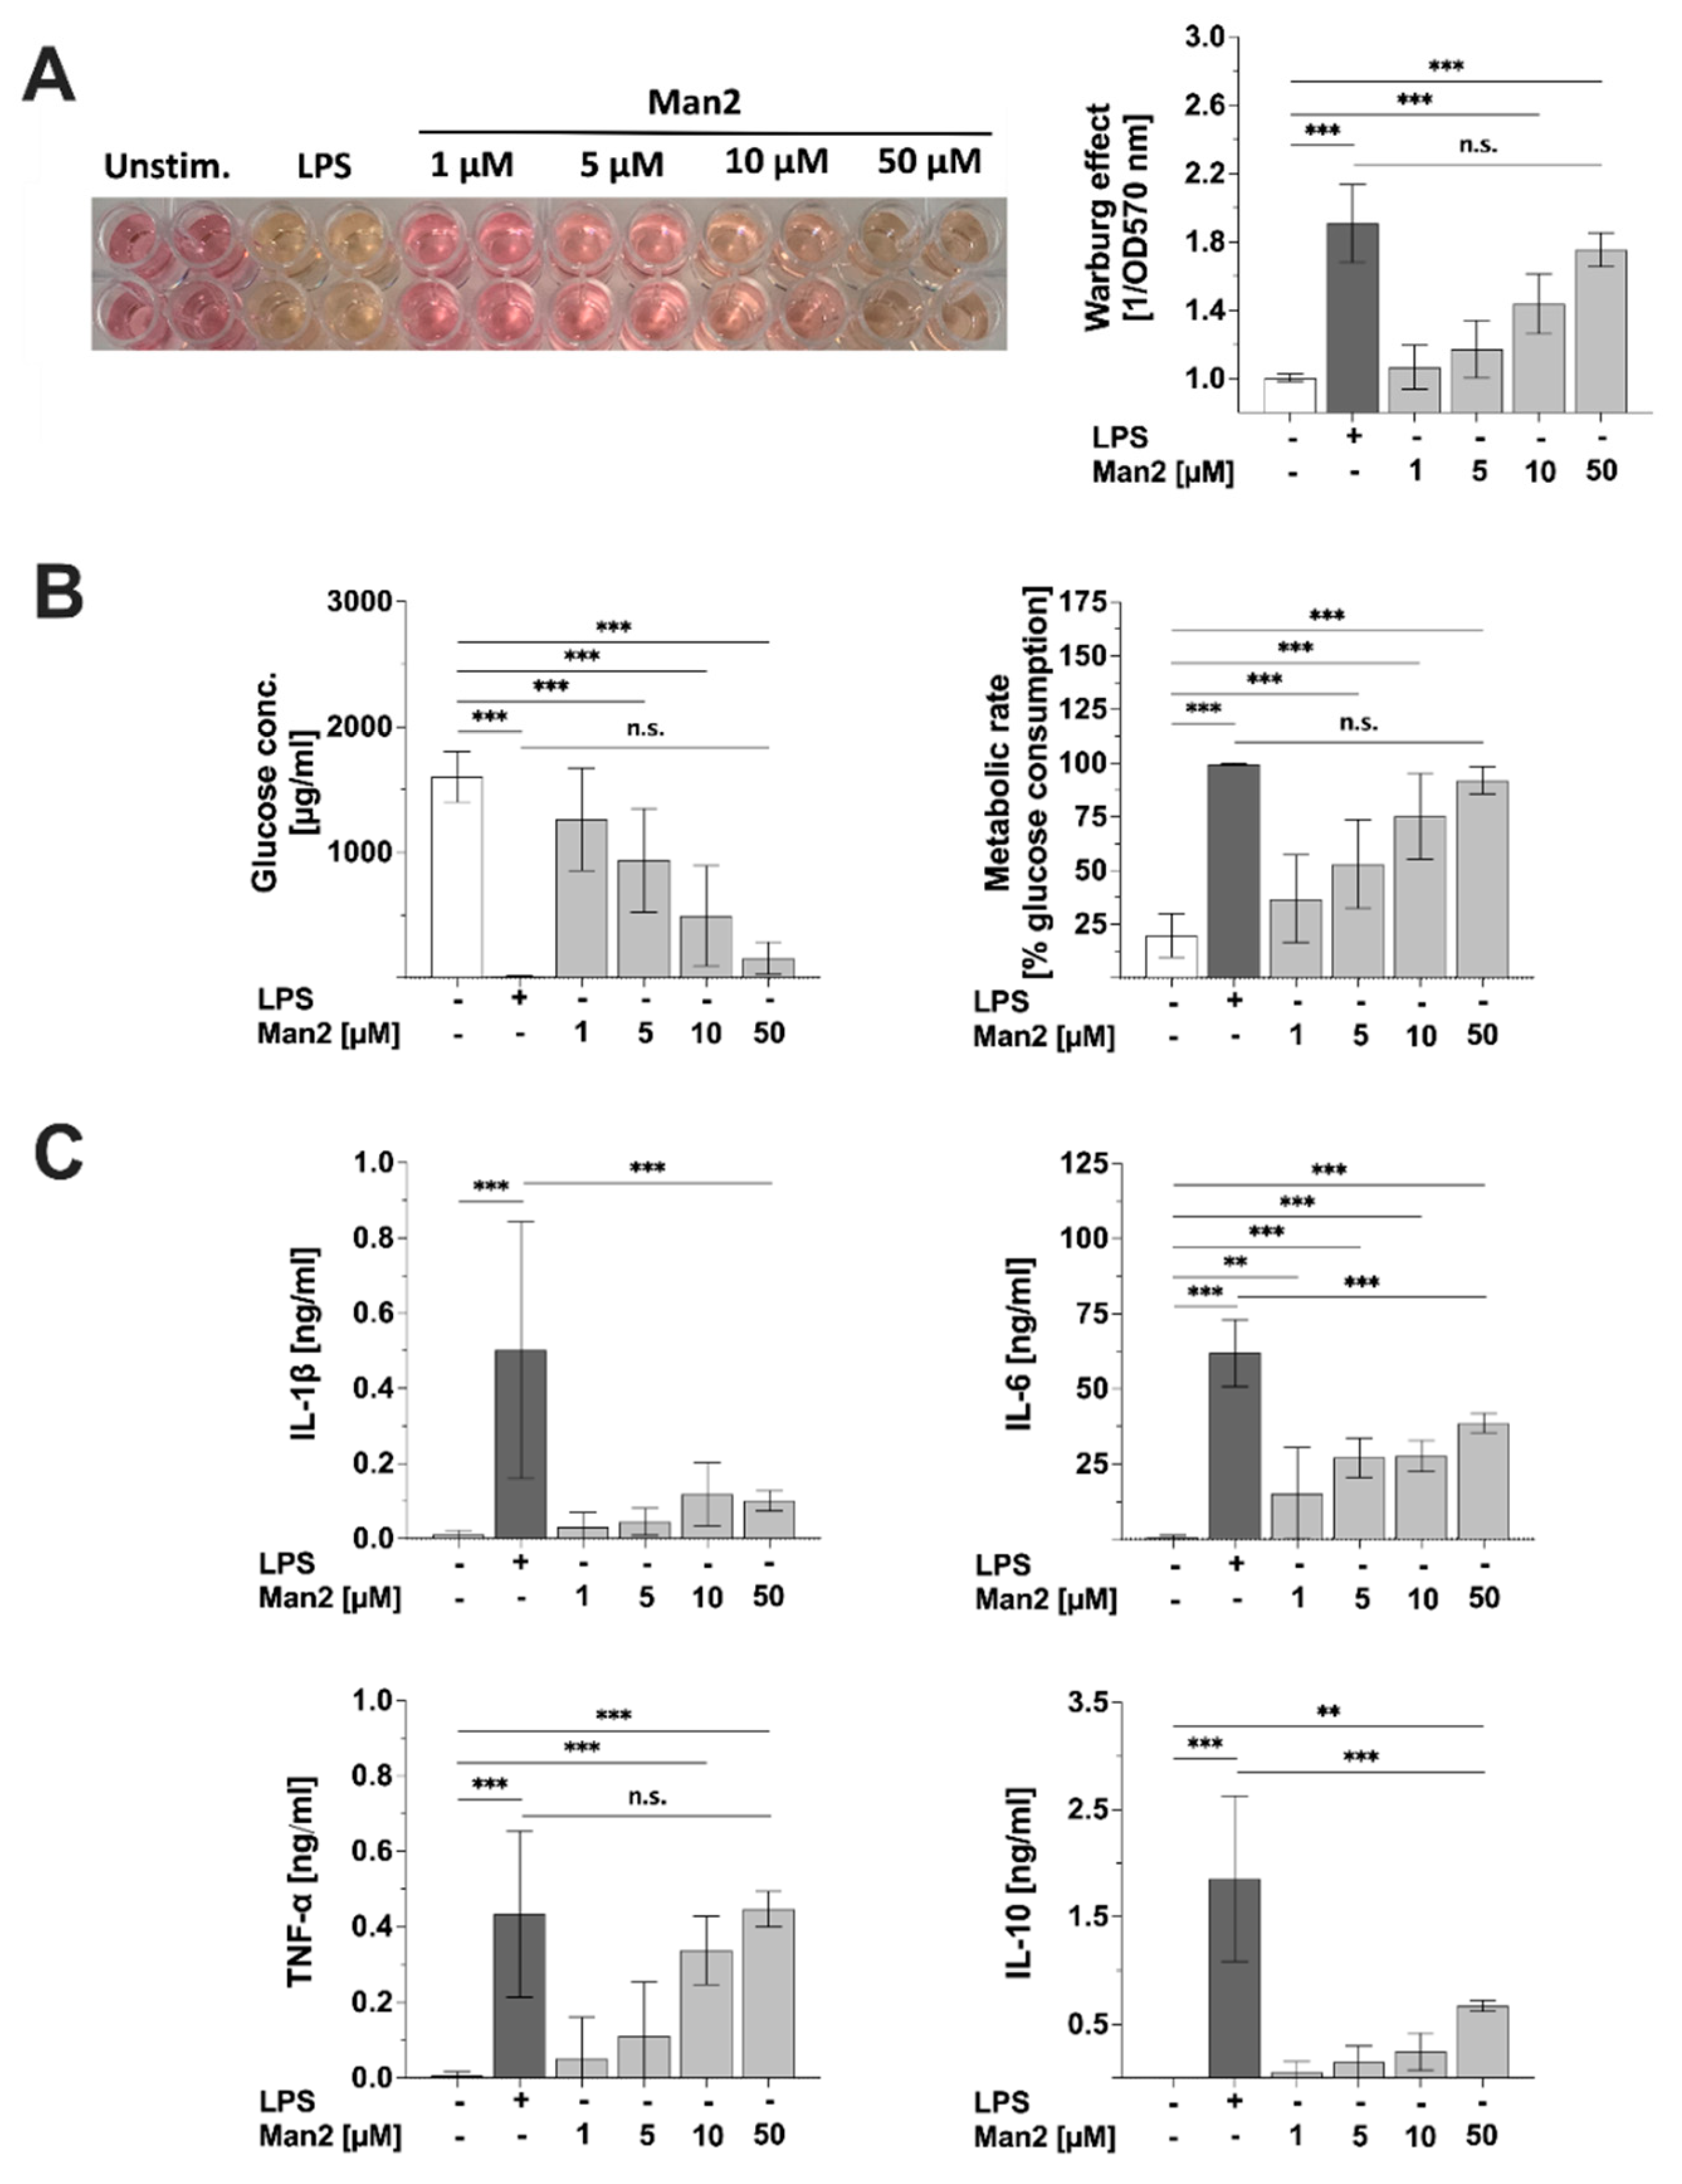
3.5. Man2 Activates Glucose Metabolism in BMDCs
4. Discussion
Supplementary Materials
Author Contributions
Funding
Institutional Review Board Statement
Informed Consent Statement
Data Availability Statement
Acknowledgments
Conflicts of Interest
Abbreviations
| APCs | Antigen presenting cells |
| BMDCs | Bone marrow derived murine dendritic cells |
| C3aR | Complement 3a receptor |
| FITC | Fluorescein isothiocyanate |
| mAb | Monoclonal antibody |
| TLR4 | Toll-like receptor 4 |
| Man2 | β-Man-(1→4)-Man |
| Man3 | β-Man-(1→4)-Man2 |
| Man4 | β-Man-(1→4)-Man3 |
| Man5 | β-Man-(1→4)-Man4 |
| Manβ-4Glc | β-Man-(1→4)-Glc |
| Glcβ-4Man | β-Glc-(1→4)-Man |
| Manβ-4 GlcNAc | β-Man-(1→4)-GlcNAc |
| MD-2 | myeloid differentiation protein-2 |
References
- Yamabhai, M.; Sak-Ubol, S.; Srila, W.; Haltrich, D. Mannan biotechnology: From biofuels to health. Crit. Rev. Biotechnol. 2016, 36, 32–42. [Google Scholar] [CrossRef]
- Lee, D.J.; O’Donnell, H.; Routier, F.H.; Tiralongo, J.; Haselhorst, T. Glycobiology of Human Fungal Pathogens: New Avenues for Drug Development. Cells 2019, 8, 1348. [Google Scholar] [CrossRef] [PubMed] [Green Version]
- Malgas, S.; van Dyk, J.S.; Pletschke, B.I. A review of the enzymatic hydrolysis of mannans and synergistic interactions between β-mannanase, β-mannosidase and α-galactosidase. World J. Microbiol. Biotechnol. 2015, 31, 1167–1175. [Google Scholar] [CrossRef] [PubMed]
- Netea, M.G.; Brown, G.D.; Kullberg, B.J.; Gow, N.A.R. An integrated model of the recognition of candida albicans by the innate immune system. Nat. Rev. Microbiol. 2008, 6, 67–78. [Google Scholar] [CrossRef]
- Hall, R.A.; Gow, N.A.R. Mannosylation in Candida Albicans: Role in cell wall function and immune recognition. Mol. Microbiol. 2013, 90, 1147–1161. [Google Scholar] [CrossRef] [PubMed] [Green Version]
- Sirvent, S.; Soria, I.; Cirauqui, C.; Cases, B.; Manzano, A.I.; Diez-Rivero, C.M.; Reche, P.A.; López-Relaño, J.; Martínez-Naves, E.; Cañada, F.J.; et al. Novel vaccines targeting dendritic cells by coupling allergoids to nonoxidized mannan enhance allergen uptake and induce functional regulatory t cells through programmed death ligand 1. J. Allergy Clin. Immunol. 2016, 138, 558–567.e11. [Google Scholar] [CrossRef] [PubMed] [Green Version]
- Carlson, J.L.; Erickson, J.M.; Hess, J.M.; Gould, T.J.; Slavin, J.L. Prebiotic dietary fiber and gut health: Comparing the in vitro fermentations of Beta-Glucan, Inulin and Xylooligosaccharide. Nutrients 2017, 9, 1361. [Google Scholar] [CrossRef] [Green Version]
- Liu, Y.; Chen, J.; Tan, Q.; Deng, X.; Tsai, P.-J.; Chen, P.-H.; Ye, M.; Guo, J.; Su, Z. Nondigestible Oligosaccharides with Anti-Obesity Effects. J. Agric. Food Chem. 2020, 68, 4–16. [Google Scholar] [CrossRef]
- Ozaki, K.; Fujii, S.; Hayashi, M. Effect of dietary mannooligosaccharides on the immune system of Ovalbumin-sensitized mice. J. Health Sci. 2007, 53, 766–770. [Google Scholar] [CrossRef] [Green Version]
- Kovacs-Nolan, J.; Kanatani, H.; Nakamura, A.; Ibuki, M.; Mine, Y. β-1,4-Mannobiose stimulates innate immune responses and induces TLR4-dependent activation of mouse macrophages but reduces severity of inflammation during Endotoxemia in mice. J. Nutr. 2013, 143, 384–391. [Google Scholar] [CrossRef] [Green Version]
- Gardner, A.; de Mingo Pulido, Á.; Ruffell, B. Dendritic Cells and Their Role in Immunotherapy. Front. Immunol. 2020, 11. [Google Scholar] [CrossRef] [PubMed]
- Anderson, D.A.; Dutertre, C.-A.; Ginhoux, F.; Murphy, K.M. genetic models of human and mouse dendritic cell development and function. Nat. Rev. Immunol. 2021, 21, 101–115. [Google Scholar] [CrossRef] [PubMed]
- Macri, C.; Pang, E.S.; Patton, T.; O’Keeffe, M. Dendritic cell subsets. Semin. Cell Dev. Biol. 2018, 84, 11–21. [Google Scholar] [CrossRef] [PubMed]
- Kawahara, R.; Saburi, W.; Odaka, R.; Taguchi, H.; Ito, S.; Mori, H.; Matsui, H. Metabolic mechanism of Mannan in a Ruminal Bacterium, Ruminococcus Albus, involving two Mannoside Phosphorylases and Cellobiose 2-Epimerase: Discovery of a new carbohydrate phosphorylase, β-1,4-mannooligosaccharide. J. Biol. Chem. 2012, 287, 42389–42399. [Google Scholar] [CrossRef] [PubMed] [Green Version]
- Hamura, K.; Saburi, W.; Matsui, H.; Mori, H. Modulation of acceptor specificity of Ruminococcus Albus Cellobiose Phosphorylase through site-directed Mutagenesis. Carbohydr. Res. 2013, 379, 21–25. [Google Scholar] [CrossRef]
- Blanco-Pérez, F.; Goretzki, A.; Wolfheimer, S.; Schülke, S. The vaccine adjuvant MPLA activates Glycolytic metabolism in mouse MDC by a JNK-dependent activation of MTOR-signaling. Mol. Immunol. 2019, 106, 159–169. [Google Scholar] [CrossRef]
- Heilmann, M.; Wellner, A.; Gadermaier, G.; Ilchmann, A.; Briza, P.; Krause, M.; Nagai, R.; Burgdorf, S.; Scheurer, S.; Vieths, S.; et al. Ovalbumin modified with Pyrraline, a Maillard reaction product, shows enhanced T-cell immunogenicity. Biol. Chem. 2014, 289, 7919–7928. [Google Scholar] [CrossRef] [Green Version]
- Everts, B.; Amiel, E.; Huang, S.C.-C.; Smith, A.M.; Chang, C.-H.; Lam, W.Y.; Redmann, V.; Freitas, T.C.; Blagih, J.; van der Windt, G.J.W.; et al. TLR-driven early Glycolytic reprogramming via the Kinases TBK1-IKKɛ supports the Anabolic demands of Dendritic cell activation. Nat. Immunol. 2014, 15, 323–332. [Google Scholar] [CrossRef] [Green Version]
- Krawczyk, C.M.; Holowka, T.; Sun, J.; Blagih, J.; Amiel, E.; DeBerardinis, R.J.; Cross, J.R.; Jung, E.; Thompson, C.B.; Jones, R.G.; et al. Toll-like Receptor–induced changes in Glycolytic metabolism regulate Dendritic cell activation. Blood 2010, 115, 4742–4749. [Google Scholar] [CrossRef] [Green Version]
- Schülke, S.; Fiedler, A.-H.; Junker, A.-C.; Flaczyk, A.; Wolfheimer, S.; Wangorsch, A.; Heinz, A.; Beckert, H.; Nagl, B.; Bohle, B.; et al. Critical role of mammalian target of Rapamycin for IL-10 Dendritic cell induction by a Flagellin A Conjugate in preventing allergic sensitization. J. Allergy Clin. Immunol. 2018, 141, 1786–1798.e11. [Google Scholar] [CrossRef] [Green Version]
- Moeller, T.; Wolfheimer, S.; Goretzki, A.; Scheurer, S.; Schülke, S. NFκB- and MAP-Kinase signaling contribute to the activation of Murine Myeloid Dendritic cells by a Flagellin A: Allergen fusion protein. Cells 2019, 8, 355. [Google Scholar] [CrossRef] [Green Version]
- Poncini, C.V.; Giménez, G.; Pontillo, C.A.; Alba-Soto, C.D.; de Isola, E.L.; Piazzón, I.; Cappa, S.M. Central role of extracellular signal-regulated kinase and Toll-like receptor 4 in IL-10 production in regulatory dendritic cells induced by Trypanosoma cruzi. Mol. Immunol. 2010, 47, 1981–1988. [Google Scholar] [CrossRef]
- Klaska, I.P.; Muckersie, E.; Martin-Granados, C.; Christofi, M.; Forrester, J.V. Lipopolysaccharide-Primed Heterotolerant Dendritic cells suppress Experimental Autoimmune Uveoretinitis by multiple mechanisms. Immunology 2017, 150, 364–377. [Google Scholar] [CrossRef] [PubMed] [Green Version]
- Matsunaga, N.; Tsuchimori, N.; Matsumoto, T.; Ii, M. TAK-242 (Resatorvid), a small-molecule inhibitor of Toll-like receptor (TLR) 4 signaling, binds selectively to TLR4 and interferes with interactions between TLR4 and its adaptor molecules. Mol. Pharmacol. 2011, 79, 34–41. [Google Scholar] [CrossRef] [PubMed] [Green Version]
- Neal, M.D.; Jia, H.; Eyer, B.; Good, M.; Guerriero, C.J.; Sodhi, C.P.; Afrazi, A.; Jr, T.P.; Ma, C.; Branca, M.; et al. Discovery and validation of a new class of small molecule toll-like receptor 4 (TLR4) inhibitors. PLoS ONE 2013, 8, e65779. [Google Scholar] [CrossRef] [PubMed] [Green Version]
- Park, B.S.; Song, D.H.; Kim, H.M.; Choi, B.-S.; Lee, H.; Lee, J.-O. The structural basis of Lipopolysaccharide recognition by the TLR4–MD-2 complex. Nature 2009, 458, 1191–1195. [Google Scholar] [CrossRef] [PubMed]
- Oblak, A.; Jerala, R. The molecular mechanism of species-specific recognition of Lipopolysaccharides by the MD-2/TLR4 receptor complex. Mol. Immunol. 2015, 63, 134–142. [Google Scholar] [CrossRef]
- Wang, Y.; Su, L.; Morin, M.D.; Jones, B.T.; Whitby, L.R.; Surakattula, M.M.R.P.; Huang, H.; Shi, H.; Choi, J.H.; Wang, K.; et al. TLR4/MD-2 Activation by a synthetic agonist with no similarity to LPS. Proc. Natl. Acad. Sci. USA 2016, 113, E884–E893. [Google Scholar] [CrossRef] [Green Version]
- Wang, Y.; Zhang, S.; Li, H.; Wang, H.; Zhang, T.; Hutchinson, M.R.; Yin, H.; Wang, X. Small-molecule modulators of toll-like receptors. Acc. Chem. Res. 2020, 53, 1046–1055. [Google Scholar] [CrossRef]
- Buttersack, C. Hydrophobicity of carbohydrates and related hydroxy compounds. Carbohydr. Res. 2017, 446–447, 101–112. [Google Scholar] [CrossRef]
- Morris, M.J.; Striegel, A.M. Influence of glycosidic linkage on the solution conformational entropy of gluco- and mannobioses. Carbohydr. Res. 2014, 398, 31–35. [Google Scholar] [CrossRef]
- Holland, M.C.H.; Morikis, D.; Lambris, J.D. Synthetic small-molecule complement inhibitors. Curr. Opin. Investig. Drugs. 2004, 5, 1164–1173. [Google Scholar] [PubMed]
- Laumonnier, Y.; Karsten, C.M.; Köhl, J. Novel insights into the expression pattern of anaphylatoxin receptors in mice and Men. Mol. Immunol. 2017, 89, 44–58. [Google Scholar] [CrossRef] [PubMed]
- Wang, C.; Cao, S.; Zhang, D.; Li, H.; Kijlstra, A.; Yang, P. Increased Complement 3a receptor is associated with Behcet’s disease and Vogt-Koyanagi-Harada disease. Sci. Rep. 2017, 7, 15579. [Google Scholar] [CrossRef] [PubMed]
- Wang, Y.; Zhang, H.; He, Y.-W. The Complement Receptors C3aR and C5aR Are a new class of immune checkpoint receptor in cancer immunotherapy. Front. Immunol. 2019, 10. [Google Scholar] [CrossRef] [PubMed] [Green Version]
- Ouyang, W.; O’Garra, A. IL-10 Family Cytokines IL-10 and IL-22: From Basic Science to Clinical Translation. Immunology 2019, 50, 871–891. [Google Scholar] [CrossRef]


Publisher’s Note: MDPI stays neutral with regard to jurisdictional claims in published maps and institutional affiliations. |
© 2021 by the authors. Licensee MDPI, Basel, Switzerland. This article is an open access article distributed under the terms and conditions of the Creative Commons Attribution (CC BY) license (https://creativecommons.org/licenses/by/4.0/).
Share and Cite
Cheng, T.-Y.; Lin, Y.-J.; Saburi, W.; Vieths, S.; Scheurer, S.; Schülke, S.; Toda, M. β-(1→4)-Mannobiose Acts as an Immunostimulatory Molecule in Murine Dendritic Cells by Binding the TLR4/MD-2 Complex. Cells 2021, 10, 1774. https://doi.org/10.3390/cells10071774
Cheng T-Y, Lin Y-J, Saburi W, Vieths S, Scheurer S, Schülke S, Toda M. β-(1→4)-Mannobiose Acts as an Immunostimulatory Molecule in Murine Dendritic Cells by Binding the TLR4/MD-2 Complex. Cells. 2021; 10(7):1774. https://doi.org/10.3390/cells10071774
Chicago/Turabian StyleCheng, Ting-Yu, Yen-Ju Lin, Wataru Saburi, Stefan Vieths, Stephan Scheurer, Stefan Schülke, and Masako Toda. 2021. "β-(1→4)-Mannobiose Acts as an Immunostimulatory Molecule in Murine Dendritic Cells by Binding the TLR4/MD-2 Complex" Cells 10, no. 7: 1774. https://doi.org/10.3390/cells10071774