
Co-Expression of CD34, CD90, OV-6 and Cell-Surface Vimentin Defines Cancer Stem Cells of Hepatoblastoma, Which Are Affected by Hsp90 Inhibitor 17-AAG

 and
and 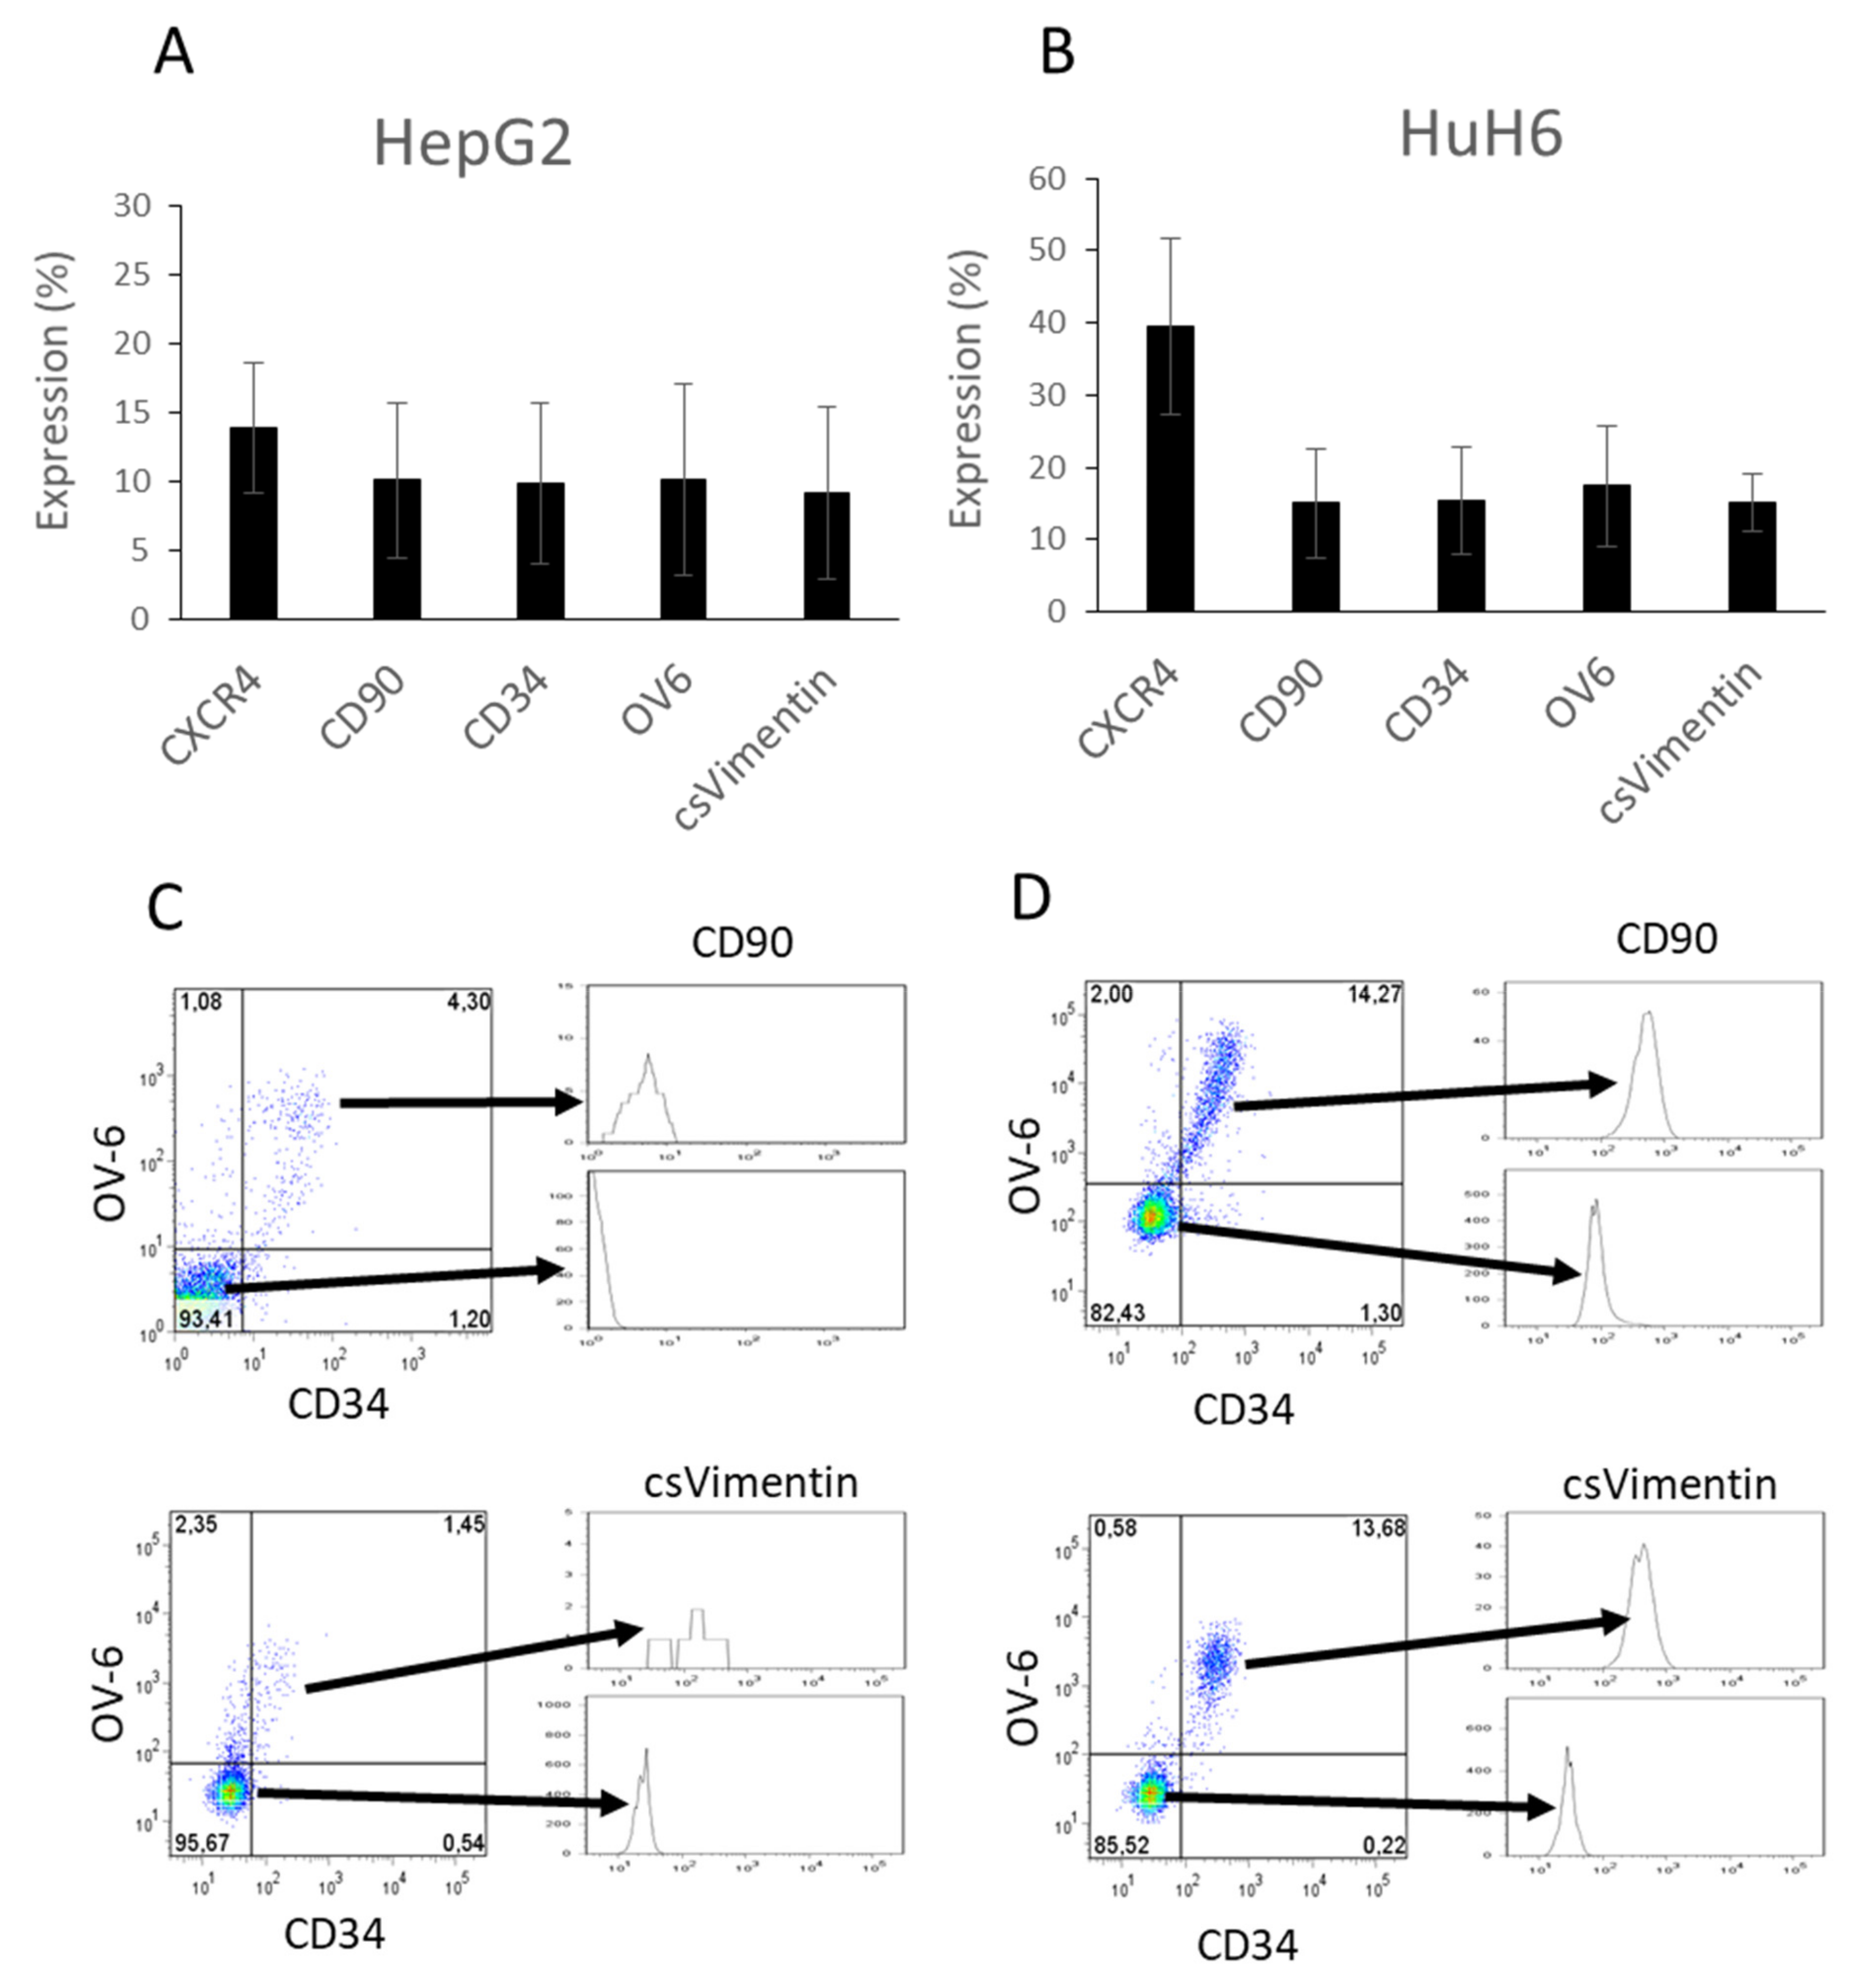
Abstract
:1. Introduction
2. Materials and Methods
2.1. Cell Culture
2.2. MTT (3-(4,5-dimethylthiazol-2-yl)-2,5-diphenyltetrazolium bromide) Assay
2.3. Tumorsphere Assay
2.4. Flow Cytometry
2.5. Migration Assay
2.6. RNA Extraction and Transcription Analysis Using Real-Time PCR
2.7. Statistical Analysis
3. Results
3.1. Cancer Stem Cell Markers CD34, CD90, OV-6 and Cell-Surface Vimentin Were Co-Expressed on a Subset of Hepatoblastoma Cells
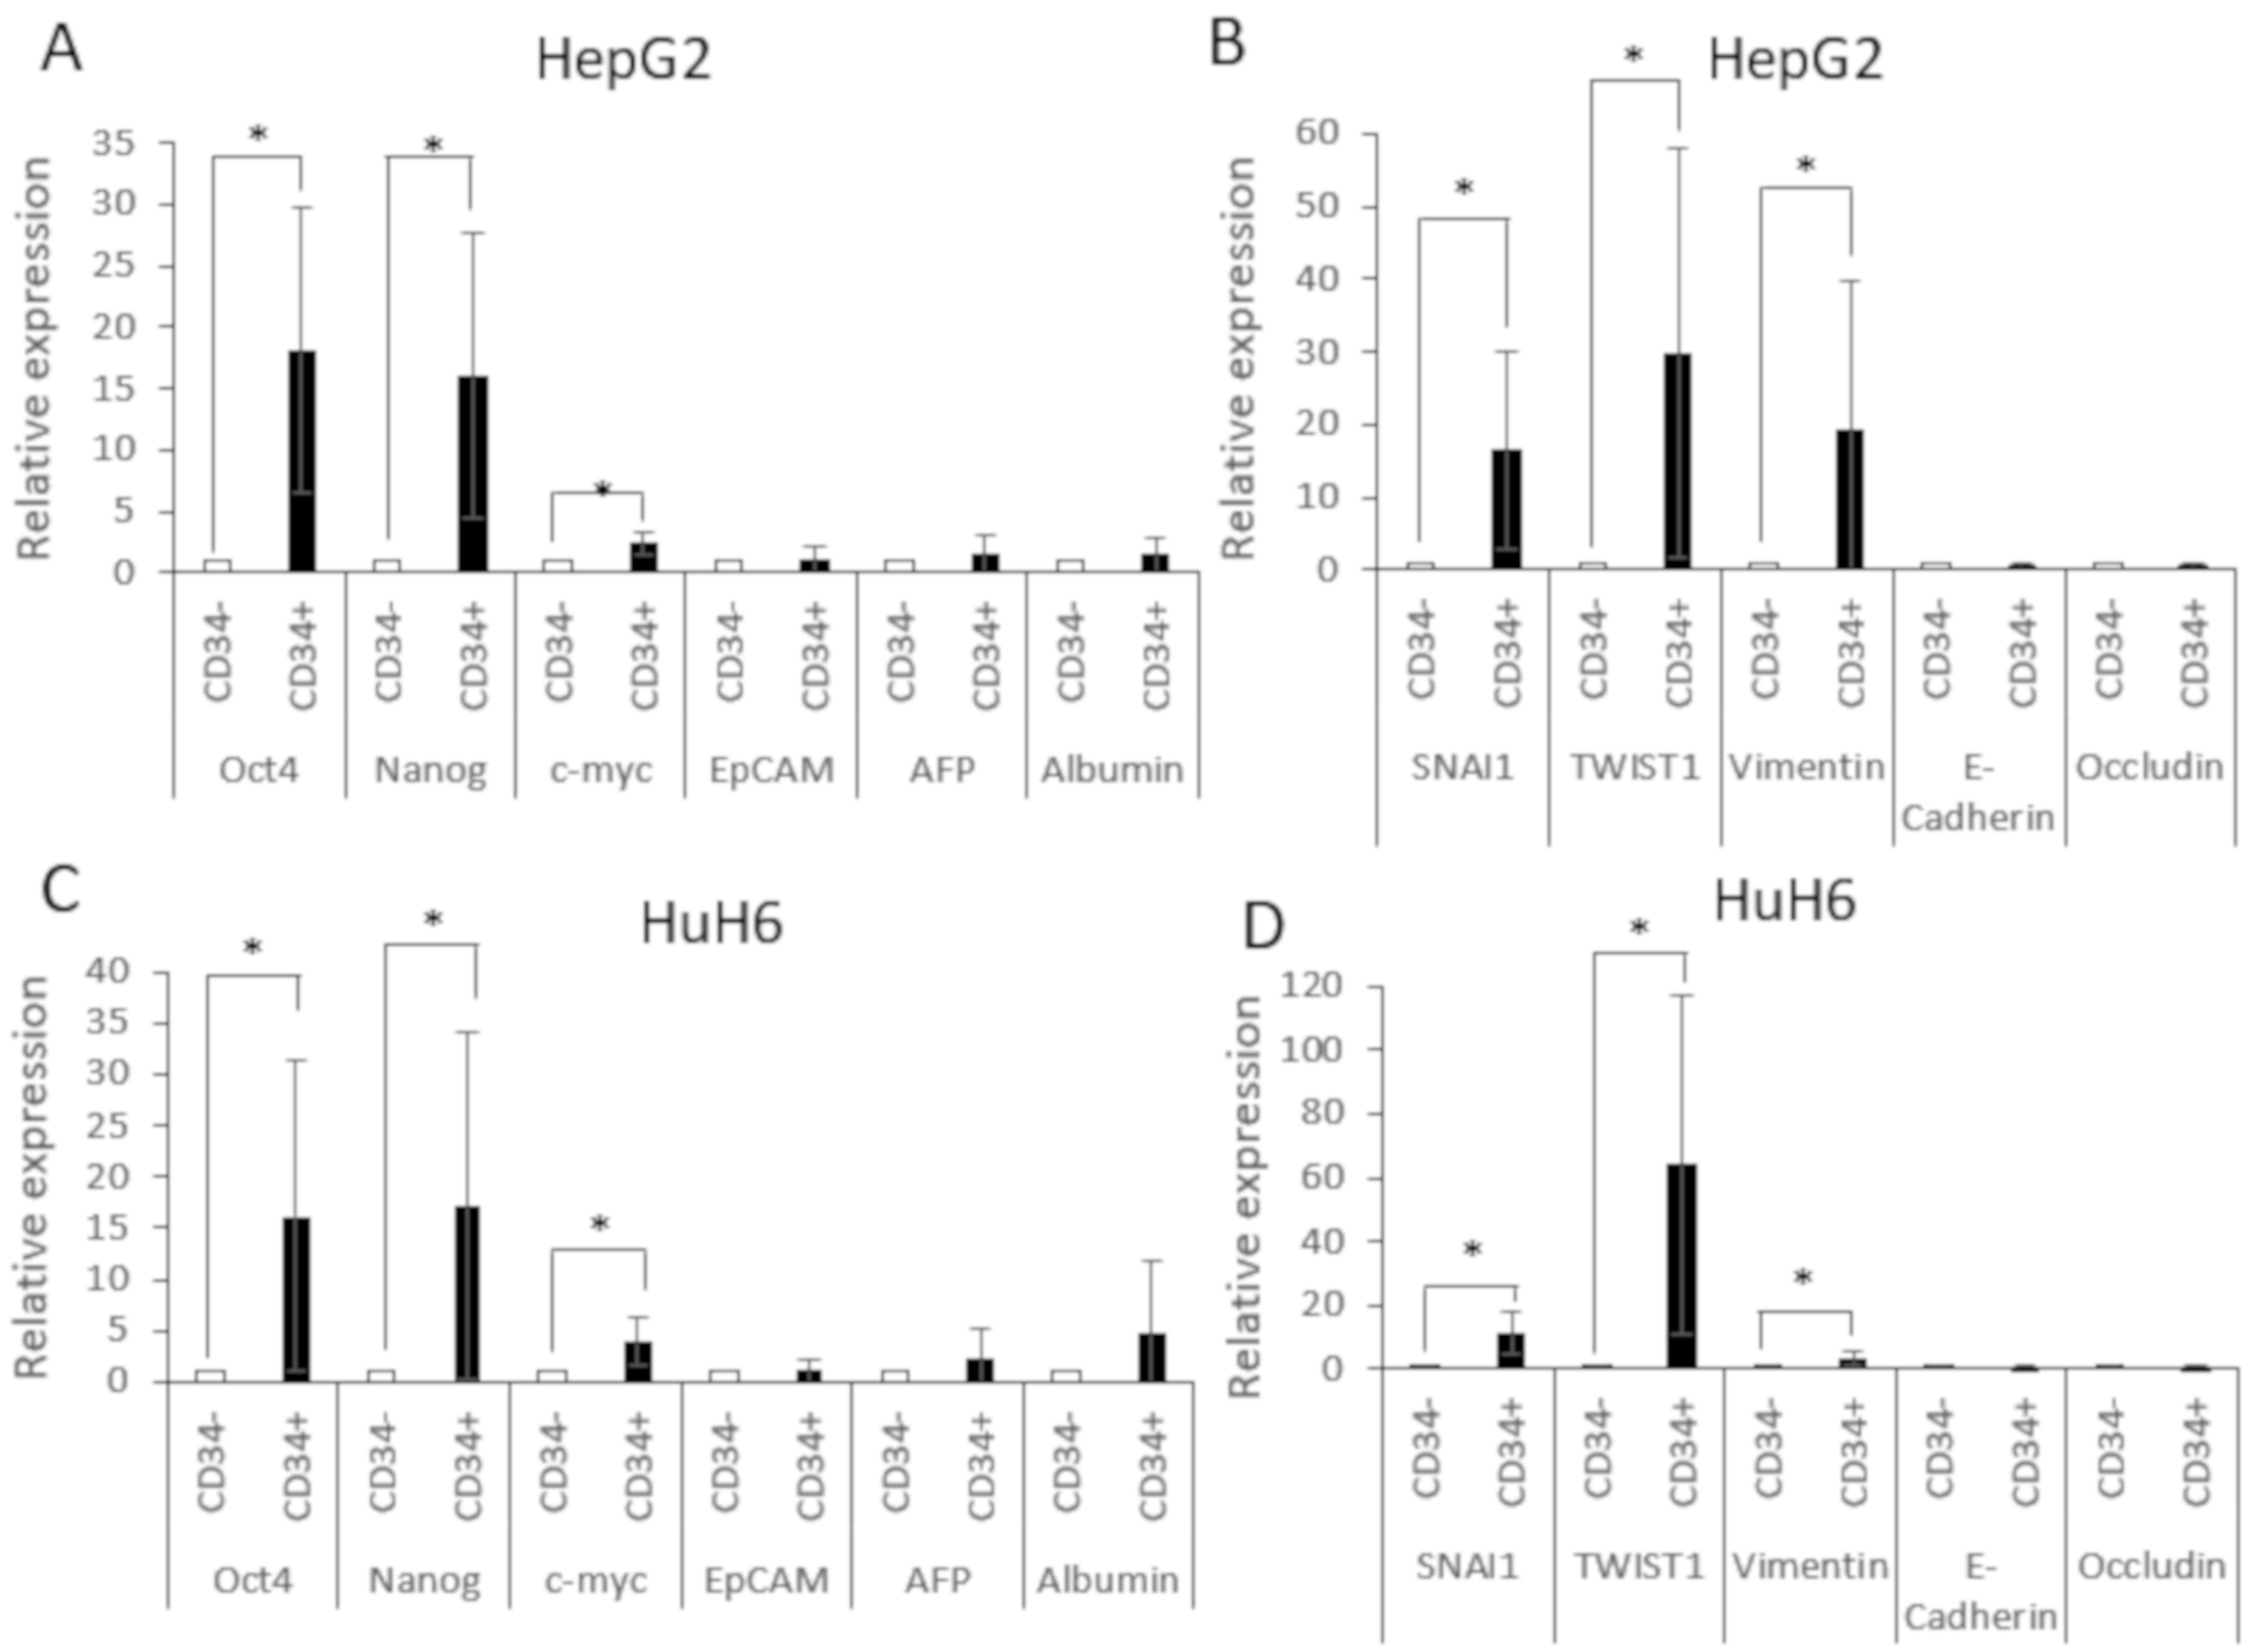
3.2. CD34+CD90+OV-6+csVimentin+ Subset Revealed Pluripotency Features and Increased Expression of EMT Markers
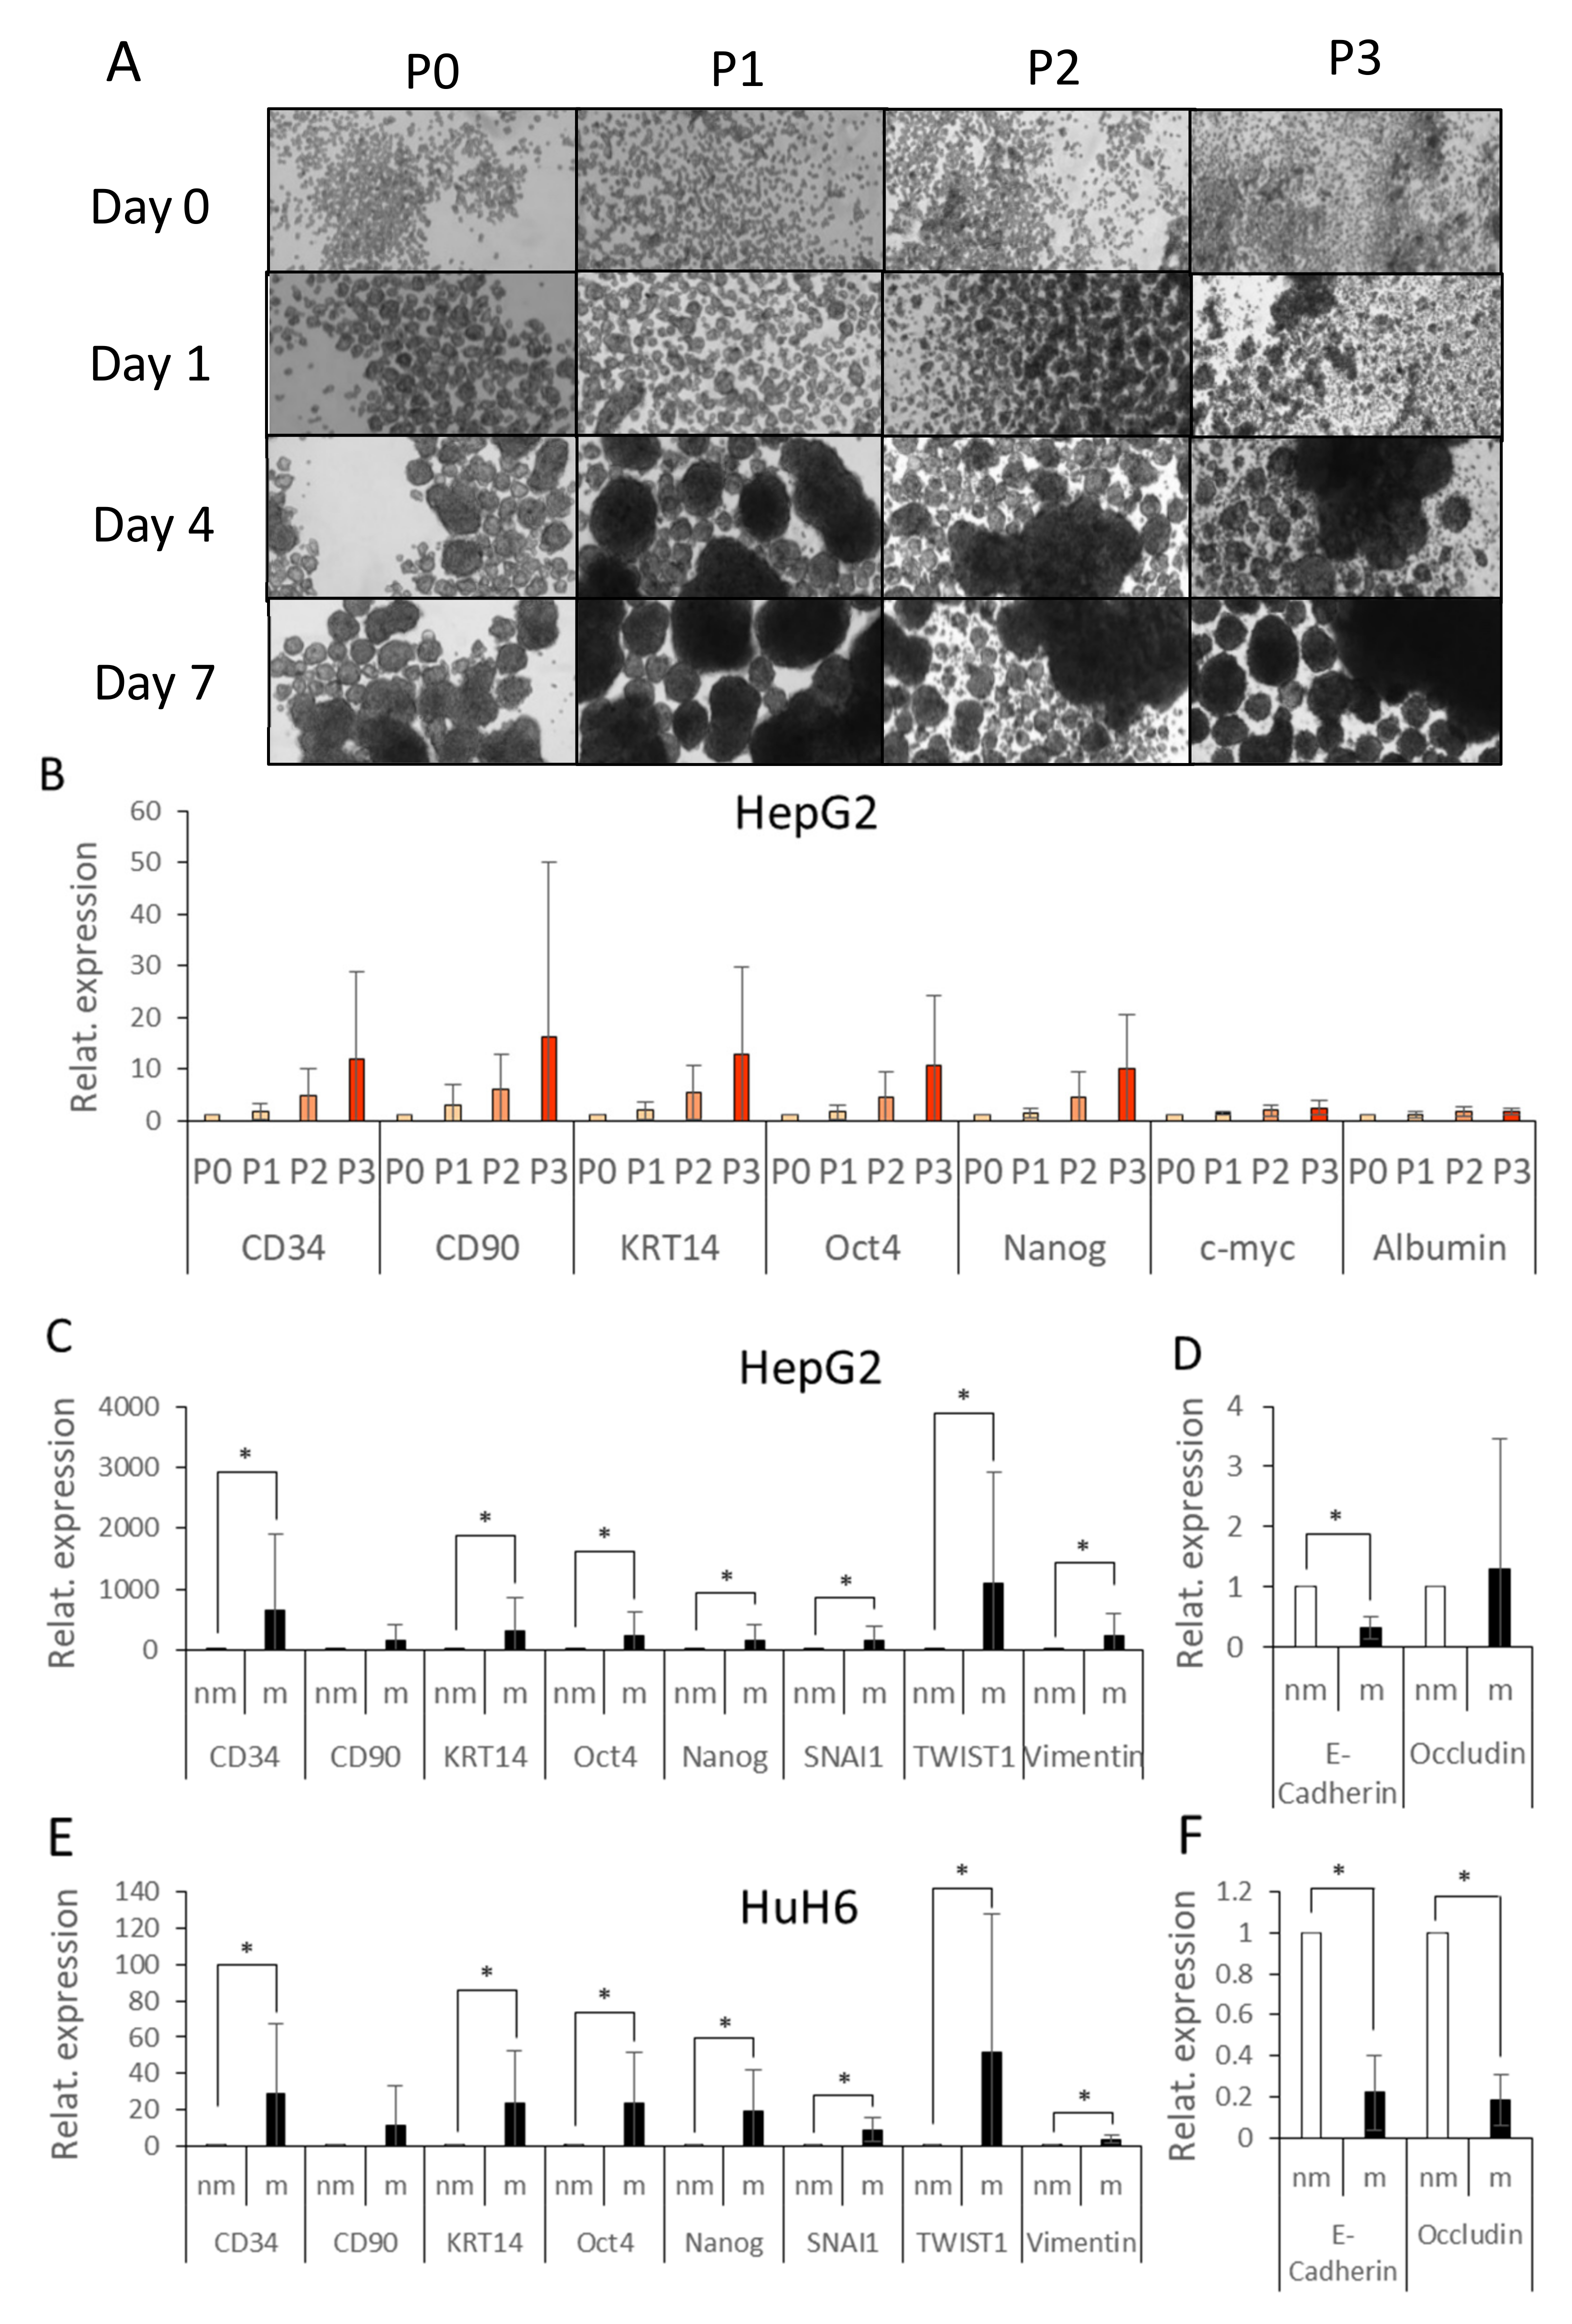
3.3. CD34+CD90+OV-6+csVimentin+ Cells Showed Self-Renewal Ability and Increased Migration Behavior
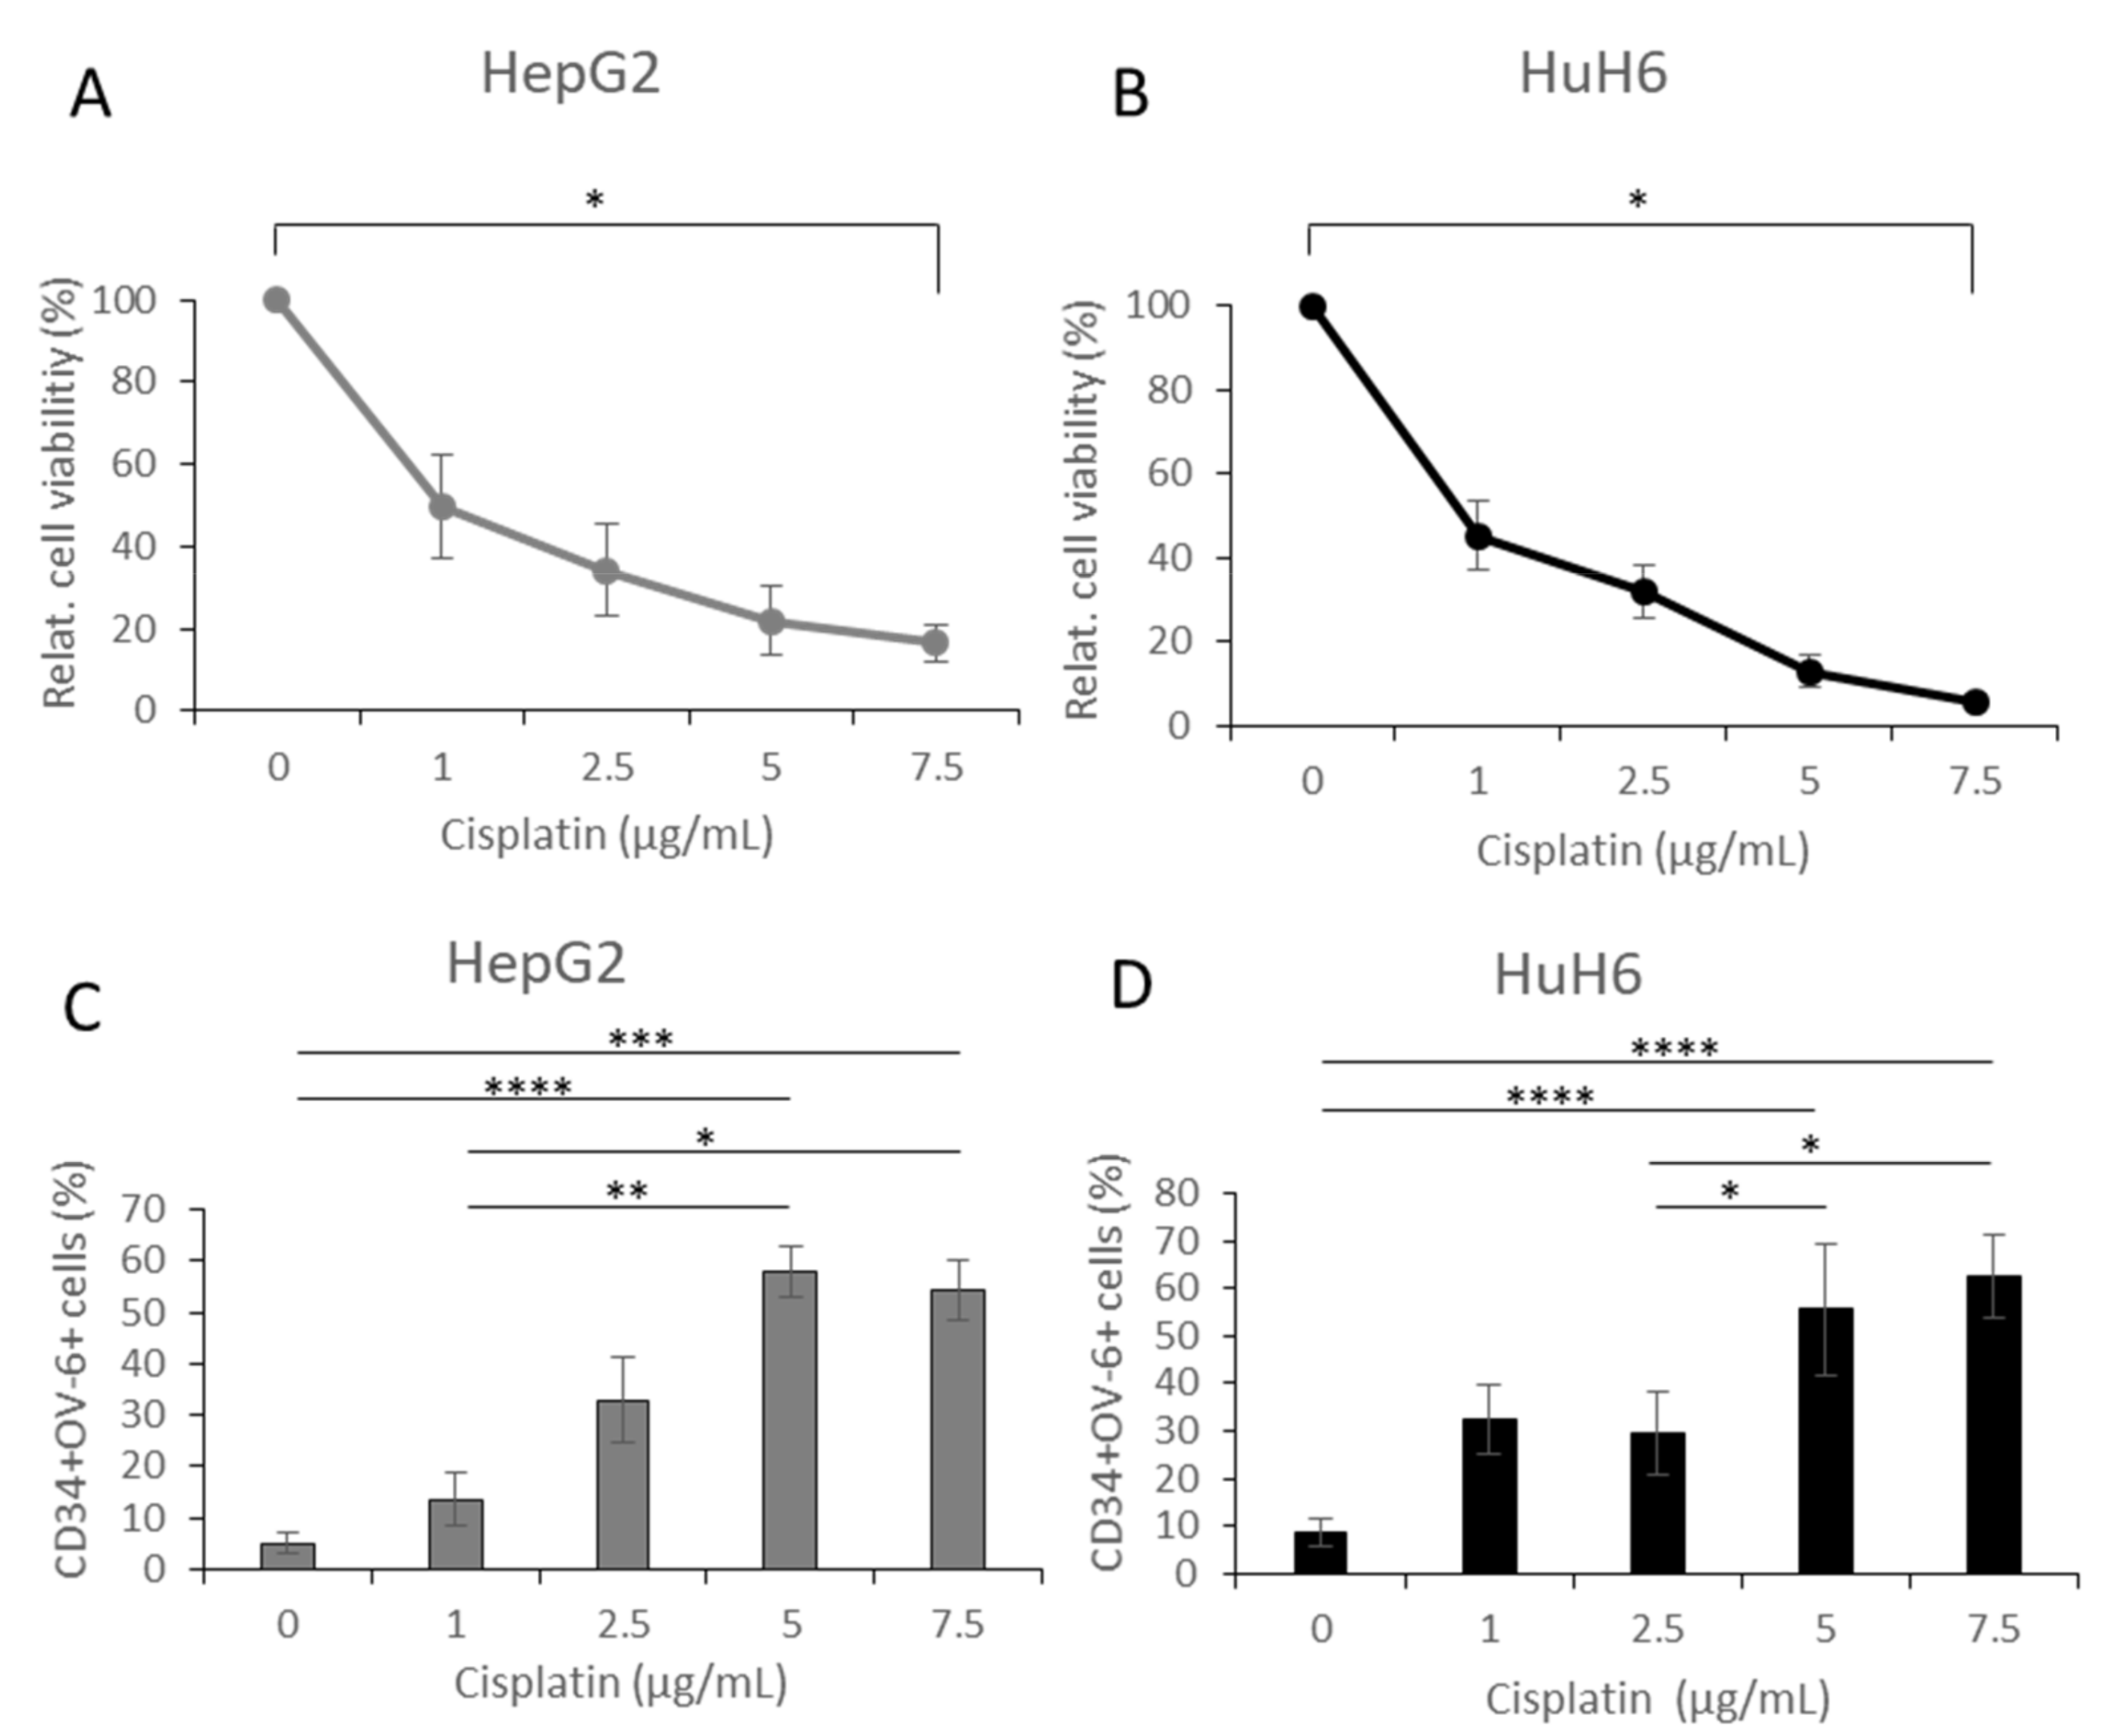
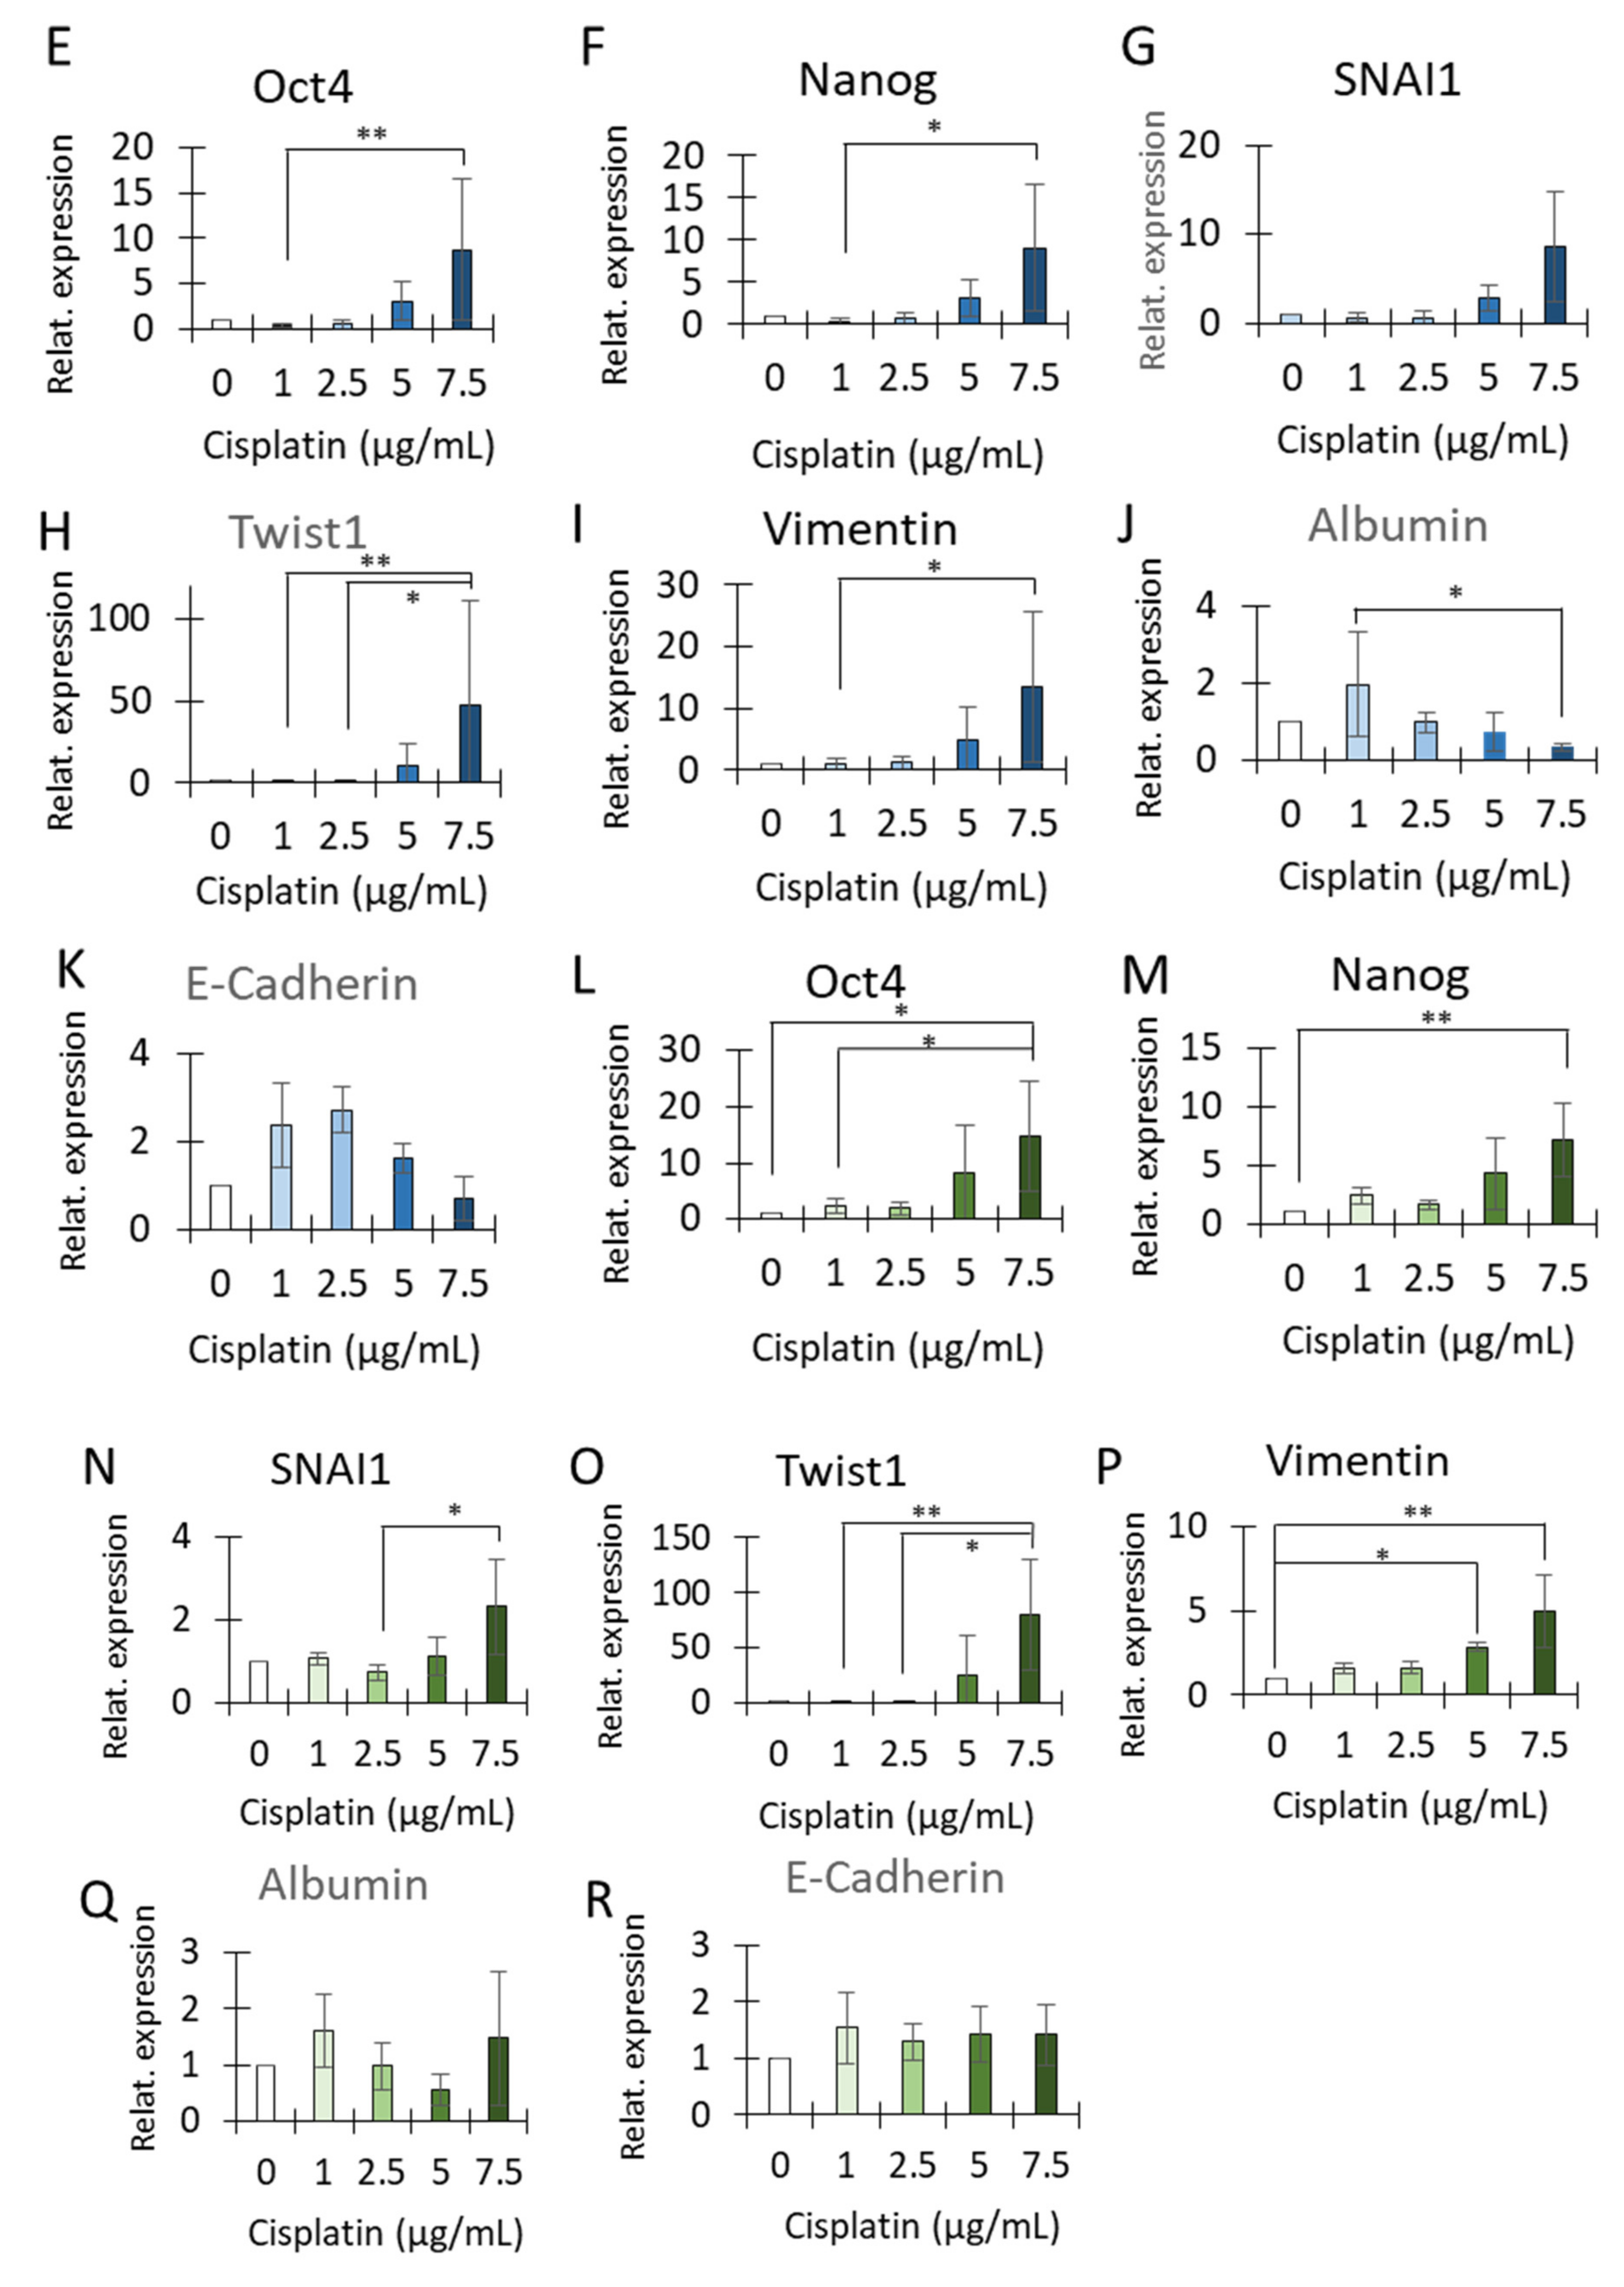
3.4. Cisplatin Treatment Caused Positive Selection of CD34+CD90+OV-6+csVimentin+ Cells
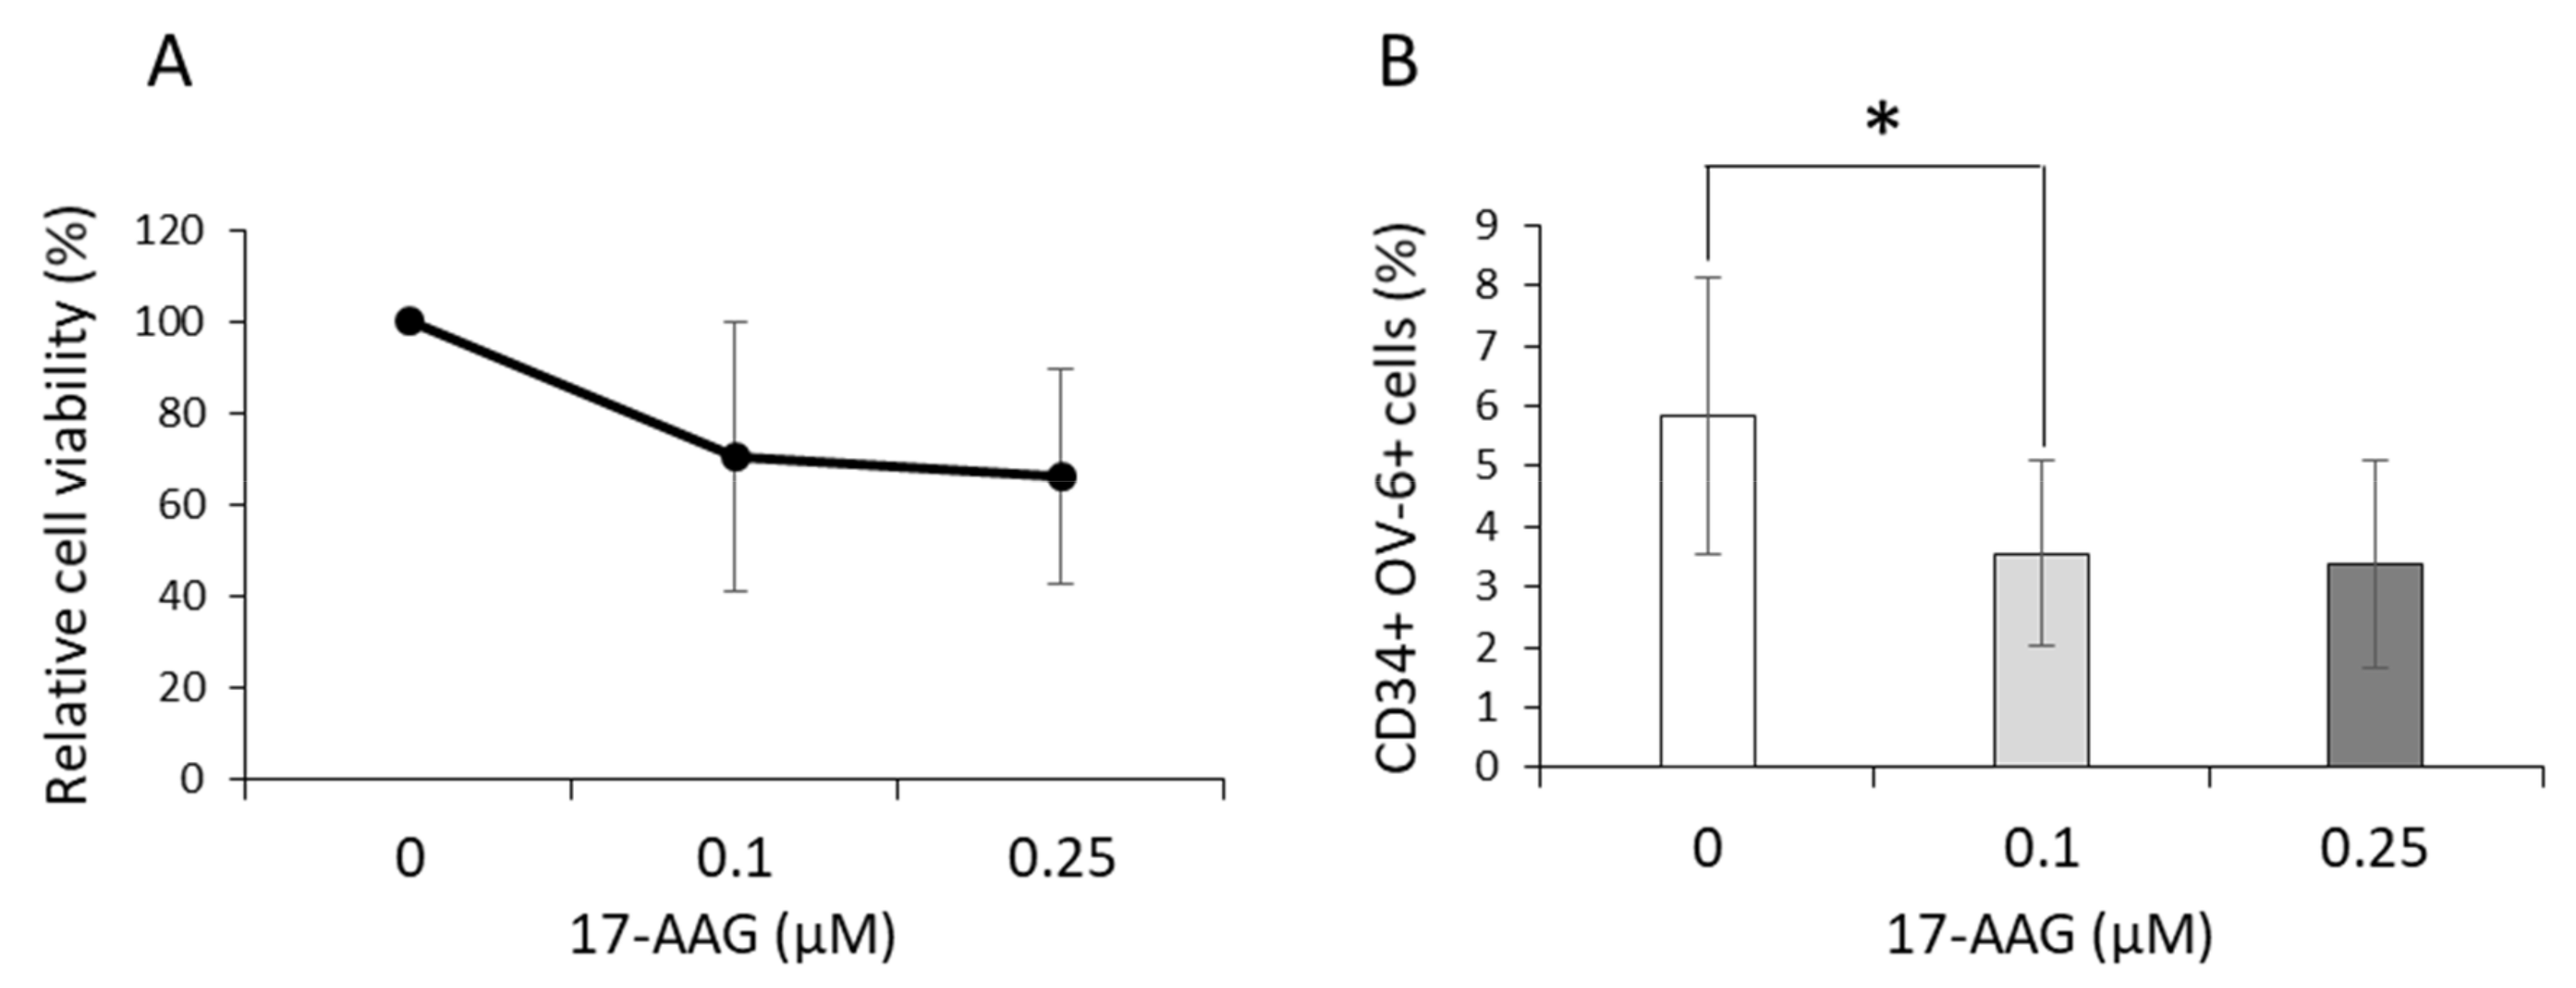
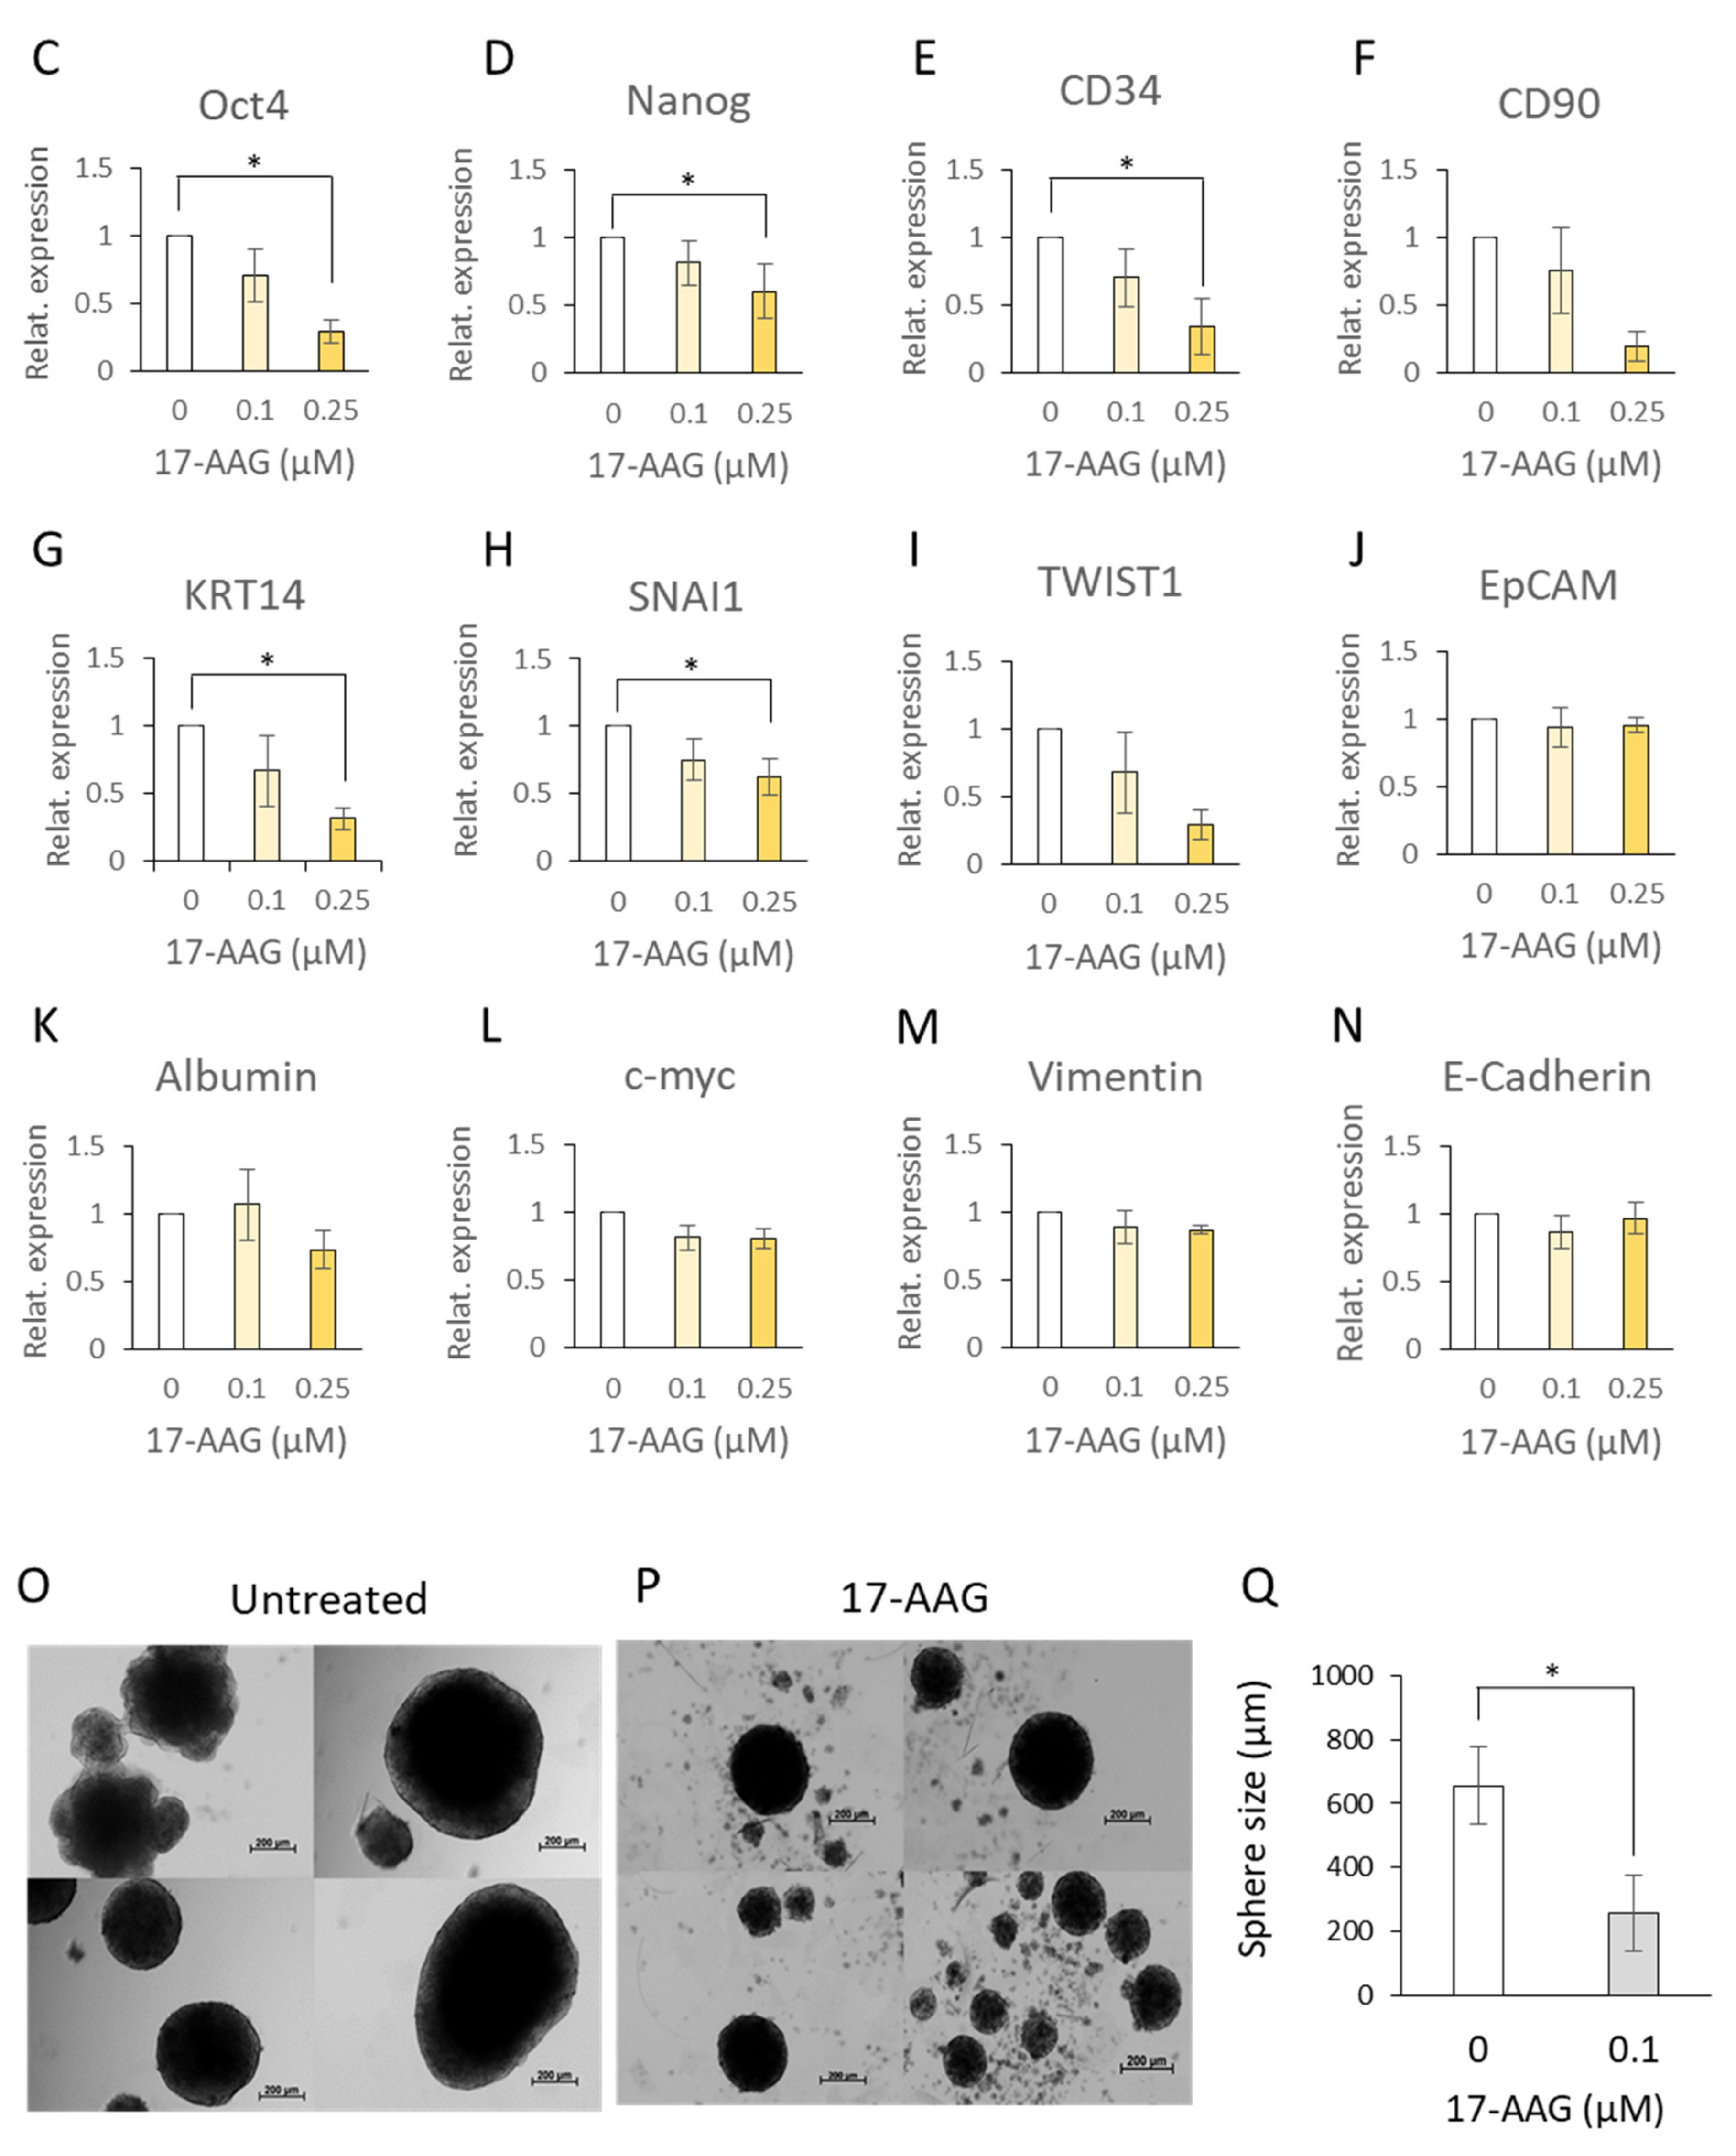
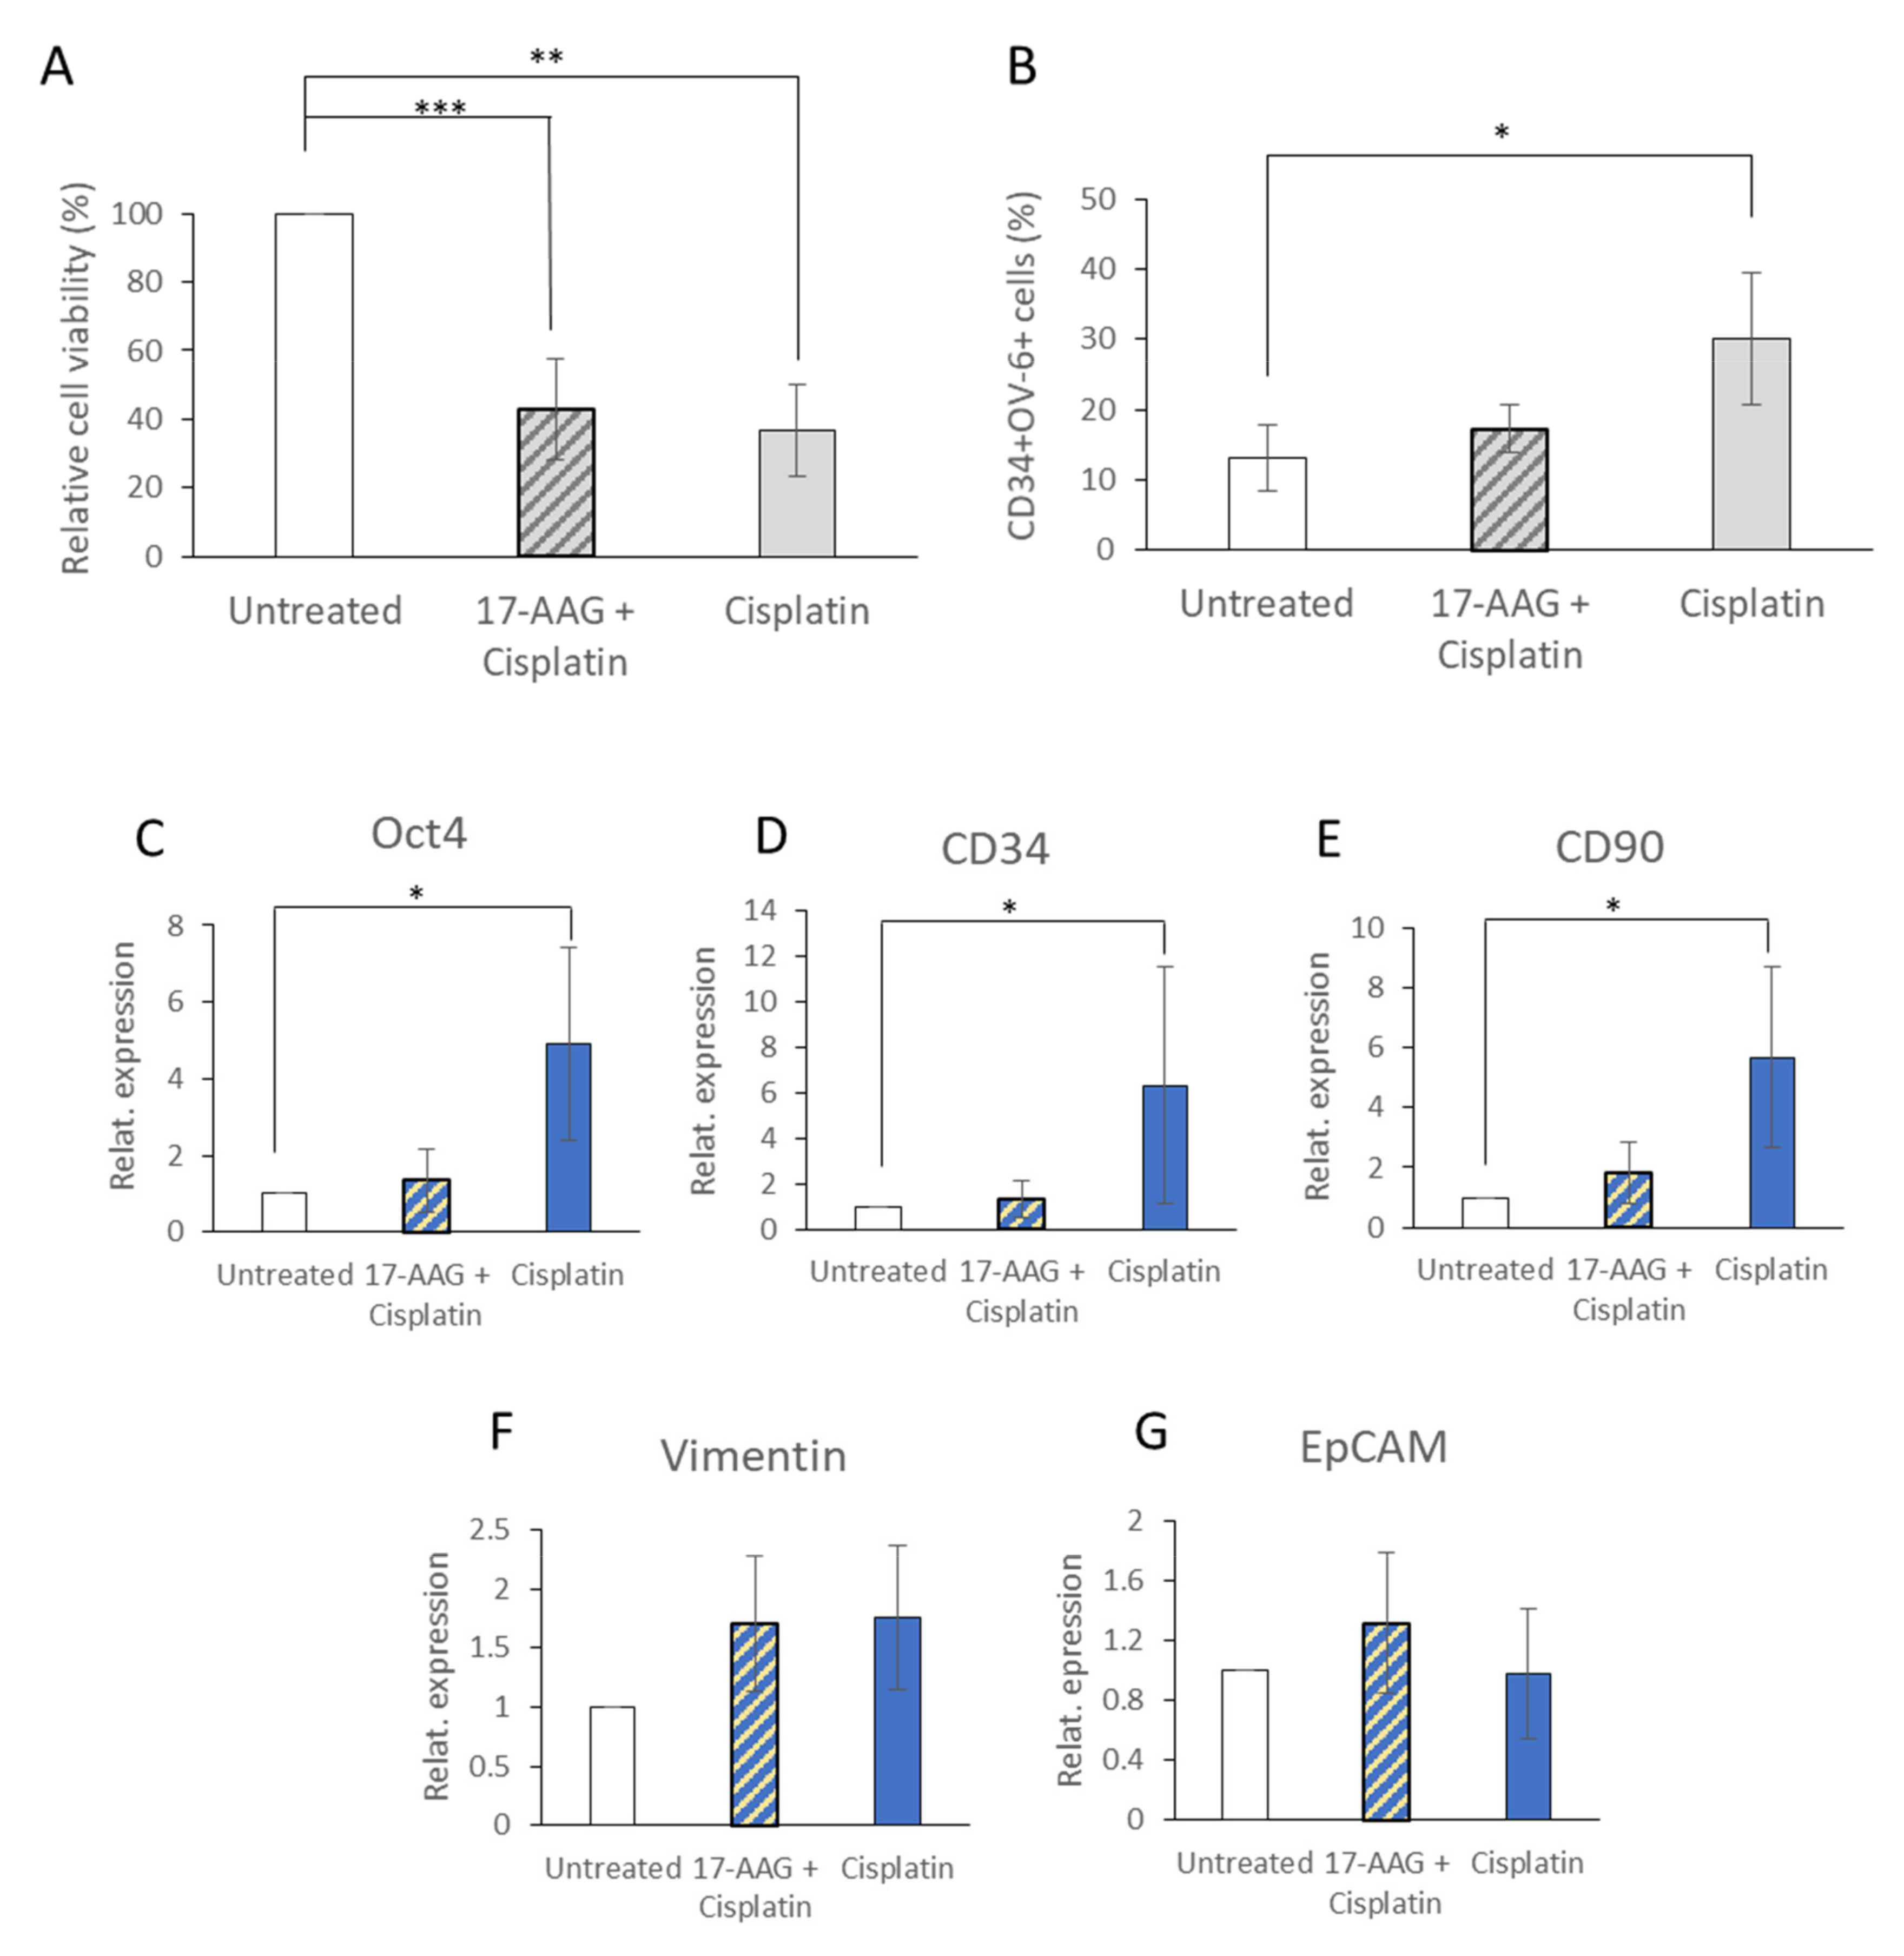
3.5. 17-AAG Affected the CD34+CD90+OV-6+csVimentin+ Subset
4. Discussion
5. Conclusions
Supplementary Materials
Author Contributions
Funding
Institutional Review Board Statement
Informed Consent Statement
Data Availability Statement
Acknowledgments
Conflicts of Interest
References
- Czauderna, P.; Lopez-Terrada, D.; Hiyama, E.; Haberle, B.; Malogolowkin, M.H.; Meyers, R.L. Hepatoblastoma state of the art: Pathology, genetics, risk stratification, and chemotherapy. Curr. Opin. Pediatr. 2014, 26, 19–28. [Google Scholar] [CrossRef]
- Ruck, P.; Xiao, J.C.; Pietsch, T.; Von Schweinitz, D.; Kaiserling, E. Hepatic stem-like cells in hepatoblastoma: Expression of cytokeratin 7, albumin and oval cell associated antigens detected by OV-1 and OV-6. Histopathology 1997, 31, 324–329. [Google Scholar] [CrossRef]
- Kim, L.; Park, Y.N.; Kim, S.E.; Noh, T.W.; Park, C. Teratoid hepatoblastoma: Multidirectional differentiation of stem cell of the liver. Yonsei Med. J. 2001, 42, 431–435. [Google Scholar] [CrossRef]
- Fiegel, H.C.; Gluer, S.; Roth, B.; Rischewski, J.; Von Schweinitz, D.; Ure, B.; Lambrecht, W.; Kluth, D. Stem-like cells in human hepatoblastoma. J. Histochem. Cytochem. 2004, 52, 1495–1501. [Google Scholar] [CrossRef] [Green Version]
- Lim, I.I.P.; Bondoc, A.J.; Geller, J.I.; Tiao, G.M. Hepatoblastoma-The Evolution of Biology, Surgery, and Transplantation. Children 2018, 6, 1. [Google Scholar] [CrossRef] [Green Version]
- Batlle, E.; Clevers, H. Cancer stem cells revisited. Nat. Med. 2017, 23, 1124–1134. [Google Scholar] [CrossRef]
- Thorgeirsson, S.S. Stemness and reprogramming in liver cancer. Hepatology 2016, 63, 1068–1070. [Google Scholar] [CrossRef] [Green Version]
- Liu, Y.C.; Yeh, C.T.; Lin, K.H. Cancer Stem Cell Functions in Hepatocellular Carcinoma and Comprehensive Therapeutic Strategies. Cells 2020, 9, 1331. [Google Scholar] [CrossRef]
- Machida, K. Existence of cancer stem cells in hepatocellular carcinoma: Myth or reality? Hepatol. Int. 2017, 11, 143–147. [Google Scholar] [CrossRef] [Green Version]
- Armeanu-Ebinger, S.; Hoh, A.; Wenz, J.; Fuchs, J. Targeting EpCAM (CD326) for immunotherapy in hepatoblastoma. Oncoimmunology 2013, 2, e22620. [Google Scholar] [CrossRef] [Green Version]
- Friedman, G.K.; Gillespie, G.Y. Cancer Stem Cells and Pediatric Solid Tumors. Cancers 2011, 3, 298–318. [Google Scholar] [CrossRef] [Green Version]
- Bahnassy, A.A.; Fawzy, M.; El-Wakil, M.; Zekri, A.R.; Abdel-Sayed, A.; Sheta, M. Aberrant expression of cancer stem cell markers (CD44, CD90, and CD133) contributes to disease progression and reduced survival in hepatoblastoma patients: 4-year survival data. Transl. Res. 2015, 165, 396–406. [Google Scholar] [CrossRef]
- Akita, M.; Tanaka, K.; Murai, N.; Matsumoto, S.; Fujita, K.; Takaki, T.; Nishiyama, H. Detection of CD133 (prominin-1) in a human hepatoblastoma cell line (HuH-6 clone 5). Microsc. Res. Tech. 2013, 76, 844–852. [Google Scholar] [CrossRef] [Green Version]
- Ruck, P.; Xiao, J.C.; Kaiserling, E. Immunoreactivity of sinusoids in hepatoblastoma: An immunohistochemical study using lectin UEA-1 and antibodies against endothelium-associated antigens, including CD34. Histopathology 1995, 26, 451–455. [Google Scholar] [CrossRef]
- Ruck, P.; Xiao, J.C. Stem-like cells in hepatoblastoma. Med. Pediatr. Oncol. 2002, 39, 504–507. [Google Scholar] [CrossRef]
- Dunsford, H.A.; Sell, S. Production of monoclonal antibodies to preneoplastic liver cell populations induced by chemical carcinogens in rats and to transplantable Morris hepatomas. Cancer Res. 1989, 49, 4887–4893. [Google Scholar]
- Mitra, A.; Satelli, A.; Xia, X.; Cutrera, J.; Mishra, L.; Li, S. Cell-surface Vimentin: A mislocalized protein for isolating csVimentin(+) CD133(−) novel stem-like hepatocellular carcinoma cells expressing EMT markers. Int. J. Cancer 2015, 137, 491–496. [Google Scholar] [CrossRef] [Green Version]
- Huet, D.; Bagot, M.; Loyaux, D.; Capdevielle, J.; Conraux, L.; Ferrara, P.; Bensussan, A.; Marie-Cardine, A. SC5 mAb represents a unique tool for the detection of extracellular vimentin as a specific marker of Sezary cells. J. Immunol. 2006, 176, 652–659. [Google Scholar] [CrossRef] [Green Version]
- Sun, Y.; Yoshida, T.; Okabe, M.; Zhou, K.; Wang, F.; Soko, C.; Saito, S.; Nikaido, T. Isolation of Stem-Like Cancer Cells in Primary Endometrial Cancer Using Cell Surface Markers CD133 and CXCR4. Transl. Oncol. 2017, 10, 976–987. [Google Scholar] [CrossRef] [Green Version]
- Yang, W.; Yan, H.X.; Chen, L.; Liu, Q.; He, Y.Q.; Yu, L.X.; Zhang, S.H.; Huang, D.D.; Tang, L.; Kong, X.N.; et al. Wnt/beta-catenin signaling contributes to activation of normal and tumorigenic liver progenitor cells. Cancer Res. 2008, 68, 4287–4295. [Google Scholar] [CrossRef] [Green Version]
- Bhattacharya, R.; Gonzalez, A.M.; Debiase, P.J.; Trejo, H.E.; Goldman, R.D.; Flitney, F.W.; Jones, J.C. Recruitment of vimentin to the cell surface by beta3 integrin and plectin mediates adhesion strength. J. Cell Sci. 2009, 122, 1390–1400. [Google Scholar] [CrossRef] [Green Version]
- Satelli, A.; Li, S. Vimentin in cancer and its potential as a molecular target for cancer therapy. Cell Mol. Life Sci. 2001, 68, 3033–3046. [Google Scholar] [CrossRef] [Green Version]
- Noh, H.; Zhao, Q.; Yan, J.; Kong, L.Y.; Gabrusiewicz, K.; Hong, S.; Xia, X.; Heimberger, A.B.; Li, S. Cell surface vimentin-targeted monoclonal antibody 86C increases sensitivity to temozolomide in glioma stem cells. Cancer Lett. 2018, 433, 176–185. [Google Scholar] [CrossRef]
- Pan, G.J.; Chang, Z.Y.; Scholer, H.R.; Pei, D. Stem cell pluripotency and transcription factor Oct4. Cell Res. 2002, 12, 321–329. [Google Scholar] [CrossRef] [Green Version]
- Pan, G.; Thomson, J.A. Nanog and transcriptional networks in embryonic stem cell pluripotency. Cell Res. 2007, 17, 42–49. [Google Scholar] [CrossRef]
- Van Schaijik, B.; Davis, P.F.; Wickremesekera, A.C.; Tan, S.T.; Itinteang, T. Subcellular localisation of the stem cell markers OCT4, SOX2, NANOG, KLF4 and c-MYC in cancer: A review. J. Clin. Pathol 2018, 71, 88–91. [Google Scholar] [CrossRef]
- Lamouille, S.; Xu, J.; Derynck, R. Molecular mechanisms of epithelial-mesenchymal transition. Nat. Rev. Mol. Cell Biol. 2014, 15, 178–196. [Google Scholar] [CrossRef] [Green Version]
- Zhang, Y.; Wang, Z.; Yu, J.; Shi, J.; Wang, C.; Fu, W.; Chen, Z.; Yang, J. Cancer stem-like cells contribute to cisplatin resistance and progression in bladder cancer. Cancer Lett. 2012, 322, 70–77. [Google Scholar] [CrossRef]
- Zhang, H.; Chang, W.J.; Li, X.Y.; Zhang, N.; Kong, J.J.; Wang, Y.F. Liver cancer stem cells are selectively enriched by low-dose cisplatin. Braz. J. Med. Biol. Res. 2014, 47, 478–482. [Google Scholar] [CrossRef] [Green Version]
- Newman, B.; Liu, Y.; Lee, H.F.; Sun, D.; Wang, Y. HSP90 inhibitor 17-AAG selectively eradicates lymphoma stem cells. Cancer Res. 2012, 72, 4551–4561. [Google Scholar] [CrossRef] [Green Version]
- Li, Y.; Zhang, T.; Schwartz, S.J.; Sun, D. New developments in Hsp90 inhibitors as anti-cancer therapeutics: Mechanisms, clinical perspective and more potential. Drug Resist. Updates 2009, 12, 17–27. [Google Scholar] [CrossRef] [PubMed] [Green Version]
- Whitesell, L.; Lindquist, S.L. HSP90 and the chaperoning of cancer. Nat. Rev. Cancer 2005, 5, 761–772. [Google Scholar] [CrossRef]
- Kamal, A.; Thao, L.; Sensintaffar, J.; Zhang, L.; Boehm, M.F.; Fritz, L.C.; Burrows, F.J. A high-affinity conformation of Hsp90 confers tumour selectivity on Hsp90 inhibitors. Nature 2009, 425, 407–410. [Google Scholar] [CrossRef] [PubMed]
- Usmani, S.Z.; Bona, R.; Li, Z. 17 AAG for HSP90 inhibition in cancer--from bench to bedside. Curr. Mol. Med. 2009, 9, 654–664. [Google Scholar] [CrossRef]
- Shu, X.; Liu, H.; Zhen, R.; Jie, Y.; Chen, L.; Qi, H.; Wang, C.; Wang, R.; Chen, D.; Ran, Y. Hsp90 inhibitor 17AAG inhibits stem celllike properties and chemoresistance in osteosarcoma cells via the Hedgehog signaling pathway. Oncol. Rep. 2020, 44, 313–324. [Google Scholar] [CrossRef]
- Weigel, B.J.; Blaney, S.M.; Reid, J.M.; Safgren, S.L.; Bagatell, R.; Kersey, J.; Neglia, J.P.; Ivy, S.P.; Ingle, A.M.; Whitesell, L.; et al. A phase I study of 17-allylaminogeldanamycin in relapsed/refractory pediatric patients with solid tumors: A Children’s Oncology Group study. Clin. Cancer Res. 2007, 13, 1789–1793. [Google Scholar] [CrossRef] [Green Version]


Publisher’s Note: MDPI stays neutral with regard to jurisdictional claims in published maps and institutional affiliations. |
© 2021 by the authors. Licensee MDPI, Basel, Switzerland. This article is an open access article distributed under the terms and conditions of the Creative Commons Attribution (CC BY) license (https://creativecommons.org/licenses/by/4.0/).
Share and Cite
Lee-Theilen, M.; Hadhoud, J.R.; Volante, G.; Fadini, D.D.; Eichhorn, J.; Rolle, U.; Fiegel, H.C. Co-Expression of CD34, CD90, OV-6 and Cell-Surface Vimentin Defines Cancer Stem Cells of Hepatoblastoma, Which Are Affected by Hsp90 Inhibitor 17-AAG. Cells 2021, 10, 2598. https://doi.org/10.3390/cells10102598
Lee-Theilen M, Hadhoud JR, Volante G, Fadini DD, Eichhorn J, Rolle U, Fiegel HC. Co-Expression of CD34, CD90, OV-6 and Cell-Surface Vimentin Defines Cancer Stem Cells of Hepatoblastoma, Which Are Affected by Hsp90 Inhibitor 17-AAG. Cells. 2021; 10(10):2598. https://doi.org/10.3390/cells10102598
Chicago/Turabian StyleLee-Theilen, Mieun, Julia R. Hadhoud, Giulietta Volante, Delaine D. Fadini, Julia Eichhorn, Udo Rolle, and Henning C. Fiegel. 2021. "Co-Expression of CD34, CD90, OV-6 and Cell-Surface Vimentin Defines Cancer Stem Cells of Hepatoblastoma, Which Are Affected by Hsp90 Inhibitor 17-AAG" Cells 10, no. 10: 2598. https://doi.org/10.3390/cells10102598