Article

Impact of Different Shading Levels on Growth, Yield and Quality of Potato (Solanum tuberosum L.)

by
Vanessa S. Schulz
1,*,
Sebastian Munz
1,
Kerstin Stolzenburg
2,
Jens Hartung
1,
Sebastian Weisenburger
2 and
Simone Graeff-Hönninger
1
1
Department of Agronomy (340), Institute for Crop Science, University of Hohenheim, 70599 Stuttgart, Germany
2
Centre for Agricultural Technology Augustenberg (LTZ), 76287 Rheinstetten-Forchheim, Germany
*
Author to whom correspondence should be addressed.
Agronomy 2019, 9(6), 330; https://doi.org/10.3390/agronomy9060330
Submission received: 17 April 2019 / Revised: 15 June 2019 / Accepted: 18 June 2019 / Published: 21 June 2019
(This article belongs to the Special Issue Sustainable Cropping Systems)

Abstract

:
In agroforestry systems (AFS), trees shade the understory crop to a certain extent. Potato is considered a shade-tolerant crop and was thus tested under the given total solar irradiance and climatic conditions of Southwestern Germany for its potential suitability in an AFS. To gain a better understanding of the effects of shade on growth, yield and quality; a three-year field experiment with different artificial shading levels (12%, 26% and 50%) was established. Significant changes in growth occurred at 50% shading. While plant emergence was not affected by shade, flowering was slightly delayed by about three days. Days until senescence also showed a delay under 50% shade. The number of tubers per plant and tuber mass per plant were reduced by about 53% and 69% under 50% shade. Depending on the year, tuber dry matter yield showed a decrease of 19–44% at 50% shade, while starch content showed no significant differences under shade compared to unshaded treatment. The number of stems per plant, plant height and foliage mass per plant as well as tuber fraction, black spot bruise and macronutrient content were unaffected. Overall, potato seems to tolerate shading and can therefore be integrated in an AFS, and can cope with a reduced total irradiance up to 26%.

1. Introduction

Due to increasing pressure on cultivated land, intercropping systems may provide an alternative option of economic and environmental interest in temperate regions. Research on temperate intercropping peaked in the 1980s, and was focused on the promotion of sustainable agricultural management strategies [1,2]. These past studies presented intercropping systems as ecologically advantageous when compared to monocultures. Intercropping allows more efficient use of land area, changes the microclimate, improves the biodiversity, offers economic diversity, creates wildlife habitats, and minimizes climate variabilities [3,4,5]. Within the past decade, research on temperate intercropping has increased because it is considered as an effective strategy to mitigate food insecurities and agriculture-related environmental degradation of land and water. This increased interest is partially associated with recent technological advancements, which improve the labor efficiency potential of the practice [6].
A special form of intercropping is the agroforestry system (AFS). These systems combine an annual agricultural component (crop or livestock production) with a perennial woody component (trees, hedgerows) at the same time on the same area of land [7,8,9]. The advantages of AFS include increased carbon sequestration, improved water regulation, better soil fertility, reduced erosion, and additional aesthetic value [10,11,12,13]. However, in most silvoarable agroforestry systems (a combination of annual crop production with woody perennials), competition not only exists aboveground (competition for light), but also comes from belowground (competition for soil moisture and nutrients), both of which may lead to lower crop yields.
Worldwide, there are numerous options for combining trees and crops in AFS (e.g., alley cropping, forest farming, riparian buffer, silvopasture or windbreaks) [14]. However, most of these systems show a reduction in crop yields due to tree competition, especially when the plantation design is too dense. An example of an AFS is apple trees (Malus pumila Mill.) with soybean (Glycine max L. Merr.) and peanut (Arachis hypogaea L.) in the Loess Plateau region of China. The yields were reduced by about 3–4% in 2.5 m distances to the tree trunk, respectively [15]. An AFS of jujube trees (Ziziphus jujube Mill.) and wheat (Triticum aestivum L.) in northwest China showed a grain yield reduction of 18% under 4-year-old trees planted with a row distance of 6 m, and a yield reduction of 30% under 6-year-old trees planted with a 3 m row distance compared with the unshaded control [16]. Other experiments with maize (Zea mays L.) and beans (Phaseolus spp. L.) grown between 15 m wide rows of Paulownia trees (Paulownia elongate S. Y. Hu) showed reduced grain yields of 32% and 37%, respectively [17]. Rice (Oryza sativa L.) or wheat grown in a 20 m x 20 m field in Western Himalaya together with one row of Grewia optiva (J.R. Drumm. ex Burret), Morus alba (L.) or Eucalyptus spp. hybrids (L’Hér.) in the center of the field, reduced yields of rice by 28–34% and of wheat by 28–29% compared with the control without trees [18]. Beans (Phaseolus vulgaris L.) grown under Timor Mountain Gum (Eucalypthus urophylla S.T. Blake) in Brazil showed significantly reduced bean yields of almost 50% [19].
Most of these studies examined the reduction of incident radiation as the main factor for reduced yields [15,18,20,21], thus studying the use of shade tolerant crops in an AFS could be advantageous. Such crops are able to reach their light saturation point at lower total solar irradiance, have a better yield performance under shade, and therefore, can be grown in an AFS.
Potato (Solanum tuberosum L.) is known to be a shade-tolerant crop. As a C3 plant, potato needs moderate irradiance conditions [22]. Its light saturation point for photosynthetically active radiation (PAR) is considered to be around 400 µmol m−2 s−1, which corresponds to 14.86 MJ m−2 day−1 [23]. Especially in tropical and subtropical zones (0–23.5° N/S and 23.5–40° N/S latitude) where potato can be grown throughout the year and radiation is up to 30 MJ m−2 day−1, potato is quite often integrated in an AFS. Studies from Nigeria, Kenya and South Asia show only minor effects on yield by tree shading in AFS.
An experiment in Nigeria showed that growing potato (Solanum tuberosum L.) between rows of rattle trees (Albizia lebbeck L. Enth.) increased the tuber yield and the number of tubers [24]. Under unfertilized, open field conditions in Kenya, potatoes also obtained higher yields in an AFS with Eucalyptus grandis (W. Hill ex Maiden) [25]. An Indonesian experiment that used artificial shading showed that plant height and tuber yield increased under 50% light reduction, compared with full sunlight. The height of some potato cultivars was affected by artificial shade [22]. Such changes in plant height represent a shade avoidance response, with plant height increasing under shade to reach more light. This stimulates the plants and leads to height growth and elongation to obtain more irradiation [26]. In Egypt, taller plants were obtained under colored nets in comparison to the open field [27]. Earlier experiments in Egypt on potatoes found that potatoes grown under low irradiance were taller, but the tubers were smaller and irregularly shaped. Furthermore, the tuber dry weight was reduced under low light conditions [28].
It has been proven that the duration of each potato growth phase determines the later yield [29]. In the tropics and subtropics, there is still enough radiation (even under shady AFS conditions) available to reach the light saturation point of potato. However, it might not be reached at higher latitudes. In the temperate zone of Europe where the growing season lasts from March to October, the amount of radiation available is between 10–20 MJ m−2 day−1 [30]. Since light has a decisive influence on plant growth, yield is reduced by shade and lower total solar irradiance in higher latitudes, while in lower latitudes competition for water and nutrients has a major effect. So far, little research is available on the impact of shady conditions at higher latitudes on the growth, yield and quality of potato in an AFS under non-tropical conditions. In the few studies on AFS with potatoes in temperate (potatoes and hazel (Corylus avellane (L.)) and subarctic zones (potatoes and willow (Salix sp. (L.)), experiments have mainly focused on potato cultivation beside windbreaks [31,32,33]. Beside these windbreaks, other abiotic factors such as wind reduction, reduced soil evaporation, reduction of mechanical stimulus (e.g., twisting of plants) have an influence on growth and yield, and water and nutrients are also affected. In an AFS, these interactions make it difficult to determine the influence of shade. Therefore, the influence of shade has to be determined by artificial shading.
The objectives of this study were to evaluate the impact of four different shade levels (0%, 12%, 26% and 50%) on potato growth, tuber yield and quality parameters under the given total solar irradiance of Southwestern Germany. The determined threshold could be an indicator for farmers as to which level of shade potato cultivation might be profitable. Fertilization or irrigation can compensate for some limitations, but a reduction in light cannot be mitigated.

2. Materials and Methods

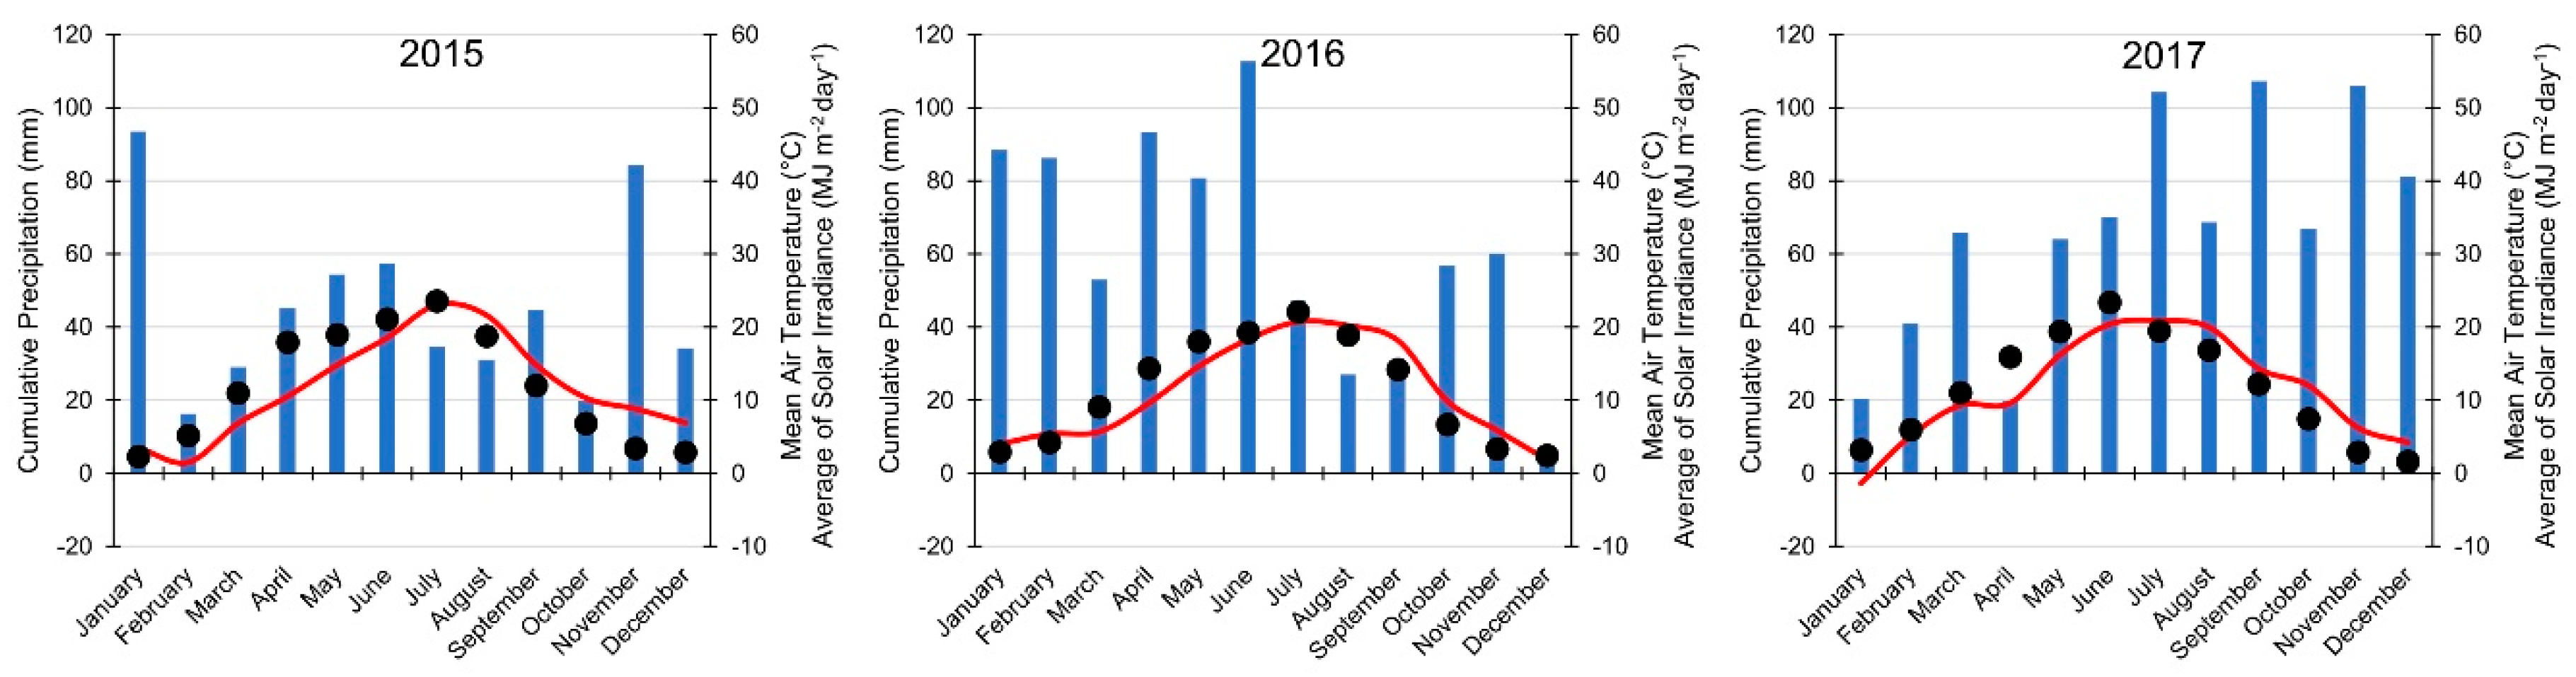
2.1. Site Conditions and Experimental Design

The field experiment was carried out from 2015 to 2017 in Southwest Germany at the Centre for Agricultural Technology Augustenberg (LTZ) in Rheinstetten-Forchheim (48°58′ N, 8°18′ E, 117 m above sea level). The site is located in the lower Rhine valley on a Luvisol (60.2% sand, 13.7% clay and 26.1% silt) soil. The mean long-term annual precipitation was 742 mm and the average temperature was 10.1 °C (1981–1990). During the main growing season at this site (April to October), the mean average total solar irradiance from 2009 to 2017 amounted to 17 MJ m−2 day−1. Weather data were collected in a linear distance of 270 m from the experimental site. Total solar irradiance was measured by a SCAPP (scanning pyrheliometer and pyranometer, Fa. Siggelkow Gerätebau, Hamburg). The monthly air temperature averages, cumulative precipitation and average total solar irradiance for the experimental years are given in Figure 1. In all of the experimental years, the previous crop was winter barley. Different green manure crops were incorporated in the potato experimental plots during the winter months of each experimental year. Green manure crops included 25 kg ha−1 Sinapsis alba L. in 2014/2015, 18 kg ha−1 flower mixture (FAKT M2, BSV Saaten; 20.0% leguminosae, 6.0% rough leguminosae, 27.5% herbs, 46.5% others [34]) in 2015/2016 and 25 kg ha−1 Raphanus sativus L. cv. ‘Denfender’ in 2016/2017.
On 20 September 2014 (day of the year (DOY) 263), primary tillage was done with a moldboard plough (25 cm depth). Potatoes were planted on 16 April 2015 (DOY 106), 13 April 2016 (DOY 104) and 13 April 2017 (DOY 103) after secondary tillage with a chisel plow (15 cm depth). The mid-early potato variety ‘Selma’ (Solanum tuberosum L., Bavaria Saat) was planted with a row distance of 0.75 m and an intra-row distance of 0.35 m, which resulted in four plants per m2. The experimental design was a randomized complete block design with three replicates. Plots were 10 m long and 6 m wide, consisting of a total of 8 rows per plot. Core plots for tuber harvest were 8 m long and 1.5 m wide, including two rows and leaving three rows on the left and right as a border. Planting depth was 5 cm. Hoeing and earthing up was done prior to pre-emergence herbicide application. Amount of fertilizer was calculated based on nutrient removal. The date, amount and type of fertilizer is shown in Table 1. Fertilization was done by a pneumatic centrifugal spreader (RAUCH AERO 2212, Sinzheim, Germany). Plant protection was done based on the risk assessment of the online tool ‘ISIP’ [35]. The amount and type of pesticides are given in Table A1 in the Appendix A. Plant protection was conducted according to the codes of “Good Agricultural Practice in Plant Protection and Fertilization” [36]. Irrigation was done by an overhead irrigation-gun on 29 May 2015 (DOY 149), 29 June 2015 (DOY 180), 7 July 2015 (DOY 188), 16 July 2015 (DOY 197), 3 August 2015 (DOY 215), 7 July 2016 (DOY 189), 13 July 2016 (DOY 195), 29 July 2016 (DOY 211), 12 August 2016 (DOY 225), 31 August 2016 (DOY 244), 31 May 2017 (DOY 151), 20 June 2017 (DOY 171) and 4 July 2017 (DOY 185), with 30 mm of water at each irrigation event. The irrigation was based on the recommendations of the online irrigation tool, ‘Agrowetter’ [37]. Harvest was conducted using a one-row potato elevator-digger (Niewöhner Wühlmaus, Weimar, Germany) on 8 September 2015 (DOY 251), 6 September 2016 (DOY 250) and 6 September 2017 (DOY 249).

2.2. Shading Levels

Shading was created by nets which reduced the incoming solar radiation by 12%, 26% and 50%. The different shading levels were compared with full sunlight (0% shade). The nets were made of polyethylene and had different mesh sizes to create the different shading levels. The 12% net had a mesh size of 3 × 8 mm and was black; the 26% net had a mesh size of 12 × 12 mm and was green, and the 50% net had a mesh size of 3 × 3 mm and was green (AGROFLOR Kunststoff GmbH, Wolfurt, Austria). Nets were installed at the time of potato emergence (growth stage (GS) 009 according to [38]), on 20 May 2015 (DOY 140), 10 May 2016 (DOY 131) and 9 May 2017 (DOY 129). Nets were clipped on to steel wires, which were connected between wooden posts. The height of the nets could be adapted to the plant growth, and to 1 or 2 m in height. A distance of 0.5 m between the nets and canopy surface was guaranteed. Further information about the experiment layout can be found in Schulz et al. [39]. Table 2 shows the total incoming daily solar irradiance at the experimental site from the time of the potato crop emergence (Growth Stage (GS) 009) to the tuber harvest (GS 909) for each experimental year and the theoretically reduced incoming total solar irradiance under the shading nets.

2.3. Data Collection and Analysis

2.3.1. Growth Parameters

In 2015, no growth parameters were determined; only the tuber dry matter yield and quality were determined. During the vegetation periods 2016 and 2017, destructive and non-destructive measurements were done. Growth stages according to the BBCH-scale were determined twice a week [40]. Potato plant height measurements were obtained every week during the emergence stage (GS 009) through to tuber formation (GS 405) on four plants per plot. Plant height was determined using a meter stick to measure the highest point of the soil surface to the highest point of the plant canopy. When the potato plant flowers, the stem and leaves have reached their maximum growth (GS 405), and tubers have reached 50% of their final mass (GS 625) [33,34,35]. Due to the high workload at GS 405/625, two plants per plot were randomly selected from the 3rd or 6th row and harvested for further observations. The observed parameters were stems per plant, tubers per plant, tuber mass per plant, total foliage mass per plant (including all above ground biomass; leaves, stem, flowers, berries), the ratio between foliage and tuber mass, total mass per plant and the harvest index (HI). Leaf area (LA) was determined using Equation (1):
L A = L L · L W · 0.55 ,
where LL is the leaf length from leaf tip to leaf attachment at stem, LW is the maximum leaf width and 0.55 is a constant [41]. Leaf length and the width of a leaf from the middle leaf layer were measured with a meter-stick. The leaf was dried for three days at 60 °C and the specific leaf area (SLA) was calculated. LA and SLA were only determined in 2017. Growing degree days (GDD) were calculated using Equation (2), where i is the day between planting (P) and harvest (H):
G D D = i = P H ( T m a x i +   T m i n i 2   T b a s e ) .
For potato, a base temperature (Tbase) of 6 °C was assumed since no sprout growth is expected at lower temperatures [42,43,44,45]. If Tmax or Tmin at day i were smaller than Tbase they were set to Tbase [46].

2.3.2. Yield Parameters

In all years, all harvested tubers from the center rows of each plot were weighed to calculate yield on a hectare basis. Then, a sub-sample of 2 kg per plot were fresh weighed, oven-dried (1 week, 105 °C) and the dry weight was determined to calculate the dry mass and substance. In 2016 and 2017, all fresh-harvested tubers per plot were sorted according to the size classes: <30 mm (undersized fraction), 30–60 mm (table fraction), and >60 mm (oversized fraction) [47]. Selma is listed in the German variety list as a variety that has long oval tubers [48].

2.3.3. Quality Parameters

An additional sub-sample of 2 kg from the harvested tubers per plot was used to determine nitrogen (N) via the combustion method after Dumas, and phosphorus (P), potassium (K), calcium (Ca), magnesium (Mg) and sulfur (S) via spectrometry [49,50,51]. Analysis of starch content was done according to the polarimetry method [52]. Sub-sample of 30 tubers per plot between 30–60 mm were analyzed for black spot bruise [47]. The black spot bruise index (BSB) was calculated from the number of light, middle and strong discolored tubers (tuberlight, tubermiddle, and tuberstrong, respectively):
B S B =   ( 0.3   · t u b e r l i g h t ) + ( 0.5   · t u b e r m i d d l e ) + t u b e r s t r o n g t u b e r t o t a l   × 100 .
A tuber is counted as light discolored when 1/4 of the circumference is discolored to a 5 mm depth. A tuber is counted as middle discolored when 1/4 of the circumference is discolored and this discoloration is deeper than 5 mm and/or when half of the circumference is discolored to 5 mm. A strong discoloration occurs when tubers are discolored up to half of the circumference and are discolored deeper than 5 mm and/or more than 1/2 is discolored up to 5 mm depth. To measure BSB, samples were spun in a washing machine for 45–90 s (determination of the time took place every year with a standard potato variety). Afterwards, samples were stored for 4–5 days at room temperature. Then the tubers were cut at the greatest diameter and the number of tubers with discoloration (blue, grey or black) was determined [53].

2.3.4. Data Analysis and Statistics

Analysis of the yield data was performed for each year by using the following fitted model:
y i j = µ + r i + s j + e i j ,
where yij is the tuber dry matter yield, µ the general effect, ri is the fixed effect of the i-th replicate, sj is the fixed effect of the j-th shading level and eij is the residual error of yijk.
For the analysis of repeated measurements (duration of growing phases, number of stems per plant, number of tubers per plant, tuber mass per plant, foliage mass per plant, foliage:tuber mass ratio, total mass per plant and HI) on two plants per plot at GS 405/625 the model was as follows:
y i j k = µ + r i + s j + ( r s ) i j + e i j k ,
where yikj is the response, µ the general effect, ri is the fixed effect of the i-th replicate, sj is the fixed effect of the j-th shading level, (rs)ij is the random plot effect where the j-th shading level is used in the i-th replicate, and eijk is the residual error of yijk which corresponds to the kth plant effect in the ijth plot. For both models the PROC MIXED procedure of Statistical Analysis Software SAS, version 9.4 (SAS Institute Inc., Cary, NC, USA) was used.
The multi-year analysis of quality data (macronutrients: nitrogen, phosphorus, potassium, calcium, magnesium, and sulfur) was done by using the Residual Maximum Likelihood of the PROC MIXED procedure of SAS. The following linear mixed model was fitted:
y i j l = µ + a l + s j + ( r a ) i l + ( a s ) l j + e i j l ,
where yijl is the response, µ the general effect, al is the fixed effect of the l-th year, sj is the fixed effect of the j-th shading level, (ra)il is the fixed effect of the i-th replicate in the l-th year, (as)lj is the random interaction effect between the l-th year and the j-th shading level, and eijl is the residual error of yijl. For all models, the assumptions of normality and homogenous variances of residuals were checked graphically. If necessary, that is, if the AIC decreases, year-specific error variances were fitted. In all cases, after finding significant differences via the F-test, differences between treatments were compared at α = 5% using Fisher’s least significant difference test (LSD). More information on the statistics used can be found in Schulz et al. [39].
The growth parameters for plant height were fitted for each plot with the function ‘nls’ of the R packages ‘nlstools’ and ‘car’ [54,55]. The non-linear regression matched the following equation:
y =   θ 1 1 +   e ( θ 2   +   θ 3 · G D D ) ,
where y is the dependent variable for height in the single years 2016 and 2017, θ1 is the asymptote of the dependent variable, θ2 is the parallel shift, θ3 the slope of the function; and GDD are the growing degree days, calculated after Equation (2). Estimates for θ1, θ2 and θ3 from each plot were then submitted to multi-year analysis via model (6).

3. Results and Discussion

3.1. Growth and Development

In 2016 and 2107, artificial shading started after emergence (GS 009), therefore, shading had no influence on the emergence of the potatoes (Table 3). These results agree with an experiment with diverse potato cultivars in the Philippines, where uniform plant emergence was observed at 54% shading and at full light [56]. Because potatoes do not have photosynthetically active biomass until emergence, a change in total solar irradiance has no direct effect on the emergence of plants by influencing their radiation use. However, an indirect influence due to changing soil temperature and moisture might occur. Our study revealed that flowering initiation (GS 601) was prolonged at shading levels >12% shade. In 2017, there was only a significant prolongation under 50%, from 440 GDD under 0% to 467 GDD under 50%. The time from flowering initiation to senescence initiation (GS 901) was prolonged from 973 GDD under 0% and 12% shade to 1211 GDD under 26% and 50% shade. In 2017, no change was observable between 12% and 26% shade compared with 0%. This can be explained by differing climatic conditions in 2016 and 2017. In 2016, the 26% and 50% shade treatment needed a higher amount of GDD to reach senescence due to the cooler and rainy growing period. The light saturation of 14.86 MJ m−2 day−1 could not be reached. The rainy period lasted from April to June (Figure 1). During these months the total solar irradiance was lower (14.34, 18.02 and 19.28 MJ m−2 day−1) than in 2015 (17.94, 18.93 and 21.08 MJ m−2 day−1) and 2017 (15.9, 19.38 and 23.39 MJ m−2 day−1). Table 2 showed that in 2016 the light saturation point of potatoes could not be reached at levels of 26% and 50% shade, while in 2015 and 2017 this was only observable under 50% shade. The time from senescence initiation until harvest day (GS 909) in both 2016 and 2017, did not show any significant changes by shade. The harvestable tuber yield was determined by the duration of the growing season. This was also shown in a Dutch experiment. The authors observed that the growth of potato plants and the dry matter production of tubers were mainly determined by the duration of its growth cycle [29], that is, the duration of each single growth phase is important for the later yield. The authors of the study concluded that the development depends on temperature and daylength. At higher latitudes (e.g., >55° N) growth limitations could occur due to cooler temperatures, which do not fit the optimum values for the single growing phases.
An experiment conducted in the Philippines showed no significant change in plant height at different light intensities for potatoes grown in December (long-day), while potatoes grown in March (short-day) showed differences [56]. Under short-day conditions potatoes develop a canopy, which causes faster senescence and low tuber yields. Since the plants do not receive enough irradiation, they get into a stress situation and start to relocate their nutrients from the leaves to the generative organs, which causes senescence of the leaves. Under long-day conditions the above-ground organs do not die off as quickly and can use the solar irradiance longer and generate higher yields. An additional shade under short-day conditions can delay development and so, the potato growth phase is prolonged. Additionally, high temperatures reduce the above-ground biomass. Potatoes grown under temperatures of 17 °C showed dry matter production of 22.8 g m−2 day−1 [57], while under higher temperature, biomass is reduced. To detect if artificial shade affects plant height at higher latitudes, plant height obtained from our experiment was fitted using a sigmoid growth curve. Results indicated that the year-specific and/or shading level-specific curve determining parameters, θ1, θ2 and θ3 for the trait plant height (Equation (7)) were not significantly different from each other (the test for year-specific parameters showed p = 0.607, p = 0.076 and p = 0.826 for θ1, θ2 and θ3, respectively; the test for shade-specific parameters showed p = 0.649, p = 0.282 and p = 0.837 for θ1, θ2 and θ3, respectively). Thus, a single curve across both years can be fitted. This indicates that there were no significant effects of shading and year on plant height. The observed values and the fitted curve are shown in Figure 2. Note that year-by-shade interactions were assumed as random in Equation (6).
In 2016, the control and 26% shade plants reached their maximum height after 730 GDD (62.3 and 72.2 cm). Plants in the 12% and 50% shading treatments reached their maximum heights after 637 GDD with 65.9 and 60.7 cm, respectively. In the second year, all treatments, with the exception of the 26% treatment, reached their maximum height after 747 GDD (68.8, 73.5 and 75.9 cm). Plants in the 26% shading treatment reached their maximum after 627 GDD at 65.0 cm. In Sri Lanka, potatoes in an AFS with Leucaena leucocephala ((LAM.) DE WIT) showed no changes in plant height [58]. No change in plant height was observed when potatoes were intercropped with maize in a tropical experiment in Uganda [59]. An experiment in temperature-controlled cabinets showed an increase in plant height only at radiations below 7.7 MJ m−2 day−1 [60]. The authors related the increase in plant height to increased gibberellin activity under shade and a reduced assimilation of CO2. Table 2 shows that in the current study, the total solar irradiance never fell below 7.7 MJ m−2 day−1, resulting in no difference in plant height as shown in Figure 2. In addition, the cultivar was a strong influence on the growth of the potato [61]. At lower latitudes, two out of four shaded potato cultivars showed no changes in height. One cultivar showed an increase in height at 30% shade, and the other cultivar at 50% shade [22]. The authors ascribed this to a higher auxin level while the gibberellin level also increased, which promoted stem growth. These results suggest that the cultivar plays a crucial role in height growth under shade. Abu-Zinada and Mousa generally attributed height changes to genetic differences in different potato cultivars [62]. A study of a shade-effect on different phytohormones showed that due to the total irradiance reduction and the associated change in the wavelength spectrum, changes in phytochrome B occurred, which led to growth expansion [63].

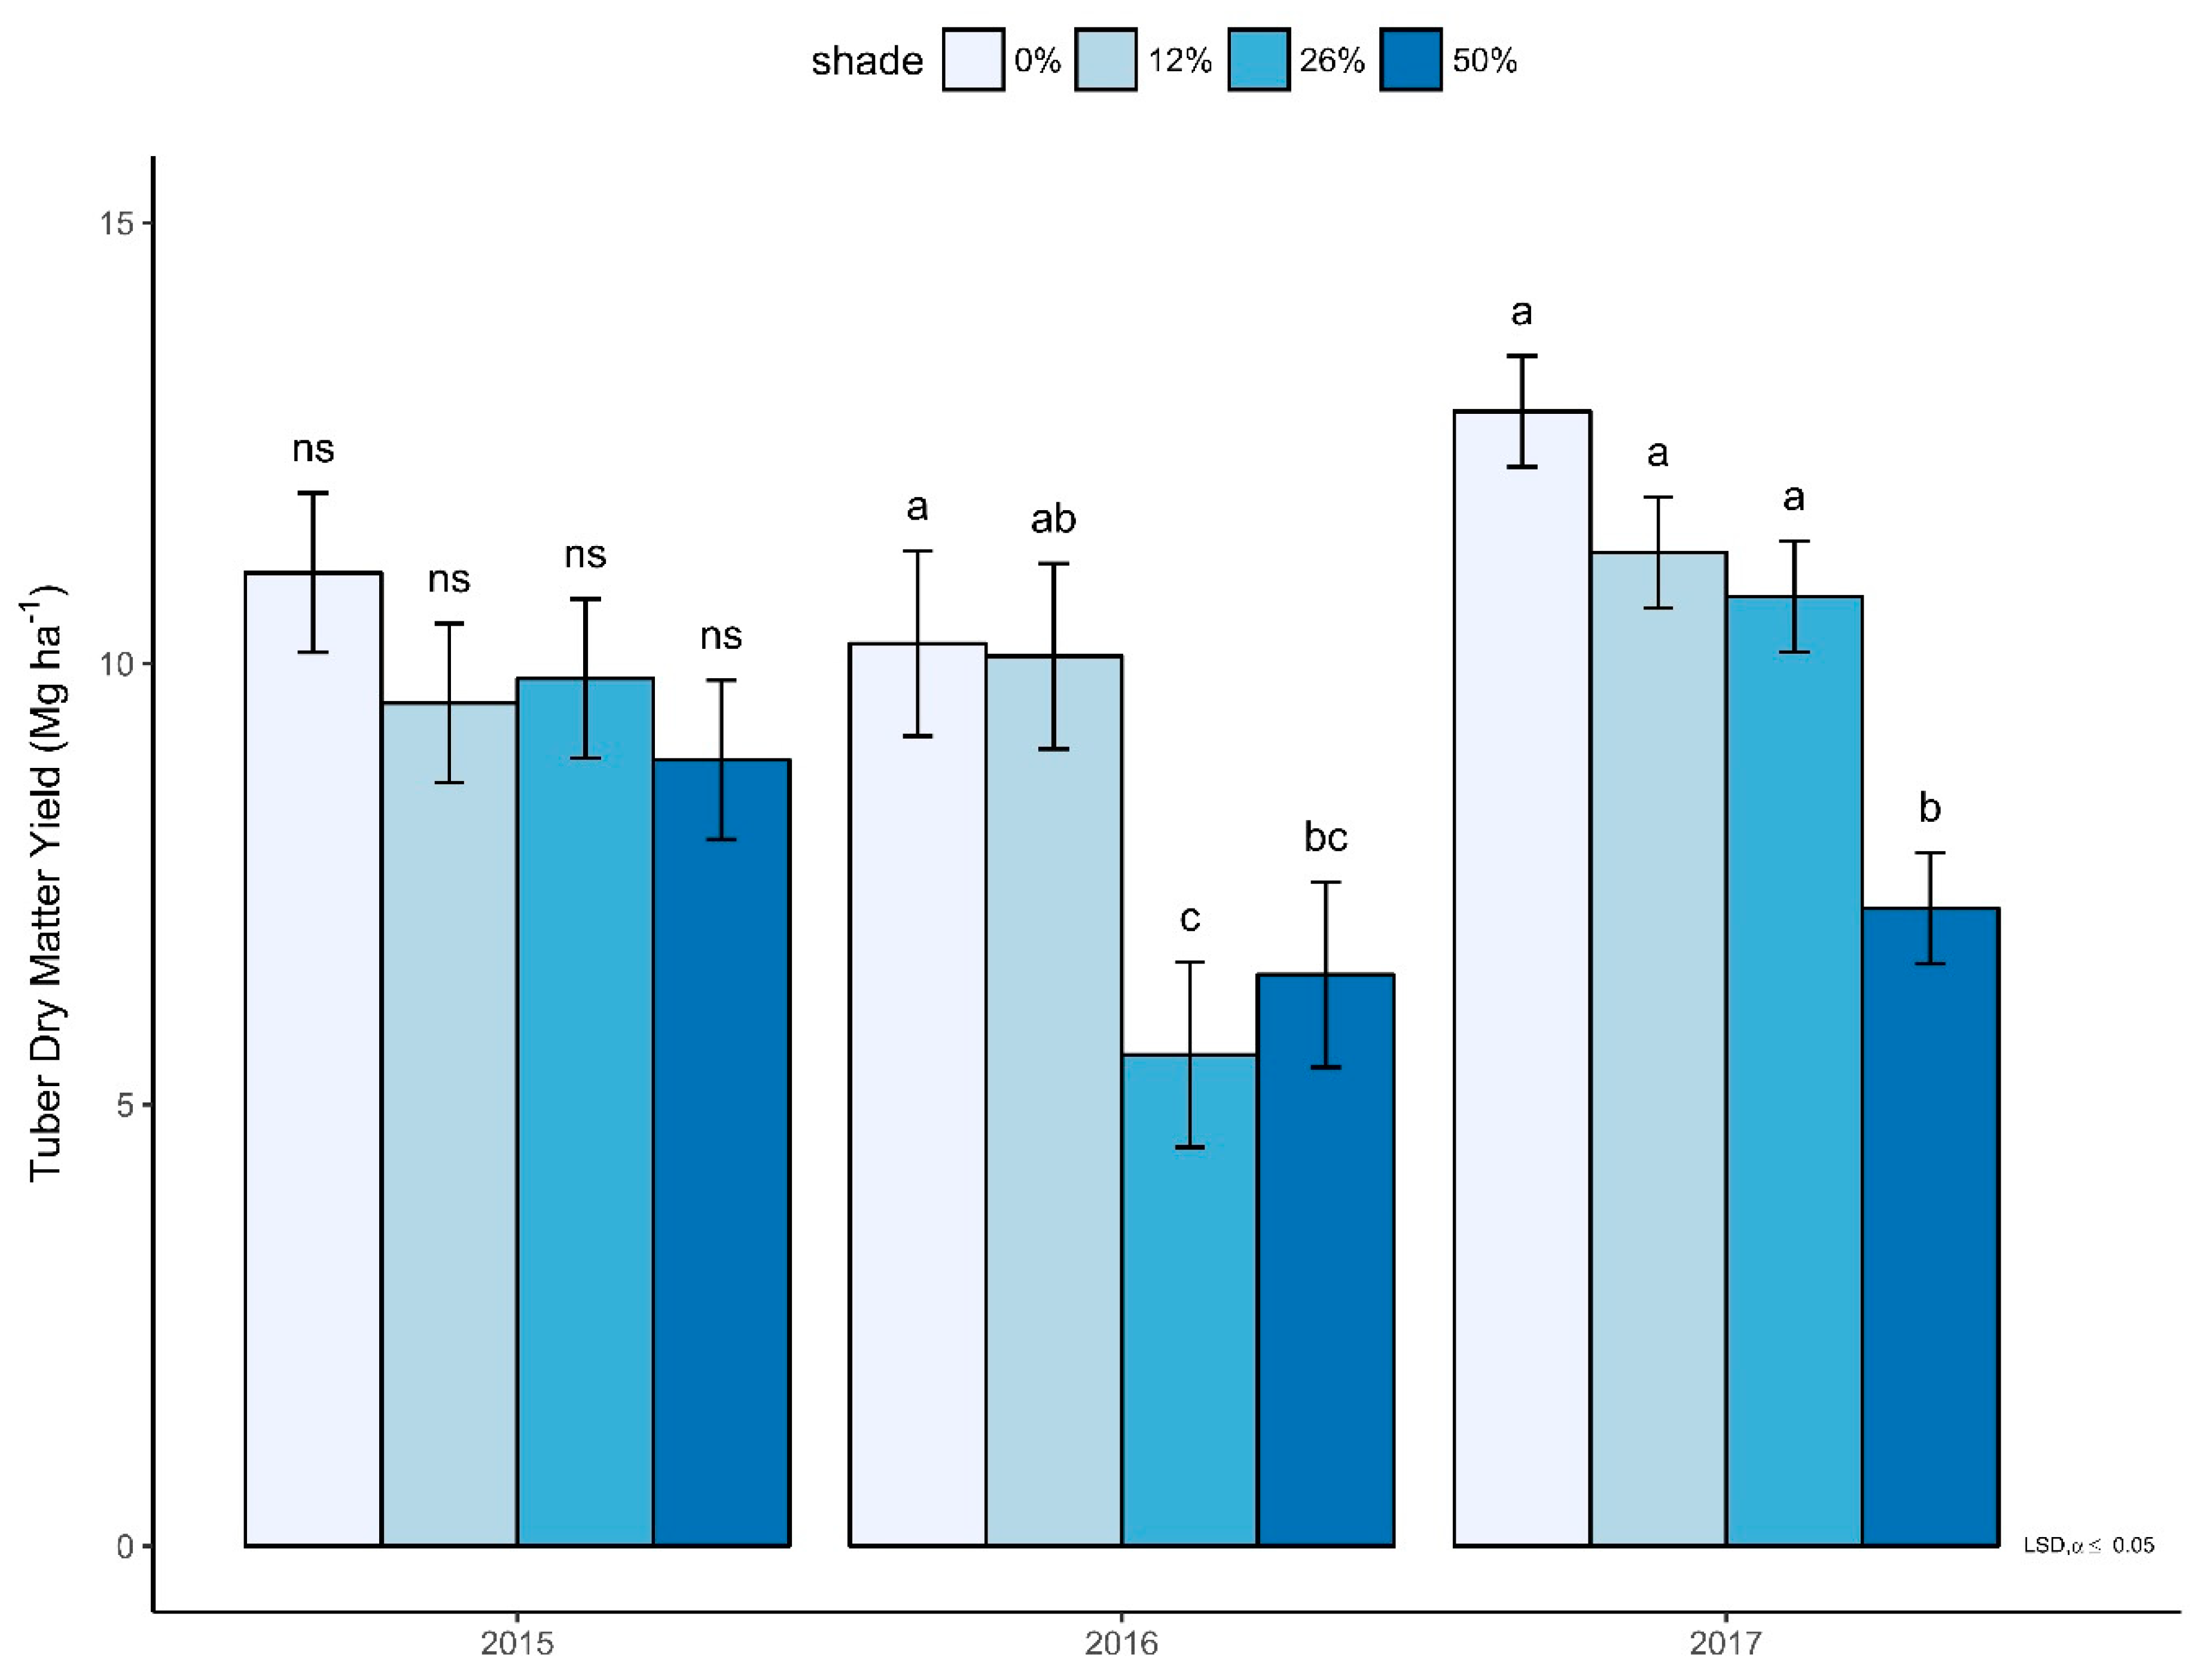
3.2. Yield Determining Parameters and Yield

The tuber yield of potatoes is influenced by various factors such as nitrogen, cultivar, planting density and spacing of planting tubers, climatic conditions and geographic location [64]. The four main tuber yield determining growth parameters are the number of plants per hectare, number of stems per plant, number of tubers per plant and average tuber weight per plant [65]. The experiment revealed no changes in the number of plants per hectare under the different shade levels. This is due to the fact that the shade was only established after potato emergence. As discussed above, a change in solar total irradiance does not affect plant emergence directly; so, all planted potatoes were able to emerge (Table 2).
The different shading treatments had no significant impact on the number of stems per plant in either year (2016 p = 0.479 and 2017 p = 0.186) (Table 4). Studies showed that the number of stems depended on the size of the seed tubers or potato variety, but not on the given environmental factors [59]. Genotype is also an influence on the number of produced stems [66]. Other sources also show that the age of the planted tubers influences the number of stems. Young tubers produced one stem and older tubers more stems [67]. A study conducted in the Philippines showed that the number of stems per plant was not affected by a shade level of 54% [56]. Another study showed that number of stems was determined by the number of sprouts, which is influenced by moisture, temperature and structure of soil, and the number of plants per hectare [66]. Since the development of sprouts into stems takes place below-ground, the shade only impacts soil temperature and moisture. In our experiment, shade nets were installed after emergence. By this time sprouts were already developed. In a real AFS where the distance between single trees is wide enough, and trees are pruned and/or varieties with thinner crowns are used, their influence on soil temperature and moisture will be quite small, therefore, this potential influence on sprouts and emergence can be neglected.
Every stem produces leaves, which are photosynthetically active. As described above no change in the number of stems per plant was determined, therefore no effect on the foliage mass per plant was observable. Even in a rather overcast year like 2016, plants did not compensate for the reduced total solar irradiance with increased photosynthetically active biomass. However, shading is often accompanied by a changed in the partitioning of dry matter between the source and sink organs. In 2017, the number of tubers per plant were significantly reduced at a shade level of 50%. An experiment in the United Kingdom with different potato cultivars showed that the cultivar ‘Estima’ showed no change in time of tuber initiation up until to an artificial shading of 75%, while ‘Maris Piper’ showed delayed tuber initiation in shading of 50% or more [68]. Since the cultivar remained the same every year, it is suspected that the reduction in 2017 was caused by environmental factors (e.g., soil temperature or moisture) other than irradiance reduction. On average, the number of tubers was reduced by ten tubers per plant compared with the control. The studies of Sun and de Luca et al. showed a decrease in the number of tubers per plant under 54% shade and attributed this to a shade induced increase in the gibberellin (GA) content [69,70]. Studies with peas (Pisum sativum L.), lotus (Nelumbo spp. Adans.) and Brassica spp. (L.) at different shade levels also showed a higher GA, therefore, the change of GA under shade seems to be important for plant development, especially for tuber formation [71,72]. In potatoes, higher content of GA has been shown to inhibit tuber formation [20,47,50,58]. Wurr et al. found a reduced number of tubers under field conditions at a shade level of 70% in experimental sites in the United Kingdom [73]. The authors attributed this to a reduced number of stolons, which was caused by lower temperatures slowing down growth. The number of stolons formed indicate the final tuber number. The number of tubers per plant is initiated in a very short time of ten days, the maximum number is reached when shoot dry matter starts to decrease [74]. Ewing et al. observed that tuber formation is promoted by soil moisture [75]. It is possible that in 2016, the naturally occurring low total solar irradiance in combination with the shading provided more moisture than in 2017, leading to a significant reduction in the number of tubers formed in 2017. The results show that less tubers with lower weight were observed in 2017 under 50% shade compared with 0%. Pohjakalli stated that tuber weight decreased about 80% at light intensities of 67% to 33% of full sunlight (which corresponds to 33% to 67% shade) [76]. A Philippine experiment showed that depending on the cultivar, under 54% shade a reduction in dry matter weight of tubers can be determined between 0% and 80 % compared with potatoes grown under full sunlight [77]. Under 74% light (corresponds to 26% shade) most of the used cultivars showed a reduction of up to 29%. Under 30% shade, 3% more tubers were formed, while under 50% shade there was an increase of about 55% [78]. In tomatoes, it has been observed that during the bulking period, the radiation use efficiency is highly related to fruit development because at this time the canopy is fully developed [79]. In our experiment, we observed that the onset of bulking occurred even under shaded conditions. During this time, in 2016 only the 0% and 12% shade, and in 2017 all treatments except for the 50% received adequate total solar irradiance for light saturation.
Our results showed no significant changes in the foliage mass per plant under the different shade levels in any experimental year. Mean values ranged from 48.21 g (0%) to 75.45 g (26%) in 2016 and 60.07 g (50%) to 79.37 g (0%) in 2017 (Table 4). This corresponds well with the results for plant height (Figure 2). The literature shows that the rate of foliage development is highly dependent on the cultivar. Some cultivars grow faster than others. Also, the age of the seed tubers affects the foliage, while older tubers enhance the foliage production [56]. Data on leaf area (LA) and specific leaf area (SLA) were only available for 2017. However, no significant differences between the shade treatments (LA p = 0.772 and SLA p = 0.963) were observed. Another experiment with 50% and 90% shaded potato leaves showed that shading up to 50% also did not influence LA. However, shading levels of 90% showed a decline in green leaf area. The authors postulated that shading reduces the transpiration, and so, the distribution of cytokinins. Parts which are exposed to more light or less shade have a higher amount of cytokinins, which can promote cell division, branching and leaf growth at shading levels >50% [57].
Foliage mass showed no change based on the tested shading treatment; however, in combination with a decreased tuber mass in 2017, a shift to the above-ground biomass occurred. The ratio changed from 0.95 in the control to 4.67 at the 50% shade level. This shift has been documented in the literature [42]. Under low irradiance (2000 to 3000 lux or lower) a shift to the aboveground biomass occurred, which was not observed under high irradiance (8000 to 16,000 lux). An increase in above-ground biomass growth and an increase in below-ground biomass was also observed in maize plants under 69% artificial shade [80]. In 2016, the potato plants received more total solar irradiance during the phase without shading (until emergence) than in 2017 (17.70 and 14.87 MJ m−2 day−1, Table 2). Until onset of tuber initiation, most dry mass was partitioned in leaves and stems and after this time in tubers. If light is reduced, the plant will use more assimilates for leaf mass than for tubers to provide an adequate level of photosynthesis. This can be seen in Table 4. Leaf mass showed no change under reduced light as the plant tried to provide an adequate amount of photosynthetically active biomass, while the tuber mass was reduced.
The lower number of tubers in 2017 and the constant starch content is in line with results found in the literature. Under shade, more sugar is needed to provide photosynthetically active leaf mass. The large amount of sugar that is translocated in the tubers to form starch (because tubers are not photosynthetically active) cannot be covered [81].
As mentioned above, potatoes grown under optimum conditions are able to form 22.8 g of biomass per m2 and day. Total mass per plant only showed significant changes in 2017. Biomass in the 50% shading treatment was reduced by almost 100 g compared to the control. In 2017, the 0% shade had a radiation use efficiency (RUE) of 2.41 g MJ−1 which fits well with the values mentioned in the literature [82]. The 50% shade had a RUE of 1.14 g MJ−1.
The harvest index (HI) could not be determined for the core plot due to defoliation for facilitated harvest. Therefore, the HI was determined at GS 405/625. Table 4 shows that there was no influence from shade prior to defoliation, neither in 2016 nor in 2017. Therefore, the trend of a decreasing HI with increasing shade was observed.
Dry matter tuber yield (DMY, Figure 3) was significantly reduced by shade in 2016 (p = 0.040) and 2017 (p = 0.004), but not in 2015 (p = 0.467). Under 26% shade DMY was significantly reduced by 44% in 2016, while in 2017 a significant reduction of 44% occurred at 50% shade. This is related to the total solar irradiance values in Table 2. The light saturation point of potatoes was reached in 2015 and 2017 in up to 26% shade. Since the plants were able to cover their need for total solar irradiance of 14.86 MJ m−2 day−1 during the shaded time, no significant changes were observable (Table 2). Both 2015 and 2017 were rather sunny years, while in contrast, spring 2016 had comparatively low total solar irradiance. In June 2016, hot and dry phases alternated with rainfall events. Light saturation was reached up until 12% shade (Table 2). These observations in combination with the already discussed changes, suggest that the phase after emergence is crucial for yield formation, especially since the plant has no photosynthetically active biomass before emergence that can use the light. Figure 3 and Table 2 suggest that the light saturation point does not necessarily have to be met to generate adequate yields. In 2015, even a total solar irradiance of 10.11 MJ m−2 day−1 from emergence to harvest showed no yield changes. In 2017, the 50% shading received 10.07 MJ m−2 day−1 after emergence. This indicates that after emergence, potatoes need a total solar irradiance >10.11 MJ. In 2016, the weather was very unsteady, and yield was probably more influenced by temperature, which led to a cooling of the dam (soil piled up to 30 cm). Under air temperatures near optimum, more tubers than shoots are built. When air temperature increases, there is a shift to more shoot biomass than tuber mass [83]. If the air temperature is below the base temperature there will be no growth, neither above-ground nor below-ground.
Demagante and Vander Zaag indicated that shading of 54% led to total dry matter yields similar to those under full sunlight in the Philippines [56]. A series of experiments in The Netherlands, Rwanda and Tunisia revealed that the tuber dry matter production is highly dependent on growth duration, which is determined by temperature and daylength [29]. The Netherlands is located in a zone with temperate climate and long-day conditions which fits best to the long-day requirement of potatoes, Rwanda is located under short-day conditions with high temperatures, and Tunisia is located in an interface zone between long- and short-day conditions with adequate temperatures from October to April. Hence, as potato is a long-day plant requiring a maximum temperature of >20 °C, Rwanda with its short daylength and high temperature could be unfavorable, while in The Netherlands and Tunis the day-length during the growing period is adequate. However, shading can lower the temperature unfavorably and a short day-length hastens tuber initiation, which reduces the final tuber yield [84]. Kuruppuarachchi showed that shading potatoes at a level of 50% by suspended coconut leaves during the whole cropping season reduced tuber yield significantly by about 56% in Sri Lanka [58]. He concluded that permanent shading compared with shade in the first four weeks resulted in variation in the day/night temperatures of the soil, which may be unfavorable for tuber growth. A study by Sale with potatoes shaded at a level of 34% throughout the growing period showed a 26–42% decrease in yield [85]. Cultivation of potato beneath stone pines (Pinus pinea L.) reached tuber yields of 60-86% yield when compared with the national average yields [86].
Experiments with 30% and 50% shade have showed reduced yields by approximately 2–56% [78]. In 2016 and 2017, we also observed a 50% reduction in yield under 50% shade.
Overall, the yield reductions in our experiment are comparable with the results of other experiments, mostly from tropical countries where irradiance is in general much higher. Therefore, it can be concluded that potatoes tolerate shade up to 26% even in the temperate zone and are able to reach adequate yields.

3.3. Quality Parameters of Tubers

With regard to the tuber fraction, an increased proportion of undersized tubers was found up until 26% shade (Table 5). Under 50% shade the share of undersized potatoes (<30 mm) decreased insignificantly. The table fraction (30–60 mm) also showed an insignificant increase at higher shade levels. The 50% treatment had a share of 83.90%, while the control only had 74.83%. An insignificant decreasing share with increasing shade was observed for the oversized fraction (>60 mm). The literature indicates that tuber fractions are generally determined by numerous factors, but these do not include light or shade [66].
The tuber size is mainly influenced by the size of the seed tubers and the growing conditions during the growth of the seed tubers. The number of tubers m−2 will be determined by the number of formed stolons per stem. It has been shown that irradiance has no effect on this parameter. It is more sensitive to seed size, number of stems, temperature and drought. Studies by Tekalign and Hammes showed that the cultivar also has an influence on the number of tubers. They showed that the fruit or berry development affects the total and marketable tuber mass and the final tuber yield [87,88]. Berries have an influence on the sink-distribution, leading to yield decreases at higher berry numbers.
Hence, tuber size distribution can be influenced by total tuber yield, seeding rate and size of seed tubers, and the number of stems per plant [66]. As mentioned above, older tubers produce more stems than younger tubers. The tuber size distribution is mainly determined by the date of initiation, position and size of the stolon [61]. This shows that shade has no influence on tuber fraction. A study by Knowles and Knowles showed that under the climate conditions of higher northern latitudes, less tubers are formed, but the number of formed tubers of marketable size are higher than for potatoes grown at lower northern latitudes [89]. More potatoes per plant were formed; however, they are smaller, which ultimately led to lower yields. Other experiments have shown that a late harvest results in a larger range of tuber sizes. No additional tubers will grow, but small tubers continue to grow in the later stages of the growing season, resulting in the larger fraction for tuber size [61].
For most potato cultivars (being determinate), the vegetative plant growth ends with flowering when maximum above-ground biomass has formed [32,33,34]. During flowering, the tuber formation is completed and the potato plant begins to reallocate the sugars from the above-ground parts to the tubers, where starch is formed. After this, only the tuber mass increases and the quality of the tuber changes. The maximum starch yield can be found when half of the leaves are dead and stems begin to die [74]. Due to the simultaneous harvesting in all shade treatments (date determined after the 0% shade treatment) and the delay in ripening (days from senescence initiation to harvest, Table 3) in 2016, the potatoes had less time to reallocate their sugars from leaves to tubers and build up starch. While the effect of the year (p = 0.043) was significant, the effect of the shading treatment was not (p = 0.063). So, the year should show a statistical difference. A weather-induced delay in development increased the share of smaller tubers in comparison to larger tubers. Smaller tubers have a lower sink demand for sugars that are reallocated from leaves and stored as starch in tubers. This explains the year effect on the starch content. Across years, the starch content showed no significant differences between the shade levels and the unshaded control. An experiment with 34% and 57% shaded tomatoes (Solanum lycopersicum L.) showed that there was no influence on glucose by different levels of irradiance [88]. Other studies with shaded tomatoes showed that shade had no influence on final sugar content [89]. This suggests that the starch content in potatoes is also not affected by shade.
Across years, no effect on black spot bruise (BSB) was detectable. None of the macronutrients showed significant treatment effects across years (Table 5) and values were in the given range of values reported in the literature [90].
The above results showed that the influence of shade on plant growth and tuber yield depends on total solar irradiance but also on other factors (e.g., cultivar, soil temperature, and soil moisture). To minimize the shade, which is a controllable effect, different management techniques can be used. If the trees are still small in the first years of an AFS and need grow first, there will be little or no shade influence on the understory crop in the first years. To obtain high yields, potatoes can be integrated in an AFS in the first years without yield reduction. In addition, a large distance between the single trees, the pruning of the trees, the direction of tree strips from north-to-south and the choice of trees with thinner crowns can keep the shade influence at a minimum. Additionally, shade does not remain static on the field during the whole growing period (as in our experimental setup). In a real AFS, the shading varies during the day and moves on a parabolic shape over the crop as the solar position changes, so, the influence of shade in a real AFS can be regarded as smaller than in our experimental setup.

3.4. Prospects for AFS: Potential Total Solar Irradiance in the Temperate Zone of North-European Latitudes

Theoretically, potatoes need an average total irradiation of 14.86 MJ m−2 day−1 to reach the given light saturation point of 400 µmol m−2 s−1 PAR to maximize yields. To reach this light saturation under shading, the required total irradiance would amount to 16.89 MJ m−2 day−1 at 12% shading, 20.08 MJ m−2 day−1 under 26% shade and 29.72 MJ m−2 day−1 under 50% shade. Figure 4 shows the hypothetical growing regions in Europe with an assumed limited available irradiance, taking mean total solar irradiance data from 1984–2013 into account [30]. Under a generalized, assumed potato growing season in Europe (30° N, 20° W to 75° N, 40° E) from 1 March to 31 October (DOY 60–304) and without taking any other climatic growth factors except for irradiance into account, potato cultivation under 50% shade would be possible up to 35° N without yield losses (Figure 4). For 26% shade, cultivation would theoretically be possible from 35° to 45° N, for 12% shade from 45° to 55° N, and from 55° to the northern polar circle at 66° N, which is the geographical limit of potato cultivation. In years with high total solar irradiance, the borders for cultivation under shade will shift to the north, while in years with lower irradiance levels the borders will shift to the south. Possible reasons for this shift include less clouds, low variation in the inclination of the earth’s axis, high solar activity, low air pollution or weather phenomena (e.g., fog) or depending on the elevation of the potato cultivation site (in higher elevations, a greater amount of total solar irradiance reaches the surface).

4. Conclusions

Potatoes are known as being a shade tolerant crop. The results of this study indicated that the DMY was only significantly reduced in 50% shade in years with high irradiance, while a significant reduction at a shade level of 26% only occurred in years with low irradiance. Shading had no significant influence on starch content. Other quality parameters were also not significantly influenced by shade. Yield determining factors like the number of plants per hectare, number of stems per plant, number of tubers per plant and tuber mass per plant were slightly affected by shade. As long as shade is the only influencing factor and no below-ground factors, such as competition for water and nutrients occur, potatoes can be cultivated at latitudes lower than 35° N under 50% shade, while with every increase of 10° N the accepted shade levels have to be halved. Therefore, potatoes can be recommended as an understory crop in AFS up to a shading level of 26% without significant yield and quality reductions under the given total solar irradiance in Southwestern Germany. However, depending on the year (low-irradiance or high-irradiance), this can shift latitudinally in one direction or the other.

Author Contributions

Conceptualization, K.S.; methodology, V.S.S., S.M. and K.S.; software, V.S.S and J.H.; validation, V.S.S. S.M., J.H. and S.G.-H.; formal analysis, V.S.S., S.M. and S.G.H.; investigation, V.S.S.; data curation, V.S.S; writing—original draft preparation, V.S.S., S.M. and S.G.-H.; writing—review and editing, V.S.S., S.M., J.H. and S.G.-H.; supervision, S.G.-H.; project administration, V.S.S, S.M. and S.W.; funding acquisition, K.S.

Funding

This research was funded by the Federal Ministry of Food and Agriculture (BMEL) through the project agency Fachagentur Nachwachsende Rohstoffe (FNR) e.V. within the project “Agro-Wertholz: Agroforstsysteme mit Mehrwert für Mensch und Umwelt”, grant number 2201514.

Acknowledgments

The authors would like to thank the staff of the LTZ Augustenberg for making this joint research project possible and Melanie Hinderer for data collection. We also thank Cameron Anderson and Willem Molenaar for English proofreading.

Conflicts of Interest

The authors declare no conflict of interest.

Appendix A

Table A1. Date, product, trade name, amount and active ingredients of plant protection agent and also the Mode of Action (MoA) after HRAC (Herbicide Resistance Action Committee), FRAC (Fungicide Resistance Action Committee) and IRAC (Insecticide Resistance Action Committee) for all three years.
DateProductTrade NameAmount and Active IngredientMoA
2015
18 MayH2.0 kg ha−1Artist (Bayer AG)240 g kg−1 flufenacet,
175 g kg−1 metribuzin
K3
C1
10 JuneF2.0 kg ha−1 Ridomil Gold (Syngenta AG)40 g kg−1 metalaxyl-M,
640 g kg−1 mancozeb
A1
M3
10 JuneI0.3 L ha−1 Biscaya (Bayer AG)240 g L1 thiacloprid4A
25 JuneF2 kg ha1 Acrobat Plus WG (BASF SE)90 g kg1 dimethomorph,
600 g kg1 mancozeb
H5
M3
10 JulyF2 kg ha1 Acrobat Plus WG (BASF SE)90 g kg1 dimethomorph,
600 g kg1 mancozeb
H5
M3
10 JulyI0.3 L ha−1 Biscaya (Bayer AG)240 g L1 thiacloprid4A
24 JulyF2 kg ha1 Acrobat Plus WG (BASF SE)90 g kg1 dimethomorph,
600 g kg1 mancozeb
H5
M3
6 AugustF2 kg ha1 Acrobat Plus WG (BASF SE)90 g kg1 dimethomorph,
600 g kg1 mancozeb
H5
M3
2016
6 MayH3 L ha−1 Boxer (Syngenta AG)800 g L1 prosulfocarbN
6 MayH0.3 kg ha1 Sencor WG (Syngenta AG) 700 g kg−1 metribuzinC1
2 JuneI0.3 L ha−1 Biscaya (Bayer AG)240 g L1 thiacloprid4A
20 JuneF2 kg ha1 Acrobat Plus WG (BASF SE)90 g kg1 dimethomorph,
600 g kg1 mancozeb
H5
M3
28 JuneI0.3 L ha−1 Biscaya (Bayer AG)240 g L1 thiacloprid4A
28 JuneF2 kg ha−1 Acrobat Plus WG (BASF SE)90 g kg1 dimethomorph,
600 g kg1 mancozeb
H5
M3
8 JulyF1.5 L ha1 Infinito (Bayer SE)62.5 g L1 fluopicolide,
625,0 g L1 propamocarb-HCl
B5
F4
15 JulyF1.6 L ha1 Infinito (Bayer SE) 62.5 g L1 fluopicolide,
625.0 g L1 propamocarb-HCl
B5
F4
15 JulyI0.3 L ha−1 Biscaya (Bayer AG)240 g L1 thiacloprid4A
3 AugustH0.8 L ha1 Quickdown (Ceminova Deutschland GmbH & Co. KG)24.2 g L1 pyraflufenE14
3 AugustH2 L ha1 Toil (Ceminova Deutschland GmbH & Co. KG)836 g L1 rapeseed oil methyl ester
2017
5 MayH2.0 kg ha−1Artist (Bayer AG)240 g kg−1 flufenacet,
175 g kg−1 metribuzin
K3
C1
2 JuneF2.0 kg ha1 Ridomil Gold (Syngenta AG)40 g kg−1 metalaxyl-M,
640 g kg−1 mancozeb
A1
M3
2 JuneI0.3 L ha−1 Biscaya (Bayer AG)240 g L1 thiacloprid4A
16 JuneF2 kg ha1 Acrobat Plus WG (BASF SE)90 g kg1 dimethomorph,
600 g kg1 mancozeb
H5
M3
16 JuneI0.3 L ha−1 Biscaya (Bayer AG)240 g L1 thiacloprid4A
5 JulyI0.06 L ha−1 Coragen (DuPont)200 g L1 chlorantraniliprole28
5 JulyF2 kg ha−1 Acrobat Plus WG (BASF SE)90 g kg1 dimethomorph,
600 g kg1 mancozeb
H5
M3
9 AugustH2.5 L ha−1 Reglone (Syngenta AG)374 g L1 diquat dibromideD
H herbicide, F fungicide, I insecticide.

References

  1. Horwith, B. A role for intercropping in modern agriculture. BioScience 1985, 35, 286–291. [Google Scholar] [CrossRef]
  2. Power, J.F.; Follett, R.F. Monoculture. Sci. Am. 1987, 256, 78–87. [Google Scholar] [CrossRef]
  3. Gliessman, S.R. Multiple cropping systems: A basis for developing an alternative agriculture. In US Congress Off Ice of Technology Assessment. Innovative Biological Technologies for Lesser Developed Countries: Workshop Proceedings; Congress of the USA: Washington, DC, USA, 1985; pp. 69–83. [Google Scholar]
  4. Thevathasan, N.V.; Gordon, A.M.; Simpson, J.A.; Reynolds, P.E.; Price, G.; Zhang, P. Biophysical and ecological interactions in a temperate tree-based intercropping system. J. Crop Improv. 2004, 12, 339–363. [Google Scholar] [CrossRef]
  5. Kremen, C.; Miles, A. Ecosystem services in biologically diversified versus conventional farming systems: Benefits, externalities, and trade-offs. Ecol. Soc. 2012, 17. [Google Scholar] [CrossRef]
  6. Nair, P.R. The coming of age of agroforestry. J. Sci. Food Agric. 2007, 87, 1613–1619. [Google Scholar] [CrossRef]
  7. Nair, P.R. Classification of agroforestry systems. Agrofor. Syst. 1985, 3, 97–128. [Google Scholar] [CrossRef]
  8. Raintree, J.B. Agroforestry pathways: Land tenure, shifting cultivation and sustainable agriculture. Unasylva 1986, 38, 2–15. [Google Scholar]
  9. Nair, P.R. An Introduction to Agroforestry; Springer Science & Business Media: Berlin, Germany, 1993. [Google Scholar]
  10. Vandermeer, J.H. The Ecology of Intercropping; Cambridge University Press: Cambridge, UK, 1992. [Google Scholar]
  11. Montagnini, F.; Nair, P.K.R. Carbon sequestration: An underexploited environmental benefit of agroforestry systems. Agrofor. Syst. 2004, 61, 281–295. [Google Scholar]
  12. Rigueiro-Rodríguez, A.; Fernández-Núñez, E.; González-Hernández, P.; McAdam, J.H.; Mosquera-Losada, M.R. Agroforestry systems in Europe: Productive, ecological and social perspectives. In Agroforestry in Europe; Springer: Berlin/Heidelberg, Germany, 2009; pp. 43–65. [Google Scholar]
  13. Roces-Diaz, J.V.; Rolo, V.; Kay, S.; Moreno, G.; Szerencsits, E.; Fagerholm, N.; Plieninger, T.; Torralba, M.; Graves, A.; Giannitsopoulos, M.; et al. Exploring the Relationships among Bio-Physical and Socio-Cultural Ecosystem Services of Agroforestry Systems across Europe. In Proceedings of the Agroforestry as Sustainable Land Use, Nijmegen, The Netherlands, 28–30 May 2018; EURAF: Nijmegen, The Netherlands, 2018. [Google Scholar]
  14. Elevitch, C.; Mazaroli, D.; Ragone, D. Agroforestry standards for regenerative agriculture. Sustainability 2018, 10, 3337. [Google Scholar] [CrossRef]
  15. Gao, L.; Xu, H.; Bi, H.; Xi, W.; Bao, B.; Wang, X.; Bi, C.; Chang, Y. Intercropping competition between apple trees and crops in agroforestry systems on the Loess Plateau of China. PLoS ONE 2013, 8, e70739. [Google Scholar] [CrossRef]
  16. Zhang, W.; Ahanbieke, P.; Wang, B.J.; Xu, W.L.; Li, L.H.; Christie, P.; Li, L. Root distribution and interactions in jujube tree/wheat agroforestry system. Agrofor. Syst. 2013, 87, 929–939. [Google Scholar] [CrossRef]
  17. Newman, S.M.; Bennett, K.; Wu, Y. Performance of maize, beans and ginger as intercrops in Paulownia plantations in China. Agrofor. Syst. 1997, 39, 23–30. [Google Scholar] [CrossRef]
  18. Khybri, M.L.; Gupta, R.K.; Ram, S.; Tomar, H.P.S. Crop yields of rice and wheat grown in rotation as intercrops with three tree species in the outer hills of Western Himalaya. Agrofor. Syst. 1992, 17, 193–204. [Google Scholar] [CrossRef]
  19. Ceccon, E. Production of bioenergy on small farms: A two-year agroforestry experiment using Eucalyptus urophylla intercropped with rice and beans in Minas Gerais, Brazil. New For. 2008, 35, 285–298. [Google Scholar] [CrossRef]
  20. Friday, J.B.; Fownes, J.H. Competition for light between hedgerows and maize in an alley cropping system in Hawaii, USA. Agrofor. Syst. 2002, 55, 125–137. [Google Scholar] [CrossRef]
  21. Rahman, M.; Bari, M.; Rahman, M.; Ginnah, M.; Rahman, M. Screening of Potato Varieties under Litchi Based Agroforestry System. Am. J. Exp. Agric. 2016, 14, 1–10. [Google Scholar] [CrossRef]
  22. Mariana, M.; Hamdani, J.S. Growth and yield of Solanum tuberosum at medium plain with application of paclobutrazol and paranet shade. Agric. Agric. Sci. Procedia 2016, 9, 26–30. [Google Scholar] [CrossRef]
  23. Pleijel, H.; Danielsson, H.; Vandermeiren, K.; Blum, C.; Colls, J.; Ojanperä, K. Stomatal conductance and ozone exposure in relation to potato tuber yield—Results from the European CHIP Programme. Eur. J. Agron. 2002, 17, 303–317. [Google Scholar] [CrossRef]
  24. Kareem, I.A. Rattle Tree (ALBIZIA LEBBECK) Effects on Soil Properties and Productivity of Irish Potato (SOLANUM TOBEROSUM) on The Jos Plateau, Nigeria. Ph.D. Thesis, Environmental Resource Planning, University of Jos, Jos, Nigeria, 2007. [Google Scholar]
  25. Nadir, S.W.; Ng’etich, W.K.; Kebeney, S.J. Performance of crops under Eucalyptus tree-crop mixtures and its potential for adoption in agroforestry systems. Aust. J. Crop Sci. 2018, 12, 1231. [Google Scholar] [CrossRef]
  26. Li, L.; Ljung, K.; Breton, G.; Schmitz, R.J.; Pruneda-Paz, J.; Cowing-Zitron, C.; Cole, B.J.; Ivans, L.J.; Pedmale, U.V.; Jung, H.-S.; et al. Linking photoreceptor excitation to changes in plant architecture. Genes Dev. 2012, 26, 785–790. [Google Scholar] [CrossRef] [Green Version]
  27. Abdrabbo, M.A.; Farag, A.A.; Abul-Soud, M. The intercropping effect on potato under net house as adaption procedure of climate change impacts. Appl. Res. 2013, 5, 48–60. [Google Scholar]
  28. Gawronska, H.; Dwelle, R.B.; Pavek, J.J. Partitioning of photoassimilates by potato plants (Solanum tuberosum L.) as influenced by irradiance: II. Partitioning patterns by four clones grown under high and low irradiance1. Am. J. Potato Res. 1990, 67, 163–176. [Google Scholar] [CrossRef]
  29. Kooman, P.L.; Fahem, M.; Tegera, P.; Haverkort, A.J. Effects of climate on different potato genotypes 2. Dry matter allocation and duration of the growth cycle. Eur. J. Agron. 1996, 5, 207–217. [Google Scholar] [CrossRef]
  30. NASA Atmospheric Science Data Center. Available online: https://eosweb.larc.nasa.gov/sse/global/text/lat_tilt_radiation (accessed on 24 December 2017).
  31. Smith, J.; Pearce, B.D.; Wolfe, M.S. Reconciling productivity with protection of the environment: Is temperate agroforestry the answer? Renew. Agric. Food Syst. 2013, 28, 80–92. [Google Scholar] [CrossRef]
  32. Barbeau, C.D.; Wilton, M.J.; Oelbermann, M.; Karagatzides, J.D.; Tsuji, L.J. Local food production in a subarctic Indigenous community: The use of willow (Salix spp.) windbreaks to increase the yield of intercropped potatoes (Solanum tuberosum) and bush beans (Phaseolus vulgaris). Int. J. Agric. Sustain. 2018, 16, 29–39. [Google Scholar] [CrossRef]
  33. Wilton, M.J.; Karagatzides, J.D.; Tsuji, L.J. Nutrient Concentrations of Bush Bean (Phaseolus vulgaris L.) and Potato (Solanum tuberosum L.) Cultivated in Subarctic Soils Managed with Intercropping and Willow (Salix spp.) Agroforestry. Sustainability 2017, 9, 2294. [Google Scholar] [CrossRef]
  34. BSV Saaten–Blühmischung M2 FAKT Maßnahme E2.1 und E2.2. Available online: https://bsv-saaten.de/bluehmischungen-und-bienenweiden/foerderprogramme-1/fakt-1/naturplus-fakt-m2-zr-100-bluehmischung-m2-fuer-fakt-massnahme-e2-1-und-e2-2.html (accessed on 24 November 2018).
  35. Röhrig, M.; Sander, R.; eV Geschäftsstelle, I. Interaktive Online-Beratung mit dem Informationssystem Integrierte Pflanzenproduktion (ISIP). In Proceedings of the GIL Jahrestagung, Potsdam, Germany, 6–8 March 2006; pp. 221–224. [Google Scholar]
  36. Bundesministerium für Ernährung. Landwirtschaft und Verbraucherschutz (BMELV). Gute fachliche Praxis im Pflanzenschutz-Grundsätze für die Durchführung; BMELV: Bonn, Germany, 2010.
  37. Janssen, W. Online irrigation service for fruit and vegetable crops at farmers site. In Proceedings of the 9th EMS Annual Meeting, 9th European Conference on Applications of Meteorology (ECAM) Abstracts, Toulouse, France, 28 September–2 October 2009; Available online: http://meetings.copernicus.org/ems2009/ (accessed on 5 September 2017).
  38. Hack, H.; Gall, H.; Klemke, T.H.; Klose, R.; Meier, U.; Stauss, R.; Witzenberger, A. The BBCH scale for phenological growth stages of potato (Solanum tuberosum L.). In Proceedings of the 12th Annual Congress of the European Association for Potato Research, Paris, France, 1993; pp. 153–154. [Google Scholar]
  39. Schulz, V.S.; Munz, S.; Stolzenburg, K.; Hartung, J.; Weisenburger, S.; Mastel, K.; Möller, K.; Claupein, W.; Graeff-Hönninger, S. Biomass and Biogas Yield of Maize (Zea mays L.) Grown under Artificial Shading. Agriculture 2018, 8, 178. [Google Scholar] [CrossRef]
  40. Mushagalusa, G.N.; Ledent, J.-F.; Draye, X. Shoot and root competition in potato/maize intercropping: Effects on growth and yield. Environ. Exp. Bot. 2008, 64, 180–188. [Google Scholar] [CrossRef]
  41. Bodlaender, K.B.A. Influence of Temperature, Radiation and Photoperiod on Development and Yield; Wageningen University: Gelderland, The Netherlands, 1963. [Google Scholar]
  42. Cao, W.; Tibbitts, T.W. Leaf emergence on potato stems in relation to thermal time. Agron. J. 1995, 87, 474–477. [Google Scholar] [CrossRef]
  43. Sprenger, H.; Rudack, K.; Schudoma, C.; Neumann, A.; Seddig, S.; Peters, R.; Zuther, E.; Kopka, J.; Hincha, D.K.; Walther, D.; et al. Assessment of drought tolerance and its potential yield penalty in potato. Funct. Plant Biol. 2015, 42, 655–667. [Google Scholar] [CrossRef]
  44. Fernández, S.D.M.; Aguilar, R.M.; Moreno, Y.S.; Pérez, J.E.R.; León, M.T.C.; Saldaña, H.L. Growth and sugar content of potato tubers in four maturity stages under greenhouse conditions. Rev. Chapingo Ser. Hortic. 2018, 24, 53–67. [Google Scholar] [CrossRef]
  45. McMaster, G.S.; Wilhelm, W.W. Growing degree-days: One equation, two interpretations. Agric. For. Meteorol. 1997, 87, 291–300. [Google Scholar] [CrossRef]
  46. Bundessortenamt. Richtlinien für die Durchführung von Landwirtschaftlichen Sortenversuchen; Bundessortenamt: Hannover, Germany, 2000. [Google Scholar]
  47. Bundessortenamt. Beschreibende Sortenliste Kartoffel—2017; Bundessortenamt: Hannover, Germany, 2017. [Google Scholar]
  48. Hoffmann, G. VDLUFA-Methodenbuch Band I: Die Untersuchung von Boeden; Loseblattsammlung; VDLUFA-Verlag: Darmstadt, Germany, 1991; ISBN 3-922712-42-8. [Google Scholar]
  49. Janßen, E. VDLUFA-Methodenbuch Band VII: Umweltanalytik, 3rd ed.; VDLUFA: Darmstadt, Germany, 2003. [Google Scholar]
  50. Bassler, R. VDLUFA-Methodenbuch, Band III: Die Chemische Untersuchung von Futtermitteln; 3. Aufl., 2. Ergänzungslieferung 1988 und 3. Ergänzungslieferung 1993; VDLUFA-Verlag: Darmstadt, Germany, 1988. [Google Scholar]
  51. Amtsblatt, D.E.U. Verordnung (EG) Nr. 152/2009 der Kommission vom 27.01. 2009 zur Festlegung der Probenahmeverfahren und Analysemethoden für die amtliche Untersuchung von Futtermitteln. L 2009, 54, 130. [Google Scholar]
  52. Heinecke, A. Beitrag zur Ermittlung der Biochemischen Ursachen der Schwarzfleckigkeit bei Kartoffeln; Georg-August-Universität Göttingen: Gottingen, Germany, 2007. [Google Scholar]
  53. Baty, F.; Ritz, C.; Charles, S.; Brutsche, M.; Flandrois, J.-P.; Delignette-Muller, M.-L. A toolbox for nonlinear regression in R: The package nlstools. J. Stat. Softw. 2015, 66, 1–21. [Google Scholar] [CrossRef]
  54. Fox, J. Nonlinear Regression and Nonlinear Least Squares; Wiley: New York, NY, USA, 2002. [Google Scholar]
  55. Demagante, A.L.; Zaag, P.V. The response of potato (Solanum spp.) to photoperiod and light intensity under high temperatures. Potato Res. 1988, 31, 73–83. [Google Scholar] [CrossRef]
  56. Sale, P.J.M. Productivity of vegetable crops in a region of high solar input. II. Yields and efficiencies of water use and energy. Aust. J. Agric. Res. 1973, 24, 751–762. [Google Scholar] [CrossRef]
  57. Kuruppuarachchi, D.S.P. Intercropped potato (Solanum spp.): Effect of shade on growth and tuber yield in the northwestern regosol belt of Sri Lanka. Field Crops Res. 1990, 25, 61–72. [Google Scholar] [CrossRef]
  58. Ebwongu, M.; Adipala, E.; Ssekabembe, C.K.; Kyamanywa, S.; Bhagsari, A.S. Effect of intercropping maize and Solanum potato on yield of the component crops in central Uganda. Afr. Crop Sci. J. 2001, 9, 83–96. [Google Scholar] [CrossRef]
  59. Menzel, C.M. Tuberization in potato at high temperatures: Interaction between temperature and irradiance. Ann. Bot. 1985, 55, 35–39. [Google Scholar] [CrossRef]
  60. Struik, P.C.; Vreugdenhil, D.; Haverkort, A.J.; Bus, C.B.; Dankert, R. Possible mechanisms of size hierarchy among tubers on one stem of a potato (Solanum tuberosum L.) plant. Potato Res. 1991, 34, 187–203. [Google Scholar] [CrossRef]
  61. Abu-Zinada, I.A.; Mousa, W.A. Growth and productivity of different potato varieties under Gaza Strip conditions. Int. J. Agric. Crop Sci. 2015, 8, 433. [Google Scholar]
  62. Stamm, P.; Kumar, P.P. The phytohormone signal network regulating elongation growth during shade avoidance. J. Exp. Bot. 2010, 61, 2889–2903. [Google Scholar] [CrossRef] [PubMed]
  63. Arsenault, W.J.; LeBlanc, D.A.; Tai, G.C.; Boswall, P. Effects of nitrogen application and seedpiece spacing on yield and tuber size distribution in eight potato cultivars. Am. J. Potato Res. 2001, 78, 301–309. [Google Scholar] [CrossRef]
  64. Putz, B. Kartoffeln: Züchtung, Anbau, Verwertung; Behr’s Verlag: Hamburg, Germany, 1989. [Google Scholar]
  65. Struik, P.C.; Haverkort, A.J.; Vreugdenhil, D.; Bus, C.B.; Dankert, R. Manipulation of tuber-size distribution of a potato crop. Potato Res. 1990, 33, 417–432. [Google Scholar] [CrossRef]
  66. Delaplace, P.; Brostaux, Y.; Fauconnier, M.-L.; du Jardin, P. Potato (Solanum tuberosum L.) tuber physiological age index is a valid reference frame in postharvest ageing studies. Postharvest Biol. Technol. 2008, 50, 103–106. [Google Scholar] [CrossRef]
  67. O’Brien, P.J.; Firman, D.M.; Allen, E.J. Effects of shading and seed tuber spacing on initiation and number of tubers in potato crops (Solanum tuberosum). J. Agric. Sci. 1998, 130, 431–449. [Google Scholar] [CrossRef] [Green Version]
  68. de Lucas, M.; Davière, J.-M.; Rodríguez-Falcón, M.; Pontin, M.; Iglesias-Pedraz, J.M.; Lorrain, S.; Fankhauser, C.; Blázquez, M.A.; Titarenko, E.; Prat, S. A molecular framework for light and gibberellin control of cell elongation. Nature 2008, 451, 480. [Google Scholar] [CrossRef]
  69. Sun, T. Gibberellin-GID1-DELLA: A Pivotal Regulatory Module for Plant Growth and Development. Plant Physiol. 2010, 154, 567–570. [Google Scholar] [CrossRef]
  70. García-Martinez, J.L.; Gil, J. Light regulation of gibberellin biosynthesis and mode of action. J. Plant Growth Regul. 2001, 20, 354–368. [Google Scholar] [CrossRef]
  71. Kamiya, Y.; García-Martínez, J.L. Regulation of gibberellin biosynthesis by light. Curr. Opin. Plant Biol. 1999, 2, 398–403. [Google Scholar] [CrossRef]
  72. Wurr, D.C.E.; Hole, C.C.; Fellows, J.R.; Milling, J.; Lynn, J.R.; O’Brien, P.J. The effect of some environmental factors on potato tuber numbers. Potato Res. 1997, 40, 297–306. [Google Scholar] [CrossRef]
  73. Kolbe, H.; Stephan-Beckmann, S. Development, growth and chemical composition of the potato crop (Solanum tuberosum L.). II. Tuber and whole plant. Potato Res. 1997, 40, 135–153. [Google Scholar] [CrossRef]
  74. Ewing, E.E.; Wareing, P.F. Shoot, Stolon, and Tuber Formation on Potato (Solanum tuberosum L.) Cuttings in Response to Photoperiod. Plant Physiol. 1978, 61, 348–353. [Google Scholar] [CrossRef] [PubMed]
  75. Pohjakalli, O. On the effect of the intensity of light and length of day on the energy economy of certain cultivated plants. Acta Agric. Scand. 1950, 1, 153–175. [Google Scholar] [CrossRef]
  76. Saha, R.R.; Sarker, A.Z.; Talukder, A.H.M.M.R.; Akter, S.; Golder, P.C. Variability in Growth and Yield of Potato Varieties at Different Locations of Bangladesh. Bangladesh Soc. Hortic. Sci. 2016, 2, 101–110. [Google Scholar]
  77. Hébert, Y.; Guingo, E.; Loudet, O. The Response of Root/Shoot Partitioning and Root Morphology to Light Reduction in Maize Genotypes. Crop Sci. 2001, 41, 363–371. [Google Scholar] [CrossRef]
  78. Geigenberger, P.; Kolbe, A.; Tiessen, A. Redox regulation of carbon storage and partitioning in response to light and sugars. J. Exp. Bot. 2005, 56, 1469–1479. [Google Scholar] [CrossRef]
  79. Manrique, L.A.; Kinry, J.R.; Hodges, T.; Axness, D.S. Dry Matter Production and Radiation Interception of Potato. Crop Sci. 1991, 31, 1044–1049. [Google Scholar] [CrossRef]
  80. Dam, J.V.; Kooman, P.L.; Struik, P.C. Effects of temperature and photoperiod on early growth and final number of tubers in potato (Solanum tuberosum L.). Potato Res. 1996, 39, 51–62. [Google Scholar]
  81. Streck, N.A.; de Paula, F.L.M.; Bisognin, D.A.; Heldwein, A.B.; Dellai, J. Simulating the development of field grown potato (Solanum tuberosum L.). Agric. For. Meteorol. 2007, 142, 1–11. [Google Scholar] [CrossRef]
  82. Sale, P.J.M. Effect of shading at different times on the growth and yield of the potato. Aust. J. Agric. Res. 1976, 27, 557–566. [Google Scholar] [CrossRef]
  83. Loewe, V.; Delard, C. Stone pine (Pinus pinea L.): An interesting species for agroforestry in Chile. Agrofor. Syst. 2019, 93, 703–713. [Google Scholar] [CrossRef]
  84. Tekalign, T.; Hammes, P.S. Growth and productivity of potato as influenced by cultivar and reproductive growth—I. Stomatal conductance, rate of transpiration, net photosynthesis, and dry matter production and allocation. Sci. Hortic. 2005, 105, 13–27. [Google Scholar] [CrossRef]
  85. Tekalign, T.; Hammes, P.S. Growth and productivity of potato as influenced by cultivar and reproductive growth—II. Growth analysis, tuber yield and quality. Sci. Hortic. 2005, 105, 29–44. [Google Scholar] [CrossRef]
  86. Knowles, N.R.; Knowles, L.O. Manipulating stem number, tuber set, and yield relationships for northern-and southern-grown potato seed lots. Crop Sci. 2006, 46, 284–296. [Google Scholar] [CrossRef]
  87. Kolbe, H.; Stephan-Beckmann, S. Development, growth and chemical composition of the potato crop (Solanum tuberosum L.). I. leaf and stem. Potato Res. 1997, 40, 111–129. [Google Scholar] [CrossRef]
  88. Kläring, H.-P.; Krumbein, A. The effect of constraining the intensity of solar radiation on the photosynthesis, growth, yield and product quality of tomato. J. Agron. Crop Sci. 2013, 199, 351–359. [Google Scholar] [CrossRef]
  89. Gautier, H.; Diakou-Verdin, V.; Bénard, C.; Reich, M.; Buret, M.; Bourgaud, F.; Poëssel, J.L.; Caris-Veyrat, C.; Génard, M. How does tomato quality (sugar, acid, and nutritional quality) vary with ripening stage, temperature, and irradiance? J. Agric. Food Chem. 2008, 56, 1241–1250. [Google Scholar] [CrossRef] [PubMed]
  90. Burlingame, B.; Mouillé, B.; Charrondière, R. Nutrients, bioactive non-nutrients and anti-nutrients in potatoes. J. Food Compos. Anal. 2009, 22, 494–502. [Google Scholar] [CrossRef]
  91. NASA POWER Data Access Viewer. Available online: https://power.larc.nasa.gov/data-access-viewer/ (accessed on 1 November 2018).
Figure 1. The monthly cumulative precipitation (mm, blue bars), mean air temperature (°C, solid, red line) and average total solar irradiance (MJ m−2 day−1, filled, black circles) during the experimental years 2015 to 2017 at Rheinstetten-Forchheim.
Agronomy 09 00330 g001
Figure 2. Average values for the observed (symbols) plant height (cm) depending on GDD (°Cd) for the four shade levels and the two years; 2016 (0% open square, 12% open triangle, 26% open circle and 50% open diamond) and 2017 (0% filled square, 12% filled triangle, 26% filled circle and 50% filled diamond) and the fitted growth function (solid, red line) for plant height over all shade levels and years.
Agronomy 09 00330 g002
Figure 3. Tuber Dry Matter Yield (Mg ha−1) for the different shade levels (0%, 12%, 26% and 50%) in the single experiment years. Black bars represent the standard error of mean. Means with identical letters within one year show non-significant differences between the shade levels (LSD, α ≤ 0.05).
Agronomy 09 00330 g003
Figure 4. Total solar irradiance (MJ m−2 day−1) during the potential potato growing season in Europe (01 March–31 October, 1984–2013) and the theoretical limits of cultivation under shade values of 0%, 12%, 26% and 50% (0.5 × 0.5 m grid, data source NASA [91]).
Agronomy 09 00330 g004
Table 1. Date, amount, active ingredient and pure nutrient amount of the applied fertilizer. The day of the year (DOY) is given in parentheses beneath the corresponding date.
DateFertilizerActive IngredientPure Nutrient
16 April 2015
(DOY 106)
130 kg ha1 lime-nitrogen20% N, 50% CaO26 kg N, 46 kg Ca
300 kg ha−1 ALZON4646% N138 kg N
600 kg ha−1 potassium sulfate with magnesium23% P2O5, 9% S60 kg P, 54 kg S
200 kg ha−1 superphosphate 1818% P2O5, 12% S16 kg P, 24 kg S
11 April 2016
(DOY 102)
350 kg ha−1 lime-nitrogen20% N, 50% CaO70 kg N, 125 kg Ca
12 April 2016
(DOY 103)
260 kg ha−1 calcium ammonium nitrate 27% N70 kg N
450 kg ha−1 superphosphate 18 18% P2O5, 12% S35 kg P, 54 kg S
1110 kg ha−1 sulphate of potash
containing magnesium salt
30% K2O, 10% MgO,
17% S
276 kg K, 67 kg
Mg, 189 kg S
13 April 2017
(DOY 103)
260 kg ha−1 ALZON4646% N120 kg N
970 kg ha−1 sulphate of potash containing magnesium salt30% K2O, 10% MgO,
17% S
242 kg K, 58 kg Mg, 165 kg S
27 April 2017
(DOY 117)
390 kg ha−1 superphosphate 1818% P2O5, 12% S31 kg P 47 kg S
Table 2. The calculated total solar irradiance for the shading treatments during the period without shading (-S, planting growth stage (GS) 000 to emergence GS 009), the period with shading (+S, emergence GS 009 to harvest GS 909) and the whole growing period (GP, planting GS 000 to harvest GS 909) (MJ m−2 day−1), the duration of these time periods (days) is given in parentheses.
Total Solar Irradiance (MJ m−2 day−1)
Year2015 2016 2017
Time
Period
-S
(26)
+S
(112)
GP
(138)
-S
(26)
+S
(121)
GP
(147)
-S
(32)
+S
(115)
GP
(147)
Shading level0%18.5220.2219.9017.7019.1518.9014.8720.1318.96
12% 17.8017.9316.8617.0017.7217.08
26% 14.9715.6414.1714.8014.9014.89
50% 10.1111.709.5810.0110.0711.14
values for +S were calculated by subtracting the light reduction by nets from the measured total irradiance at 0% shade.
Table 3. Duration of growing phases in Growing Degree Days (°Cd) and the range of days from planting to emergence (P-E), emergence to flowering initiation (E-F), flowering initiation to senescence initiation (F-S) and senescence initiation to harvest day (S-H) in 2016 and 2017 for the four shading levels (0%, 12%, 26% and 50%). From planting to emergence is a phase without shading (-S), from emergence to harvesting potatoes were shaded (+S; see also Table 2). Phases correspond to the GS 000 to 009 (P-E), 009 to 601 (E-F), 601 to 901 (F-S) and 901 to 909 (S-H). SEM gives the standard error of means.
Duration of Growing Phases
-S+S
YearShadeP-EE-FF-SS-H
GDDdaysGDDdayGDDdaysGDDdays
20160%13226559 c 42973 b30168948
12%13226573 b43973 b29168548
26%13226580 b441211 a43168533
50%13726598 a451211 a42168533
SEM2.24 3.62 0.00 2.03
p-values $
Replicate0.422 0.422 1.000 0.422
Shade0.455 0.002 <0.0001 0.455
20170%16932440 b21100339175554
12%17332447 b21101639176854
26%17332444 b21101139176454
50%16932467 a24100736176054
SEM2.93 2.79 4.17 4.02
p-values $
Replicate0.670 1.000 0.823 0.708
Shade0.654 0.002 0.249 0.243
Means with identical letters within each column and year show non-significant differences between the shade levels of the single years (LSD test, α ≤ 0.05). Note: The SEM was between 0 and 0.005, so rounding to two decimal places resulted in a SEM of zero. $ p-value for the F-test of the corresponding factor.
Table 4. Mean growth parameters for two potato plants under four different shade levels (0%, 12%, 26% and 50%) evaluated in 2016 and 2017 at GS 405/625 (maximum foliage growth was reached); number of stems per plant, number of tuber per plant, tuber mass per plant (g), foliage mass per plant (g), foliage:tuber mass ratio (%), total mass per plant (g) and the harvest index (HI). SEM gives the standard error of means.
ShadeNumber of Stems per PlantNumber of Tubers per PlantTuber Mass per PlantFoliage Mass per PlantFoliage:Tuber Mass RatioTotal Mass per PlantHI
Year2016
0%2.5010.5044.4748.211.3292.680.45
12%3.6712.44 56.7057.061.25113.760.48
26%4.1712.83 49.8175.452.45125.250.36
50%4.1713.6736.2857.051.8193.330.39
SEM0.852.7910.979.980.5319.660.04
p-values $
Replicate0.2480.1440.1040.5090.0920.4880.002
Shade0.4790.8730.6120.3000.4170.5850.213
Year2017
0%4.8319.00 a 103.60 a79.370.95 b182.97 a0.54
12%3.5017.83 a51.28 b64.701.58 b115.98 b0.43
26%3.1713.17 ab66.32 ab62.151.00 b128.47 ab0.52
50%3.339.00 b32.68 b 60.074.67 a 86.12 b0.25
SEM0.512.4714.0510.590.9221.150.06
p-values $
Replicate0.8350.6050.5100.2590.5730.4730.788
Shade0.1860.0380.0200.5750.0510.0320.064
Means with identical letters within each column and year show non-significant differences between the shade levels of the single years (LSD test, α ≤ 0.05). SEM for 12% shade ± 3.08 due to missing value. SEM for 50% shade ± 15.53 due to missing value. SEM for 50% shade ± 1.02 due to missing value. $ p-value for the F-test of the corresponding factor.
Table 5. Mean of starch content (% DM), fractions of undersized (<30 mm), table sized (30–60 mm) and oversized tubers (>60 mm) (%), the black spot bruise index (BSB, %) and the macronutrient content of N, P, K, Ca, Mg and S (% DM) for the different shade levels (0%, 12%, 26% and 50%) averaged over the three experiment years. SEM gives the standard error of means.
StarchFraction O BSBNPKCaMgS
Shade UndersizedTableOversized
0%70.454.3974.8319.1816.801.300.212.620.030.130.19
12%71.044.6977.2717.0619.811.310.222.650.030.130.19
26%70.067.8476.4812.6219.70 1.360.222.700.030.130.18
50%68.435.6283.908.8626.651.420.232.690.030.130.19
SEM0.672.604.9974.023.82 0.050.010.070.00 0.00 0.01
p-values $
Year0.0430.0340.0710.0110.1570.066<0.00010.011<0.00010.0260.055
Shade0.0630.8060.6420.4150.3860.3390.4480.8640.8080.9210.853
Year x Replicate0.4240.7050.2340.0280.0110.2060.2990.2870.1040.0430.138
O Data available for 2016 and 2017 only. SEM for 26% shade ± 3.89% due to missing value. Note: The SEM was between 0 and 0.005, so rounding to two decimal places resulted in a SEM of zero. $ p-value for the global F-test of the corresponding factor.

