Next Article in Journal
Soil Macronutrient Responses in Diverse Landscapes of Southern Tallgrass to Two Stocking Methods
Next Article in Special Issue
Variability in Water Use Efficiency of Grapevine Tempranillo Clones and Stability over Years at Field Conditions
Previous Article in Journal
Addition of Biochar to a Sandy Desert Soil: Effect on Crop Growth, Water Retention and Selected Properties
 
 
Erratum published on 10 July 2019, see Agronomy 2019, 9(7), 365.
Article

Post-Harvest Regulated Deficit Irrigation in Chardonnay Did Not Reduce Yield but at Long-Term, It Could Affect Berry Composition

Efficient Use of Water in Agriculture Program, Institute of Agrifood Research and Technology (IRTA). Parc Científic i Tecnològic Agroalimentari de Gardeny (PCiTAL), Fruitcentre, 25003 Lleida, Spain
*
Author to whom correspondence should be addressed.
Passed away in 2017.
Agronomy 2019, 9(6), 328; https://doi.org/10.3390/agronomy9060328
Submission received: 14 May 2019 / Revised: 17 June 2019 / Accepted: 18 June 2019 / Published: 20 June 2019
(This article belongs to the Special Issue Tackling Grapevine Water Relations in a Global Warming Scenario)

Abstract

:
Future increases in temperatures are expected to advance grapevine phenology and shift ripening to warmer months, leaving a longer post-harvest period with warmer temperatures. Accumulation of carbohydrates occurs during post-harvest, and has an influence on vegetative growth and yield in the following growing season. This study addressed the possibility of adopting regulated deficit irrigation (RDI) during post-harvest in Chardonnay. Four irrigation treatments during post-harvest were applied over three consecutive seasons: (i) control (C), with full irrigation; (ii) low regulated deficit irrigation for sparkling base wine production (RDIL SP), from harvest date of sparkling base wine, irrigation when stem water potential (Ψstem) was less than −0.9 MPa; (iii) mild regulated deficit irrigation for sparkling base wine production (RDIM SP), from harvest date of sparkling base wine, irrigation when Ψstem was less than −1.25 MPa; (iv) mild regulated deficit irrigation for wine production (RDIM W), from harvest data of wine, irrigation when Ψstem was less than −1.25 MPa. Root starch concentration in full irrigation was higher than under RDI. Yield parameters did not differ between treatments, but differences in berry composition were detected. Considering that the desirable berry composition attributes of white varieties are high in titratable acidity, it would seem inappropriate to adopt RDI strategy during post-harvest. However, in a scenario of water restriction, it may be considered because there was less impact on yield and berry composition than if RDI had been adopted during pre-harvest.

1. Introduction

Climate change projections for the Mediterranean region indicate a pronounced warming, which would lead to a greater occurrence of higher temperatures, more frequent drought events, and a decrease in precipitation, particularly during the warm season [1,2]. Water is probably the most vulnerable resource in the region, but in viticulture it is essential to guarantee stable grape yields and composition [3,4]. In the Mediterranean region, growing wine grapes is one of the most important crops, occupying approximately 2,768,000 hectares of farmland [5]. In recent decades, the area of irrigated vineyards has notably increased [6], largely due to vine-growers’ concerns about the negative effects of water deficits on yield and berry composition [7], but also because of an increase in the total irrigated area. As a result, we now have a scenario in which water demand is likely to increase while water supplies will probably shrink. It would seem reasonable to think that demand and supply can only be brought into a sustainable balance by implementing the sustainable management of water resources, focusing on conserving water and using it more efficiently for irrigation.
In wine grapes, the adoption of regulated deficit irrigation (RDI) has been widely recognized as a water-saving technique that is effective for both controlling vine vegetative growth and improving berry composition [3,8]. The timing, intensity and optimal period during the growing season at which to apply water stress have all been widely studied for different grape varieties [9,10]. Most of these studies have demonstrated benefits for berry composition and wine quality, though this has only been achieved in red cultivars, as Cabernet Sauvignon, Shiraz and Tempranillo [11,12]. There is still a lack of, and much less definitive, information about the effects of adopting different RDI strategies with white cultivars. However, some recent studies involving cv. Chardonnay (Vitis vinifera L.) demonstrated that applying water stress during post-veraison had a negative effect on certain of the sensory attributes of the resulting wines [13,14]. Among white varieties, Chardonnay is one of the most commonly used cultivars for producing sparkling wines [15]. The most appreciated organoleptic characteristics that enologists look for in base wines destined to produce sparkling wine are the presence of high levels of titratable acidity (TA), a low pH, and a low soluble solids concentration (SSC), all of which are enhanced by adopting full irrigation strategies [16,17]. The main concern related to irrigating at full potential is the huge amount of water consumed over a complete growing season; in the Mediterranean region, this has been estimated to range from 350 to 550 mm [17,18]. This is likely to be even more critical in a scenario of water shortage or when water restrictions are imposed by local irrigation managers. Such situations often occur at the end of the growing season and affect the post-veraison and post-harvest stages.
In addition, we must consider that the expected increase in temperatures will also advance grape phenology; this may result in an advance of the ripening period to the warmest months of the year [19,20,21]. Consequently, post-harvest periods will be longer and will also coincide with warmer temperatures. Irrigation efficiency during the post-harvest stage has often been overlooked, but in a climate change scenario, it may merit more attention. Water applied during this stage accounts for ~26% of total annual crop evapotranspiration [17]. Although it may be appropriate to adopt deficit irrigation strategies, knowledge concerning its possible implications for the following growing season is still currently scant. In addition, the post-harvest stage is particularly important for storage reserve accumulation. It sustains the mobilization of accumulated carbohydrates for new vegetative growth in the subsequent growing season, until photosynthesis once more becomes the main source of carbon [22,23]. After harvest, carbon assimilation is possible while vines still retain functional leaves and through until leaf fall. A loss of leaf area during this period, either due to water stress or defoliation, may therefore affect vegetative growth and yield in the following season [24,25]. To the best of our knowledge, there has so far been no study conducted with white wine grape cultivars that has evaluated the carry-over effects of adopting different RDI strategies during the post-harvest period into subsequent seasons.
The current study was based on the assumption that post-harvest RDI can be used as an appropriate water-saving irrigation strategy and that if properly applied, this may prevent any negative effects on yield and berry composition during the subsequent growing season. The aim of this research was therefore to determine whether adopting different irrigation strategies during the post-harvest stage could influence carbohydrate accumulation in the roots of Chardonnay wine grapes. We also sought to study the influence of RDI on the physiological, yield response, and berry composition attributes of wine grapes.

2. Materials and Methods

2.1. Study Site and Plant Material

The study was carried out during the 2013– 2016 growing seasons, at a 13-year-old Chardonnay commercial vineyard, located in Raïmat (41°39′50″ N – 0°30′27″ E), Lleida (Catalonia, Spain). The vines were grafted onto SO4 rootstock and planted with a 3.0 m × 2.0 m spacing and a north-south row orientation. The soil texture was loam and the effective soil depth was ~60 to 120 cm. The canopy system was trained using vertical shoot positioning (VSP), with a bilateral, spur-pruned cordon located 1.0 m aboveground. Winter pruning left 10 to 15 spurs on each vine. The soil had a loamy texture, with an effective soil depth of between 0.6 and 1.2 m. The local climate was Mediterranean, with an average annual rainfall and reference evapotranspiration (ETO) of 341 mm and 1,060 mm, respectively. Disease control and nutrition vine management were conducted following the wine grape production protocol of the ’Costers del Segre’ Denomination of Origin (Catalonia, Spain).

2.2. Experimental Conditions

The average air temperature (Ta) and the evaporative water demand (ETO) during the vegetative growing period were similar from year to year (Table 1). There were, significant differences during the post-harvest stage, and particularly in 2014. This was probably due to rainfall of 172.8 mm in the late-summer of 2014 and a resulting higher ETO.

2.3. Irrigation Treatments

Irrigation was applied daily, using a drip irrigation system with two pressure-compensating emitters, which provided 2.3 L/ha per vine, positioned at regular intervals along the pipe. The vines were irrigated early in the morning, using an individual controller to open and close the solenoid valves in each experimental unit. Meteorological data were gathered from an automated weather station belonging to the Catalonia’s official network of meteorological stations (SMC, www.ruralcat.net/web/guest/agrometeo.estacions); this was located 1 km from the study site. Weekly irrigation was scheduled following the water balance method described by Allen et al. (1998) [26]. Crop evapotranspiration (ETC) was calculated using the ETO Penman-Monteith [26] and we used crop coefficients (KC) obtained from previous experiments conducted in the same vineyard [17].
The irrigation treatments applied were: (i) control (C), irrigation at full crop evapotranspiration (ETC = 100%) throughout the growing season. The berries were then used to produce sparkling base wine; (ii) low regulated deficit irrigation for sparkling base wine production (RDIL SP), full irrigation until harvest. During the post-harvest stage, weekly irrigation was applied at different percentages of ETC to maintain the midday stem water potential (Ψstem) at −0.9 MPa. The berries were used to produce sparkling base wine; (iii) mild regulated deficit irrigation for sparkling base wine production (RDIM SP), with full irrigation until harvest. During the post-harvest stage, irrigation was reduced applying different percentages of ETC until Ψstem reached −1.25 MPa. The berries were used to produce sparkling base wine; and (iv) mild regulated deficit irrigation for wine production (RDIM W), with full irrigation until harvest. During the post-harvest stage, it was applied weekly irrigation at different percentages of ETC to maintain Ψstem at −1.25 MPa. The berries were used to produce wine. Percentages of ETC were decided according to the difference between actual measured Ψstem and the target Ψstem, and ranged between 1.3 to 12.4% for RDIL SP, 1.0 to 43.2% for RDIM SP, and 0.2 to 42.2% for RDIM W.

2.4. Experimental Design

The experimental design consisted of a randomized complete block with four block replicates. Each block contained four experimental plots with four rows of eight vines per row. Measurements were taken from the 12 central vines (six in each row) in the two rows in the middle of each plot, while the others acted as guard vines.

2.5. Measurements

2.5.1. Water Applied and Vine Water Status

Each day, the volume of water applied was measured and recorded for each plot, using digital water meters (CZ2000-3M; Contazara, Zaragoza, Spain). The midday stem water potential (Ψstem) was measured on a weekly basis from April to natural leaf fall. Measurements were taken within one hour of solar noon. Two shaded leaves per experimental plot were selected and wrapped in aluminum foil bags one hour before the measurements were taken. The measurements were acquired in less than one hour, using a pressure chamber (plant water status console, model 3500; Soil moisture Equipment Corp., Santa Barbara, CA), and following the protocol established by Shackel et al. (1997) [27]. The integrated stem water potential was calculated with Ψstem readings for successive dates, as described in Basile et al. (2011) [28], during the 2015 post-harvest period.

2.5.2. Leaf Net CO2 Assimilation Rate, Stomatal Conductance, and Transpiration Measurements

Leaf net CO2 assimilation rate (An) (µmol CO2 m−2 s−1), stomatal conductance (gs) (mmol H2O m−2 s−1), and transpiration (T) (mmol H2O m−2 s−1) were determined on a biweekly basis during the post-harvest stage of the 2015 growing season. Measurements were taken, at midday, from five vines per treatment, with one leaf being measured on each vine. The leaf net CO2 assimilation rate was obtained using an infrared gas analyzer (model LCi; ADC BioScientific Ltd., Hoddesdon, Herts, UK). A portion of the leaf was placed in the chamber and data were taken after 45 s of operation, once the An reading had stabilized. Stomatal conductance and transpiration were measured with a steady-state porometer, under light-saturated conditions (ModelLi-1600, Li-Cor, Lincoln, NE, USA).

2.5.3. Vine Measurements

Once a week, a visual inspection of the vines was performed to determine the phenological stage throughout the whole experiment. The vine phases were recorded when 50% of the shoots on the vines observed presented a certain development stage as recognized according to the description of the growth stages of the BBCH scale [29]. The shoots and inflorescences on each vine and on all the plots were counted at the onset of the vegetative period.
The canopy intercepted photosynthetically active radiation (fIR) was measured at 11:00 a.m. ± 30 min, using a ceptometer (linear probe length 80 cm; Accupar Linear PAR, Decagon Devices, Inc., Pullman, WA, USA). Measurements were taken throughout the vegetative growing period until leaf fall on five vines per experimental plot, on a biweekly basis. The ceptometer was placed in a horizontal position at ground level and perpendicular to the vines. To cover the vine spacing, five equally spaced measurements were taken on the shaded side of each vine. The incident radiation above the canopy was determined by taking two more measurements in an open space adjacent to each vine. Daily fIR (fIRd) was calculated by using an hourly model of light interception [30]. Oyarzun’s model was used to estimate the canopy porosity parameter so that the simulated value for the amount of hourly intercepted light at noon equaled the instantaneous value measured in the field. Vine structural parameters such as vine height, and canopy width perpendicular to the row were also measured. The fIRd was then calculated by integrating the diurnal course of the simulated fIR.
The canopy surface area (SA) (m2) of the vines was determined on a biweekly basis throughout the growing season. Measurements of vine canopy height and width were made using a ruler, while the length was considered to be 1 m in all cases. These measurements were conducted in the middle vine in the C, RDIM SP, and RDIM W treatments. Canopy surface area was determined as described by Smart and Stöckle (1985) [31].

2.5.4. Starch Concentration

The starch concentration in the vine roots was determined during the winter dormancy period, in December 2015, when the mobilization of reserves was negligible [32]. In all the treatments, two 10 g samples per plot were taken from roots with diameters of ± 2 mm; these were extracted from near the trunk, at a soil depth of 0.2 to 0.3 m. The extracted roots were then washed, immersed in liquid nitrogen, and dried at 65 °C in a forced-air oven. Once the dry weight was constant, the samples were ground up, using a hand mill (M20; IKA-WERKE, Staufen, Germany). Root starch was then hydrolyzed with acid and subjected to enzyme hydrolysis; this was followed by a spectrophotometric determination of the powdered samples [33].

2.5.5. Fruit Growth

From pea-sized berries (in around June) until harvest, a sample of 12 berries (one berry per vine) was collected from each elemental plot. It was recorded the average berry fresh weight, and berry dry weight, after the berries were dried to a constant weight in a forced-air oven (at 60 °C to prevent the caramelization of their sugar).

2.5.6. Harvest

The harvest was carried out manually and the following yield parameters were measured: total vine yield weight; number of clusters per vine; cluster fresh weight, which was estimated by dividing the total yield by the number of clusters per vine; and the number of berries per cluster, which was estimated by dividing the cluster fresh weight by the mean berry fresh weight.
The SSC in the berries was used to establish a standard reference for harvesting. The plots were individually harvested once the SSC levels had reached the pre-defined thresholds established by the Raïmat winery for producing either the sparkling base wine and for wine. The pre-defined SSC thresholds established for harvesting were as follows: in 2013, all the treatments were harvested at the same time (day of the year, DOY 239), based on an SSC threshold of 16.8 °Brix; in 2014, the pre-defined thresholds for harvesting were 17.5 and 21.7 °Brix, respectively, for the vines destined for the production of the sparkling base wine (DOY 216) and of wine (DOY 230); in 2015, 17.5 and 21.5 °Brix, respectively, were the values chosen for the vines destined for the production of the sparkling base wines (DOY 215) and of wine (DOY 231). In those years, C was harvested according to the same criteria as the sparkling base wine. Finally, in 2016, the grapes for all the treatments were harvested at the same time according to the criteria for producing sparkling base wines (DOY 224), with the aim to be able to compare all the treatments among them. The moment of harvest for all the treatments was defined when the SSC of C reached 16.0 °Brix. In 2016, the evolution of the SSC and TA in the berries were also tracked from approximately two weeks before harvest and throughout the post-harvest stage (in the case of berries sampled from the guard vines), with six berries being sampled from each plot, every two to three days. At harvest, however, a sample of ten representative entire clusters was analyzed from each plot. The SSC was measured using a refractometer (Palette PR-32α; ATAGO, Tokyo, Japan), and the TA was measured from a solution of NaOH until a pH of 8.2.

2.6. Analysis of Statistical Data

The significance of the differences between the irrigation treatments was evaluated using a one-way ANOVA followed by a Tukey’s test, as a post hoc test for separation of means. The statistical analysis was performed using the R software [34] and the statistical significance was established at P ≤ 0.05.

3. Results

3.1. Water Applied and Vine Water Status

The average amount of irrigation water applied until harvest over the three growing seasons was 343 mm. During the post-harvest stage, the average amounts of water applied were 107, 67, 16, and 52 mm, respectively, for the C, RDIL SP, RDIM SP, and RDIM W treatments (Figure 1A–C). The amount of water applied over the three experimental years differed significantly among treatments. When we only considered the post-harvest stage, the water savings achieved with respect to the C treatment were 37, 85 and 51%, respectively, for the RDIL SP, RDIM SP, and RDIM W treatments. On the other hand, when we considered the water savings for the whole growing season, these were 9, 20 and 12%, respectively, for RDIL SP, RDIM SP, and RDIM W treatments.
From budbreak to harvest, all the treatments were fully irrigated throughout the three consecutive growing seasons and Ψstem, which ranged from −0.3 to 0.6 MPa, did not show any significant differences between them (data not shown). Figure 1D–F shows the seasonal pattern of Ψstem for all the treatments during the post-harvest stage. In 2013, there were significant differences between all the treatments except RDIM SP and RDIM W (Figure 1D). These two treatments followed the same trend, with their Ψstem starting to decrease just after harvest until it reached the pre-defined Ψstem threshold of −1.25 MPa. The Ψstem of RDIL SP also declined just before harvest until reaching the pre-defined threshold of −0.9 MPa. The C treatment had the highest Ψstem values, which ranged from −0.4 to −0.8 MPa.
In 2014, however, the differences between treatments were not as clear, no doubt due to a series of rainfall events during the months of September and October (Figure 1B,E). The maximum differences in Ψstem occurred just after harvest and in early September and were attributable to differences in the harvest dates of the treatments applied to the vines destined to produce wine and sparkling base wine. The latter (RDIL SP and RDIM SP) had lower Ψstem values, particularly during the early post-harvest stage, when they respectively achieved the pre-defined irrigation thresholds of −0.9 and −1.25 MPa. The Ψstem of both treatments then considerably recovered after the rainfall event of 26 mm in mid-September, with the RDIL SP treatment reaching to similar values to the C treatment, while those for the RDIM SP treatment remained at around −0.7 MPa. On the other hand, the minimum Ψstem values for the RDIM W treatment were −0.7 MPa, a level that was achieved 37 days after harvest.
In 2015, Ψstem revealed significant differences between treatments throughout the post-harvest stage (Figure 1F). In general, Ψstem decreased from harvest onwards, with the maximum differences between the treatments and the minimum values being −1.25, −1.15 and −0.9 MPa, respectively, for RDIM SP, RDIM W, and RDIL SP treatments. The midday stem water potential for C ranged from −0.4 to −0.7 MPa.

3.2. Physiological Measurements

The seasonal trends for gs and T followed a similar pattern throughout the post-harvest stage (Figure 2A,B). The major differences between the treatments were seen during the early post-harvest stage, which pointed to lower gs and T values in both RDIM treatments. Then, as the vine phenology advanced, the measurements for all the treatments tended to become similar. The vines from the C treatment showed a pronounced decline in gs and T, with these values respectively dropping from 292 to 126 mmol·H2O m−2·s−1, and from 8.8 to 3.2 mmol·H2O m−2·s−1 (Figure 2A,B). Similarly, the values for RDIL SP also declined during the post-harvest period, although the initial measurements, which were taken just after harvest, were significantly lower than those for C. Although leaf net CO2 assimilation rate (An) did not show any statistically significant differences between the treatments (Figure 2C), the tendencies did slightly vary. For instance, the measurements for RDIM SP were slightly lower than those for the other treatments and they remained constant throughout the post-harvest stage, while those for the other treatments tended to decrease as the vine phenology advanced. Thus, the physiological measurements indicated that the water use efficiency (WUE), computed by the ratio An/T, was higher for the RDIM treatments than for the C treatment (Figure 2B,C).

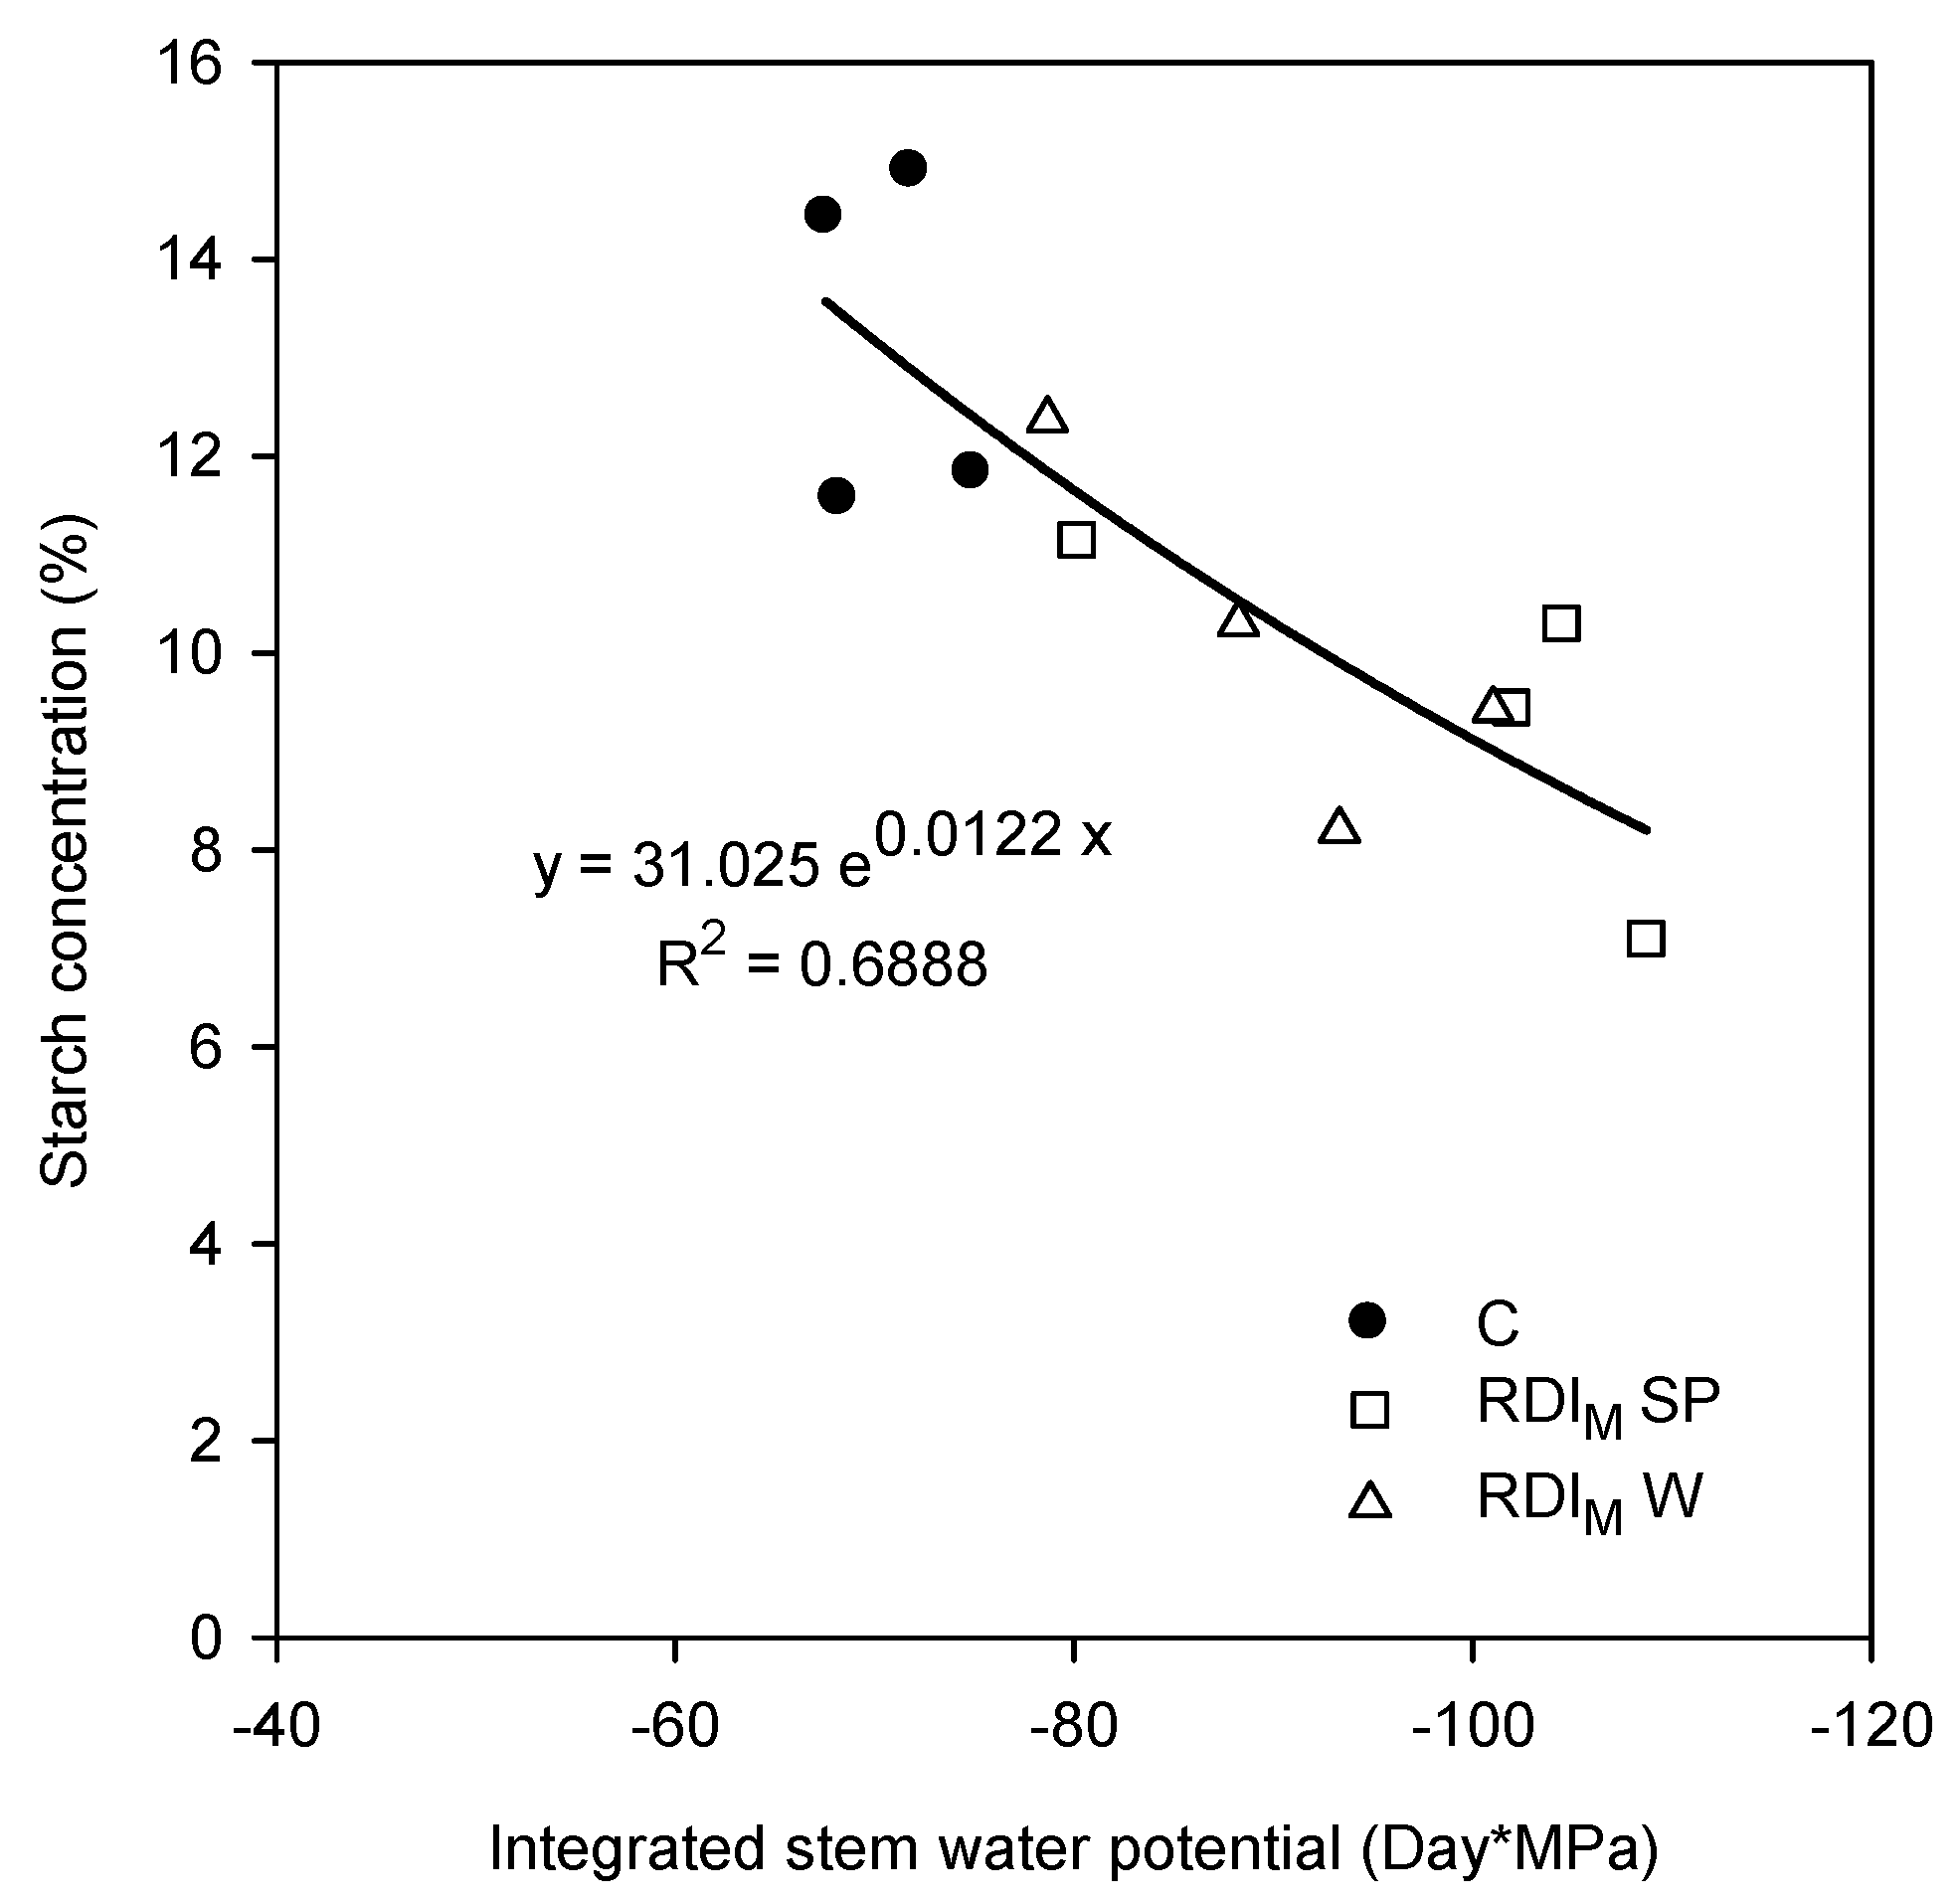
3.3. Vegetative Growth, Yield Parameters, and Starch Concentration

In 2016, visual field observations indicated that the date of budbreak differed between irrigation treatments, with the vines from the RDIM treatment being more than seven to ten days more advanced than those in the C treatment.
The ANOVA analysis indicated that adopting different deficit irrigation strategies during the post-harvest stage did not have any significant impact on measurements in the following season, either in relation to the number of shoots and inflorescences, or in vegetative growth and yield (Table 2, Figure 3 and Figure 4). Even so, the source year for the ANOVA was significant for all the vegetative growth and yield parameters (Table 2). This year effect was exemplified by differences in the canopy management, which affected the number of shoots, inflorescences, and clusters per vine; the average number of the latter were 29, 33, and 40, respectively for the years 2014, 2015, and 2016. In addition, despite the differences in the amount of water applied between one treatment and another, the ANOVA did not indicate any significant differences in yield parameters (Table 2). In fact, the seasonal evolution of fIRd over the whole study period followed the same pattern for all the treatments through until harvest (Figure 3B–D). The fIRd tended to increase throughout the season, reaching maximum values of from 0.48 to 0.52, just before harvest. On the other hand, the fIRd remained lower during the 2016 pre-harvest period, due to more severe pruning (Figure 3D). Although the statistical analysis did not show any significant differences between treatments during post-harvest, there was a noticeable trend which differentiated the treatments that had involved mild stress (RDIM SP and RDIM W) from the others (RDIL SP and C). It seems that the mild stress treatments caused an advance in leaf senescence, resulting in a reduction in the fIRd (Figure 3).
These trend in vegetative growth difference seemed more evident when we analyzed the canopy SA (Figure 4). The seasonal pattern showed that the C vines had a slightly higher SA than those in the RDIM W treatment. These differences were more noticeable in 2015 and 2016.
The starch concentration in the root reserves at the end of the 2015 growing season was significantly higher in C than in the RDI treatments (Table 2). Although these differences were not sufficient to affect the yield parameters, the results did show that these treatments had accumulated smaller reserves due to the application of the RDI strategy over the three-year period.

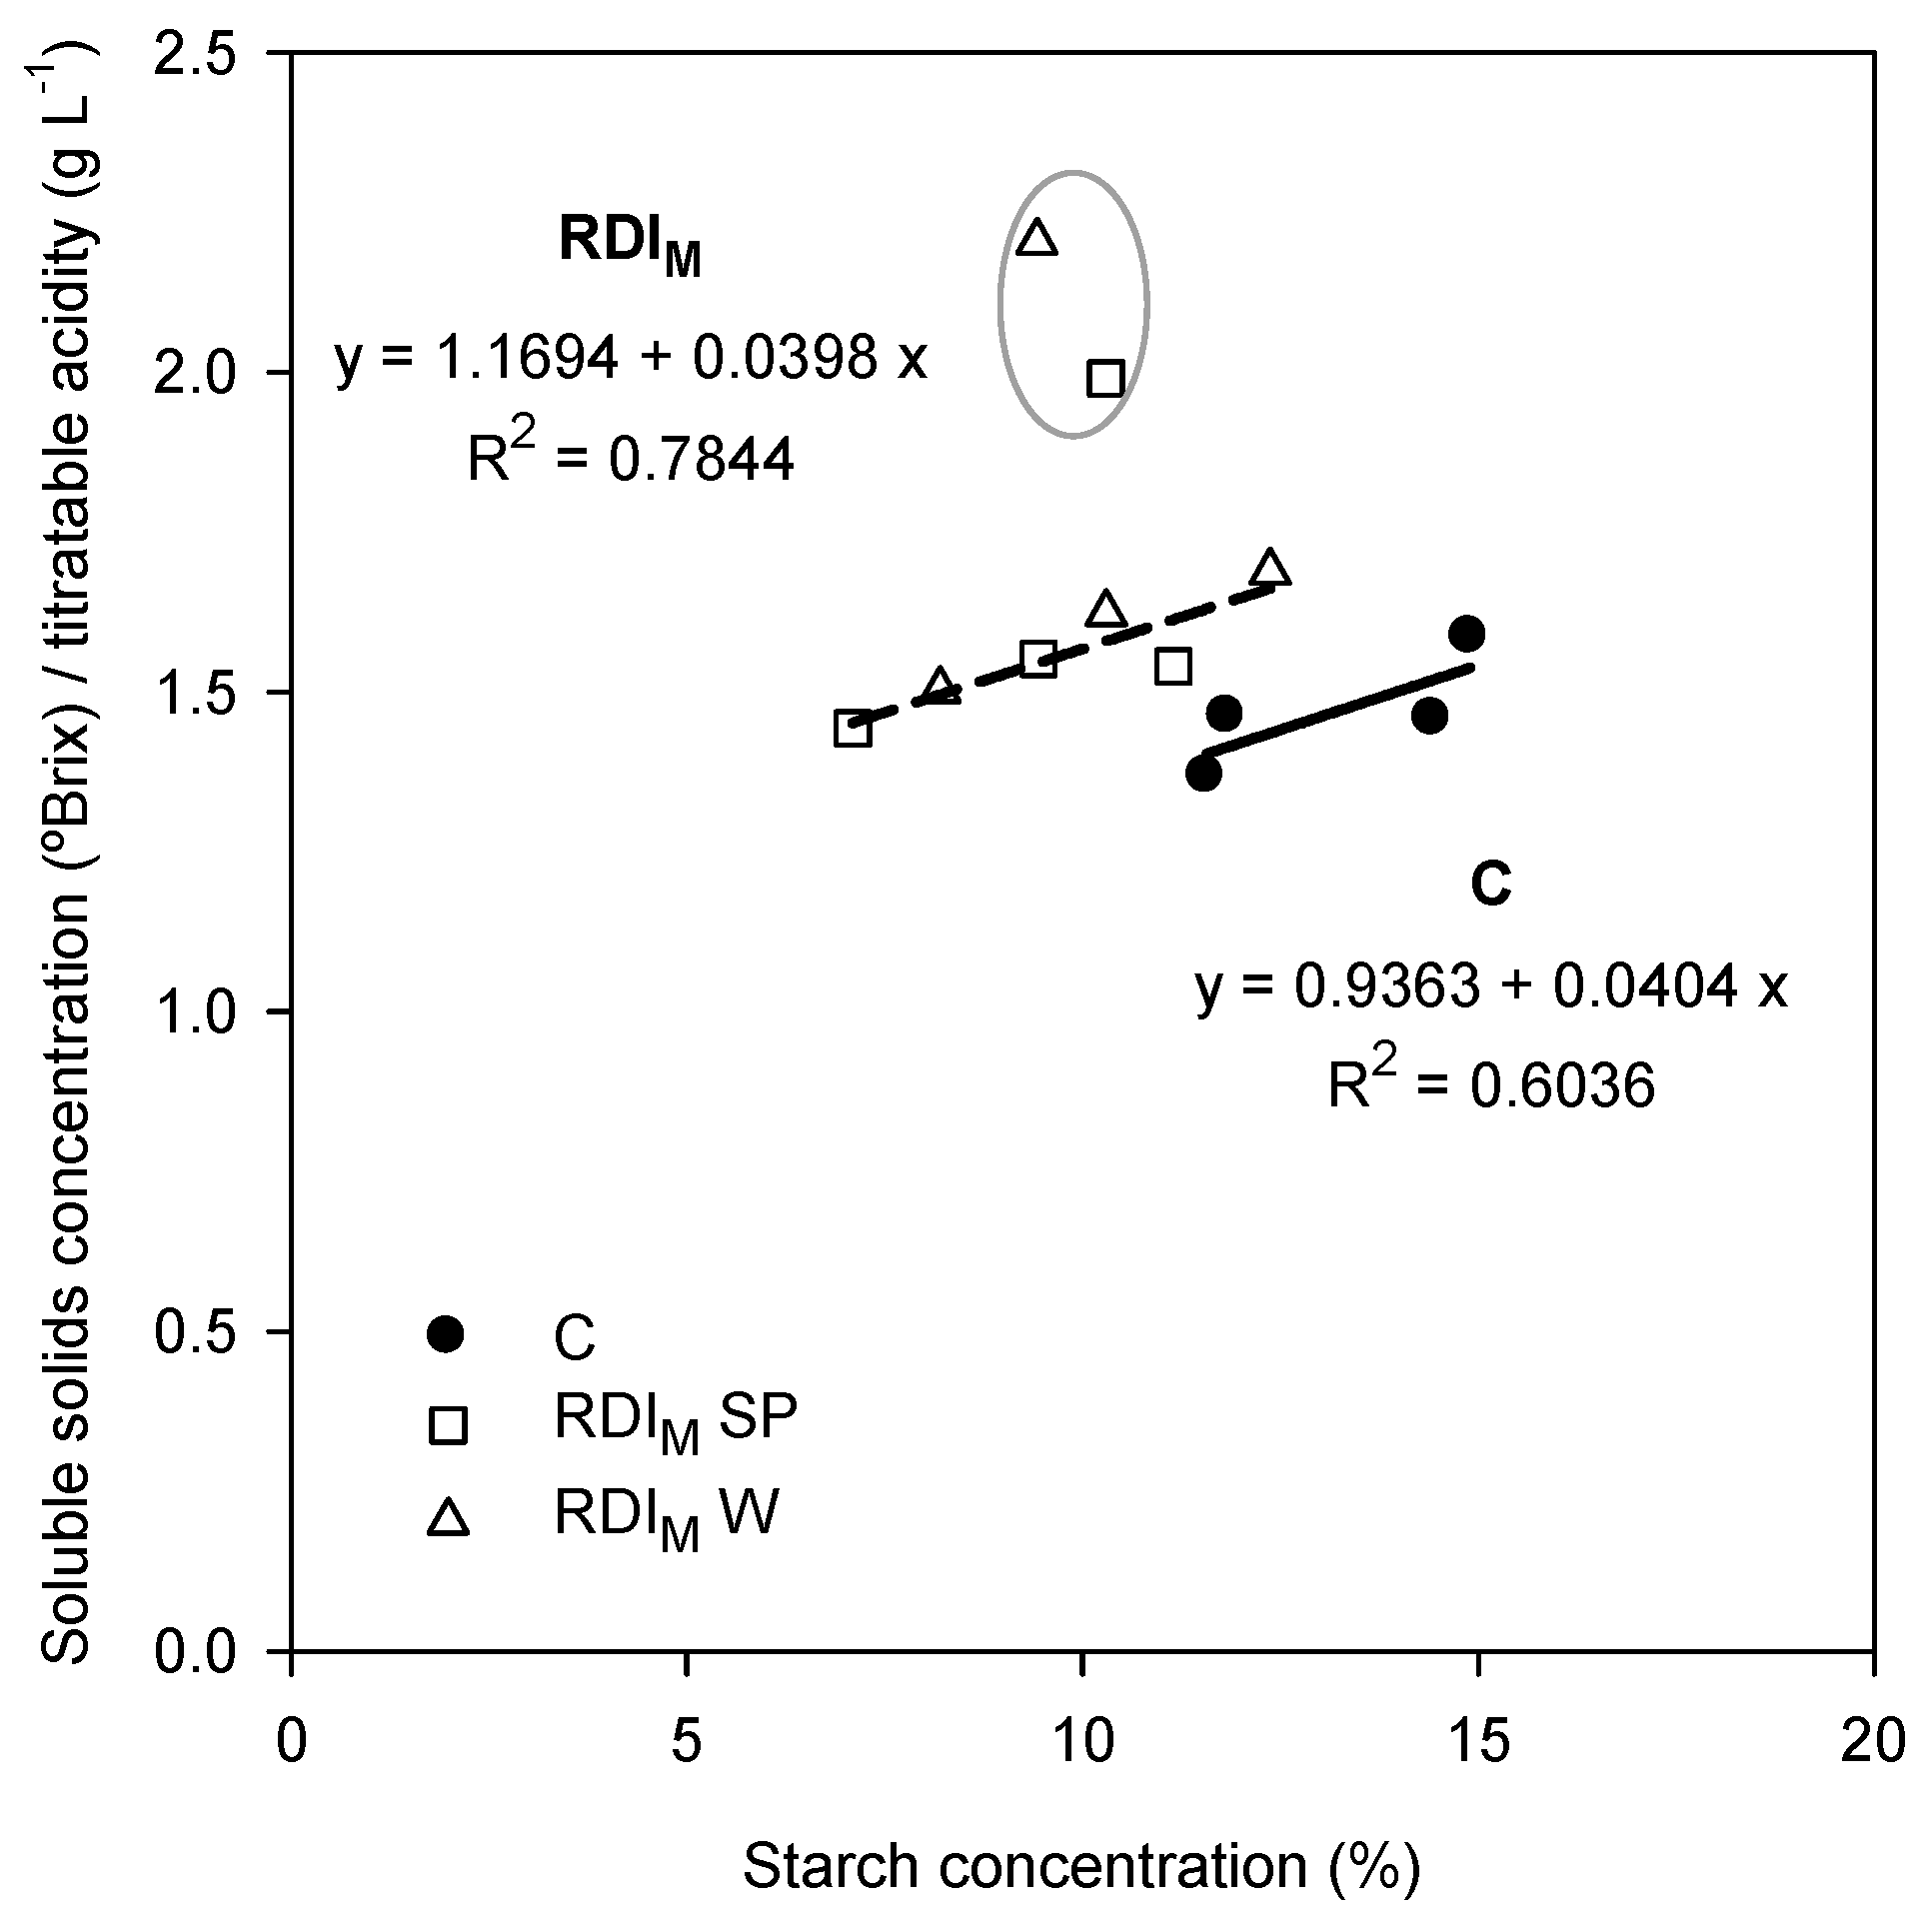
3.4. Must and Base Wine Composition

In 2014 and 2015, the harvest was carried out on DOY 216 and 215 for sparkling base wine, and DOY 230 and 231 for wine, respectively, based on the pre-defined SSC thresholds. The SSC levels for the treatments destined to produce sparkling base wine were not significantly different, while the treatment destined to produce wine had a higher SSC (Table 3). In 2014, the C and RDI treatments for sparkling base wine production had a similar TA. In 2015, however, the C treatment had a slightly higher TA than the treatments that involved deficit irrigation. In 2016, all the treatments were harvested at the same time on DOY 224, when the total SSC in the C treatment had reached 16 °Brix. It seems that those treatments that had been exposed to mild stress (RDIM SP and RDIM W) in the previous growing season had been able to synthesize more SSC than the others, while the TA was higher in treatment C than in the RDI treatments.

4. Discussion

Similar to our phenological observations of budbreak, previous works reported similar responses with studies carried out with wine grapes in which water stress during the post-harvest had affected the date of budbreak in the following growing season [35,36]. Ndung’u et al. (1997) [37] reported that stressed vines had a readily available source of energy for ready for budbreak at the onset of the growing season. This was because the amount of sugar stored at the expense of starch was higher in the shoots, trunk, and roots, which is the main reserve organs in vines [37].
Despite these differences at the budbreak date, no variations in vegetative growth among treatments were detected. This was probably due to the management of the vine canopy throughout the season, which consisted of adopting a VSP trellis system and topping the shoots in summer. This management probably helped to homogenize any slight differences that could have existed between treatments. Although the seasonal evolution of fIRd showed a similar trend for all the treatments (Figure 3), we assume that the leaf area index (LAI) may differ in vines with a VSP system. In this system, vine shoots are trained upward in a hedgerow, to maximize canopy light interception. The number of leaves and, as a result, the total leaf area per unit of ground surface, may vary despite them intercepting the same amount of light. Although we did not directly measure the LAI, Figure 4 trend to show differences in the canopy SA between treatments. These differences could mostly be explained by canopy width; suggesting that the treatments that were submitted to RDI would have had slightly smaller SAs during the subsequent growing season.
The vine roots are the main storage organ for starch, which is, in turn, the primary reserve form for carbohydrates [22]. The two main flushes of root growth for wine grapes occur around bloom and after harvest [38,39]. As a result, post-harvest is a critical period for the restoration of carbohydrates in storage tissues to sustain the vegetative growth of vines in the following season, and to maintain yield levels [24,25]. Several studies have shown the links between the accumulation of carbohydrate reserves and yield parameters and berry weight [40,41,42]; this demonstrates that post-harvest defoliation and early leaf fall influence carbohydrate accumulation in vine roots. In our study, the fully irrigated treatment (C) had the highest root starch concentration, which reached up to 13.21%. Other studies have reported similar values in the same cultivar [24,43]. In contrast, the starch concentrations for all the RDI treatments were significantly lower, averaging 9.81% (Table 2). This decline may be explained by lower carbohydrate assimilation, probably as a result of early defoliation caused by water stress (Figure 3). In addition, the minor carbohydrate accumulation in the reserve organs could, at least in part, be explained by a lower leaf net CO2 assimilation rate (An) (Figure 2C). In fact, this study demonstrates that the starch concentration was significantly affected by water stress and that it exponentially decreased in line with the integrated midday stem water potential increment (Figure 5).
Interestingly, and as we have previously reported, it seems that the greater ability to accumulate carbohydrates during the post-harvest period in the C treatment, these vines trend to have greater vegetative growth in the subsequent growing season (Table 2, Figure 4). Previous works on wine grapes, which involved defoliating vines during the post-harvest period, indicated a reduction in shoot growth in the next growing season due to a reduced capacity to accumulate carbohydrates during post-harvest [23,42]. Nevertheless, the same long-term studies also reported a decrease in yield due to a lower number of berries per cluster, as a result of the effects of cumulative water stress [23,42]. In our study, however, apart from the slight differences in vegetative growth between the C and RDIM treatments, no carry-over effects were detected in yield parameters over the three growing seasons (Table 2). Other studies conducted in early maturing cultivars of Japanese plum [44] and peach [45,46] also reported how, after the adoption of deficit irrigation during post-harvest for a period of three to five consecutive years, the yield parameters did not significantly differ among irrigation treatments. In plum, the adoption of deficit irrigation coincided with floral differentiation and it did not reduce fruit bearing. In peach, there was an increase in the appearance of double fruit, which was explained by the important influence of temperature during the carpel differentiation phase [45]. In wine grapes, the process of early flower differentiation mainly occurs during post-harvest [38,47]. It may therefore be suggest that based on the results obtained in this study, it would seem that mild water stress during this period should not have negatively affected the development of flowers in the subsequent growing season. This suggests that in years of water scarcity, or for water-saving purposes, the adoption of a moderate RDI strategy during post-harvest could be appropriate as it should not have any negative effects on yield parameters.
Among other factors, the synthesis of soluble solids in wine grapes during berry ripening mainly depends on leaf photosynthesis; it is attributable to the translocation of sucrose from the proximal leaves and, to a lesser extent, to its translocation from the storage organs [38]. Leaf photosynthesis is a function of the amount of light intercepted by the canopy and of the leaf water potential [48]. It has been widely studied that crop load affects berry composition [9,49,50]. In our study, the synthesis of SCC in the berries of the RDIM treatments was higher than in C (Table 3). However, none of the previously stated reasons could explain this as there were not statistically significant differences between the treatments. These differences may therefore be explained, in part, by the higher starch concentration registered in the C vines (Figure 6, Table 2). This effect was also observed by Greven et al. (2016) [42], who reported that vines with lower root starch concentrations tended to have higher SSC. Similarly, Ndung’u et al. (1996) [36] observed that vines that were stressed during post-harvest had higher SSC levels. They, however, attributed these differences to vine canopy management and to the environmental conditions in which the vines had matured.
The influence of the starch concentration on the SSC and TA ratio is illustrated in detail in Figure 7. Although the irrigation schedules of all the plots belonging to the same treatment were conducted according to the same criteria, differences in soil spatial variability meant that there were some plots with slight differences in vegetative growth or water status. These differences affected the starch concentration and showed that for any determined irrigation treatment, vines with higher starch concentrations also tended to have higher SSC/TA ratios. In contrast, differences between irrigation treatments showed that for a given starch concentration, RDIM vines had higher SSC/TA ratios than C vines. As previously reported, differences in the canopy surface area, and even slight phenological advances in RDIM, may have been the reason for these significant differences (Figure 4, Table 2).
Water stress during pre-harvest also influenced the SSC/TA ratio. On account of soil spatial variability, two of the RDIM treatment plots tended to have lower Ψstem and as also lower fIRd values throughout the growing season, which caused an increase in the SSC/TA ratio. Water stressed vines have a lower transpiration rate and, due to their lower evaporative cooling effect, this may contribute to increased losses in organic acids due to metabolism, resulting in grapes with a lower TA [17,51].
There is general agreement among viticulturists and enologists that the most desirable organoleptic parameters for white varieties of grape destined for the production of sparkling wines is to have a low SSC/TA ratio [15,16]. In previous studies, it was demonstrated that deficit irrigation during pre-harvest contributed negatively to TA enhancement [14,17]. The results obtained from the present study also suggest that adopting an RDI strategy during post-harvest may not be the most appropriate way to achieve that goal. The irrigation strategy recommended to enhance the berry composition attributes of white grape varieties is full irrigation throughout the growing season. However, in a scenario of water restrictions, the post-harvest period would probably also be the only time at which to reduce irrigation, since its impact on yield parameters and berry composition would be negligible and certainly much lower than during pre-harvest. Other canopy management strategies based on ‘crop forcing’ have been presented as techniques with which to fight climate change, aiming to shift periods of vine growth by delaying their initiation [52]. At the same time, they can contribute to obtaining berries with higher TA values. However, more research is needed in this direction to evaluate the long-term impact of these techniques on both yield and berry composition attributes.

5. Conclusions

In Chardonnay, it is recommended to conduct a full irrigation strategy throughout the growing season. Significant differences in the accumulation of starch concentration in roots were detected between irrigation treatments, being C the treatment that tend to accumulate more reserves. Although the adoption of RDI during post-harvest did not negatively affect the yield parameters, it did reduce the vegetative canopy surface area of the vines and increased the SSC/TA ratio of the berries. For any given starch concentration, the SSC/TA ratio tends to increase as the water stress increases. The most desirable berry composition parameters for white varieties focus on enhancing the TA and reducing the SSC/TA ratio; this can be achieved through applying full irrigation strategies. However, further research is needed to evaluate the long-term impact on yield and berry composition of applying conditions of sustained deficit irrigation during post-harvest.

Author Contributions

Formal analysis, M.T.P-L., J.B., J.M., and J.G.; Funding acquisition, M.T.P-L. and J.B.; J.M.; Investigation, M.T.P-L., J.B., J.M., and J.G.; Methodology, M.T.P-L., M.M., J.M., and J.G.; Project administration, J.G.; Resources, M.M.; Supervision, J.B., J.M., and J.G.; Writing – original draft, M.T.P-L.; Writing – review and editing, J.B. and J.G.

Funding

This research was funded by the National Institute for Agricultural and Food Research and Technology (INIA) [RTA 2012-00059-C02-01] of the Ministry of Economy and Competitiveness of the Spanish government and by the European Social Fund, and the European Union’s Horizon 2020 research and innovation programme [No 730253].

Acknowledgments

The authors are grateful to Amadeu Arbonés, Jesús del Campo, Carles Paris, Jordi Oliver, and Xavier Vallverdú, members of the staff of the Efficient Use of Water in Agriculture Programme, for their support in carrying out this activity. We are also grateful to Dr Theodore DeJong, for his help on the manuscript, and to the Raïmat winery (Codorniu Group), for its collaboration and for allowing us to carry out this study in its vineyards.

Conflicts of Interest

The authors declare no conflict of interest.

References

  1. IPCC. Climate Change 2013: The Physical Science Basis; Stocker, T.F.D., Qin, G.-K., Plattner, M., Tignor, S.K., Allen, J., Boschung, A., Nauels, Y., Xia, B.V., Midgley, P.M., Eds.; Contribution of Working Group I to the Fifth Assessment Report of the Intergovernmental Panel on Climate Change; Cambridge University Press: Cambridge, UK; New York, NY, USA, 2013; p. 1535.
  2. Giorgi, F.; Lionello, P. Climate change projections for the Mediterranean region. Glob. Planet Chang. 2008, 63, 90–104. [Google Scholar] [CrossRef]
  3. Chaves, M.M.; Santos, T.P.; Souza, C.R.; Ortuño, M.F.; Rodrigues, M.L.; Lopes, C.M.; Pereira, J.S. Deficit irrigation in grapevine improves water-use efficiency while controlling vigour and production quality. Ann. Appl. Biol. 2007, 150, 237–252. [Google Scholar] [CrossRef]
  4. Costa, J.M.; Vaz, M.; Escalona, J.; Egipto, R.; Lopes, C.; Medrano, H.; Chaves, M.M. Modern viticulture in southern Europe: Vulnerabilities and strategies for adaptation to water scarcity. Agric. Water Manag. 2016, 164, 5–18. [Google Scholar] [CrossRef]
  5. OIV. Distribution of the World’s Grapevine Varieties. Focus OIV 2017. Available online: http://www.oiv.int/public/medias/5888/en-distribution-of-the-worlds-grapevine-varieties.pdf (accessed on 24 November 2018).
  6. FAO. AQUASTAT website. Food and Agriculture Organization of the United Nations (FAO). Available online: http://www.fao.org/nr/water/aquastat/irrigationmap (accessed on 22 November 2018).
  7. Cancela, J.J.; Trigo-Córdoba, E.; Martínez, E.M.; Rey, B.J.; Bouzas-Cid, Y.; Fandiño, M.; Mirás-Avalos, J.M. Effects of climate variability on irrigation scheduling in white varieties of Vitis vinifera (L.) of NW Spain. Agric. Water Manag. 2016, 170, 99–109. [Google Scholar] [CrossRef]
  8. Williams, L.E.; Matthews, M.A. Grapevine. In Irrigation of Agricultural Crops; Steward, B.A., Nielsen, D.R., Eds.; Agronomy Monograph No. 30; ASA-CSSA-SSSA: Madison, WI, USA, 1990; pp. 1019–1055. [Google Scholar]
  9. Bravdo, B.; Hepner, Y.; Loinger, C.; Cohen, S.; Tabacman, H. Effect of irrigation and crop level on growth, yield and wine quality of Cabernet Sauvignon. Am. J. Enol. Vitic. 1985, 36, 132–139. [Google Scholar]
  10. Cooley, N.M.; Clingeleffer, P.R.; Walker, R.R. Effect of water deficits and season on berry development and composition of Cabernet Sauvignon (Vitis vinifera L.) grown in a hot climate. Aust. J. Grape Wine Res. 2017, 23, 260–272. [Google Scholar] [CrossRef]
  11. Ojeda, H.; Andary, C.; Kraeva, E.; Carbonneau, A.; Deloire, A. Influence of pre- and postveraison water deficit on synthesis and concentration of skin phenolic compounds during berry growth of Vitis vinifera cv. Shiraz. Am. J. Enol. Vitic. 2002, 53, 261–267. [Google Scholar]
  12. Girona, J.; Marsal, J.; Mata, M.; Del Campo, J.; Basile, B. Phenological sensitivity of berry growth and composition of Tempranillo grapevines (Vitis Vinifera L.) to water stress. Aust. J. Grape Wine Res. 2009, 15, 268–277. [Google Scholar] [CrossRef]
  13. Reynolds, A.G.; Lowrey, W.D.; Tomek, L.; Hakimi, J.; De Savigny, C. Influence of irrigation on vine performance, fruit composition, and wine quality of chardonnay in a cool, humid climate. Am. J. Enol. Vitic. 2007, 58, 217–228. [Google Scholar]
  14. Basile, B.; Girona, J.; Behboudian, M.H.; Mata, M.; Rosello, J.; Ferré, M.; Marsal, J. Responses of “Chardonnay” to deficit irrigation applied at different phenological stages: Vine growth, must composition, and wine quality. Irrig. Sci. 2012, 30, 397–406. [Google Scholar] [CrossRef]
  15. Andrés-Lacueva, C.; Gallart, M.; López-Tamames, E.; Lamuela-Raventós, R.M. Influence of Variety and Aging on Foaming Properties of Sparkling Wine (Cava). J. Agric. Food Chem. 1996, 44, 3826–3829. [Google Scholar] [CrossRef]
  16. Jones, J.E.; Kerslake, F.L.; Close, D.C.; Dambergs, R.G. Viticulture for sparkling wine production: A review. Am. J. Enol. Vitic. 2014, 65, 407–416. [Google Scholar] [CrossRef]
  17. Bellvert, J.; Marsal, J.; Mata, M.; Girona, J. Yield, Must Composition, and Wine Quality Responses to Preveraison Water Deficits in Sparkling Base Wines of Chardonnay. Am. J. Enol. Vitic. 2016, 67, 1–12. [Google Scholar] [CrossRef]
  18. Ramos, M.C.; Martínez-Casasnovas, J.A. Effects of precipitation patterns and temperature trends on soil water available for vineyards in a Mediterranean climate area. Agric. Water Manag. 2010, 97, 1495–1505. [Google Scholar] [CrossRef]
  19. Webb, L.; Whetton, P.; Barlow, E.W.R. Modelled impact of future climate change on phenology of wine grapes in Australia. Aust. J. Grape Wine Res. 2007, 13, 165–175. [Google Scholar] [CrossRef]
  20. Petrie, P.R.; Sadras, V.O. Advancement of grapevine maturity in Australia between 1993 and 2006: Putative causes, magnitude of trends and viticultural consequences. Aust. J. Grape Wine Res. 2008, 14, 33–45. [Google Scholar] [CrossRef]
  21. Ramos, M.C.; Jones, G.V.; Yuste, J. Phenology of Tempranillo and Cabernet-Sauvignon varieties cultivated in the Ribera del Duero DO: Observed variability and predictions under climate change scenarios. Oeno One 2018, 52, 31–44. [Google Scholar] [CrossRef]
  22. Zapata, C.; Deléens, E.; Chaillou, S.; Magné, C. Partitioning and mobilization of starch and N reserves in grapevine (Vitis vinifera L.). J. Plant Physiol. 2004, 161, 031–1040. [Google Scholar] [CrossRef]
  23. Holzapfel, B.P.; Smith, J.P.; Mandel, R.M.; Keller, M. Manipulating the postharvest period and its impact on vine productivity of Semillon grapevines. Am. J. Enol. Vitic. 2006, 57, 148–157. [Google Scholar]
  24. Bennett, J.; Jarvis, P.; Creasy, G.L.; Trought, M.C.T. Influence of Defoliation on Overwintering Carbohydrate Reserves, Return Bloom, and Yield of Mature Chardonnay Grapevines. Am. J. Enol. Vitic. 2005, 56, 386–393. [Google Scholar]
  25. Vaillant-Gaveau, N.; Wojnarowiez, G.; Petit, A.; Jacquens, L.; Panigai, L.; Clément, C.; Fontaine, F. Relationships between carbohydrates and reproductive development in Chardonnay grapevine: Impact of defoliation and fruit removal treatments during four successive growing seasons. J. Int. Sci. Vigne Vin 2014, 48, 219–229. [Google Scholar] [CrossRef]
  26. Allen, R.G.; Pereira, L.S.; Raes, D.; Smith, M. Crop Evapotranspiration: Guidelines for Computing Crop Water Requirements; Irrigation and Drainage 56; FAO: Rome, Italy, 1998. [Google Scholar]
  27. Shackel, K.A.; Ahmadi, H.; Biasi, W.; Buchner, R.; Goldhamer, D.; Yeager, J. Plant water status as an index of irrigation need in deciduous fruit trees. HortTechnology 1997, 7, 23–29. [Google Scholar] [CrossRef]
  28. Basile, B.; Marsal, J.; Mata, M.; Vallverdú, X.; Bellvert, J.; Girona, J. Phenological Sensitivity of Cabernet Sauvignon to Water Stress: Vine Physiology and Berry Composition. Am. J. Enol. Vitic. 2011, 62, 453–461. [Google Scholar] [CrossRef]
  29. Lorenz, D.H.; Eichhorn, K.W.; Bleiholder, H.; Klose, R.; Meier, U.; Weber, E. Phenological growth stages of the grapevine, Vitis vinifera L. ssp. vinifera. Codes and 515 descriptions according to the extended BBCH scale. Aust. J. Grape Wine Res. 1995, 1, 100–103. [Google Scholar] [CrossRef]
  30. Oyarzun, R.A.; Stöckle, C.O.; Whiting, M.D. A simple approach to modeling radiation interception by fruit-tree orchards. Agric. Meteorol. 2007, 142, 12–24. [Google Scholar] [CrossRef]
  31. Smart, R.E. Principles of Grapevine Canopy Microclimate Manipulation with Implications for Yield and Quality. A Review. Am. J. Bot. 1985, 36, 230–239. [Google Scholar]
  32. Sauter, J.J.; van Cleve, B. Storage, mobilization and interrelations of starch, sugars, protein and fat in the ray storage tissue of poplar trees. Trees 1994, 8, 297–304. [Google Scholar] [CrossRef]
  33. Boehringer, M. UV Method for the Determination of Native Starch and Partially Hydrolized Starch in Foodstuffs and Other Materials; Enzymatic Bioanalysis/Food analysis R-Biopharm; GmbH: Darmstadt, Germany, 1984; p. 5. [Google Scholar]
  34. R Core Team. R: A Language and Environment for Statistical Computing; R Foundation for Statistical Computing: Vienna, Austria, 2017; Available online: https://www.R-project.org/ (accessed on September 2016).
  35. Williams, L.E.; Neja, R.A.; Meyer, J.L.; Yates, L.A.; Walker, E.L. Post harvest irrigation influences budbreak of “Perlette” grapevines. Hortscience 1991, 26, 1081. [Google Scholar] [CrossRef]
  36. Ndung’u, C.K.; Okamoto, G.; Hirano, K. Use of water stress in forcing Kyoho grapevines to produce two crops per year. Am. J. Enol. Vitic. 1996, 47, 157–162. [Google Scholar]
  37. Ndung’u, C.K.; Shimizu, M.; Okamoto, G.; Hirano, K. Abscisic acid, carbohydrates, and nitrogen contents of Kyoho grapevines in relation to budbreak induction by water stress. Am. J. Enol. Vitic. 1997, 48, 115–120. [Google Scholar]
  38. Mullins, M.G.; Bouquet, A.; Williams, L.E. Biology of the Grapevine; Mullins, M.G., Ed.; Cambridge University Press: Cambridge, UK, 1992. [Google Scholar]
  39. Tomasi, D. Grape quality starts at the roots. Acta Hortic. 2016, 1136, 1–10. [Google Scholar] [CrossRef]
  40. Candolfi-Vasconcelos, M.C.; Koblet, W. Yield, fruit quality, bud fertility and starch reserves of the wood as a function of leaf removal in Vitis vinifera: Evidence of compensation and stress recovering. Vitis 1990, 29, 199–221. [Google Scholar]
  41. Sommer, K.J.; Islam, M.T.; Clingeleffer, P.R. Light and temperature effects on shoot fruitfulness in Vitis vinifera L. cv. Sultana: Influence of trellis type and grafting. Aust. J. Grape Wine Res. 2000, 6, 99–108. [Google Scholar] [CrossRef]
  42. Greven, M.M.; Neal, S.M.; Tustin, D.S.; Boldingh, H.; Bennett, J.; Vasconcelos, M.C. The Effect of Postharvest Defoliation on Carbon and Nitrogen Resources of High Yielding Sauvignon blanc Grapevines. Am. J. Enol. Vitic. 2016, 67, 315–326. [Google Scholar] [CrossRef] [Green Version]
  43. Prats-Llinàs, M.T.; García-Tejera, O.; Marsal, J.; Girona, J. Water stress during the post-harvest period affects new root formation but not starch concentration and content in Chardonnay grapevine (Vitis vinifera L.) perennial organs. Sci. Hortic. 2019, 249, 461–470. [Google Scholar] [CrossRef]
  44. Samperio, A.; Prieto, M.H.; Blanco-Cipollone, F.; Vivas, A.; Moñino, M.J. Effects of post-harvest deficit irrigation in “Red Beaut” Japanese plum: Tree water status, vegetative growth, fruit yield, quality and economic return. Agric. Water Manag. 2015, 150, 92–102. [Google Scholar] [CrossRef]
  45. Johnson, R.S.; Handley, D.F.; DeJong, T.M. Long-term response of early maturing peach trees to postharvest water stress. J. Am. Soc. Hortic. Sci. 1992, 117, 881–886. [Google Scholar] [CrossRef]
  46. Dichio, B.; Xiloyannis, C.; Sofo, A.; Montanaro, G. Effects of post-harvest regulated deficit irrigation on carbohydrate and nitrogen partitioning, yield quality and vegetative growth of peach trees. Plant Soil 2007, 290, 127–137. [Google Scholar] [CrossRef]
  47. Vasconcelos, M.C.; Greven, M.; Winefield, C.S.; Trought, M.C.T.; Raw, V. The Flowering Process of Vitis vinifera: A Review. Am. J. Enol. Vitic. 2009, 60, 411–434. [Google Scholar]
  48. Escalona, J.M.; Flexas, J.; Bota, J.; Medrano, H. Distribution of leaf photosynthesis and transpiration within grapevine canopies under different drought conditions. Vitis 2003, 42, 57–64. [Google Scholar]
  49. Reynolds, A.G.; Price, S.F.; Wardle, D.A.; Watson, B.T. Fruit Environment and Crop Level Effects on Pinot-Noir.1. Vine Performance and Fruit Composition in British-Columbia. Am. J. Enol. Vitic. 1994, 45, 452–459. [Google Scholar]
  50. Uriarte, D.; Intrigliolo, D.S.; Mancha, L.A.; Valdés, E.; Gamero, E.; Prieto, M.H. Combined effects of irrigation regimes and crop load on “Tempranillo” grape composition. Agric. Water Manag. 2016, 165, 97–107. [Google Scholar] [CrossRef]
  51. De Souza, C.R.; Maroco, J.P.; dos Santos, T.P.; Rodrigues, M.L.; Lopes, C.M.; Pereira, J.S.; Chaves, M.M. Grape berry metabolism in field-grown grapevines exposed to different irrigation strategies. Vitis 2005, 44, 103–109. [Google Scholar]
  52. Gu, S.; Jacobs, S.D.; McCarthy, B.S.; Gohil, H.L. Forcing vine regrowth and shifting fruit ripening in a warm region to enhance fruit quality in “Cabernet Sauvignon” grapevine (Vitis vinifera L.). J. Hortic. Sci. Biotechnol. 2012, 87, 287–292. [Google Scholar] [CrossRef]
Figure 1. Amount of applied water and rainfall corresponding to the different irrigation treatments during 2013 (A), 2014 (B) and 2015 (C). Seasonal variation in midday stem water potential (Ψstem) in response to different irrigation treatments during 2013 (D), 2014 (E) and 2015 (F). Irrigation treatments were C, control; RDIL SP, low regulated deficit irrigation for sparkling base wine production; RDIM SP, mild regulated deficit irrigation for sparkling base wine production; and RDIM W, mild regulated deficit irrigation for wine production. Stem water potential values are the mean values of the treatments, and bars indicate the standard error for eight leaves. HarvestSP and HarvestW indicate harvest time for sparkling base wine and wine criteria, respectively.
Agronomy 09 00328 g001
Figure 2. Seasonal variations in stomatal conductance (A), transpiration (B) and leaf net CO2 assimilation rate (C) during the post-harvest period in 2015. Each value represents the mean of eight measurements and bars indicate the standard error of the mean. Different letters indicate significant differences (P ≤ 0.05).
Agronomy 09 00328 g002
Figure 3. Seasonal variations in daily intercepted solar radiation (fIRd) in response to different irrigation treatments in 2013 (A), 2014 (B), 2015 (C), 2016 (D). Each value is the mean of four measurements and bars indicate the standard error of the mean. No significant differences were found among the observations. HarvestSP and HarvestW indicate the harvest time according to sparkling base wine and wine criteria, respectively.
Agronomy 09 00328 g003
Figure 4. Seasonal variations in canopy surface area for the C, RDIM SP, and RDIM W treatments for 2014 (A), 2015 (B) and 2016 (C). Each value is the mean of four measurements and the bars indicate the standard error of the mean. HarvestSP and HarvestW indicate the harvest time according to sparkling base wine and wine criteria, respectively.
Agronomy 09 00328 g004
Figure 5. Relationship between the integrated stem water potential in 2015 and the root starch concentration determined at the end of the 2015 growing season.
Agronomy 09 00328 g005
Figure 6. Evolution of soluble solids concentration (°Brix) during the pre-harvest period in 2016. Different letters indicate significant differences (P ≤ 0.05).
Agronomy 09 00328 g006
Figure 7. Relationship between the starch concentration in post-harvest 2015 and the soluble solids concentration by the titratable acidity in 2016. The observations inside the grey oval were outliers removed from the RDIM linear regression.
Agronomy 09 00328 g007
Table 1. Reference values for average air temperature (Ta), evapotranspiration (ETO) and rainfall for the different phenological stages during the experiment.
Year/Weather VariablesPhenological Stage Period
Budbreak to HarvestPost-Harvest
Ta (°C)ETo (mm)Rainfall (mm)Ta (°C)ETo (mm)Rainfall (mm)
2013---18.7175.712.5
201417.9615.9102.320.6274.5172.8
201520.1664.089.719.6200.126.6
201617.4670.8138.2---
Table 2. Analysis of variance for the vegetative growth and yield parameters and their average estimates for the experimental period 2014–2016. The same analysis for measures of the starch concentration for the experimental year 2015.
P > F
Vegetative growthYield parametersRoot reserves
SourceDFShootsInflorescenceKg/vineClusters/vineBerries/clusterBerry dry weight (g)DFStarch concentration (%)
Treatment (T)30.3530 X0.61950.65360.06590.28990.92663***
Block (B)30.75900.22580.95750.48100.29920.97603***
Year (Y)1***0.0063 ***********0.00901 **--
C44.7 Y46.09.1351660.33C13.21a
RDIL SP45.046.78.9351680.33RDIL SP10.13b
RDIM SP43.645.78.8331680.34RDIM SP9.23b
RDIM W42.844.78.7331610.34RDIM W10.07b
X Significant codes: ‘***’ p > 0.001, ‘**’ p > 0.01, ‘*’ p > 0.05. Y Different letters mean significant differences at p ≤ 0.05 using Tukey’s honest significant difference test.
Table 3. Mean values of the berry composition parameters for each irrigation treatment in the 2014, 2015, and 2016 growing seasons.
Berry composition
Year201420152016
Irrigation treatmentsSSC (°Brix)TA (g/L tartaric acid)SSC (°Brix)TA (g/L tartaric acid)SSC (°Brix)TA (g/L tartaric acid)
C17.69.717.711.8a15.9b10.9a
RDIL SP18.49.517.611.3ab15.9b10.8ab
RDIM SP17.29.317.911.1b16.4ab10.4ab
RDIM W21.46.721.18.517.0a9.9b
In 2014 and 2015, vines were harvested on different dates depending on their planned uses (sparkling base wine or wine production). In 2016, the harvest was carried out at the same time and all destined to the production of sparkling wine. Quality parameters are SSC, meaning soluble solids concentration and TA titratable acidity. Irrigation treatments were C, control; RDIL SP, low regulated deficit irrigation for sparkling base wine production; RDIM SP, mild regulated deficit irrigation for sparkling base wine production; and RDIM W, mild regulated deficit irrigation for wine production. Different letters mean significant differences at P ≤ 0.05 using Tukey’s honest significant difference test.

