Optimization of Photosynthetic Photon Flux Density and Root-Zone Temperature for Enhancing Secondary Metabolite Accumulation and Production of Coriander in Plant Factory


Abstract
:1. Introduction
2. Materials and Methods
2.1. Plant Material
2.1.1. Germination and Plant Seedling
2.1.2. Growth Condition and Treatments with Regulators
2.2. Measurement
2.2.1. Growth Parameters
2.2.2. 1,1-Diphenyl-2-picrylhydrazyl Radical-Scavenging Activity
2.2.3. Total Phenolic Content
2.2.4. Trans-2-Decenal Content
2.2.5. Chlorogenic Acid and Rutin Content
2.3. Statistical Analysis
3. Results
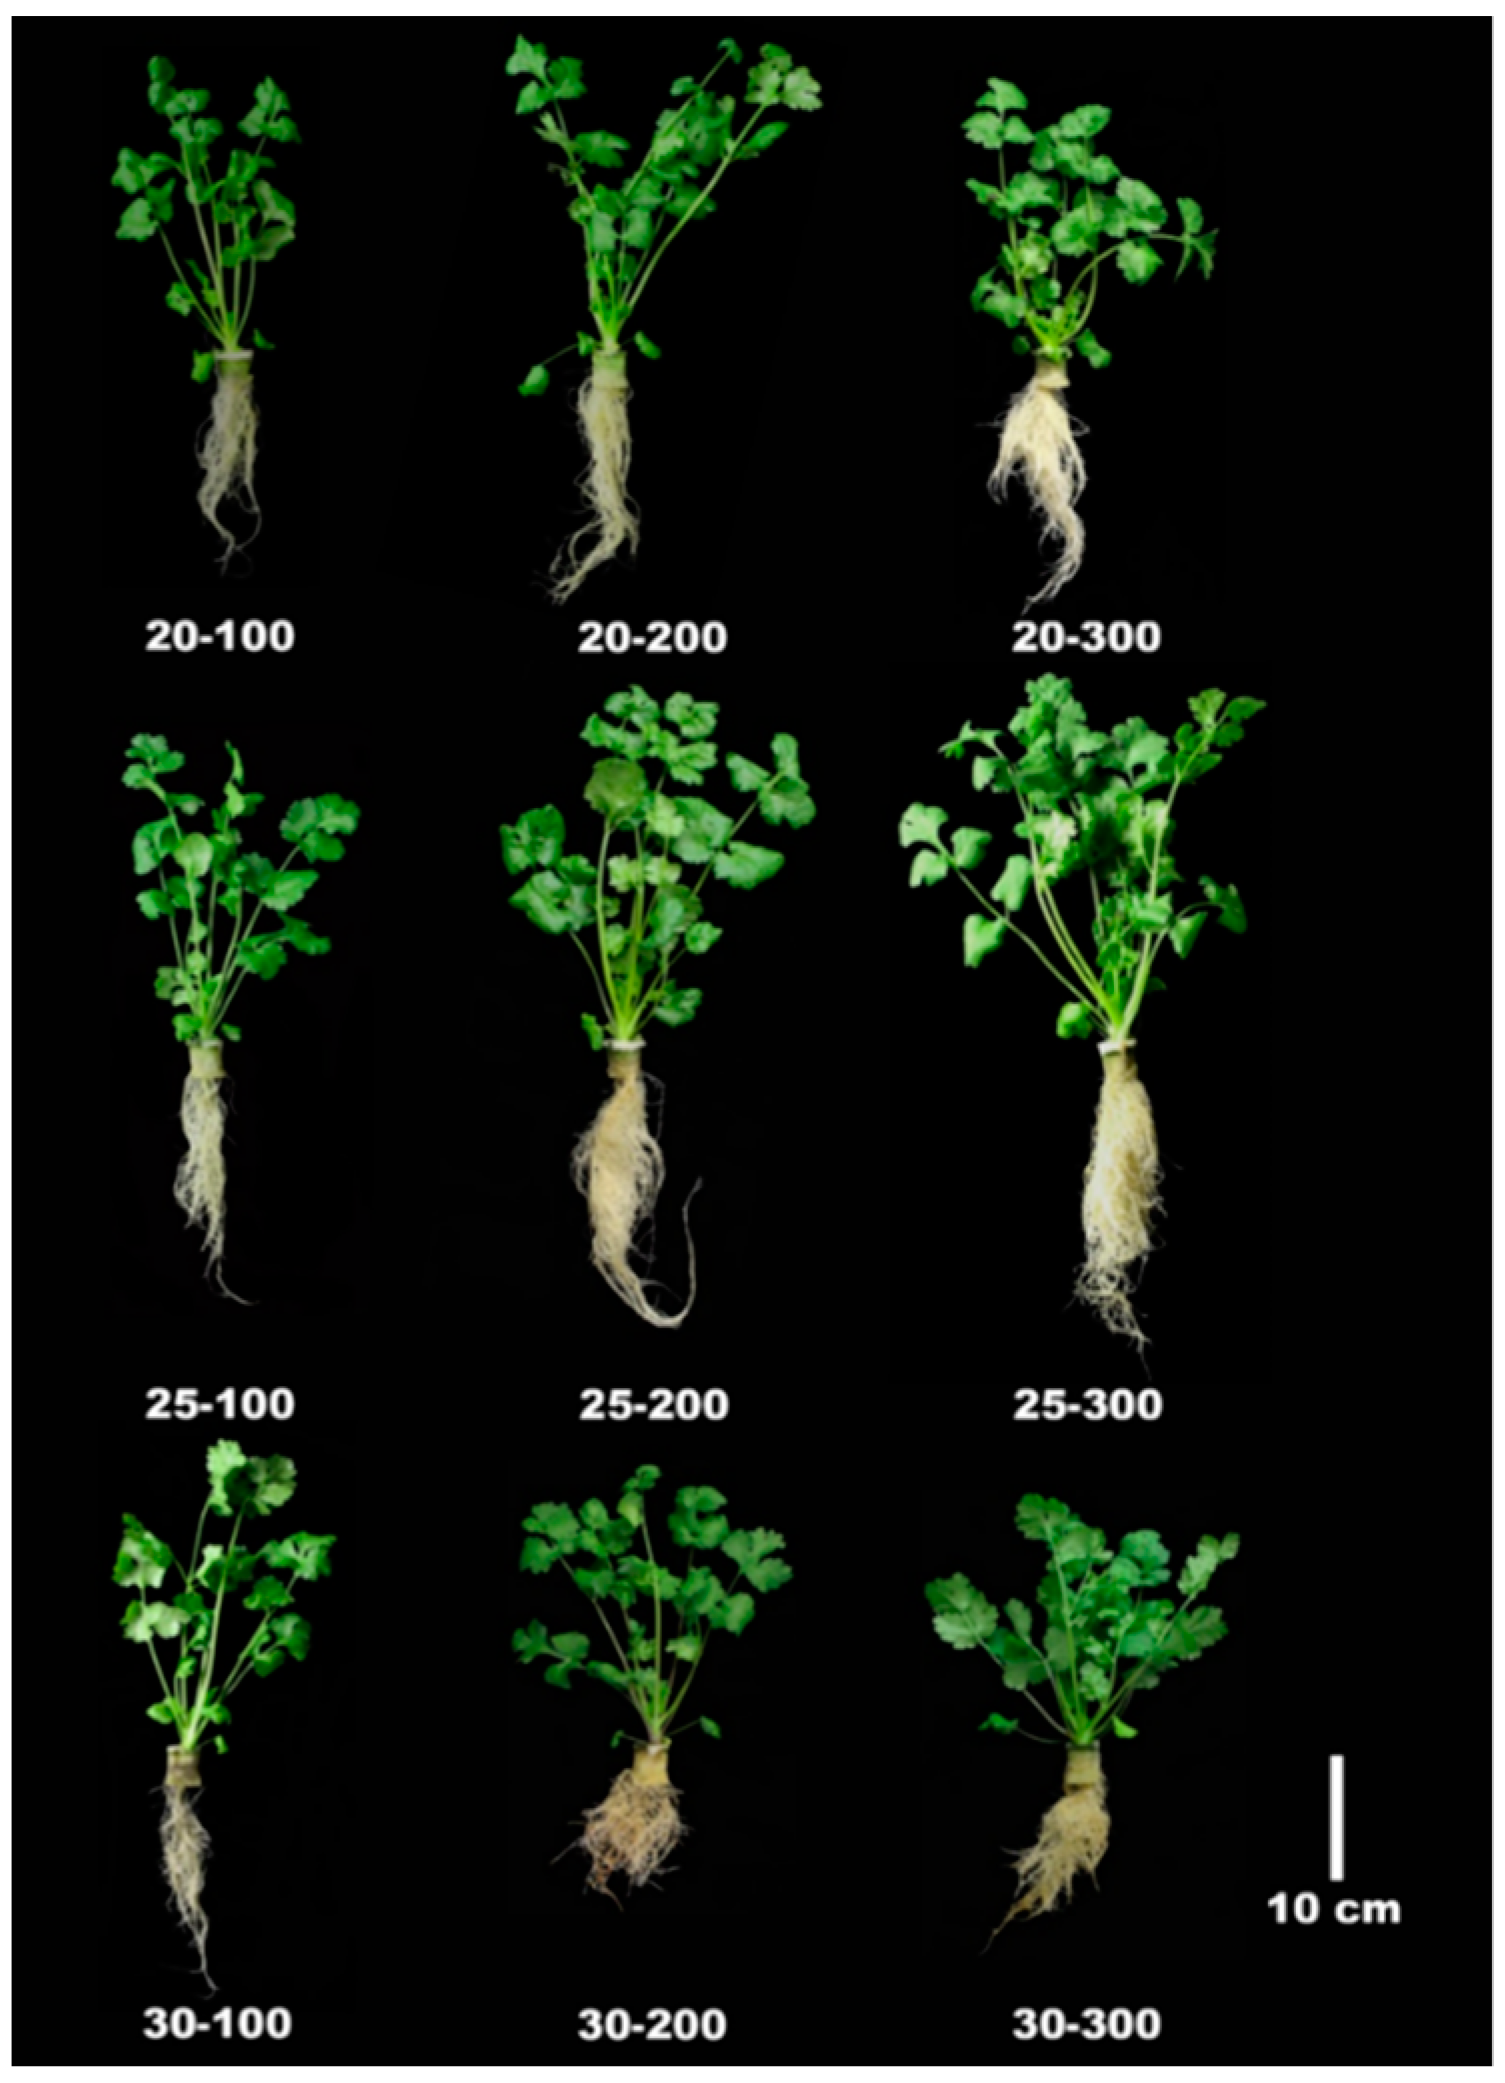
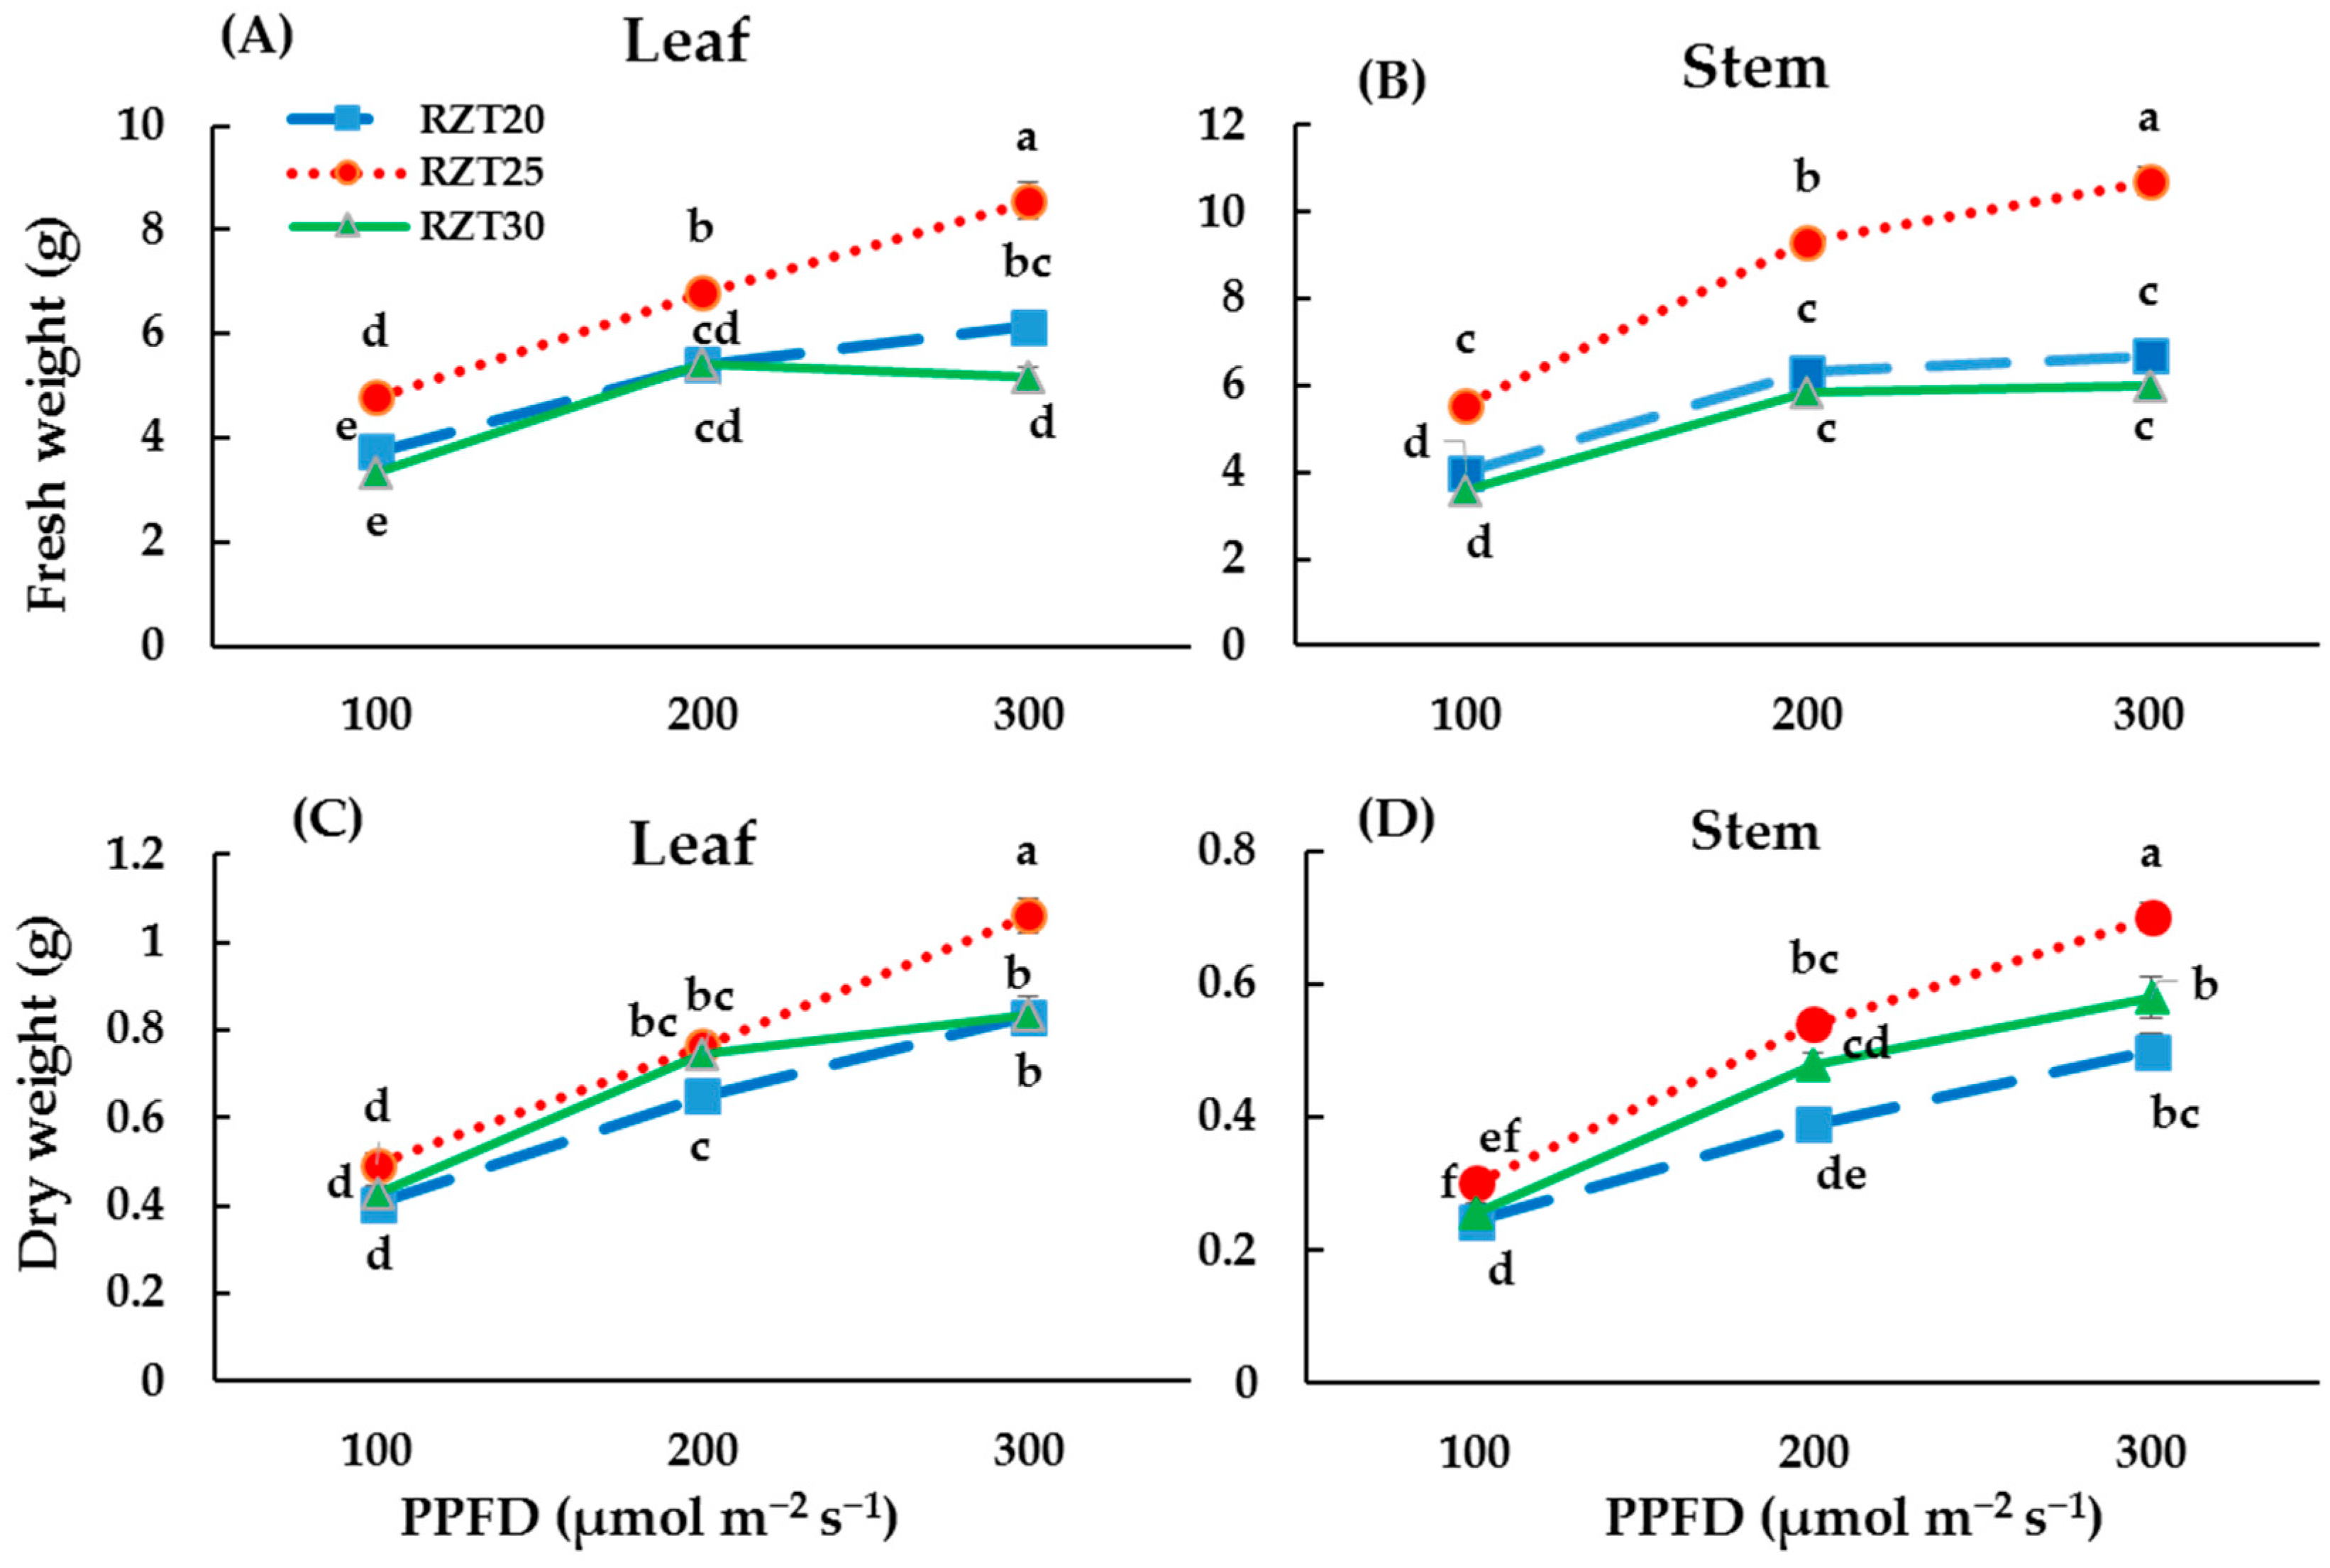
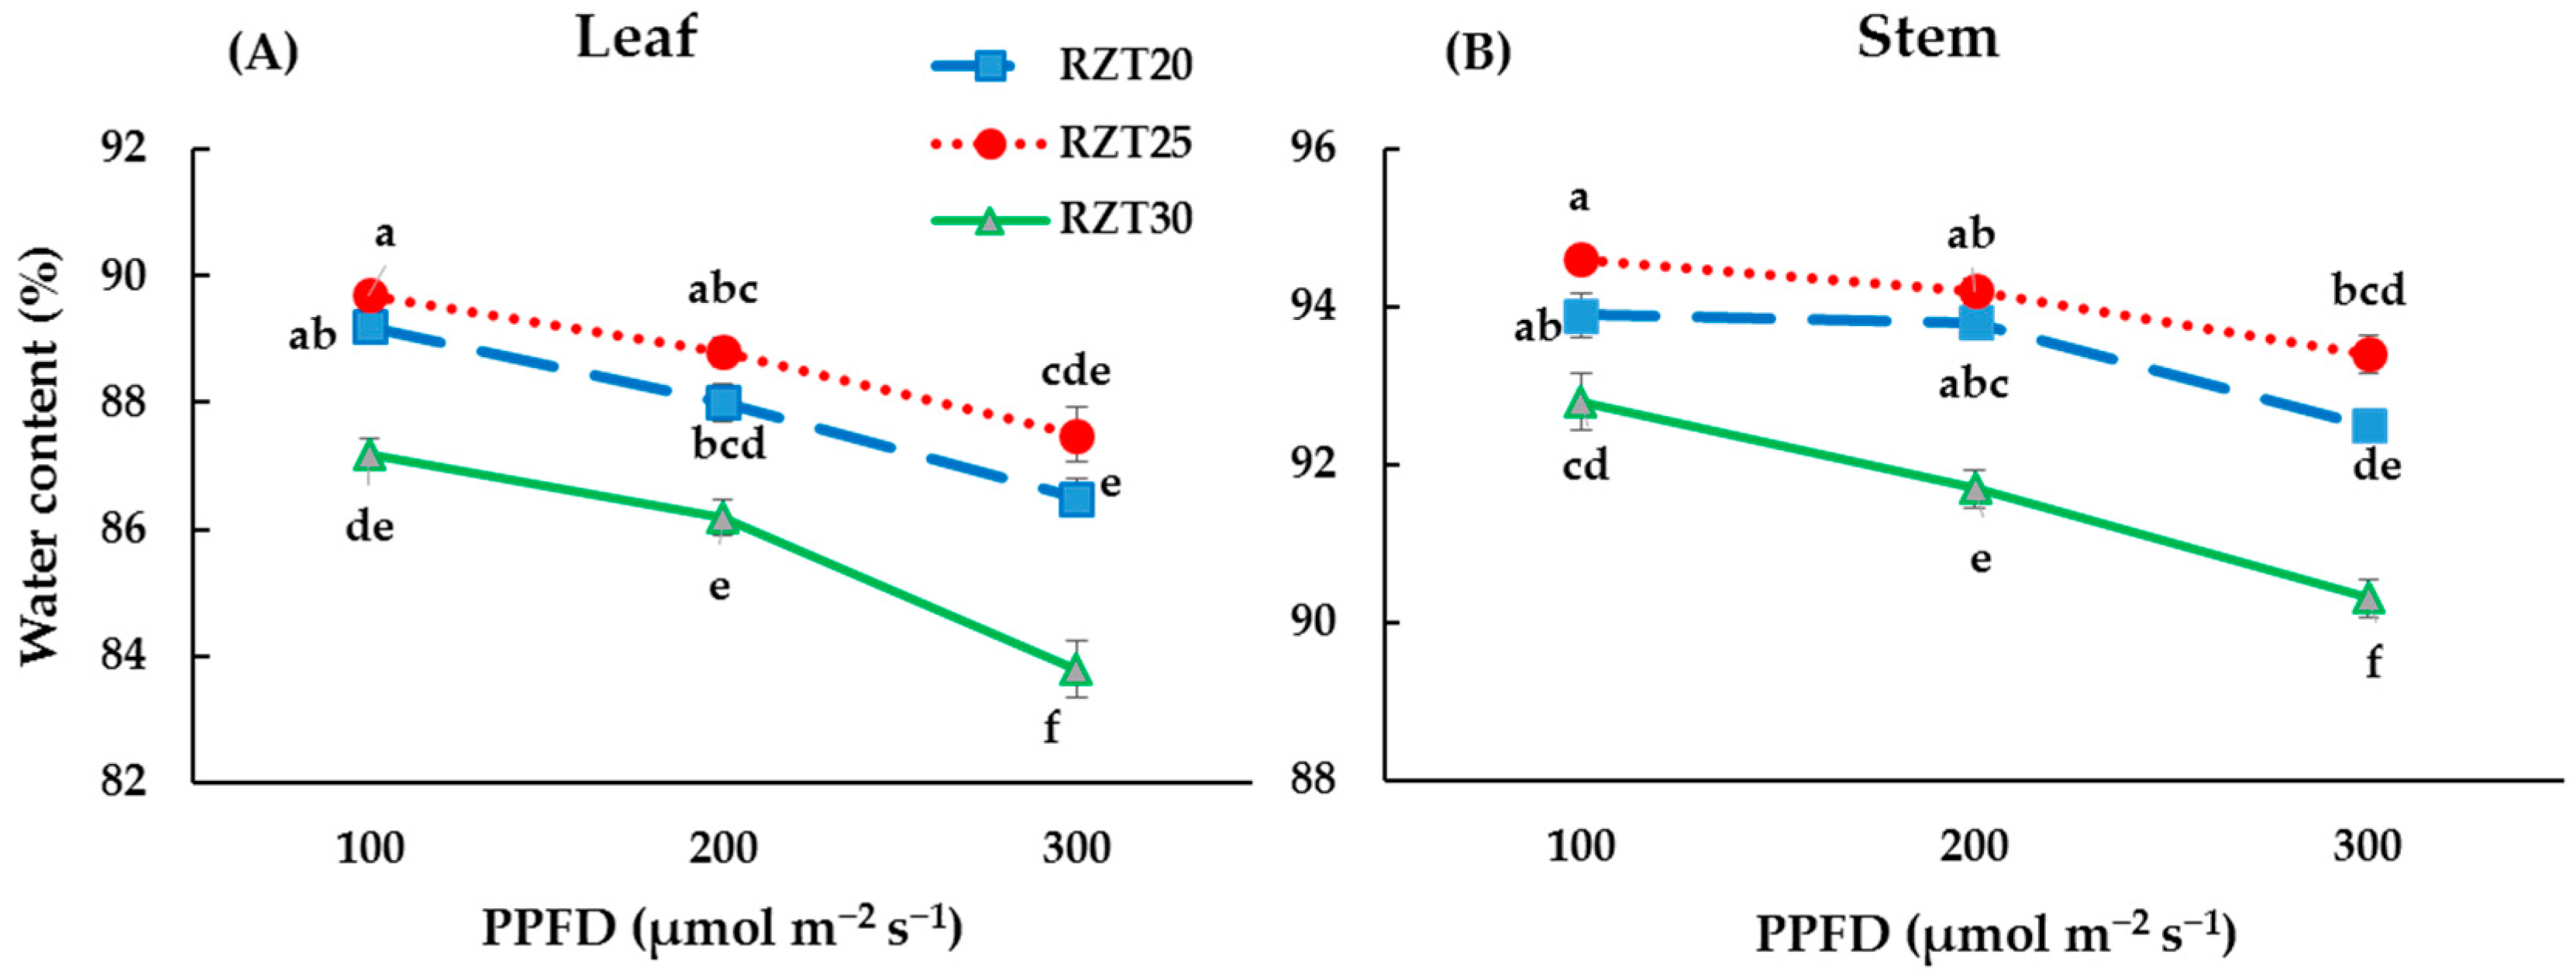
3.1. Plant Growth
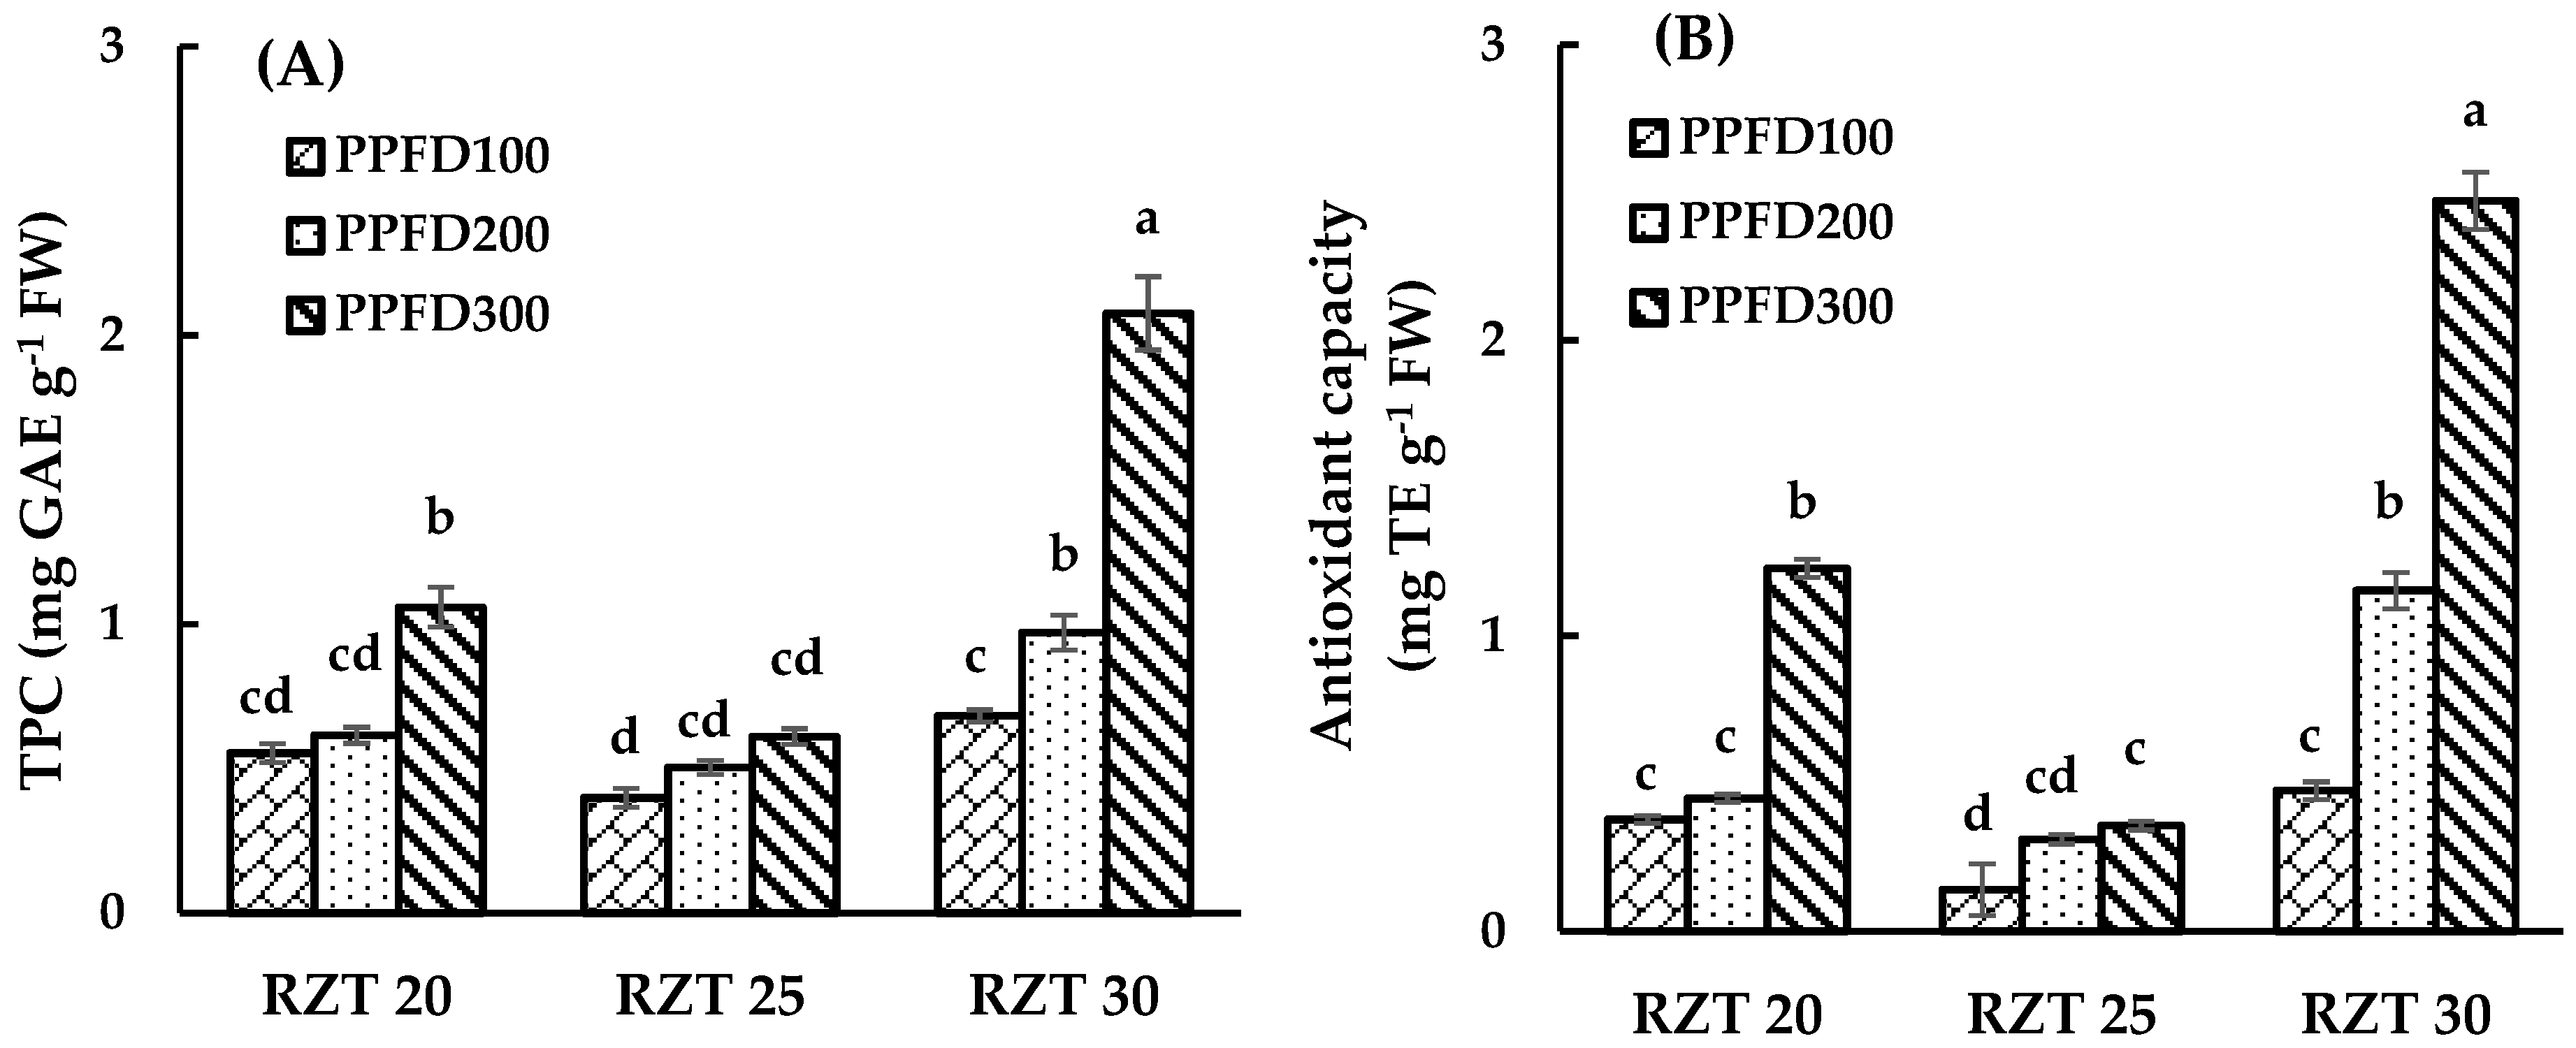
3.2. DPPH Radical-Scavenging Activity and Total Phenolic Content
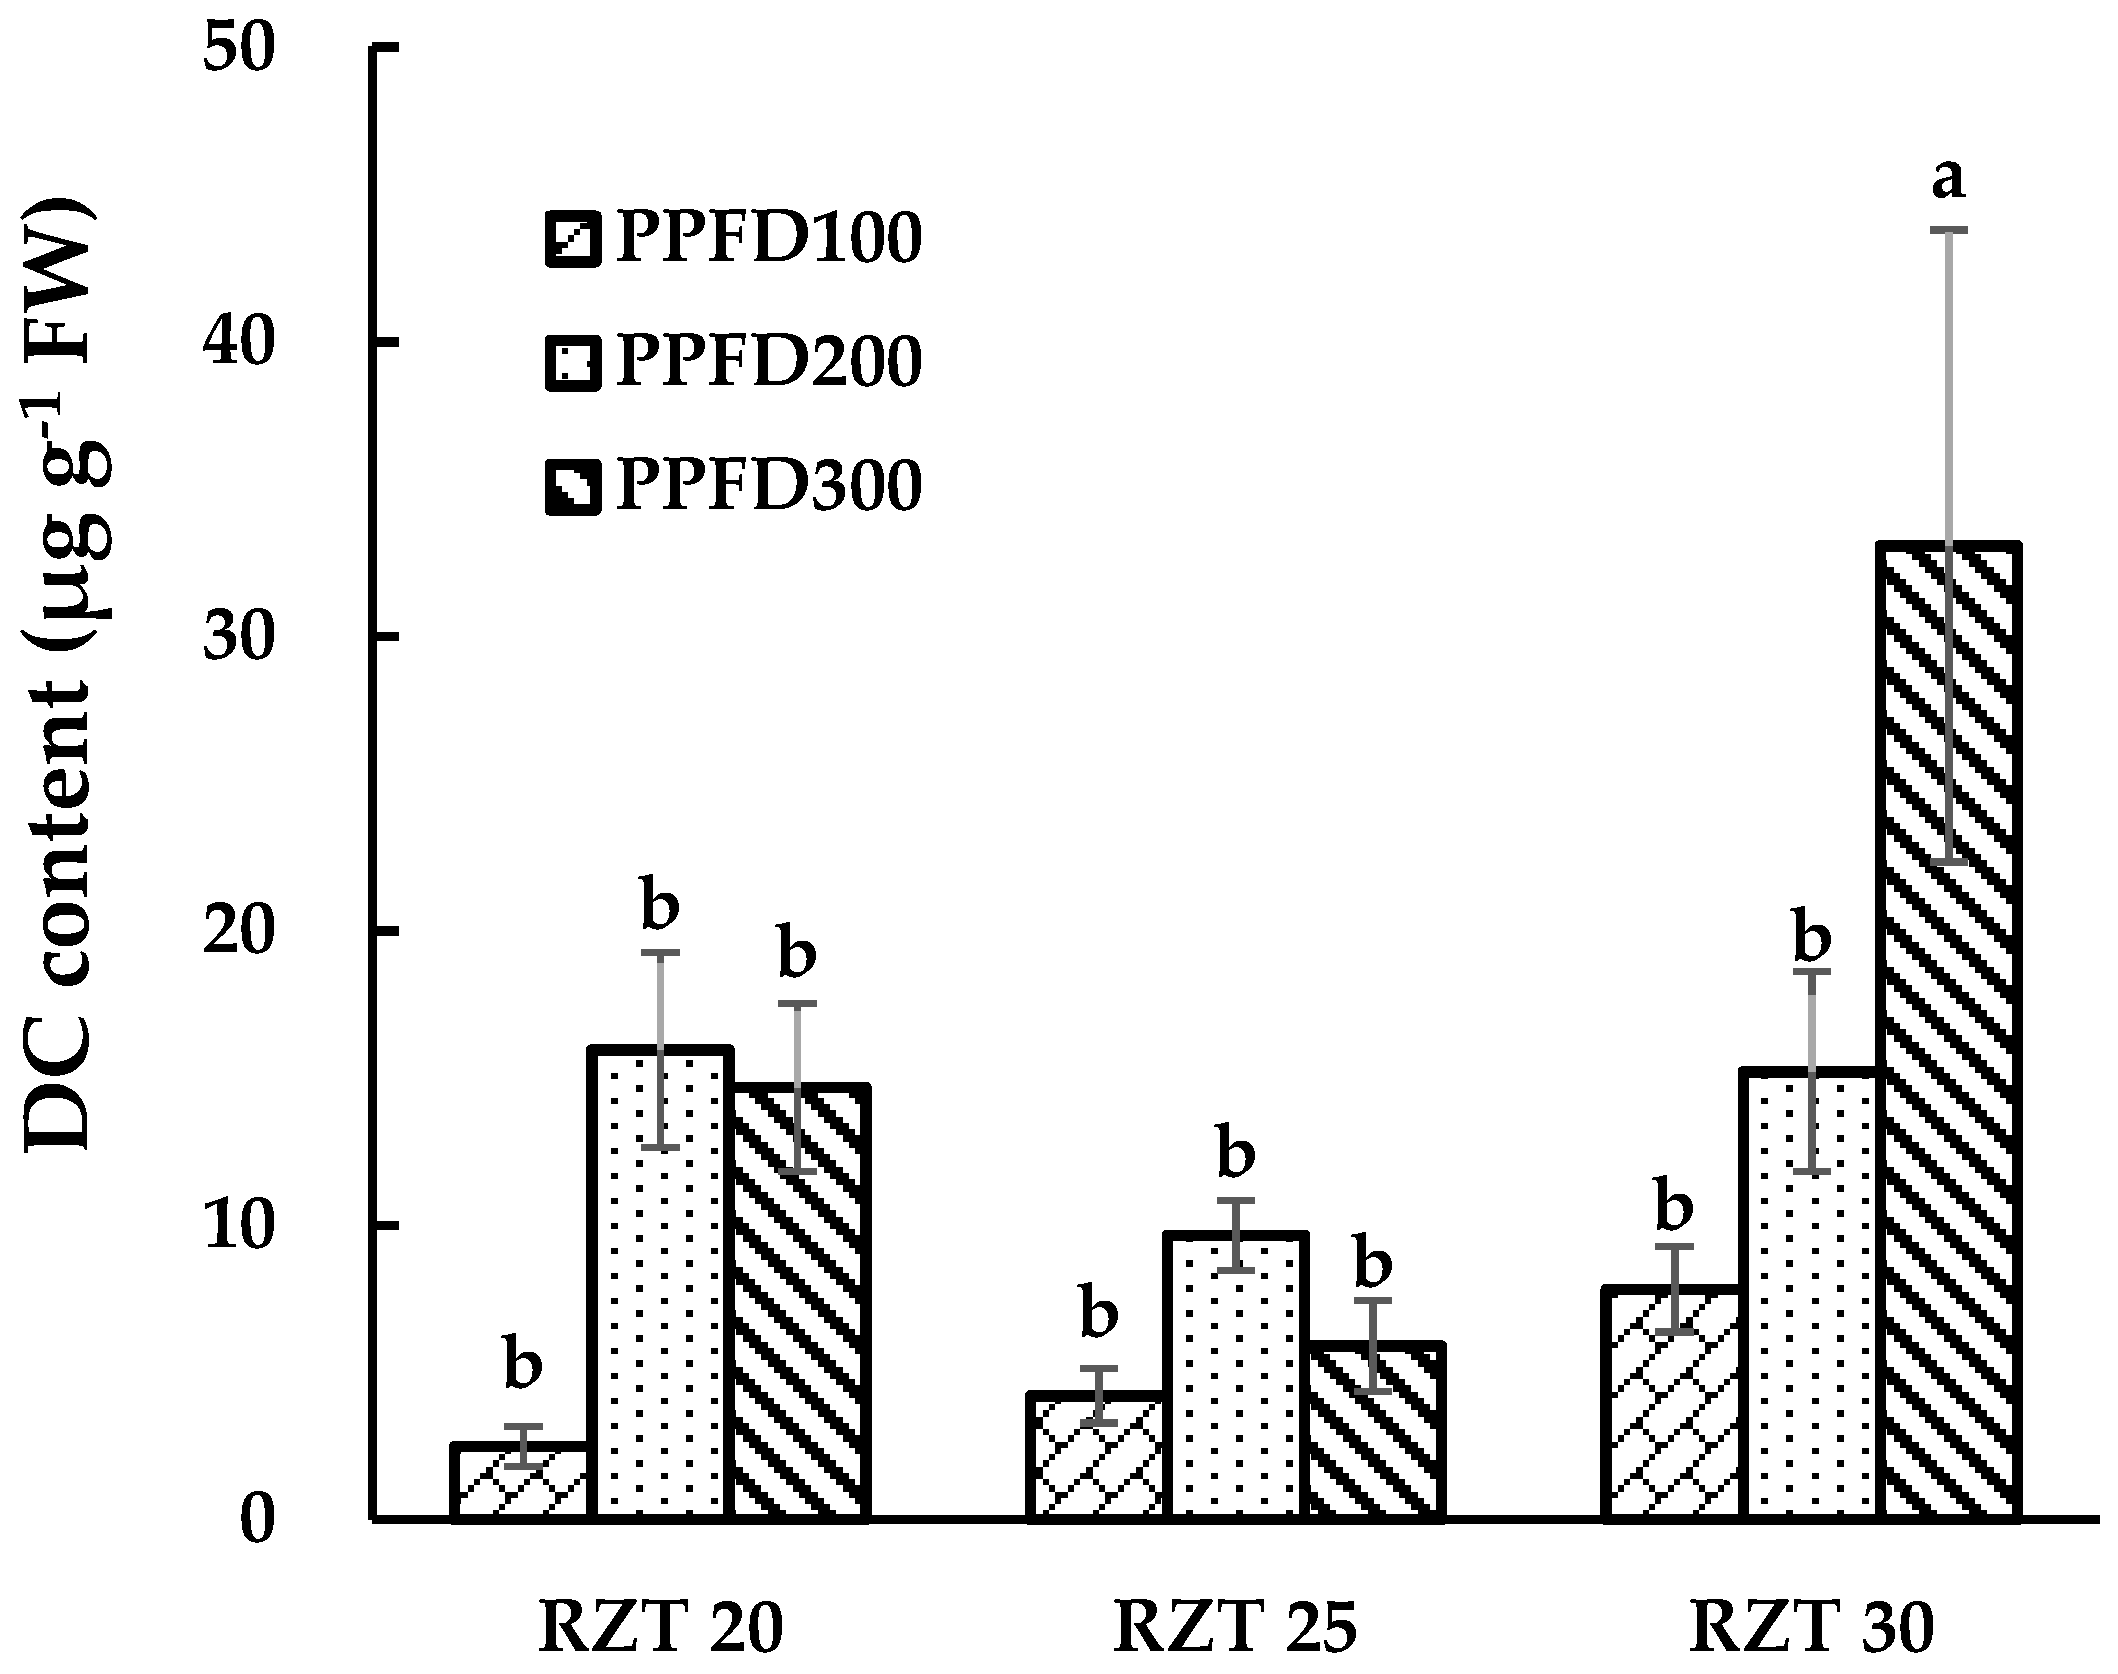
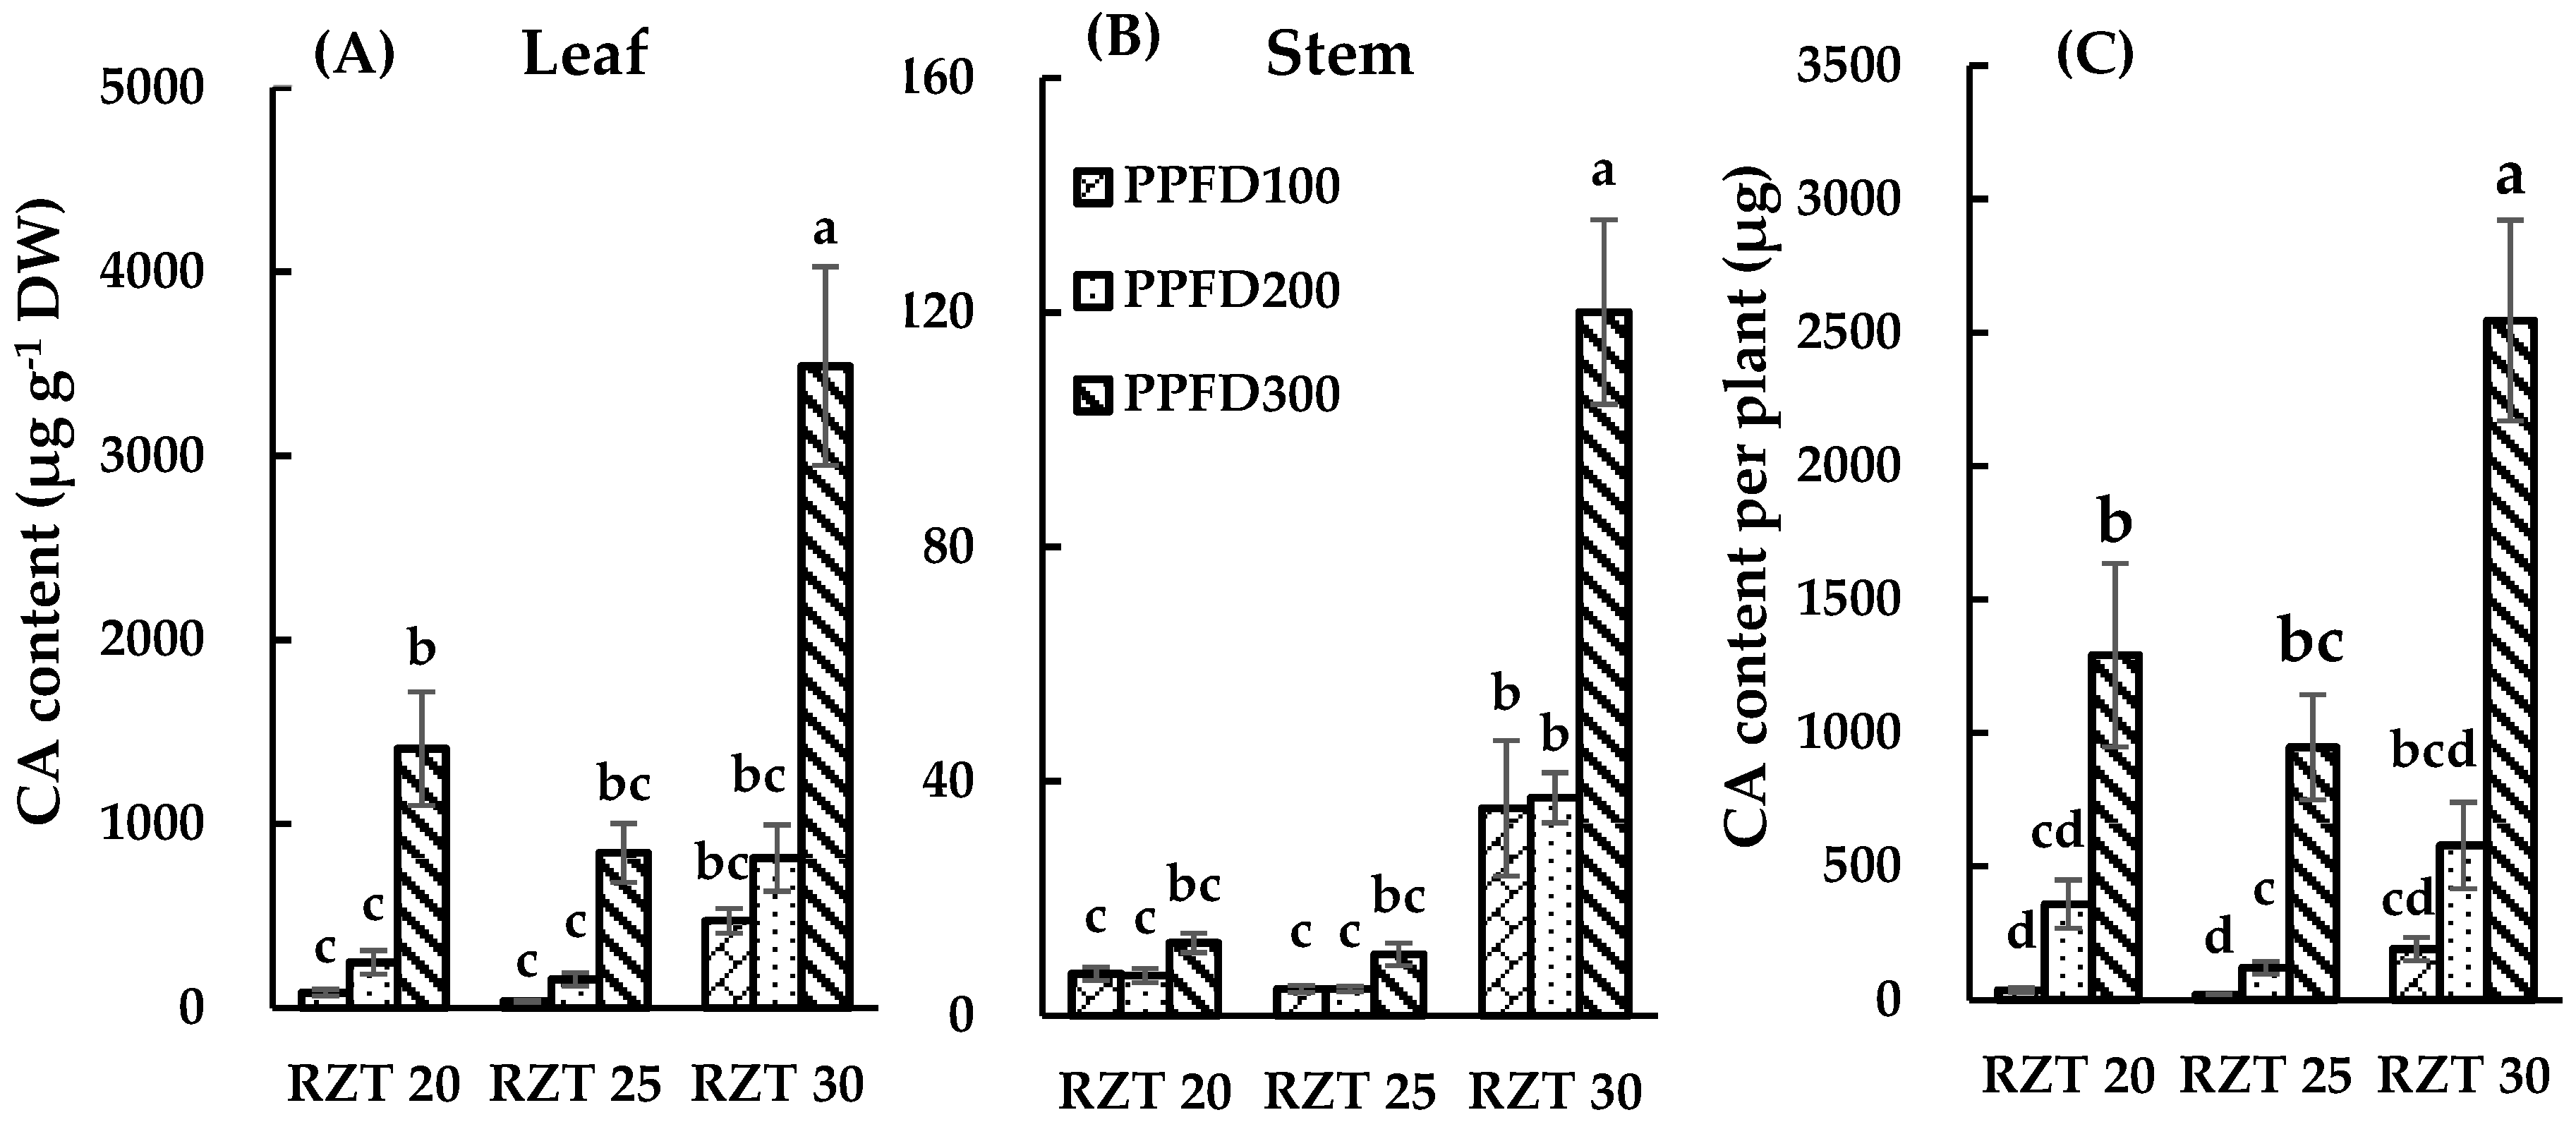
3.3. DC, CA and QR Content.
4. Discussion
4.1. Plant Growth
4.2. Total Phenolic Content and DPPH Free Radical Scavenging Activity
4.3. Content of DC, CA and QR
5. Conclusions
Supplementary Materials
Author Contributions
Funding
Conflicts of Interest
References
- Sahib, N.G.; Anwar, F.; Gilani, A.H.; Hamid, A.A.; Saari, N.; Alkharfy, K.M. Coriander (Coriandrum sativum L.): A potential source of high-value components for functional foods and nutraceuticals—A review. Phyther. Res. 2013, 27, 1439–1456. [Google Scholar]
- Shahwar, M.K.; El-ghorab, A.H.; Anjum, M.; Butt, M.S.; Hussain, S.; Butt, M.S.; Hussain, S.; Characterization, M.N.; Shahwar, M.K.; El-ghorab, A.H.; et al. Characterization of coriander (Coriandrum sativum L.) seeds and leaves: volatile and non volatile extracts. Int. J. Food Prop. 2012, 15, 736–747. [Google Scholar] [CrossRef]
- Hwang, E.; Lee, D.G.; Park, S.H.; Oh, M.S.; Kim, S.Y. Coriander leaf extract exerts antioxidant activity and protects against UVB-induced photoaging of skin by regulation of procollagen type I and MMP-1 expression 1. J. Med. Food 2014, 17, 985–995. [Google Scholar] [CrossRef]
- Kohara, K.; Sakamoto, Y.; Hasegawa, H.; Kozuka, H.; Sakamoto, K.; Hayata, Y. Fluctuations in volatile compounds in leaves, stems, and fruits of growing coriander (Coriandrum sativum L.) plants. J. Jpn. Soc. Hortic. Sci. 2006, 75, 267–269. [Google Scholar]
- Divya, P.; Puthusseri, B.; Neelwarne, B. The effect of plant regulators on the concentration of carotenoids and phenolic compounds in foliage of coriander. LWT—Food Sci. Technol. 2014, 56, 101–110. [Google Scholar] [CrossRef]
- El-zaeddi, H.; Calín-sánchez, Á.; Nowicka, P.; Martínez-tomé, J.; Noguera-artiaga, L.; Burló, F.; Wojdyło, A.; Carbonell-barrachina, Á.A. Preharvest treatments with malic, oxalic, and acetylsalicylic acids affect the phenolic composition and antioxidant capacity of coriander, dill and parsley. Food Chem. 2017, 226, 179–186. [Google Scholar] [CrossRef]
- Kozai, T.; Niu, G. Role of the plant factory with artificial lighting (PFAL) in urban areas. In Plant Factory—An Indoor Vertical Farming System for Efficient Quality Food Production; Kozai, T., Niu, G., Takagaki, M., Eds.; Academic Press: San Diego, CA, USA, 2016; pp. 7–33. [Google Scholar]
- Barros, L.; Dueñas, M.; Dias, I.M.; Maria, S.J.; Santos-buelga, C.; Ferreira, I.C.F.R. Phenolic profiles of in vivo and in vitro grown Coriandrum sativum L. Food Chem. 2012, 132, 841–848. [Google Scholar] [CrossRef]
- Ong, K.W.; Hsu, A.; Kwong, B.; Tan, H. Anti-diabetic and anti-lipidemic effects of chlorogenic acid are mediated by ampk activation. Biochem. Pharmacol. 2013, 85, 1341–1351. [Google Scholar] [CrossRef] [PubMed]
- Javed, H.; Khan, M.M.; Ahmad, A.; Vaibhav, K.; Ahmad, M.E.; Khan, A.; Ashafaq, M.; Islam, F.; Siddiqui, M.S.; Safhi, M.M.; et al. Rutin prevents cognitive impairments by ameliorating oxidative stress and neuroinflammation in rat model of sporadic dementia of alzheimer type. Neuroscience 2012, 17, 340–352. [Google Scholar] [CrossRef] [PubMed]
- Pacheco, L.N.A.; Cano-Sosa, J.; Poblano, C.F.; Rodríguez-Buenfil, I.M.; Ramos-Díaz, A. Different responses of the quality parameters of coriandrum sativum to organic substrate mixtures and fertilization. Agronomy 2016, 6, 21. [Google Scholar] [CrossRef]
- De Souza, M.A.A.; dos Santos, L.A.; de Brito, D.M.C.; Rocha, J.F.; Castro, R.N.; Fernandes, M.S.; de Souza, S.R. Influence of light intensity on glandular trichome density, gene expression and essential oil of menthol mint (Mentha arvensis L.). J. Essent. Oil Res. 2016, 28, 138–145. [Google Scholar] [CrossRef]
- Cooper, A.J. Root temperature and plant growth: A review. In Research Review 4, Commonwealth Bureau of Horticulture and Plantation Crops; Commonwealth Agriculture Bureaux: East Malling, Kent, UK, 1973. [Google Scholar]
- Nxawe, S.; Ndakidemi, P.A.; Laubscher, C.P. Possible effects of regulating hydroponic water temperature on plant growth, accumulation of nutrients and other metabolites. Afr. J. Biotechnol. 2010, 9, 9128–9134. [Google Scholar]
- Sun, J.; Lu, N.; Xu, H.; Maruo, T.; Guo, S. Root zone cooling and exogenous spermidine root-pretreatment promoting Lactuca sativa L. growth and photosynthesis in the high-temperature season. Front. Plant Sci. 2016, 7, 368. [Google Scholar] [CrossRef] [PubMed]
- Islam, M.Z.; Lee, Y.-T.; Mele, M.A.; Choi, I.-L.; Kang, H.-M. The effect of phosphorus and root zone temperature on anthocyanin of red romaine lettuce. Agronomy 2019, 9, 47. [Google Scholar] [CrossRef]
- Prior, R.L.; Wu, X.; Schaich, K. Standardized methods for the determination of antioxidant capacity and phenolics in foods and dietary supplements. J. Agric. Food Chem. 2005, 53, 4290–4302. [Google Scholar] [CrossRef] [PubMed]
- Gonçalves, S.; Gomes, D.; Costa, P.; Romano, A. The phenolic content and antioxidant activity of infusions from Mediterranean medicinal plants. Ind. Crops Prod. 2013, 43, 465–471. [Google Scholar] [CrossRef]
- Bantis, F.; Ouzounis, T.; Radoglou, K. Artificial LED lighting enhances growth characteristics and total phenolic content of Ocimum basilicum, but variably affects transplant success. Sci. Hortic. (Amsterdam). 2016, 198, 277–283. [Google Scholar] [CrossRef]
- García-Gómez, D.; Sinues, M.-L.P.; Barrios-Collado, C.; Vidal-de-Miguel, G.; Gaugg, M.; Zenobi, R. Identification of 2-alkenals, 4-hydroxy-2-alkenals, and 4-hydroxy-2,6-alkadienals in exhaled breath condensate by UHPLC-HRMS and in breath by real-time HRMS. Anal. Chem. 2015, 87, 3087–3093. [Google Scholar] [CrossRef] [PubMed]
- Lu, N.; Bernardo, E.L.; Tippayadarapanich, C.; Takagaki, M.; Kagawa, N.; Yamori, W.; Lu, N.; El, B. Growth and accumulation of secondary metabolite in perilla as affected by photosynthetic photon flux density and electrical conductivity of the nutrient solution. Front. Plant Sci. 2017, 8, 708. [Google Scholar] [CrossRef]
- Kang, J.H.; Krishnakumar, S.; Louise, S.; Atulba, S. Light intensity and photoperiod influence the growth and development of hydroponically grown leaf lettuce in a closed-type plant factory system. Hortic. Environ. Biotechnol. 2013, 54, 501–509. [Google Scholar] [CrossRef]
- Pan, J.; Gou, B. Effects of light intensity on the growth, photosynthetic characteristics, and flavonoid content of Epimedium pseudowushanense B.L. Guo. Molecules 2016, 21, 1475. [Google Scholar] [CrossRef] [PubMed]
- He, J.; See, X.E.; Qin, L.; Choong, T.W. Effects of root-zone temperatuszre on photosynthesis, productivity and nutritional quality of aeroponically grown salad rocket (Eruca sativa) vegetable. Am. J. Plant Sci. 2016, 7, 1993–2005. [Google Scholar] [CrossRef]
- Thornley, J.H.M. A balanced quantitative model for root: shoot ratios in vegetative plants. Ann. Bot. 1972, 36, 431–441. [Google Scholar] [CrossRef]
- Awal, M.A.; Ikeda, T.; Itoh, R. The effect of soil temperature on source-sink economy in peanut (Arachis hypogaea). Environ. Exp. Bot. 2003, 50, 41–50. [Google Scholar] [CrossRef]
- Gosselin, A.; Trudel, M.J. Influence of root-zone temperature on growth, development and yield of cucumber plants cv. Toska. Plant Soil 1985, 6, 327–336. [Google Scholar] [CrossRef]
- Gosselin, A.; Trudel, M. Interactions between root-zone temperature and light levels on growth, development and photosynthesis of Lycopersicon Esculentum mill. cultivar “vendor”. Sci. Hortic. (Amsterdam) 1984, 23, 313–321. [Google Scholar] [CrossRef]
- Cometti, N.N.; Bremenkamp, D.M.; Galon, K.; Hell, L.R.; Zanotelli, M.F. Cooling and concentration of nutrient solution in hydroponic lettuce crop. Hortic. Bras. 2013, 31, 287–292. [Google Scholar] [CrossRef]
- He, J.; Qin, L.; Lee, S.K. Root-zone CO2 and root-zone temperature effects on photosynthesis and nitrogen metabolism of aeroponically grown lettuce (Lactuca sativa L.) in the tropics. Photosynthetica 2013, 51, 330–340. [Google Scholar] [CrossRef]
- Cai, Y.; Luo, Q.; Sun, M.; Corke, H. Antioxidant activity and phenolic compounds of 112 traditional Chinese medicinal plants associated with anticancer. Life Sci. 2004, 74, 2157–2184. [Google Scholar] [CrossRef]
- Ghasemzadeh, A.; Jaafar, H.Z.E.; Rahmat, A.; Edaroyati, P.; Wahab, M. Effect of different light intensities on total phenolics and flavonoids synthesis and anti-oxidant activities in young ginger varieties (Zingiber officinale Roscoe). Int. J. Mol. Sci. 2010, 11, 3885–3897. [Google Scholar] [CrossRef]
- Dixon, R.A.; Paiva, N.L. Stress-induced phenylpropanoid metabolism. Plant Cell 1995, 7, 1085–1097. [Google Scholar] [CrossRef]
- Blokhina, O.; Virolainen, E.; Fagerstedt, K.V. Antioxidants, oxidative damage and oxygen deprivation stress: A review. Ann. Bot. 2003, 91, 179–194. [Google Scholar] [CrossRef]
- Li, Q.; Wang, W.; Wang, W.; Zhang, G.; Liu, Y.; Wang, Y.; Wang, W. Wheat F-Box protein gene TaFBA1 is involved in plant tolerance to heat stress. Front. Plant Sci. 2018, 9, 521. [Google Scholar] [CrossRef]
- Savoi, S.; Wong, D.C.J.; Arapitsas, P.; Miculan, M.; Bucchetti, B.; Peterlunger, E.; Fait, A.; Mattivi, F.; Castellarin, S.D. Transcriptome and metabolite profiling reveals that prolonged drought modulates the phenylpropanoid and terpenoid pathway in white grapes (Vitis vinifera L.). BMC Plant Biol. 2016, 1–17. [Google Scholar] [CrossRef] [PubMed]
- Mandoulakani, A.B.; Eyvazpour, E.; Ghadimzadeh, M. The effect of drought stress on the expression of key genes involved in the biosynthesis of phenylpropanoids and essential oil components in basil (Ocimum basilicum L.). Phytochemistry 2017, 139, 1–7. [Google Scholar] [CrossRef] [PubMed]
- de Matos Nunes, J.; Bertodo, L.O.O.; Da Rosa, L.M.G.; Von Poser, G.L.; Rech, S.B. Stress induction of valuable secondary metabolites in Hypericum polyanthemum acclimatized plants. S. Afr. J. Bot. 2014, 94, 182–189. [Google Scholar] [CrossRef]
- Kirakosyan, A.; Kaufman, P.; Warber, S.; Zick, S.; Aaronson, K.; Bolling, S.; Chul, S. Applied environmental stresses to enhance the levels of polyphenolics in leaves of hawthorn plants. Physiol. Plant. 2004, 121, 182–186. [Google Scholar] [CrossRef] [PubMed]
- De Abreu, I.N.; Mazzafera, P. Effect of water and temperature stress on the content of active constituents of Hypericum brasiliense Choisy. Plant Physiol. Biochem. 2005, 43, 241–248. [Google Scholar] [CrossRef] [PubMed]


© 2019 by the authors. Licensee MDPI, Basel, Switzerland. This article is an open access article distributed under the terms and conditions of the Creative Commons Attribution (CC BY) license (http://creativecommons.org/licenses/by/4.0/).
Share and Cite
Nguyen, D.T.P.; Lu, N.; Kagawa, N.; Takagaki, M. Optimization of Photosynthetic Photon Flux Density and Root-Zone Temperature for Enhancing Secondary Metabolite Accumulation and Production of Coriander in Plant Factory. Agronomy 2019, 9, 224. https://doi.org/10.3390/agronomy9050224
Nguyen DTP, Lu N, Kagawa N, Takagaki M. Optimization of Photosynthetic Photon Flux Density and Root-Zone Temperature for Enhancing Secondary Metabolite Accumulation and Production of Coriander in Plant Factory. Agronomy. 2019; 9(5):224. https://doi.org/10.3390/agronomy9050224
Chicago/Turabian StyleNguyen, Duyen T. P., Na Lu, Natsuko Kagawa, and Michiko Takagaki. 2019. "Optimization of Photosynthetic Photon Flux Density and Root-Zone Temperature for Enhancing Secondary Metabolite Accumulation and Production of Coriander in Plant Factory" Agronomy 9, no. 5: 224. https://doi.org/10.3390/agronomy9050224