Article

Association of Physiological Responses and Root Distribution Patterns of Ratooning Ability and Yield of the Second Ratoon Cane in Sugarcane Elite Clones

by
Saranya Chumphu
1,
Nuntawoot Jongrungklang
1,2 and
Patcharin Songsri
1,2,*
1
Department of Agronomy, Faculty of Agriculture, Khon Kaen University, Khon Kaen 40002, Thailand
2
Northeast Thailand Cane and Sugar Research Center, Faculty of Agriculture, Khon Kaen University, Khon Kaen 40002, Thailand
*
Author to whom correspondence should be addressed.
Agronomy 2019, 9(4), 200; https://doi.org/10.3390/agronomy9040200
Submission received: 22 February 2019 / Revised: 15 April 2019 / Accepted: 16 April 2019 / Published: 19 April 2019

Abstract

:
Poor ratooning ability for sugarcane can limit crop productivity and profitability of sugarcane growers. The objective of this study was to determine the association of physiological responses and root distribution patterns on the yield of the second ratoon cane, and the relationships between these traits. Seventeen sugarcane genotypes were planted in a randomized complete block design with four replications. The second ratoon crop was evaluated for germination percentage, cane yield, Soil Plant Analysis Development (SPAD) chlorophyll meter reading (SCMR), chlorophyll fluorescence, relative water content (RWC), specific leaf area (SLA), and stomatal conductance. Root length density (RLD) was evaluated through the auger method. The root samples were divided into upper and lower soil layers in order to study root distribution patterns. Sugarcane genotypes were significantly different for RLD, germination percentage, and cane yield. Root distribution patterns were classified into three groups based on the RLD. High RLD between plants in the upper soil layers at 90 days after harvest (DAH) was positively correlated with high germination, whereas high RLD between rows in the lower soil layers at 90 and 270 DAH was associated with high cane yield. RWC at 90 DAH and stomatal conductance at 180 DAH were closely related to germination percentage, whereas chlorophyll fluorescence and stomatal conductance at 180 DAH were closely related to cane yield.

1. Introduction

Sugarcane is an industrial crop used mainly as a raw material for sugar production. The by-products from sugar mills are also used for the production of other value-added products, such as electricity, veneer, monosodium glutamate, and ethanol. Sugarcane is largely grown under rain-fed conditions in arid and semi-arid tropical regions.
Drought stress is the most important factor reducing the ratooning ability and yield of sugarcane in the world. Reduction in cane yield has been estimated at up to 60% [1]. A low yield of a ratoon crop is mainly due to the low ratooning ability of sugarcane varieties and suboptimal crop management. Ratoon crops have a lower production cost than planted crops by 25–30% [2].
Sugarcane varieties respond differently to drought stress affecting sprouting, millable cane, commercial cane sugar, and ratooning ability [3]. Improvement of the ratooning ability in sugarcane will not be possible if the mechanism underlying the maintenance of the ratoon is not fully understood. Therefore, a better understanding of the association of the physiological traits of the shoot and root in maintaining higher ratooning ability should improve the efficiency of sugarcane production and benefit future breeding programs.
Roots function as an anchor to support plants in the soil and take up soil water and nutrients for plant growth and yield. After the canes are harvested, the ratoon crop can develop a new root system from old active roots within three days. New roots also emerge from the basal nodes of young shoots for several weeks after new shoots are developed, but at seven weeks after harvest, new roots rarely develop from old roots that have been active at the time of harvest [4]. Drought reduces root growth in upper soil layers, and root growth also shifts toward the lower soil layers to maintain water uptake [5].
In general, a plant’s root system and the physiological traits of the shoot may be inter-related, in which the developmental stage of the root strongly contributes to the plant’s total above-ground growth [6]. Physiological traits related to photosynthesis, such as Photosystem II (PSII) photochemical efficiency (Fv/Fm), stomatal conductance, transpiration, SPAD (Soil Plant Analysis Development) index, and water potential, were identified as the traits promoting photosynthesis in sugarcane [7,8,9]. Although the responses to drought for physiological traits, root traits, and germination have been studied in sugarcane, most studies were conducted in rhizoboxes or under field conditions with few genotypes, and the relationships of these characters and the cane yield of ratoon crops have not been sufficiently investigated.
To date, information on the responses to drought and its effects upon the physiological traits related to germination and yield of different sugarcane genotypes is still lacking. The hypothesis underlying our research project is that physiological traits and root traits are related to the ratooning ability of sugarcane, and that these traits might be useful for the selection of favorable ratooning genotypes. The objective of this study was to determine the association of the physiological responses and root distribution patterns on the yield of second ratoon cane, and the relationships between these traits. We hope that the information obtained in this study will be useful in explaining the association between ratooning ability and root distribution patterns for the recommendation of the surrogate traits needed to improve the sugarcane genotypes in breeding programs.

2. Materials and Methods

2.1. Experimental Design and Plant Materials

Seventeen sugarcane genotypes, consisting of 14 elite clones and three check genotypes (Table 1), were evaluated in a randomized complete block design with four replications at the Faculty of Agriculture, Khon Kean University, Khon Kaen, Thailand, for ratooning ability and yield of the second ratoon crop during the growing season of 2016. The soil type at the experimental site is classified as Yasothorn soil series, which is characterized by sandy soil (84.93% sand, 10.0% silt and 5.07% clay). The soil was slightly acidic (pH = 5.78), low in organic matter (0.54%), nitrogen deficient (0.03%), low in phosphorus (23.78 ppm), and sufficient in potassium (54.46 ppm).
Conventional tillage was practiced for soil preparation. In November 2014, the cane stalks were cut into single node segments and planted directly on the flat soil (without ridges) in five-row plots, 8.0 m in length, 7.5 m in width, and spaced in 0.5 × 1.5 m plots, totaling 68 plots. Data were recorded from the three middle rows, discarding the plants at the ends of each row. The planted crop and the first ratoon crop were harvested in 2014 and 2015, respectively. A chemical fertilizer formula (15–15–15 of N–P2O5–KO2, Thai Central Chemical Public Company Limited, Phra Nakhon Si Ayutthaya, Thailand) was applied to the ratoon crop in two splits at a rate of 312.5 kg/ha. The first split was applied after the first ratoon crop was harvested, and the second split was applied at the tillering stage, about four months after harvest. Weed control was carried out manually at four months after the harvest of the first ratoon crop.

2.2. Data Collection

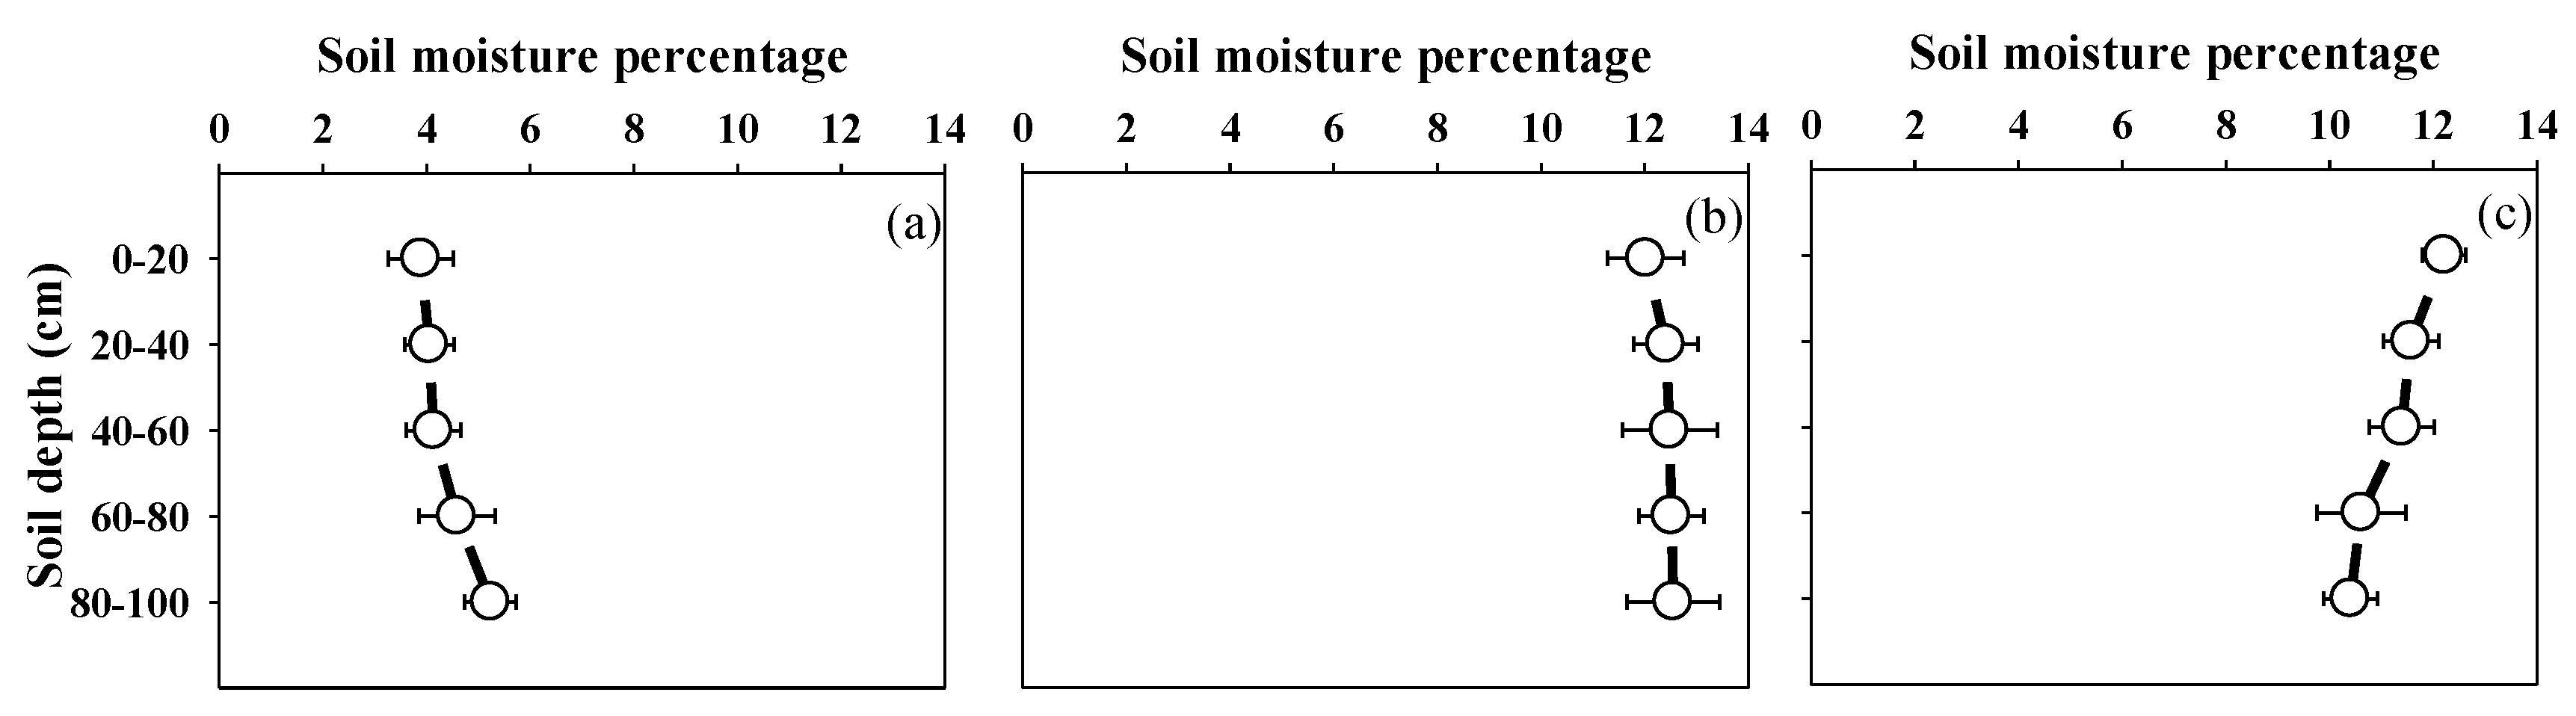
2.2.1. Meteorological and Soil Data

Meteorological data were recorded from January to December of 2016. Rainfall and the maximum and minimum temperatures were recorded by the weather station at the Agronomy Research Station, Faculty of Agriculture, Khon Kaen University. Soil moisture content data were recorded at 90, 180, and 270 days after harvest (DAH) at layers of 0–20, 20–40, 40–60, 60–80, and 80–100 cm within the soil profile. The soil samples were weighed and oven-dried at 105 °C for 72 h. Afterwards, the percentage of soil moisture was determined from the weights of both wet and dry soil.
The maximum and minimum temperatures from January to December 2016 were 34.0 and 22.6 °C, respectively. Total rainfall during the experimental period was 1119 mm (Figure S1). Soil moisture contents differed at 90 (drought period), 180 (recovery period), and 270 DAH (Figure 1). At 90 and 180 DAH, the soil moisture contents in the top soil were lower than that of the subsoil (Figure 1a,b), yet at 270 DAH, the soil moisture content in the top soil was higher than that of the subsoil (Figure 1c).

2.2.2. Germination Percentage

The number of plants was recorded at 60 days after harvest (DAH) of the first ratoon crop, and was calculated as follows:
Germination   percentage   = Number   of   stool   germination   of   the   second   ratoon   crop   Number   of   stool   harvested   of   the   first   ratoon   crop     ×   100  

2.2.3. Physiological Traits

Physiological traits consisting of specific leaf area (SLA), SPAD chlorophyll meter reading (SCMR), chlorophyll fluorescence, stomatal conductance, and relative water content (RWC) were measured at 90 (drought stress period), 180 (recovery period), and 270 (full growth) DAH from the second fully expanded leaf of the main stalk between 09:00 and 12:00.
Specific leaf area was measured using an LI-3100C Area Meter, LI-COR, Inc. Lincoln, Nebraska, USA. Six second leaves from six stalks in each plot were used for measuring specific leaf area. The leaf samples were first measured for leaf area and then oven-dried at 80 °C for 72 h, or until the weights were constant, and the dry weights were then measured. SLA was calculated as the ratio between leaf area (cm2) and leaf dry weight (g).
SPAD chlorophyll meter reading (SCMR) was measured using an SPAD chlorophyll meter (SPAD-501, Minolta, Tokyo, Japan), at the bottom, middle, and tip of the leaf. The measurements were undertaken from six leaves of six stems, and therefore there were 18 measurements for each plot. Chlorophyll fluorescence was measured on intact leaves using a Chlorophyll fluorescence (MINI PAM, Heinz Walz GmbH, Effeltrich, Germany) between 09:00 and 12:00. Stomatal conductance was measured via an SC-1 Leaf Porometer (Decagon Devices, Inc. Pullman, WA 99163, USA). Relative water content (RWC) was determined as the weight difference between a freshly harvested leaf and a water saturated leaf. Leaf samples were imbibed in distilled water for 24 h. The water saturated leaves were dried with blotting paper in order to eliminate excessive water. Leaf saturated weight was then determined. The leaf samples were then oven-dried at 80 °C for 72 h, and leaf dry weight was measured. The RWC was calculated as follows:
RWC   = ( Leaf   fresh   weight     Leaf   dry   weight )     ( Leaf   saturated   weight     Leaf   dry   weight )   ×   100  

2.2.4. Root Traits

Root length density (RLD) was measured at 90 and 270 DAH using the auger method. The auger, consisting of a coring tube [10] with a diameter of 69 mm and a length of 1.15 m, was designed to reduce compaction in the inner tube by improving the cutting edge and reducing the tube’s thickness [10,11]. Root samples were collected from two positions including the position between plants at a distance of 25.0 cm, and the position between rows at a distance of 75.0 cm. Root samples were taken at a depth of 100 cm, and separated into five layers consisting of 0–20, 20–40, 40–60, 60–80, and 80–100 cm.
Root samples of each layer were washed manually with tap water to remove soil from the roots. The root samples were then analyzed via the Winrhizo program (Winrhizo Pro (s) V. 2004a, Regent Instruments, Inc., Quebec, Canada) to determine root length. RLD was calculated as the ratio between root length (cm) and soil volume (cm3). RLD from the first (0–20 cm) and second (20–40 cm) layers were combined and defined as the upper soil layer (0–40 cm), while the RLD for the deeper layers (third to fifth) were combined to form the lower soil layer (40–100 cm).

2.2.5. Yield

Cane yield was calculated from the weight of all millable canes within the harvest area of each plot at 360 DAH. The crop was maintained according to Thailand’s conventional management practices for sugarcane production, and yield data were collected for the planted crop (PC), first ratoon crop (1R), and second ratoon crop (2R). The crops were harvested manually by cutting the stalks at ground level and discarding the tops.

2.3. Statistical Analysis

All statistical analyses were conducted using the software package Statistix 10 (Analytical Software, Tallahassee, FL, USA). Data were subjected to analysis of variance (ANOVA) in accordance with the randomized complete block design. Means were separated by least significant difference (LSD) at 0.05 probability level. Simple correlation was used to determine the relationships between physiological traits, ratooning ability, and cane yield.

3. Results

3.1. Germination and Yield

The overall means for cane yield of the planted crop, first ratoon crop, and second ratoon crop were 106.90, 83.10, and 67.63 tons/ha, respectively (Table 2 and Table S1). The results indicate that cane yield reduced over the years. Sugarcane genotypes were significantly different (p ≤ 0.01) for the cane yield of the planted crop, first ratoon crop, and second ratoon crop. Yield reductions in comparison to the planted crop were 22.26% and 36.73% for the first ratoon crop and second ratoon crop, respectively. Comparing yield reductions between varieties can help to identify varieties with high ratooning ability, based on their maintaining yield in second ratoon crops. Kps01-12, MPT05-187, and TBy28-0941 were the genotypes with low yield reductions in the second ratoon crop compared to the planted crop and the first ratoon crop (Table S1).
Germination percentages in the planted crop were 100%, as any dead plants were re-planted using sprouted sets. The germination percentages in the first and second ratoon crops were 76.14 and 67.00, respectively (Table S2). Similar to cane yield, germination percentages also reduced over the years, producing significant differences in germination percentages for both the first ratoon crop and second ratoon crop (compared to plant crop), at 24.26% and 46.83%, respectively.
The detailed data for cane yield and germination percentage are presented in Tables S1 and S2. Interestingly, the ranks of sugarcane genotypes for the planted crop, first ratoon crop, and second ratoon crop differed in both cane yield and germination percentage. The results indicate that the interaction of genotype by environment was also an important characteristic. Therefore, extensive evaluation of sugarcane genotypes under different environments is required in order to identify superior genotypes.
In this study, the germination of new plants from harvested plants of the planted and first ratoon crops was evaluated at 60 days after harvest, after the crop was subjected to the drought period, and cane yield was evaluated at 270 DAH, when the crop received sufficient water from the rainy season. In our study, we attempted to establish the variations in cane yield and germination percentages in the given sugarcane genotypes, and to determine whether germination percentage is related to yield. While the correlation between cane yield and germination percentage in the second ratoon crop was positive and low, (r = 0.19) (Figure 2a) the correlation between cane yield and the reduction in germination percentages was high and significant, especially for the correlations made within the same year (Figure 2b,c). The correlations between cane yields of different years were high and positive, especially between consecutive years (Figure 2d,e).

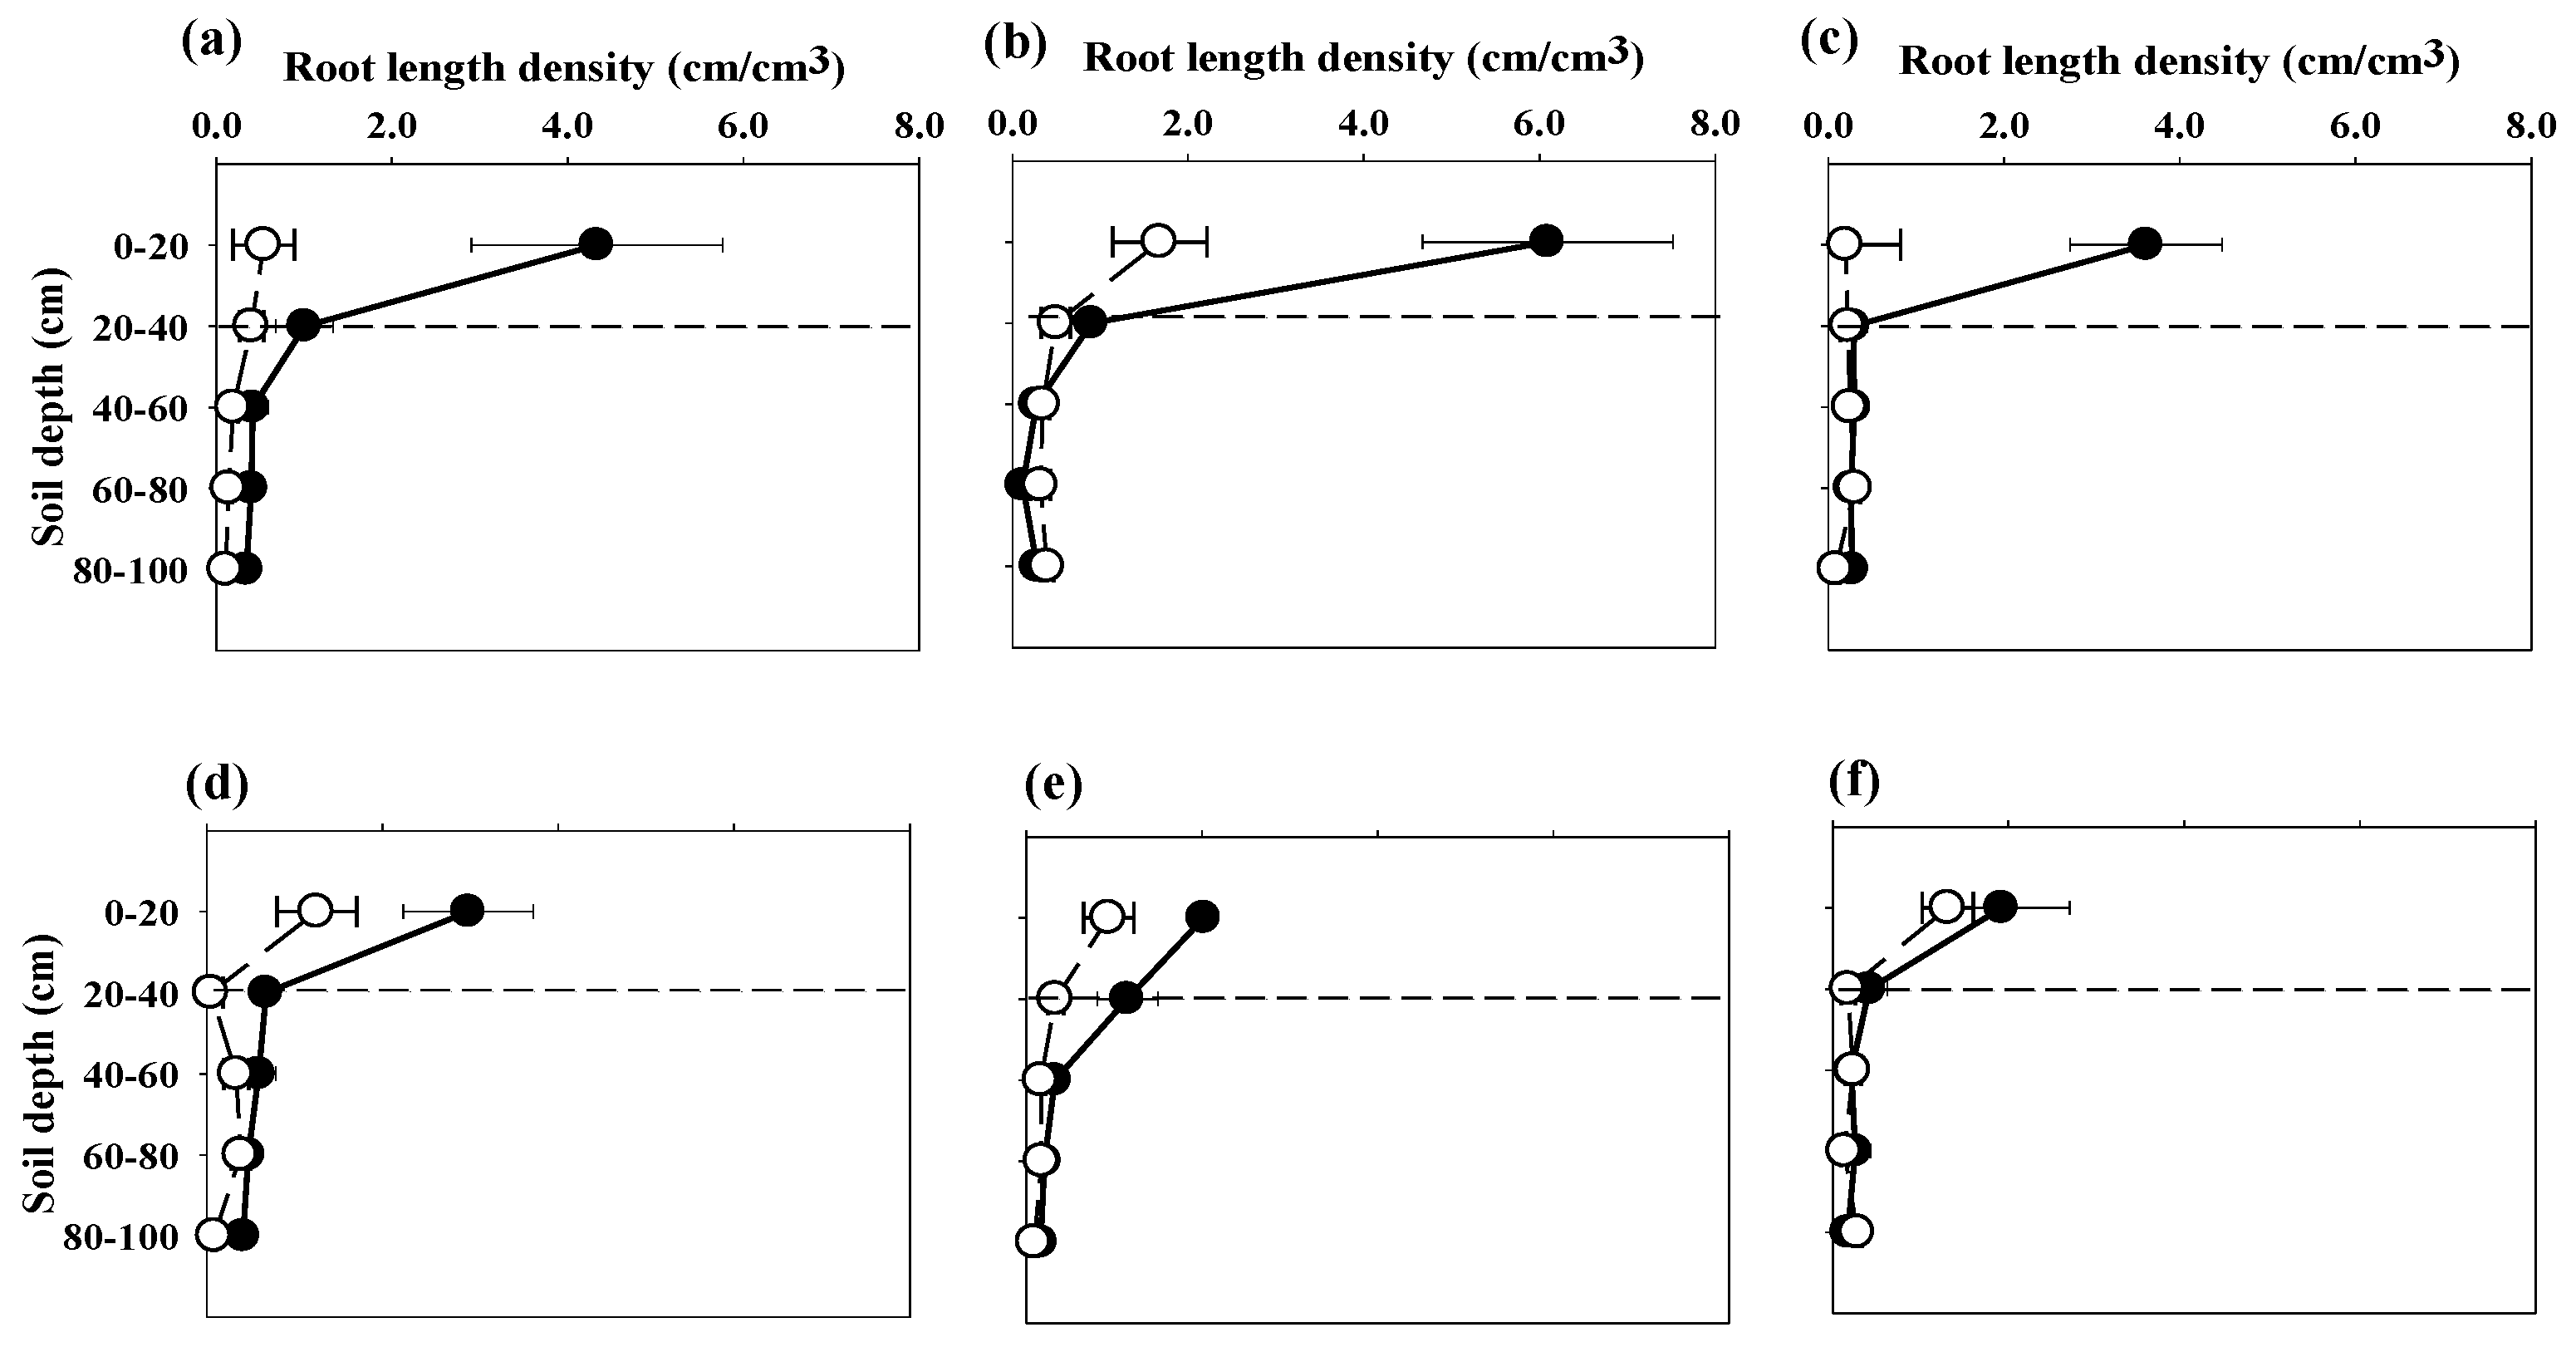
3.2. Root Length Density

In this study, root length density was studied at two positions between plants and between rows at 90 and 270 DAH. At the time of each sampling, the soil core from the auger was divided into five layers at 20 cm intervals, and later, the two upper layers were combined into a single layer. The three lower layers were also combined into one layer due to the low recovery of the root system. The authors raised two questions: whether there is variation in root length density among sugarcane genotypes, and whether there is a difference in root length density at different positions in relation to water uptake of sugarcane.
The data for root length density are presented in Table S3. The significant variations (p ≤ 0.05) in root length density were observed among sugarcane varieties at both soil depths, positions of sampling, and sampling times (Table 3).
At 90 days after harvest, root length densities between plants at a soil depth of 0–40 cm ranged from 0.24 cm/cm3 (KK06-419) to 1.73 cm/cm3 (UT13), whereas root length densities at a soil depth of 40–100 cm ranged from 0.10 cm/cm3 (UT13) to 0.40 cm/cm3 (KKU99-06). KK3, K88-92, UT13, KKU99-06, KKU99-03, Kps01-12, TBy28-1211, KK06-501, and TBy28-0941 were the genotypes with high root length density in top soil, and KKU99-06, Kps01-12, and UT12 were the genotypes with high root length density in sub soil. Notably, the KKU99-06 and Kps01-12 were common in both top soil and sub soil.
The range of root length densities between rows at the soil layer of 0–40 cm was from 0.01 cm/cm3 in CSB07-79 to 0.58 cm/cm3 in UT13, and the range at the soil layer of 40–100 cm was from 0.07 cm/cm3 in TBy28-0941 to 0.32 cm/cm3 in Kps01-12. UT13 showed high root length density in top soil, and MPT02-458, KKU99-03, and Kps01-12 represented the genotypes with high root length density in sub soil. The genotype with high root length density at both soil layers was not observed.
At 270 days after harvest, root length densities between plants at the soil layer of 0–40 cm ranged from 1.16 cm/cm3 in Kps01-12 to 3.49 cm/cm3 in KK06-419, whereas root length densities at the soil layer of 40–100 cm ranged from 0.15 cm/cm3 in KKU99-06 to 0.49 cm/cm3 in KKU99-02. KK06-419, KKU99-06, CSB07-219, MPT05-187, and TBy28-0941 had high root length density in top soil, whereas KK06-419 and MPT05-187 displayed high root length density in sub soil. MPT05-187 was common in both top soil and sub soil.
Root length densities between rows at the soil layer of 0–40 cm ranged from 0.10 cm/cm3 in TBy28-1211 to 4.10 cm/cm3 in UT12, whereas root length density at the soil layer of 40–100 cm ranged from 0.09 cm/cm3 to 0.42 cm/cm3 in UT12 and KK06-419, respectively. It is interesting to note here that root length density at the position between rows was much lower than the position between plants within rows, possibly due to the proximity of the plants in the rows, as the plants in the rows were much closer than those between rows. However, root length density at the position between rows might be useful in relation to water mining during the drought period.

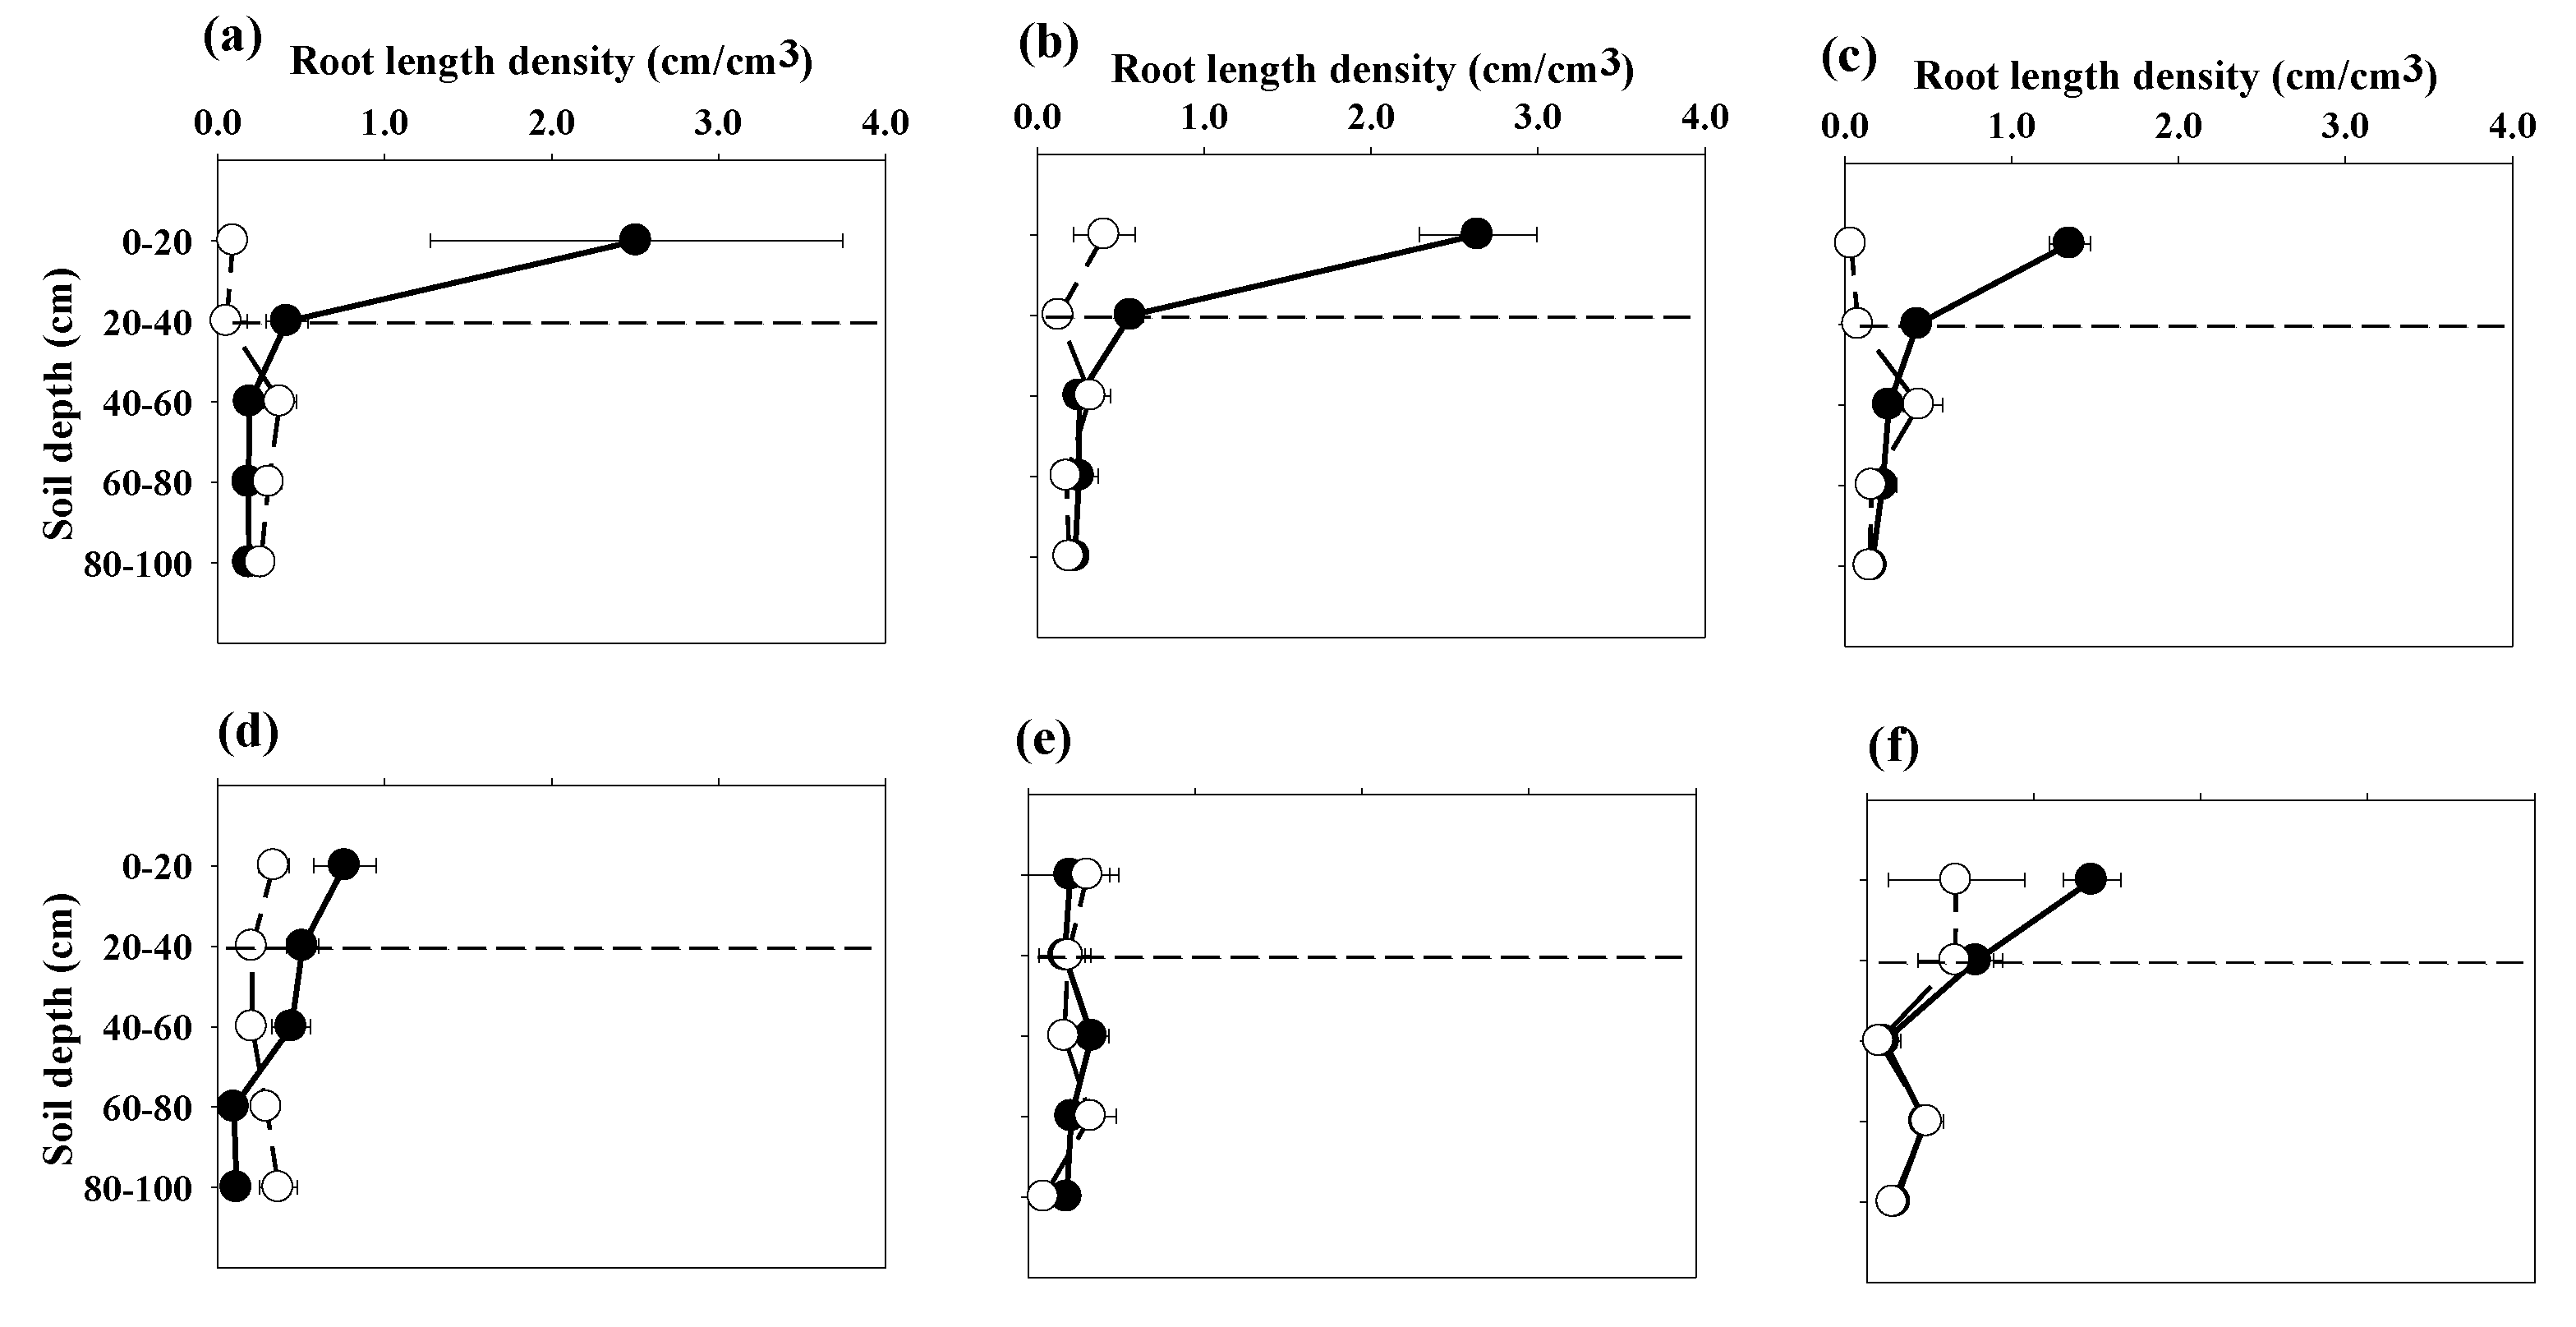
3.3. Root Distribution Patterns

Drought modifies root growth for sugarcane, and the sugarcane genotypes may respond differently. The patterns of root length density were classified by overlaying the images of root distribution, which were evaluated at 90 DAH (Figure 3) and 270 DAH (Figure 4). At each evaluation, the root distribution patterns were classified into six groups (A–F).
At 90 DAH, the seventeen sugarcane genotypes were classified: Group A consisted of TBy28-1211, K88-92, KKU99-03, TBy28-0941, KK06-501, UT12, and KKU99-06 (Figure 3a), Group B had the KK3, Kps01-12, and UT13 genotypes (Figure 3b), Group C contained CSB07-79, CSB07-219, and MPT02-458 (Figure 3c), KKU99-01 was the only member of group D (Figure 3d), Group E consisted of KK06-419 and KKU99-02 (Figure 3e), and Group F had one genotype, MPT05-187 (Figure 3f).
Groups C, D, and E proved interesting, as they had high root length density in the lower soil layer at the positions between plants and between rows. We surmised that high root length density in the lower soil layer at 90 DAH is important for drought resistance, where roots in the lower soil layer are responsible for water uptake in moist soil.
The seventeen sugarcane genotypes were then classified at 270 DAH and divided into six different groups (A–F) (Figure 4). The TBy28-0941, KK06-501, MPT05-187, K88-92, CSB07-219, and KK3 sugarcane genotypes were classified into group A (Figure 4a), Group B consisted of KKU99-06 and KK06-419 (Figure 4b), Group C had three sugarcane genotypes, TBy28-1211, MPT02-458, and KKU99-01 (Figure 4c), Group D contained UT12, KKU99-02, and KKU99-03 (Figure 4d), Group E included UT13 and CSB07-79 (Figure 4e), and Group F consisted of only the Kps01-12 genotype (Figure 4f). Group B was the most interesting, in that it developed high root length density in the upper soil and lower soil layers at the positions between plants and between rows. Root systems at 270 DAH developed during the drought recovery period, in which moist soil was available in both the upper and lower soil layers.
In this study, a well-watered control was not available. Under well-watered conditions, root density is high in the upper soil layers. KKU99-06 had high root length densities at 0–40 and 40–100 cm under at 90 DAH, which persisted until harvest (270 DAH). The results demonstrated high root length density and good root distribution under drought supported germination.

3.4. Physiological Traits Related to Drought Resistance

SPAD chlorophyll meter reading (SCMR), chlorophyll fluorescence, and relative water content were evaluated at 90, 180, and 270 DAH, whereas specific leaf area and stomatal conductance were evaluated at 180 and 270 DAH (Tables S4 and S5). Sugarcane genotypes were significantly different (p ≤ 0.05) for SCMR at 180 and 270 DAH, chlorophyll fluorescence at 90 and 180 DAH, and relative water content at 90 DAH (Table 4). KKU99-02, CSB07-79, TBy28-1211, and MPT05-187 had the highest SCMR at 180 DAH, whereas TBy28-1211 had the highest SCMR at 270 DAH. TBy28-1211 and UT12 had the highest chlorophyll fluorescence at 90 DAH, whereas KK06-419, MPT02-458, K88-92, UT13, KKU99-01, KKU99-06, TBy28-1211, Kps01-12, TBy28-1211, and MPT05-187 had the highest chlorophyll fluorescence at 270 DAH.
Relative water content at 90 DAH (96.20%) was lower than that at 180 and 270 DAH (98.26 and 96.61, respectively). Although the sugarcane genotypes were significantly different for relative water content at 90 DAH, the differences were rather small. Most sugarcane genotypes produced similar values, with the exception of the MPT02-458, Kps01-12, and KK06-501 genotypes, which had the lowest relative water contents.
Sugarcane genotypes were significantly different (p ≤ 0.05) for specific leaf area at 180 and 270 DAH, and stomatal conductance at 180 and 270 DAH (Table 5). Specific leaf area was higher at 180 DAH (82.99 cm2/g) than at 270 DAH (66.4 cm2/g), whereas stomatal conductance was lower at 180 DAH (304.32 µm2/s) than at 270 DAT (338.20 µm2/s). Genotypes with lower specific leaf areas are preferable, as they show thicker leaves. KK3, K88-92, CSB07-219, CSB07-219, KK06-501, MPT05-187, and UT12 had the lowest specific leaf areas at 180 DAH, whereas KK3, KK06-419, MPT02-458, K88-92, Kps01-12, UT12, and TBy28-0941 had the lowest specific leaf areas at 270 DAH. Conversely, the KK3, K88-92, and K88-92 genotypes had consistently high specific leaf areas across all sampling periods.
Sugarcane genotypes with high values are also preferred. The highest stomatal conductance was found in KK3, KK06-419, MPT02-458, UT13, KKU99-01, KKU99-06, KKU99-03, Kps01-12, and TBy28-1211 at 180 DAH, the KK06-419, Kps01-12, TBy28-1211, and MPT05-187 genotypes had the highest specific leaf area at 270 DAH, and KK06-419, Kps01-12, and TBy28-1211 showed a high stomatal conductance at both 180 and 270 DAH.

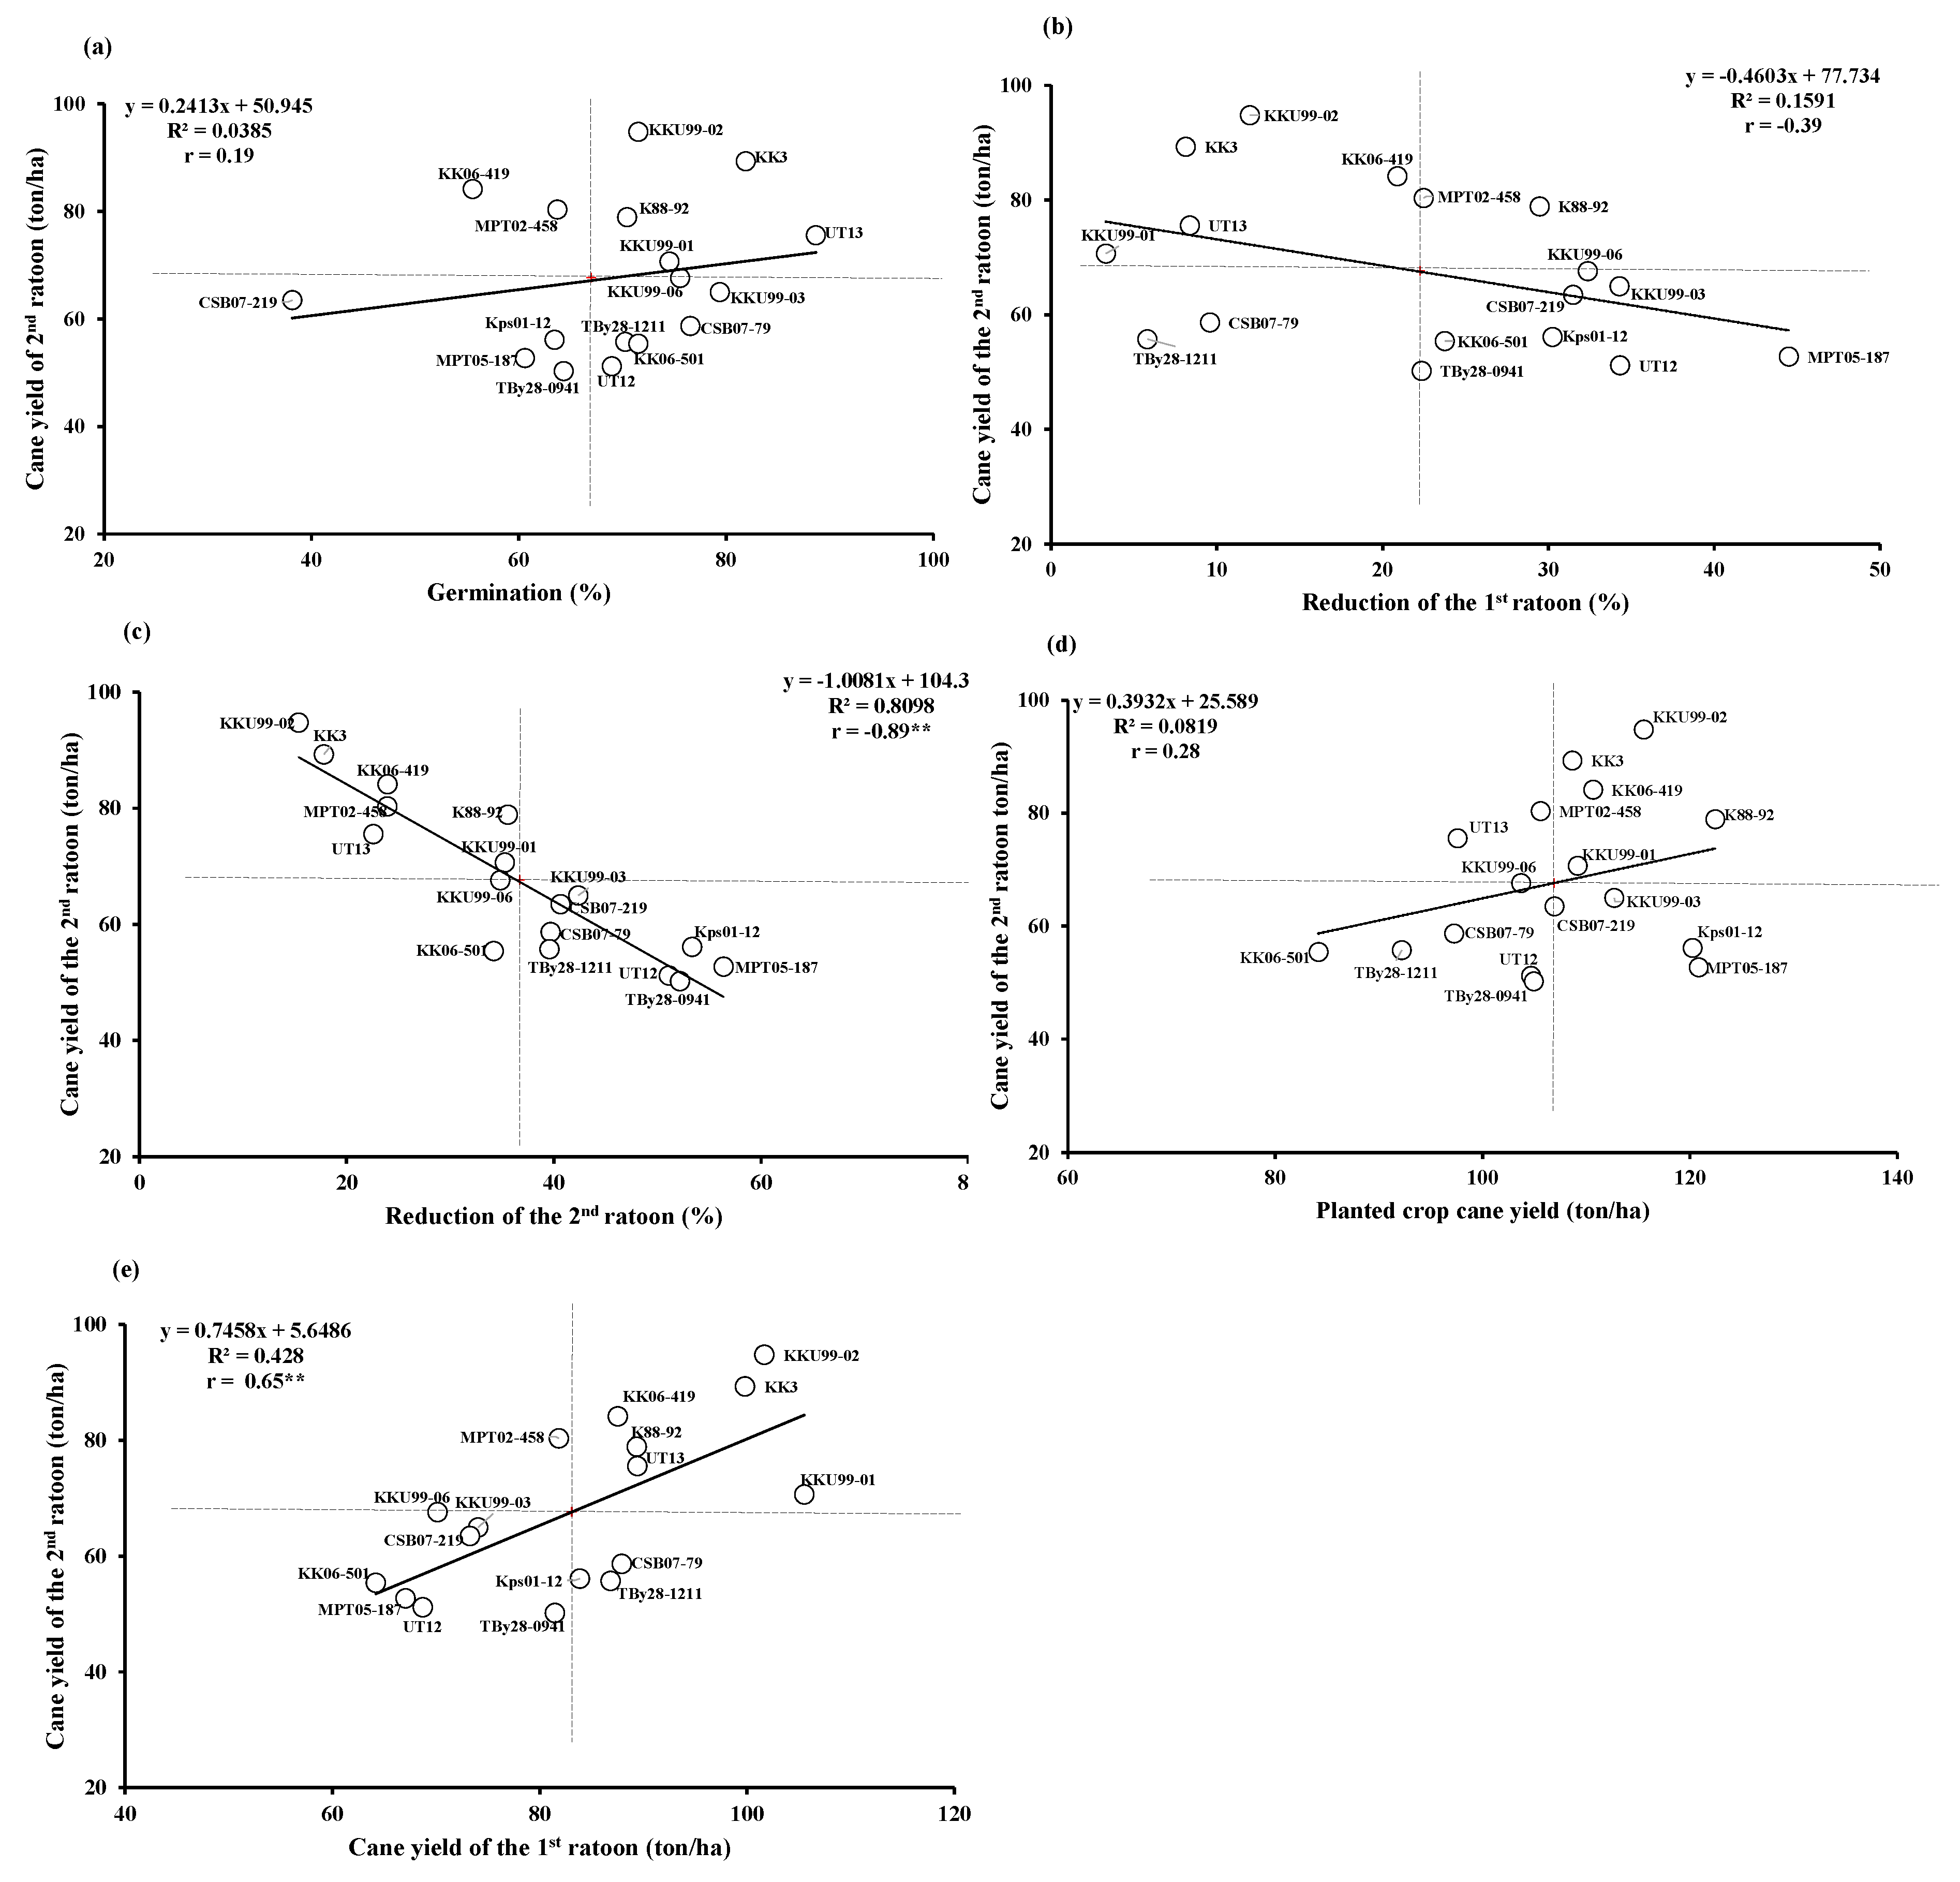
3.5. Correlations Between Traits

The correlation coefficients of root length density with cane yield and germination percentage are presented in Table 6. Most correlation coefficients were not statistically significant, however significant correlation coefficients were observed for root length density between plants in the upper soil layers at 90 DAH with germination percentage (0.36**), root length density between plants in the lower soil layers at 270 DAH with germination percentage (−0.32*), root length density between rows in the lower soil layers at 90 DAH and cane yield (0.35*), and root length density between rows in the lower soil layers at 270 DAH and cane yield (0.51**).
Root length density between plants at early growth phases (90 DAH) in the upper soil layers might be beneficial to the correlating germination percentage, whereas germinated plants may reduce the root length density between plants at 270 DAH in the lower soil layers. In contrast, germinated plants increased root length density between rows at 90 and 270 DAH in the lower soil layers. The negative correlation of root length density between plants in the lower soil layers at 270 DAH with germination percentage might be due to the competition for assimilation between shoots and roots.
Physiological traits that had significant correlations with germination percentage were relative water content at 90 DAH (0.27*) and stomatal conductance at 180 DAH. The physiological traits that demonstrated a significant correlation with cane yield were chlorophyll fluorescence at 180 DAH (0.44**) and stomatal conductance at 180 DAH (0.36**) (Table 7). Physiological traits at 270 DAH were not correlated with cane yield or germination percentage.

4. Discussion

4.1. Germination and Yield

Germination of new plants from old plants is a critical event in sugarcane production, which assures good crop establishment and cane yield [12]. This study specifies the importance of germination reduction on sugarcane yield loss, which proved to be more severe in successive years.
Environmental factors greatly affect the ratooning ability and yield of the ratoon crop [13,14]. The germinating bud is initially dependent on the nutrients and water in the set, developing its own root system after about three weeks under proper conditions [15].
Soil water is also an important factor affecting the germination of sugarcane. In a related study, the date of first irrigation after planting significantly affected sprouting percentages, in which the best sprouting was obtained when the sets were irrigated at planting [16]. The application of a superabsorbent polymer into the sandy soil improved soil moisture content, and increased germination and early growth of sugarcane genotypes [17].
In this study irrigation was not available, and therefore the germination of the crop was solely dependent on stored soil water. We therefore evaluated the responses of sugarcane genotypes in the drought period at the early growth phases of the second ratoon crop.
Some physiological traits were directly or indirectly associated with crop growth and yield [7,18]. Root traits may prove useful as a selection tool in sugarcane breeding. Drought stress reduced root growth in the upper soil layers, shifting root growth to the lower soil layers to maintain water uptake [5]. Crop species and genotypes within a species responded differently to drought stress, in which the responses were dependent on the occurrence of drought events at different growth stages of sugarcane including germination, tillering, grand growth, and maturity [19].
Sugarcane genotypes responded differently to soil moisture deficit regarding their ratooning ability during the drought period. UT13, KK3, KKU99-03, CSB07-79, KKU99-06, KKU99-01, KKU99-02, K88-92, TBy28-1211, and UT12 had high ratooning ability, indicated by a high germination percentage in the second ratoon crop, whereas KKU99-02, KK3, K88-92, UT13, and KKU99-01 had high ratooning ability based on higher germination percentages and cane yield. Cane yield is a complex trait and is generally selected on the basis of yield components such as stalk number, stalk diameter, stalk length, and single stalk weight. Effects of these traits on cane yield have been previously studied in spring crops [20,21,22].

4.2. Root Length Density

The study of whole root systems under field conditions is difficult and may only be possible in a greenhouse. The study of root length density using the soil core method has been applied to several crops under field conditions [23]. Roots provide anchorage and facilitate the acquisition of water and nutrients from soil [24]. Sugarcane is a deep-rooted crop, owing to its long growth cycle and longevity of the root system through multiple rotations compared to other crops. Root systems reach depths from 1.5 meters to even 6 meters [4]. However, drought conditions had been reported to increase root systems, seeking water from soil inadequate moisture environments [25].
In this study, sugarcane genotypes under drought stress conditions had high root length density in lower soil layers at the position between plants, and at the position between rows. KK3, K88-92, and UT13 showed high root length density in upper soil layers at the position between plants. UT13 displayed high RLD in the upper soil layer at the position between rows, whereas K88-92 and KKU99-01 showed high RLD in the lower soil layers.
Deep rooting is a complex trait consisting of root growth angle and maximum root length [26,27]. Phenotypic variation in the root growth angle and root length density at the position between plants has been found to develop a steep and near-vertical root angle [28]. Moreover, root length density at the position between rows has been found to develop a near-horizontal root angle. Root growth angle determines whether a plant develops a shallow or deep root system.

4.3. Root Distribution Patterns

In this study, a well-watered control was not available. Under well-watered conditions, root density is high in the upper soil layers. However, under drought conditions, plants increase root system lengths in order to take up more water from the inadequate soil moisture environments [25]. Plants are believed to be capable of modifying root growth to meet water demands during droughts [29]. We found that sugarcane genotypes differed significantly in germination percentage and sugarcane development, which were closely related to soil moisture [30]. KKU99-06 showed high root length densities at both soil layers (0–40 and 40–100 cm) under drought conditions (at 90 DAH). The results demonstrated high root length density and good root distribution under drought supported germination.
Roots play an important role in plant development, delivering water and nutrients to the shoot, and are directly related to yield. Sugarcane genotypes might have the drought tolerant mechanisms needed to cope with water-limited environments by maintaining high water status and investing in more assimilate proportions for supplying root systems during drought stress. The maintenance of high water uptake under drought stress might be assisted by an improvement in the root/shoot ratio, in which drought resistant cultivars are able to maintain a high root/shoot ratio under drought conditions [31].

4.4. Physiological Traits Related to Drought Resistance

In this study, sugarcane genotypes were not significantly different in SCMR at 90 DAH. In a previous study, an early season drought significantly reduced SCMR in sugarcane [32]. SCMR is an indicator of the photo-synthetically active light-transmittance characteristics of a leaf, which is dependent on the unit number of chlorophyll per unit leaf area (chlorophyll density) [33]. SCMR was also closely related to chlorophyll content [34] and chlorophyll density [35]. The differences in results between different studies might be due to the differences in plant age, plant genotype, and drought duration and severity.
Drought limits growth (plant height) [36] as well as the physiological processes in sugarcane, and therefore reduces yield [7,18] by as much as 60% [1]. In general, drought reduces soil water potential, leaf water potential [37,38], and the photosynthetic efficiency of photosystem II [7]. Drought also reduces relative water content [7,39], stomata conductance [40], photosynthetic rate [41,42,43], and PSII photochemical efficiency [40].
In this study, KK3, KK06-419, and KKU99-01 increased chlorophyll fluorescence and relative water content under the drought stress period. This suggests that they might have drought tolerance mechanisms to maintain high water status under drought conditions. Maintaining a high water status was possibly due to the ability of the root system to mine more water under drought [44].
KK3 and K88-92 had low specific leaf areas at 180 DAH, which was the period of drought recovery, indicating that these genotypes had thicker leaves. Thicker leaves usually have greater chlorophyll per unit of leaf area, and hence had greater photosynthetic capacity. KK06-419 showed high stomatal conductance after the recovery period. Stomatal conductance of sugarcane is controlled by the root system, and may perhaps also involve a chemical signal [45]. In sugarcane, drought-tolerant genotypes are capable of maintaining a high relative water content under drought [46]. KKU99-02, KK3, KK06-419, K88-92, UT13, and KKU99-01 each demonstrated high relative water content under drought. In sugarcane, the cultivars with drought tolerance had a higher relative water content and stomatal conductance than the susceptible cultivars [47].
Enhanced root length in the lower soil layers enables plants to better extract available soil moisture from the soil profile [25,48]. Plant root systems respond to the available soil water in both water limited soil and water abundant soil conditions. Root growth deep into the lower soil results in an increase in relative water content of about 40–51% [49]. The roots’ physiological responses, such as root length, chlorophyll fluorescence, and stomatal conductance in stress periods, are important factors contributing to sugarcane biomass yield [50].

4.5. Correlations among Traits

The negative correlation of root length density between plants in the lower soil layers at 270 DAH with germination percentage might be due to the competition for assimilation between shoots and roots. Where water is available in the surface layers of the soil following harvest, new shoots are sustained by new superficial roots, however the persistence of the old root system is critical to the survival of the stool and subsequent growth of the ratoon crop during the dry periods after harvest [51].
It is interesting to note that root length density between rows in the lower soil layers at 90 and 270 DAH supported increased yields of sugarcane. These root distributions might be due to the adaptation to drought, allowing the sugarcane to take up more water in the lower soil layers. Row distance is an important factor affecting the root distribution patterns of sugarcane [52], where a wide distance between rows may provide more soil moisture to the crop during water-limited conditions.
In this study, K88-92 was an interesting genotype for high RLD in lower soil layers at positions between plants, whereas KK06-419 proved interesting due to a high RLD in lower soil layers at positions between rows. The responses for these root traits might be beneficial to sugar yield under drought conditions. In wheat, better partitioning of the root mass in deep soil (60–120 cm) [53], and the subsequent increase in the crop’s ability to extract water [54] contributed to yield maintenance under drought stress. Genotypes with larger canopies and root systems could have a greater rate of water use and growth, which may persist for some time, even as stress develops because larger canopies and above-ground growth may continue to support greater root growth, and vice versa [55].
Soil moisture is an important factor in the germination of sugarcane, as indicated by the high correlation of germination and relative water content at 90 DAH. Germinated plants might then increase stomatal conductance and ultimately increase cane yield. Stomatal and root hydraulic conductances are correlated in sugarcane, for both pot- and field-grown crops, resulting in the approximate homeostatic regulation of leaf water potential [4].
Chlorophyll fluorescence at 90 DAH was another significant trait related to harvest yield, whereas each physiological trait at 270 DAH showed no relation to the germination percentage and cane yield. The significant correlation between chlorophyll fluorescence and cane yield is not surprising, as this trait is related to photosynthesis [56]. Chlorophyll fluorescence may be useful as a surrogate trait for cane yield. At 270 DAH, an evaluation of physiological traits may prove to be too late to generate any significant relationships with cane yield.
It is important to note here that sugarcane in the drought recovery phase had higher photosynthetic efficiency and higher stomatal conductance than the sugarcane in the drought stress phase. The high photosynthetic rate during the drought recovery phase clearly contributed to the sugarcane’s higher yield.

5. Conclusions

The sugarcane genotypes differed significantly in germination percentage and cane yield. However, while the correlations between these traits were relatively low, they remained positive. The results indicated that a reduction in germination percentage could lead to lower cane yield. Selection of sugarcane genotypes with medium to high germination percentages should improve ratooning ability in sugarcane population. The correlation between root length density and germination percentage indicated that root length density between plants at 90 DAH in the upper soil layers might contribute to a high germination percentage, and root length density between rows at 90 and 270 DAH in the lower soil layer might contribute to a higher cane yield. Relative water content at 90 DAH was significantly correlated with the germination percentage, indicating that high water uptake of plants is important for high germination. Chlorophyll fluorescence and stomatal conductance were positively associated with germination percentage and cane yield, indicating that these traits contribute to higher cane yield.
Consequently, the selection of sugarcane traits provides a greater ability to produce and maintain high yields. These root characteristics, together with the stomatal characteristics, improve water absorption, which affects the plant’s rate of photosynthesis, which may be one of the underlying factors contributing to greater yield ability.

Supplementary Materials

The following are available online at https://www.mdpi.com/2073-4395/9/4/200/s1, Figure S1: Rainfall (mm), maximum temperature (Tmax) and minimum temperature (Tmin) during January–December 2016, Table S1: Means for cane yield of plant crop (PC) in 2014, the 1st ratoon crop (1R) in 2015 and the 2nd ratoon crop (2R) in 2016 of 17 sugarcane genotypes, Table S2: Germination percentage (the 1st ratoon crop (1R) and the 2nd ratoon crop (2R)) and germination reduction of the second ratoon crop of 17 sugarcane genotypes, Table S3: Root length density in 17 sugarcane genotypes on positioned between plants and between rows at the 90 and 270 days after harvest in upper soil layer (0–40 cm) and lower soil layer (40–100 cm) in 2016, Table S4: SPAD chlorophyll meter reading (SCMR), Chlorophyll fluorescence and Relative water content (RWC) of the 2nd ratoon cane in 17 sugarcane genotypes in 2016, Table S5: Specific leaf area (SLA) and stomatal conductance of the 2nd ratoon cane in 17 sugarcane genotypes in 2016.

Author Contributions

Conceptualization, P.S. and N.J.; performed the analyses and collected the data, S.C.; writing—original draft preparation, S.C.; writing—review and editing, P.S. All authors have read and approved the manuscript.

Acknowledgments

The research project was funded by the Khon Kaen University (KKU) research fund, 2017; and the Northeast Thailand Cane and Sugar Research Center (NECS), Khon Kaen University (KKU), Khon Kaen, Thailand. Our gratitude is also extended to the Manuscript Preparation Project of KKU and the Thailand Research Fund (TRF).

Conflicts of Interest

The authors declare no conflict of interest.

Abbreviations

1RFirst ratoon crop
2RSecond ratoon crop
DAHDays after harvest
LSDLeast significant difference
PCPlant crop
RLDRoot length density
RWCRelative water content
SCMRSPAD chlorophyll meter reading

References

  1. Robertson, M.J.; Inman-Bamber, N.G.; Muchow, R.C.; Wood, A.W. Physiology and productivity of sugarcane with early and mid-season water deficit. Field Crop Res. 1999, 64, 211–227. [Google Scholar] [CrossRef]
  2. Bashir, S.; Hassan, M.; Fiaz, N.; Khan, Z.; Ali, Z. Ratooning potential of different promising sugarcane genotypes at varying harvesting dates. J. Agric. Biol. Sci. 2013, 8, 437–440. [Google Scholar]
  3. Bashir, S.; Fiaz, N.; Ghaffar, A.; Khalid, F. Ratooning ability of sugarcane genotypes at different harvesting dates. Int. Sugar J. 2012, 114, 273–276. [Google Scholar]
  4. Smith, D.M.; Inman-Bamber, N.G.; Thorburn, P.J. Growth and function of the sugarcane root system. Field Crop Res. 2005, 92, 169–183. [Google Scholar] [CrossRef]
  5. Laclau, P.B.; Laclau, J.P. Growth of the whole root system for a plant crop of sugarcane under rainfed and irrigated environments in Brazil. Field Crop Res. 2009, 114, 351–360. [Google Scholar] [CrossRef]
  6. Gregory, P.J. Plant Roots: Growth, Activity and Interaction with Soil; Blackwell Publishing: Oxford, UK, 2006; pp. 1–44. [Google Scholar]
  7. Silva, M.D.A.; Jifon, J.L.; Da Silva, J.A.; Sharma, V. Use of physiological parameters as fast tools to screen for drought tolerance in sugarcane. Braz. J. Plant Physiol. 2007, 19, 193–201. [Google Scholar] [CrossRef]
  8. Silva, M.A.; Jifon, J.L.; Sharma, V.; Silva, J.A.G.; Caputo, M.M.; Damaj, M.B.; Guimara, E.R. Use of physiological parameters in screening drought tolerance in sugarcane genotypes. Sugar Tech 2011, 13, 191–197. [Google Scholar] [CrossRef]
  9. Santos, C.M.; Almeida Silva, M.; Lima, G.P.; Almeida Prado Bortolheiro, F.P.; Brunelli, M.C.; Holanda, L.A.; Oliver, R. Physiological changes associated with antioxidant enzymes in response to sugarcane tolerance to water deficit and rehydration. Sugar Tech 2015, 17, 291–304. [Google Scholar] [CrossRef]
  10. Welbank, P.J.; Gibb, M.J.; Taylor, P.J.; Williams, E.D. Root growth of cereal crops. In Rothamsted Experimental Station Annual Report 1973, Part 2. Rothamsted Experimental Station; Lawes Agricultural Trust: Harpenden, UK, 1974; pp. 26–66. [Google Scholar]
  11. Ford, K.E.; Gregory, P.J.; Gooding, M.J.; Pepler, S. Genotype and fungicide effects on late-season root growth of winter wheat. Plant Soil 2006, 284, 33–44. [Google Scholar] [CrossRef]
  12. Watanabe, K.; Saensupo, S.; Na-iam, Y.; Klomsa-ard, P.; Sriroth, K. Effects of superabsorbent polymer on soil water content and sugarcane germination and early growth in sandy soil conditions. Sugar Tech. 2018. [CrossRef]
  13. Gomathi, R.; Rao, P.N.G.; Rakkiyappan, P.; Sundara, B.P.; Shiyamala, S. Physiological studies on ratoonability of sugarcane varieties under tropical Indian condition. Am. J. Plant Sci. 2013, 4, 274. [Google Scholar] [CrossRef]
  14. Zhou, M.M.; Shoko, M.D. Simultaneous selection for yield and ratooning ability in sugarcane genotypes using analysis of covariance. S. Afr. J. Plant. Soil. 2012, 29, 93–100. [Google Scholar] [CrossRef]
  15. Bull, T.A.; Glasziou, K.T. Sugarcane. In Crop Physiology; Evans, L.T., Ed.; Cambridge University Press: Cambridge, UK, 1975; pp. 51–72. [Google Scholar]
  16. Abayomi, Y.A.; Etejere, E.O.; Fadayomi, O. Effect of stalk section, coverage depth and date of first irrigation on seedcane germination of two commercial sugarcane cultivars in Nigeria. Turrialba 1990, 40, 58–62. [Google Scholar]
  17. Mauri, R.; Coelho, R.D.; Junior, F.; Eusímio, F.; Barbosa, F.D.S.; Leal, D.P. Water relations at the initial sugarcane growth phase under variable water deficit. Eng. Agríc. 2017, 37, 268–276. [Google Scholar] [CrossRef]
  18. Mu, Z.; Guo, L.; Ru-Kai, C.H.E.N. Photosynthesis characteristics in eleven cultivars of sugarcane and their responses to water stress during the elongation stage. Proc. Int. Soc. Sugar Cane Technol. 2001, 24, 642–643. [Google Scholar]
  19. Gascho, G.J.; Shih, S.F. Sugarcane. In Crop-Water Relations; Teare, I.D., Peet, M.M., Eds.; John Wiley and Sons: New York, NY, USA, 1983; pp. 445–479. [Google Scholar]
  20. Kang, M.S.; Sosa, O.; Miller, J.D. Path analyses for percent fiber and cane and sugar yield in sugarcane. Crop Sci. 1989, 29, 1481–1483. [Google Scholar] [CrossRef]
  21. Milligan, S.B.; Gravois, K.A.; Bischoff, K.P.; Martin, F.A. Crop effects on genetic relationships among sugarcane traits. Crop Sci. 1990, 30, 927–931. [Google Scholar] [CrossRef]
  22. Ilyas, M.K.; Khan, F.A. Determining sucrose recovery in Saccarrum officinarum L. using regression and correlation analyses. Afr. J. Biotechnol. 2010, 9, 2985–2988. [Google Scholar]
  23. Samson, B.K.; Sinclair, T.R. Soil core and minirhizotron comparison for the determination of root length density. Plant Soil 1994, 161, 225–232. [Google Scholar] [CrossRef]
  24. Lynch, J. Root architecture and plant productivity1. Plant Physiol. 1995, 109, 7–13. [Google Scholar] [CrossRef]
  25. Jongrungklanga, N.; Toomsana, B.; Vorasoota, N.; Jogloya, S.; Booteb, K.J.; Hoogenboomc, G.; Patanothaia, A. Drought tolerance mechanisms for yield responses to pre-flowering drought stress of peanut genotypes with different drought tolerant levels. Field Crops Res. 2013, 144, 34–42. [Google Scholar] [CrossRef]
  26. Araki, H.; Morita, S.; Tatsumi, J.; Iijima, M. Physiol-morphological analysis on axile root growth in upland rice. Plant Prod. Sci. 2002, 5, 286–293. [Google Scholar] [CrossRef]
  27. Uga, Y.; Sugimoto, K.; Ogawa, S.; Rane, J.; Ishitani, M.; Hara, N.; Kitomi, Y.; Inukai, Y.; Ono, K.; Kanno, N.; et al. Control of root system architecture by deeper rooting 1 increases rice yield under drought conditions. Nat. Genet. 2013, 45, 1097. [Google Scholar] [CrossRef]
  28. An, H.; Dong, H.; Wu, T.; Wang, Y.; Xu, X.; Zhang, X.; Han, Z. Root growth angle: An important trait that influences the deep rooting of apple rootstocks. Sci. Hort. 2017, 216, 256–263. [Google Scholar] [CrossRef]
  29. Kato, Y.; Okami, M. Root morphology, hydraulic conductivity and plant water relations of high-yielding rice grown under aerobic conditions. Ann. Bot. 2011, 108, 575–583. [Google Scholar] [CrossRef] [Green Version]
  30. Moreira, D.R.; Cardoso, V.J.M. Effect of soil moisture content and the irrigation frequency on the sugarcane germination. Pesqui. Agropecu. Bras. 1998, 721–729. [Google Scholar]
  31. Jangpromma, N.; Thammasirirak, S.; Jaisil, P.; Songsri, P. Effects of drought and recovery from drought stress on above ground and root growth, and water use efficiency in sugarcane (Saccharum officinarum L.). Aust. J. Crop Sci. 2012, 6, 1298–1304. [Google Scholar]
  32. Jangpromma, N.; Songsri, P.; Thammasirirak, S.; Jaisil, P. Rapid assessment of chlorophyll content in sugarcane using a SPAD chlorophyll meter across different water stress conditions. Asian J. Plant Sci. 2010, 9, 368–374. [Google Scholar] [CrossRef]
  33. Richardson, A.D.; Duigan, S.P.; Berlyn, G.P. An evaluation of noninvasive methods to estimate foliar chlorophyll content. New Phytol. 2002, 153, 185–194. [Google Scholar] [CrossRef] [Green Version]
  34. Akkasaeng, C.; Vorasoot, N.; Jogloy, S.; Patanotai, A. Relationship between SPAD readings and chlorophyll contents in leaves of peanut (Arachis hypogaea L.). Thai J. Agric. Sci. 2003, 36, 279–284. [Google Scholar]
  35. Arunyanark, A.; Jogloy, S.; Akkasaeng, C.; Vorasoot, N.; Kesmala, T.; Nageswara Rao, R.C.; Patanothai, A. Chlorophyll stability is an indicator of drought tolerance in peanut. J. Agron. Crop Sci. 2008, 194, 113–125. [Google Scholar] [CrossRef]
  36. Silva, M.D.A.; Silva, J.A.G.D.; Enciso, J.; Sharma, V.; Jifon, J. Yield components as indicators of drought tolerance of sugarcane. Sci. Agric. 2008, 65, 620–627. [Google Scholar] [CrossRef]
  37. Steudle, E. Water uptake by roots: Effects of water deficit. J. Exp. Bot. 2000, 51, 1531–1542. [Google Scholar] [CrossRef]
  38. Liberato, M.A.R.; Gonçalves, J.F.D.C.; Chevreuil, L.R.; Junior, N.; da Rocha, A.; Fernandes, A.V.; Santos Junior, U.M.D. Leaf water potential, gas exchange and chlorophyll a fluorescence in acariquara seedlings (Minquartia guianensis Aubl.) under water stress and recovery. Braz. J. Plant Physiol. 2006, 18, 315–323. [Google Scholar] [CrossRef]
  39. Lobato, A.K.S.; Oliveria Neto, C.F.; Costa, R.C.L.; Santos Filho, B.G.; Cruz, F.J.R.; Laughinghouse, I.V. Biochemical and physiological behavior of Vigna unguiculata (L.) Walp. under water stress during the vegetative stage. Asian J. Plant Sci. 2008, 7, 44–49. [Google Scholar]
  40. Zhao, D.; Glaz, B.; Comstock, J.C. Sugarcane response to water-deficit stress during early growth on organic and sandy soils. Am. J. Agric. Biol. Sci. 2010, 5, 403–414. [Google Scholar] [CrossRef]
  41. Davies, W.J.; Wilkinson, S.; Loveys, B. Stomatal control by chemical signaling and the exploitation of this mechanism to increase water use efficiency in agriculture. New Phytol. 2002, 153, 449–460. [Google Scholar] [CrossRef]
  42. Azevedo Neto, A.D.D.; Prisco, J.T.; Enéas-Filho, J.; Lacerda, C.F.D.; Silva, J.V.; Costa, P.H.A.D.; Gomes-Filho, E. Effects of salt stress on plant growth, stomatal response and solute accumulation of different maize genotypes. Braz. J. Plant Physiol. 2004, 16, 31–38. [Google Scholar] [CrossRef]
  43. Smit, M.A.; Singels, A. The response of sugarcane canopy development to water stress. Field Crops Res. 2006, 98, 91–97. [Google Scholar] [CrossRef]
  44. Turner, N.C. Adaptation to water deficits: A changing perspective. Funct. Plant Biol. 1986, 13, 175–190. [Google Scholar] [CrossRef]
  45. Smith, J.P.; Lawn, R.J.; Nable, R.O. Investigations into the root: Shoot relationship of sugarcane, and some implications for crop productivity in the presence of sub-optimal soil conditions. Proc. Aust. Soc. Sugar Cane Technol. 1999, 21, 108–113. [Google Scholar]
  46. Boutraa, T.; Akhkha, A.; Al-Shoaibi, A.A.; Alhejeli, A.M. Effect of water stress on growth and water use efficiency (WUE) of some wheat cultivars (Triticum durum) grown in Saudi Arabia. J. Taibah Univ. Sci. 2010, 3, 39–48. [Google Scholar] [CrossRef]
  47. Graça, J.P.D.; Rodrigues, F.A.; Farias, J.R.B.; Oliveira, M.C.N.D.; Hoffmann-Campo, C.B.; Zingaretti, S.M. Physiological parameters in sugarcane cultivars submitted to water deficit. Braz. J. Plant Physiol. 2010, 22, 189–197. [Google Scholar] [CrossRef] [Green Version]
  48. Songsri, P.; Jogloy, S.; Kesmala, T.; Vorasoot, N.; Akkasaeng, C.; Patanothai, A.; Holbrook, C.C. Response of reproductive characters of drought resistant peanut genotypes to drought. Asian J. Plant Sci. 2008, 7, 427–439. [Google Scholar]
  49. Derner, J.D.; Polley, H.W.; Johnson, H.B.; Tischler, C.R. Root system response of C4 grass seedlings to CO2 and soil water. Plant Soil 2001, 231, 97–104. [Google Scholar] [CrossRef]
  50. Khonghintaisong, J.; Songsri, P.; Toomsan, B.; Jongrungklang, N. Rooting and physiological trait responses to early drought stress of sugarcane cultivars. Sugar Tech 2018, 20, 396–406. [Google Scholar] [CrossRef]
  51. Glover, J. The behavior of the root-system of sugarcane at and after harvest. Proc. S. Afr. Sugar Technol. Assoc. 1968, 42, 133–135. [Google Scholar]
  52. Azevedo, M.C.B.D.; Chopart, J.L.; Medina, C.D.C. Sugarcane root length density and distribution from root intersection counting on a trench-profile. Sci. Agric. 2011, 68, 94–101. [Google Scholar] [CrossRef] [Green Version]
  53. Atta, B.M.; Mahmood, T.; Trethowan, T.M. Relationship between root morphology and grain yield of wheat in north-western NSW, Australia. Aust. J. Crop Sci. 2013, 7, 2108. [Google Scholar]
  54. Reynolds, M.; Dreccer, F.; Trethowan, R. Drought-adaptive traits derived from wheat wild relatives and landraces. J. Exp. Bot. 2006, 58, 177–186. [Google Scholar] [CrossRef] [Green Version]
  55. Basnayake, J.; Jackson, P.A.; Inman-Bamber, N.G.; Lakshmanan, P. Sugarcane for water-limited environments. Sugarcane for water-limited environments: Genetic variation in cane yield and sugar content in response to water stress. J. Exp. Bot. 2012, 63, 6023–6033. [Google Scholar] [CrossRef]
  56. Krause, G.H.; Weis, E. Chlorophyll fluorescence and photosynthesis: The basics. Annu. Rev. Plant Biol. 1991, 42, 313–349. [Google Scholar] [CrossRef]
Figure 1. Soil moisture content (%) at 90 days after harvest (a), 180 days after harvest (b), and 270 days after harvest (c) within the drought and recovery periods in 2016.
Agronomy 09 00200 g001
Figure 2. Correlations coefficients between: (a) cane yield and germination percentage of the 2nd ratoon crop in 2016; (b) cane yield of the 2nd ratoon crop and reduction percentage of the 1st ratoon crop in 2015; (c) cane yield of the 2nd ratoon crop and reduction percentage of the 2nd ratoon crop; (d) cane yield of the 2nd ratoon crop and cane yield of the plant crop in 2014; and (e) cane yield of the 2nd ratoon crop and cane yield of the 1st ratoon crop of the 17 sugarcane genotypes.
Agronomy 09 00200 g002
Figure 3. Distribution patterns for the root length density of 17 sugarcane genotypes in five soil layers at 20 cm intervals, resulting in an upper soil layer (0–40 cm) and a lower soil layer (40–100 cm), evaluated at two positions—between plants (BP, ●) and between rows (BR, o)—at 90 days after harvest in 2016. Genotype groups were comprised of: (a) TBy28-1211, K88-92, KKU99-03, TBy28-0941, KK06-501, UT12, and KKU99-06; (b) KK3, Kps01-12, and UT13; (c) CSB07-79, CSB07-219, and MPT02-458; (d) KKU99-01; (e) KK06-419 and KKU99-02; and (f) MPT05-187.
Agronomy 09 00200 g003
Figure 4. Distribution patterns for root length density of 17 sugarcane genotypes in five soil layers at 20 cm intervals, resulting in an upper soil layer (0–40 cm) and a lower soil layer (40–100 cm), evaluated at two positions—between plants (BP, ●) and between rows (BR, o)—at 270 days after harvest in 2016. Genotype groups were comprised of (a) TBy28-0941, KK06-501, MPT05-187, K88-92, CSB07-219, and KK3; (b) KKU99-06 and KK06-419; (c) TBy28-1211, MPT02-458, and KKU99-01; (d) UT12, KKU99-02, and KKU99-03; (e) UT13 and CSB07-79; and (f) Kps01-12.
Agronomy 09 00200 g004
Table 1. Sugarcane genotypes used within this experiment.
GenotypeSource
1.) TBy28-1211Kasetsart University, Kamphaeng Saen Campus
2.) TBy28-0941Kasetsart University, Kamphaeng Saen Campus
3.) MPT02-458Mitr Phol Innovation & Research Center
4.) MPT05-187Mitr Phol Innovation & Research Center
5.) UT12Suphan Buri Field Crops Research Center
6.) UT13Suphan Buri Field Crops Research Center
7.) CSB07-79Office of the Cane and Sugar Board
8.) CSB07-219Office of the Cane and Sugar Board
9.) KK06-419Khon Kaen Field Crops Research Center
10.) KK06-501Khon Kaen Field Crops Research Center
11.) KKU99-01Khon Kaen University
12.) KKU99-02Khon Kaen University
13.) KKU99-03Khon Kaen University
14.) KKU99-06Khon Kaen University
15.) Kps01-12 Kasetsart University
16.) KK3Khon Kaen Field Crops Research Center
17.) K88-92Office of the Cane and Sugar Board
Table 2. Mean squares for cane yield (planted crop (PC) in 2014, the 1st ratoon crop (1R) in 2015, and the 2nd ratoon crop (2R) in 2016) and germination percentage of the second ratoon crop of 17 sugarcane genotypes.
SourceCane YieldGermination Percentage
PC1R2R
Replication9.8127.440.88351.07
Genotypes293.42 **579.35 **593.02 **718.86 **
Error16.7422.8368.43191.79
CV. (%)3.835.2712.2321.27
Overall mean106.9890.7267.6365.12
** significant at p ≤ 0.01.; CV. = coefficient of variation.
Table 3. Mean squares for root length density in 17 sugarcane genotypes on positions between plants and between rows at 90 and 270 days after harvest in the upper soil layer (0–40 cm) and the lower soil layer (40–100 cm) in 2016.
SourceRLD (cm/cm3) between Plants/at 90 DAHRLD (cm/cm3) between Rows/at 90 DAHRLD (cm/cm3) between Plants/at 270 DAHRLD (cm/cm3) between Rows/at 270 DAH
Upper
(0–40 cm)
Lower
(40–100 cm)
Upper
(0–40 cm)
Lower
(40–100 cm)
Upper
(0–40 cm)
Lower
(40–100 cm)
Upper
(0–40 cm)
Lower
(40–100 cm)
Replication0.000.000.000.000.030.000.010.00
Genotypes0.70 **0.02 **0.06 **0.01 **1.42 **0.03 **0.30 **0.02 **
Error0.020.000.000.000.020.000.000.00
CV. (%)12.5510.1012.6714.807.1513.9714.5018.19
Overall mean1.160.230.180.202.290.280.460.21
** significant at p ≤ 0.01.; CV. = coefficient of variation.
Table 4. Mean squares for SPAD chlorophyll meter reading (SCMR), chlorophyll fluorescence, and relative water content (RWC) of the 2nd ratoon cane in 17 sugarcane genotypes in 2016.
SourceSCMRChlorophyll Fluorescence (Fv/Fm)RWC (%)
90 DAH180 DAH270 DAH90 DAH180 DAH270 DAH90 DAH180 DAH270 DAH
Replication15.8002.3407.5200.0010.0010.0041.4603.75052.310
Genotypes6.420 *8.710 **8.420 **0.001 **0.000 **0.000ns10.120ns2.690ns56.980ns
Error2.8802.7102.6000.0000.0000.0005.2302.21049.520
CV. (%)4.5404.0203.9402.4000.9001.4202.3801.5107.280
Overall mean37.35041.06040.9500.7890.8040.80896.20098.25096.610
ns, *, and ** indicated no significant difference, a significant difference at p ≤ 0.05, and a significant difference at ≤0.01, respectively.
Table 5. Mean squares for specific leaf area (SLA) and stomatal conductance of the second ratoon cane in 17 sugarcane genotypes in 2016.
SourceSpecific Leaf Area (cm2/g)Stomatal Conductance (µm2/s)
180 DAH270 DAH180 DAH270 DAH
Replication67.90193.401235.4312445.30
Genotypes708.35 **180.78 **4599.38 **3934.80 *
Error70.0828.06689.231692.70
CV. (%)10.097.978.6311.76
Overall mean82.9966.46304.32349.86
* and ** indicated a significant difference at p ≤ 0.05, and a significant difference at ≤0.01, respectively.
Table 6. Correlation coefficient (r) of root length density (RLD) on the cane yield and germination percentage of the 2nd ratoon cane of 17 sugarcane genotypes in 2016.
Cane YieldGermination Percentage
Root length density
Upper soil layer (0–40 cm)
RLD between plants at 90 DAH−0.120.36 **
RLD between rows at 90 DAH0.220.14
RLD between plants at 270 DAH0.17−0.14
RLD between rows at 270 DAH−0.09−0.01
Lower soil layer (40–100 cm)
RLD between plants at 90 DAH0.12−0.00
RLD between rows at 90 DAH0.35 *0.12
RLD between plants at 270 DAH−0.00−0.32 *
RLD between rows at 270 DAH0.51 **−0.12
* and ** significant at 0.05 and 0.01 probability level, respectively. (n = 17).
Table 7. Correlation coefficients (r) of physiological traits; SPAD chlorophyll meter reading (SCMR), chlorophyll fluorescence, relative water content (RWC), specific leaf area (SLA), and stomatal conductance on cane yield and germination percentage of the 2nd ratoon cane of 17 sugarcane genotypes in 2016.
Cane YieldGermination Percentage
Physiological traits
At 90 DAH.
Chlorophyll fluorescence−0.010.05
RWC0.130.27 *
SCMR0.210.21
At 180 DAH.
Chlorophyll fluorescence0.44 **0.27
RWC0.06−0.07
SCMR0.04−0.23
SLA0.180.14
Stomatal conductance0.36 **0.45 **
At 270 DAH.
Chlorophyll fluorescence0.19−0.03
RWC0.100.21
SCMR−0.070.01
SLA−0.26−0.05
Stomatal conductance0.08−0.16
* and ** significant at 0.05 and 0.01 probability level, respectively. (n = 17).

