Article

Optimum Sowing Dates for High-Yield Maize when Grown as Sole Crop in the North China Plain

1
Key Laboratory of Farming System, The Ministry of Agriculture and Rural Affairs, College of Agronomy and Biotechnology, China Agricultural University, Beijing 100193, China
2
Institute of Crop Sciences, Chinese Academy of Agricultural Sciences, Beijing 100081, China
3
Institute of Crop Research, Shandong Academy of Agricultural Sciences, Jinan 250100, China
*
Authors to whom correspondence should be addressed.
Agronomy 2019, 9(4), 198; https://doi.org/10.3390/agronomy9040198
Submission received: 12 March 2019 / Revised: 15 April 2019 / Accepted: 16 April 2019 / Published: 18 April 2019
(This article belongs to the Section Innovative Cropping Systems)

Abstract

:
The maize sole cropping system solves problems related to ground water resource shortages and guarantees food security in the North China Plain. Using optimal sowing dates is an effective management practice for increasing maize yield. The goal of this study was to explore an optimum sowing date for high-yield maize. Six sowing dates (SDs) from early April to late June with intervals of 10 to 20 days between SD—SD1 (early April), SD2 (mid to late April), SD3 (early May), SD4 (mid to late May), SD5 (early June), SD6 (late June)—were applied from 2012 to 2017. The results showed that yield was correlated with the sowing date based on the thermal time before sowing (r = 0.62**), which was defined as the pre-thermal time (PTt), and that the yield was steadily maintained at a high level (>10,500 kg ha−1) when PTt was greater than 479 °C. To satisfy the growing degree-days required for maturity, maize needs to be sown before a PTt of 750 °C. Data analysis of the results from 2014, 2015, and 2017 revealed the following: i) Most of the grain-filling parameters of late-sown dates (SD4, SD5 and SD6) were better than those in early-sown dates (SD1, SD2, and SD3) in all years, because of the high daily maximum temperature (Tmax) and wide diurnal temperature (Td) from silking to blister (R1–R2) of early-sown dates. The weight of maximum grain-filling rate (Wmax) of SD3 decreased compare with SD4 by the narrow Td from blister to physiological maturity (R2–R6) in all years (−5, −12, and −33 mg kernel−1 in 2014, 2015, and 2017, respectively). ii) In 2017, the pollination failure rates of early-sown dates were 8.4~14.5%, which was caused by the high Tmax and Td of R1–R2. The apical kernel abortion rates were 28.6 (SD2) and 38.7% (SD3), which were affected by Tmax and Td during R2–R6. iii) Compared with late-sown dates, the wide Td of early-sown dates in R1–R2 was caused by higher Tmax, but the narrow Td in R2-R6 was caused by higher Tmin. Our results indicate that high-yielding maize can be obtained by postponing the sowing date with a PTt of 480~750 °C, which can prevent the negative effects of the high Tmax of R1–R2 and high Tmin of R2–R6 on kernel number and weight formation. Moreover, these above-mentioned traits should be considered for heat tolerance breeding to further increase the maize yield.

1. Introduction

Global demand for water has sharply increased over the last century. Total annual water withdrawal from agriculture, municipalities, and industries increased from less than 580 km3 in 1900 to more than 3900 km3 in 2010. Agriculture water consumption accounts for approximately 70% of the total freshwater withdrawal in the world, mostly through irrigation [1]. The North China Plain (NCP) is one of the major agricultural production areas in China [2], with an annual mean precipitation of 500–600 mm/year and an annual crop evapotranspiration of 800–900 mm/year. Shortages of water resources have become a limiting factor for sustainable crop production. In 2018, based on gravity recovery and climate experiment satellites, the Chinese Academy of Sciences team confirmed that the world’s largest groundwater depression cone is located in the north part of the NCP due to long-term overpumping. More than 70% of the irrigation water is used for winter wheat under the current winter wheat-summer maize double-cropping system employed in this region [3]. There is an urgent need to reduce the planting area of winter wheat here to ensure sustainable agriculture, especially when encountering extreme groundwater shortages. Thus, the maize sole cropping system (i.e., one crop a year) has been discussed and tested in recent years [4,5,6].
However, changes in sunlight, precipitation, and temperature under the scenarios of climate change present a challenge to crop production. Rainfall frequently results in insufficient solar radiation and waterlogging. The decline of photosynthetic capacity induced by shading causes a significant reduction of summer maize grain yield [7]. Maize yield has significantly reduced by 7.0~18.5% because of waterlogging in the seedling stage, and grain weight has decreased more significantly with increasing waterlogging duration [8,9]. In particular, heat stress and drought stress occur simultaneously [10], and most previous studies have focused on the effects of heat stress or drought stress on maize. Hawkins et al. (2013) [11] found that the relative significance of the precipitation variability of the maize yield in France had decreased since the 1960s, and the effect of heat stress variability is now as important as precipitation. Each degree day increase of the daily mean temperature above 30 °C reduced the final yield by 1% under rain-fed conditions and by 1.7% under drought conditions [12]. Schlenker and Roberts (2009) [13] found that maize yields increased with a daily mean temperature up to 29 °C but that temperatures above these thresholds were very harmful to growth. Recently, numerous studies have focused on the effects of nighttime temperature on wheat [14,15], rice [16,17,18], and cotton [19], but few of these studies have focused on maize [20]. Therefore, to fully exploit the yield potential of maize sole cropping systems, we should provide a suitable climate condition for maize growth, namely, an optimal sowing date. Numerous previous studies have studied the optimization of the sowing date and investigated the effect of different sowing dates on spring or summer maize in NCP [5,21,22,23,24,25]. On the one hand, the optimal sowing date can provide maize with relatively appropriate climate conditions, such as sufficient natural light, temperature, and precipitation resources. On the other hand, the optimal sowing date can help maize to avoid abiotic stresses during the critical period of kernel formation and growth (vegetative and reproductive co-growth stage and reproductive stage). However, there is still a lack of research on wider annual sowing dates ranges for the maize mono-cropping system, including both spring maize and summer maize. In addition, most research defines the sowing date by the day of the year, which has a large photothermal resource variation in each year. Thermal time (Tt), which is expressed in growing degree-days or heat units, has greatly improved the accuracy of the description and prediction of crop phenological events compare with other approaches, such as the time of year or number of days [26,27]. Using the stability of Tt, this study determines the optimum sowing date based on pre-thermal time (PTt), which is defined as the effective accumulated temperature before sowing.
Consequently, the objectives of this study were to (i) use the method of PTt analysis to determine the effects of different sowing dates on maize yields and analyze the climatic resource distribution characteristics of the maize growing season during 2012–2017; (ii) quantify the relationship between yield and meteorological factors (sunshine duration, precipitation, daily minimum temperature (Tmin), daily minimum temperature (Tmax), and diurnal temperature (Td)) during the vegetative stage, vegetative and reproductive co-growth stage, and reproductive stage; and (iii) analyze the effects of meteorological factors during the critical period (vegetative and reproductive co-growth stage and reproductive stage, which are crucial stages to establish the kernel number and kernel weight). More specifically, the aim of this study was to verify the following hypotheses that the meteorological factors influence the kernel set and that the sowing dates of maize sole cropping system in NCP can be optimized further.

2. Materials and Methods

2.1. Site Description

Field experiments were conducted from 2012 to 2017 at the Wuqiao Experimental Station (37°41′ N, 116°37′ E) of China Agricultural University. This station is located in Wuqiao County, Hebei Province, and is representative of the agricultural production and climate conditions in the northern part of the North China Plain. In 2012–2017, the average annual growing degree-days (GDD) in this district was 2612 ± 68.2 °C and the average annual precipitation from April to November was 542 ± 100.6 mm. However, 75% of precipitation was concentrated in June to August (source from the Chinese Meteorological Administration), meanwhile, the highest temperatures also occurred during this period (Figure 1). The soil type is silty loam (The International Union of Soil Sciences (IUSS) Working Group WRB, 2006). The plow layer was about 0.2 m thick, contained 4.25 g kg−1 of organic matter, 0.54 g kg−1 of total nitrogen, 8.9 mg kg−1 of available phosphate, and 98.6 mg kg−1 of available potassium, and had a pH of 8.2. The soil profile properties contained 1.44 g cm−3 of bulk density and 0.31 g cm−3 of field capacity.

2.2. Experimental Design

The high-yield maize variety Jinhai 5 was selected from previous experiments [5], and the GDD required for the maturity of Jinhai 5 was approximately 1850 °C. The sowing date and pre-thermal time (PTt), which were calculated by Equation (13) and Equation (14), were established as shown in Table 1. Treatments were arranged in a randomized complete block design with three replicates. The size of each plot was 7 × 9 m. The row spacing was 0.60 m, and the plant spacing was 0.25 m (approximately 67,000 plants ha–1). Plots were sowed by hand with three seeds per hill and thinned to the desired density at the V5 [28] growth stage. Irrigation was supplied to each plot as needed (the 0–20 cm soil water content was maintained above 60% of the maximum field moisture capacity), and the water content was measured using a portable three-prong WET Kit (Delta-T Devices Ltd., Cambridge, UK) every 10 days to avoid drought stress. The field was fertilized with 45 m3 ha−1 of organic fertilizer (composted swine manure applied before sowing; the moisture, N, P2O5, and K2O contents were 81.2%, 0.56%, 0.44%, and 0.47%, respectively) prior to planting. The chemical fertilizer which included 240 kg N ha−1 (base fertilizer:V7 topdressing:V12 topdressing: VT topdressing = 2:3:2:3), 360 kg P ha−1 (base fertilizer), and 240 kg K ha−1 (base fertilizer:V12 topdressing = 2:3) were applied in the field. Weeds, diseases, and pests were well-controlled throughout the experiment. The herbicides (Topramezone (Arietta, BASF, Germany)) was sprayed immediately after sowing, and the weeds were pulled out manually in the later stage. The pesticides (Imidacloprid (Admire, Bayer, Germany) and Avermectin (Belt, Bayer, Germany)) was applied at seedling stage and after anthesis.

2.3. Sampling and Measurements

At harvest (greater than 50% of the kernels in the central part of maize cobs presented with a black abscission at the base of the kernel), 30 plants in the two central rows were harvested, and ears with more than 30 kernels were considered representative of an effective ear. Grain yield, ear number, kernel per ear, and 1000-kernel weight were determined. Kernels were hand-threshed and counted in all effective ears of each plot to determine the number of kernel per ear. Two samples of 500 kernels from each plot were selected and dried in an oven at 80 °C until reaching a constant weight, and then, the water content and 1000-kernel weight were calculated. Kernel weight was calculated as the ratio of the final grain yield to the kernel per plot. Grain yield was adjusted to a 15.5% moisture content.
In 2014, 2015, and 2017, thirty plants were tagged in each plot which had similar growth conditions, and the cobs were bagged before silking. After silking, all of the tagged cobs were artificially pollinated. At 7 days after silking, two tagged plants were sampled per plot every 7~8 days until the kernels reached physiological maturity. The central kernels of the cobs were selected, stripped, and dried in an oven at 80 °C until constant weight. We analyzed the kernel dry weight dynamics using the Logistic equation [29,30] in Equation (1):
y = a 1 + b e c t
where y is the 1,000-kernel weight, a is the final 1,000-kernel weight, t is the days after flowering and b, c, and e are parameters set by the regression equation.
In the analysis, we calculated the following secondary parameters to describe the grain-filling characteristics, which included the turning point 1 (t1), turning point 2 (t2), fast-increasing period (Δt), weight of maximum grain-filling rate (Wmax), maximum grain-filling rate (Gmax), days of maximum grain-filling (Dmax), grain-filling duration (P) and average grain-filling rate (Gmean) as follows [29,30]:
t 1 = ln b 1.317 c
t 2 = ln b + 1.317 c
Δ t = t 2 t 1
W max = a 2
G max = ( c W max ) ( 1 W max a )
D max = ln b c
P = ln ( 99 b ) c
Gmean = a P
This article only used data of kernel number loss of 2017, because the kernel number loss had been discussed in a previously published paper [24] and the results were basically consistent with that of 2017. In 2017, ten days after silking, five tagged plants were sampled and brought to the lab to assess their floret numbers and pollination condition. The final kernel number per ear (FKN) was assessed by five tagged plants at harvest. The percent loss of kernel number due to floret abortion (Loss1), percent loss of kernel number due to pollination failure (Loss2), and percent loss of kernel number due to kernel abortion (Loss3) were calculated as follows:
Loss 1 = FAN FN
Loss 2 = UFN FN FAN
Loss 3 = PFN     FKN PFN
where FAN is floret abortion number, FN is floret number, UFN is unfertilized floret number, and PFN is pollination floret number.
Weather data (maximum temperature, mean temperature, minimum temperature, sunshine duration, solar radiation, and precipitation) from 1990 to 2017 were collected from the Agro-Meteorological Experimental Stations (AESs) of the Chinese Meteorological Administration in Wuqiao. The calculation of PTt was based on the calculation of GDD by the canonical form [27]:
PTt = i = N 1 N 2 Δ T i
where N1 is 1 January, N2 is the sowing date, and ΔTi is the daily thermal time. ΔTi is calculated as follows:
Δ Ti = { 0 ° C   if   Tmax   +   Tmin 2 < 10 ° C 20 ° C   if   Tmax   +   Tmin 2 > 30 ° C Tmax   +   Tmin 2 10   if   10 ° C Tmax   +   Tmin 2 30 ° C

2.4. Statistical Analysisc

The period from emergence to maturity of maize was divided into two stages for analysis: the critical period from twelfth leaf to blister (V12–R2) as vegetative and reproductive co-growth stage, which include from twelfth leaf to silking (V12–R1) as the developmental stage of ear and tassel, form silking to blister (R1–R2) as the pollination and the first stages of grain-filling, and the period from blister to physiological maturity (R2–R6) as reproductive stage [28,31,32].
The linear regression analysis between yield and sowing date (PTt) were assessed using SPSS 18.0 (SPSS Inc., Chicago, IL, USA). The linear regression analysis between meteorological characteristics and sowing date (PTt) were carried out. The correlations analysis between yield and meteorological factors were estimated using SPSS 18.0. Differences of the sources of loss in kernel numbers between treatments were evaluated with one-way ANOVA (p < 0.05) using SPSS 18.0 and means comparison by Fisher’s Least Significant Difference (LSD)-test to establish the significance of the differences among means. The curves of the kernel dry weight dynamics were fitted using CurveExpert 3.0 (Hyams Development). Figures were prepared using Sigmaplot 12.0 (Systat Software, Inc., San Jose, CA, USA).

3. Results

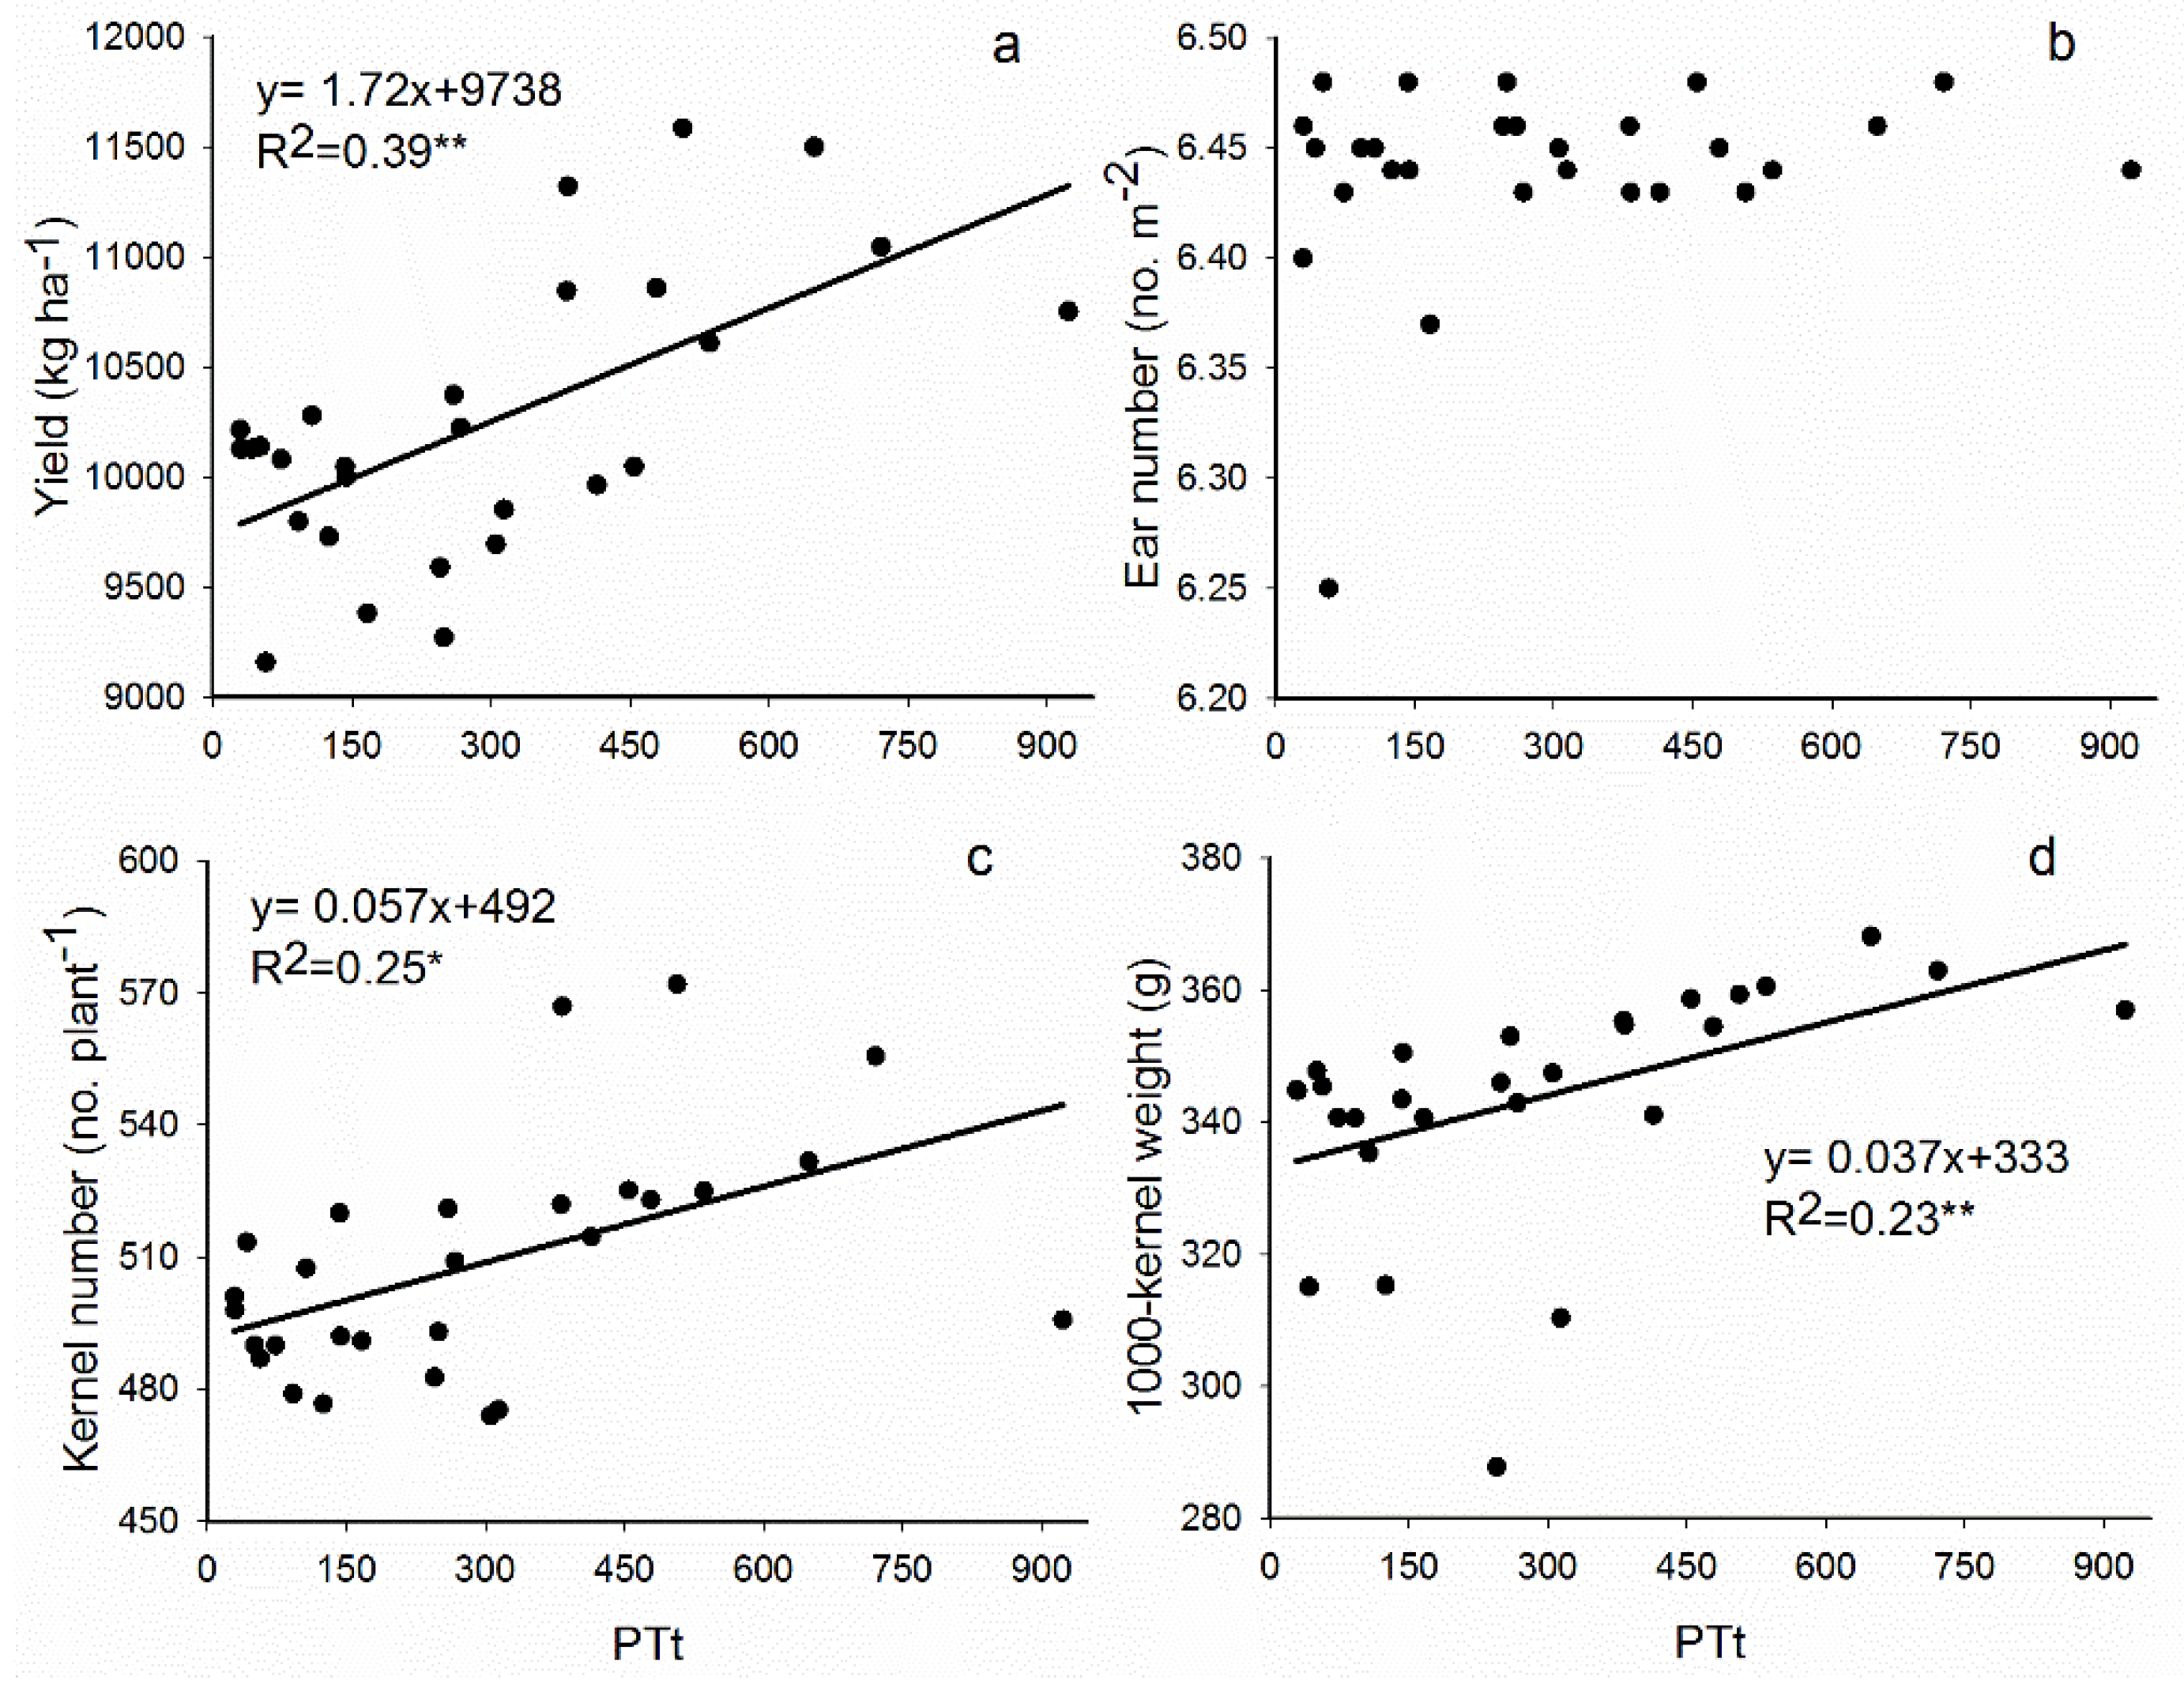
3.1. Variations in Maize and Yield Components of Maize at Different Sowing Dates

Maize yield was positively correlated with the pre-thermal time (PTt) (r = 0.62**) (Figure 2). The yield stabilized at greater than 10,500 kg ha−1 when the maize was sown above 479 °C. The trends of kernel number and 1000-kernel weight were basically consistent with yield, and kernel number and 1000-kernel weight were positively correlated with the PTt (r = 0.71** and r = 0.58*, respectively). No association was found between ear number and PTt, but ear number was basically stable at approximately 6.45 m−2.

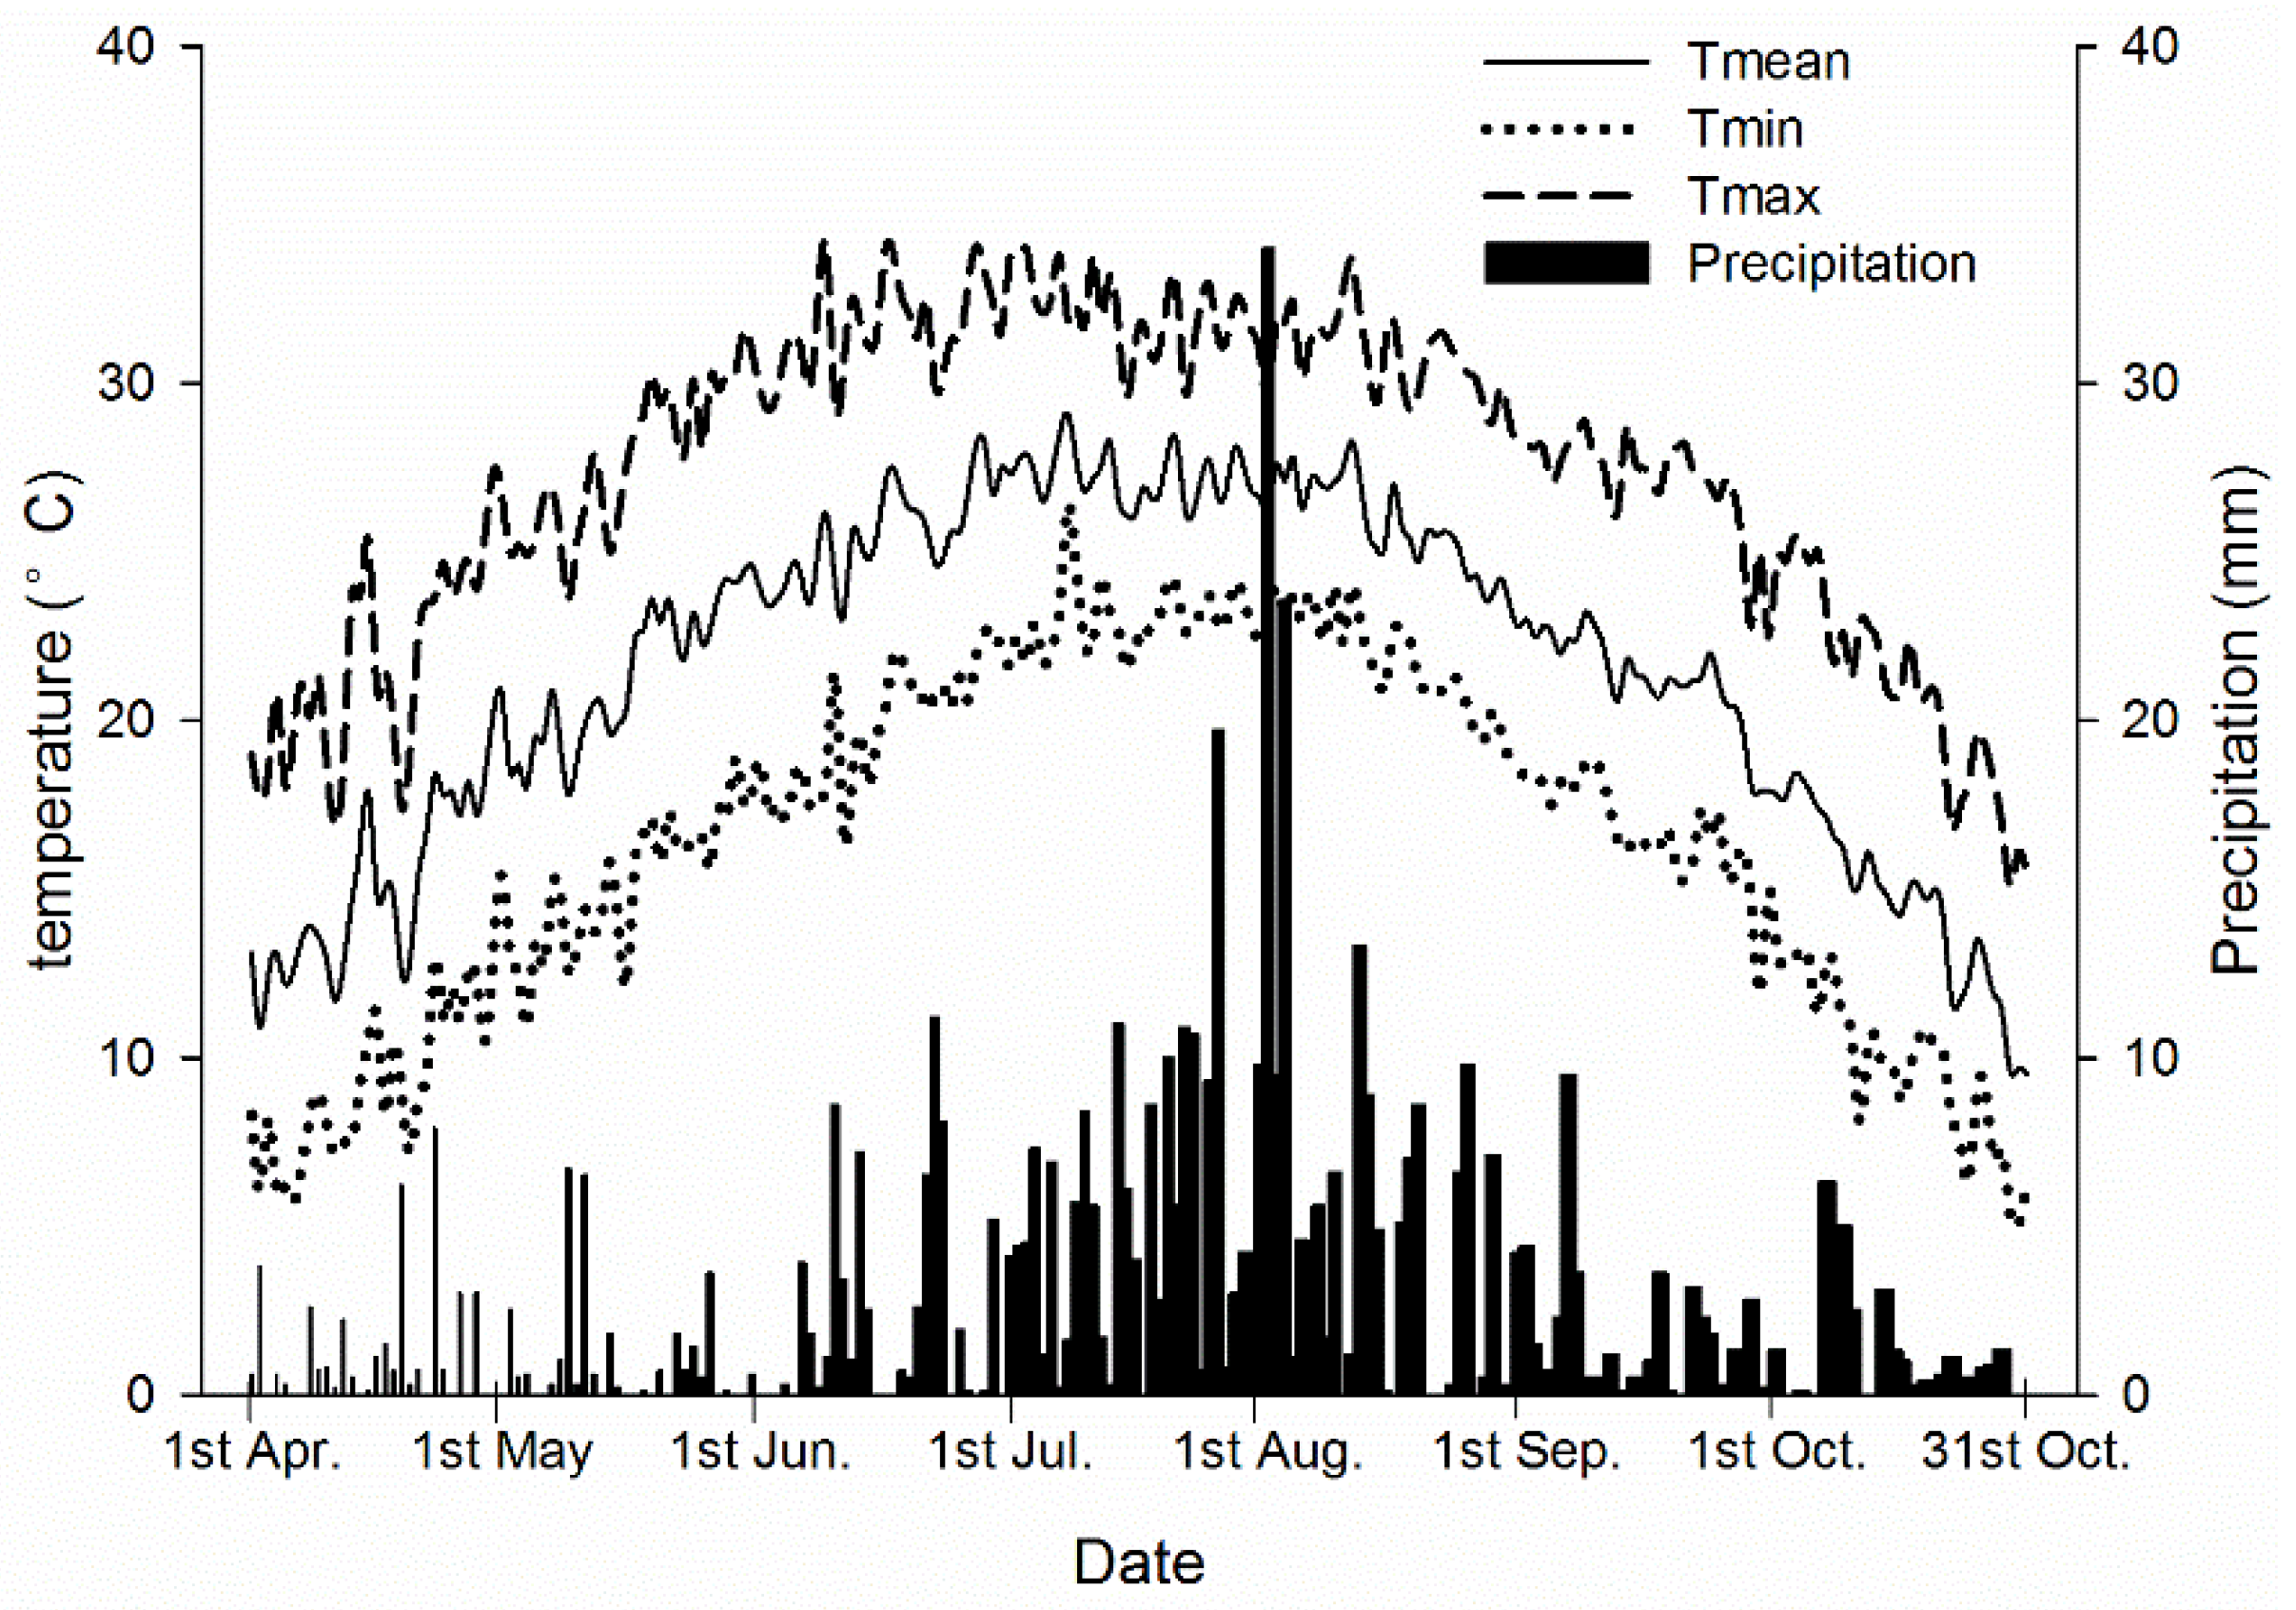
3.2. Meteorological Characteristics Analysis under Different Sowing Dates

The sunshine duration from emergence to silking (VE–R1) decreased (r = 0.87**) with the postponement of the sowing date and was not related to the sowing date from silking to maturity (R1–R6) (Figure 3). The precipitation of VE–R1 increased (r = 0.55**) with delaying planting, but decreased (r = 0.38*) during R1-R6. The daily mean temperature (Tmean) of VE–R1 increased (r = 0.91**) with later planting, but decreased (r = 0.86**) during R1–R6. The growth period of VE–R1 linearly decreased with the delay of sowing date, while the growth period of R1-R6 showed the opposite trend (r = 0.51**). From the regression equation, the Tmean of R1–R6 was less than 24.5 °C when maize was sown after PTt 479 °C, but the growth period was more than 60 days.
The cumulative stressful days (number of days with Tmax ≥33 °C) of VE–R1 increased (r = 0.65**) with the postponement of the sowing date, but it decreased (r = 0.74**) during R1–R6. The cumulative number of stressful days of R1–R6 was less than 10 days when maize was sown after PTt 479 °C. The cumulative number of low sunshine days (number of days with sunshine duration <4 h) of VE–R1 increased (r = 0.54**), and no relationship was found between cumulative low sunshine days and sowing date during R1–R6.

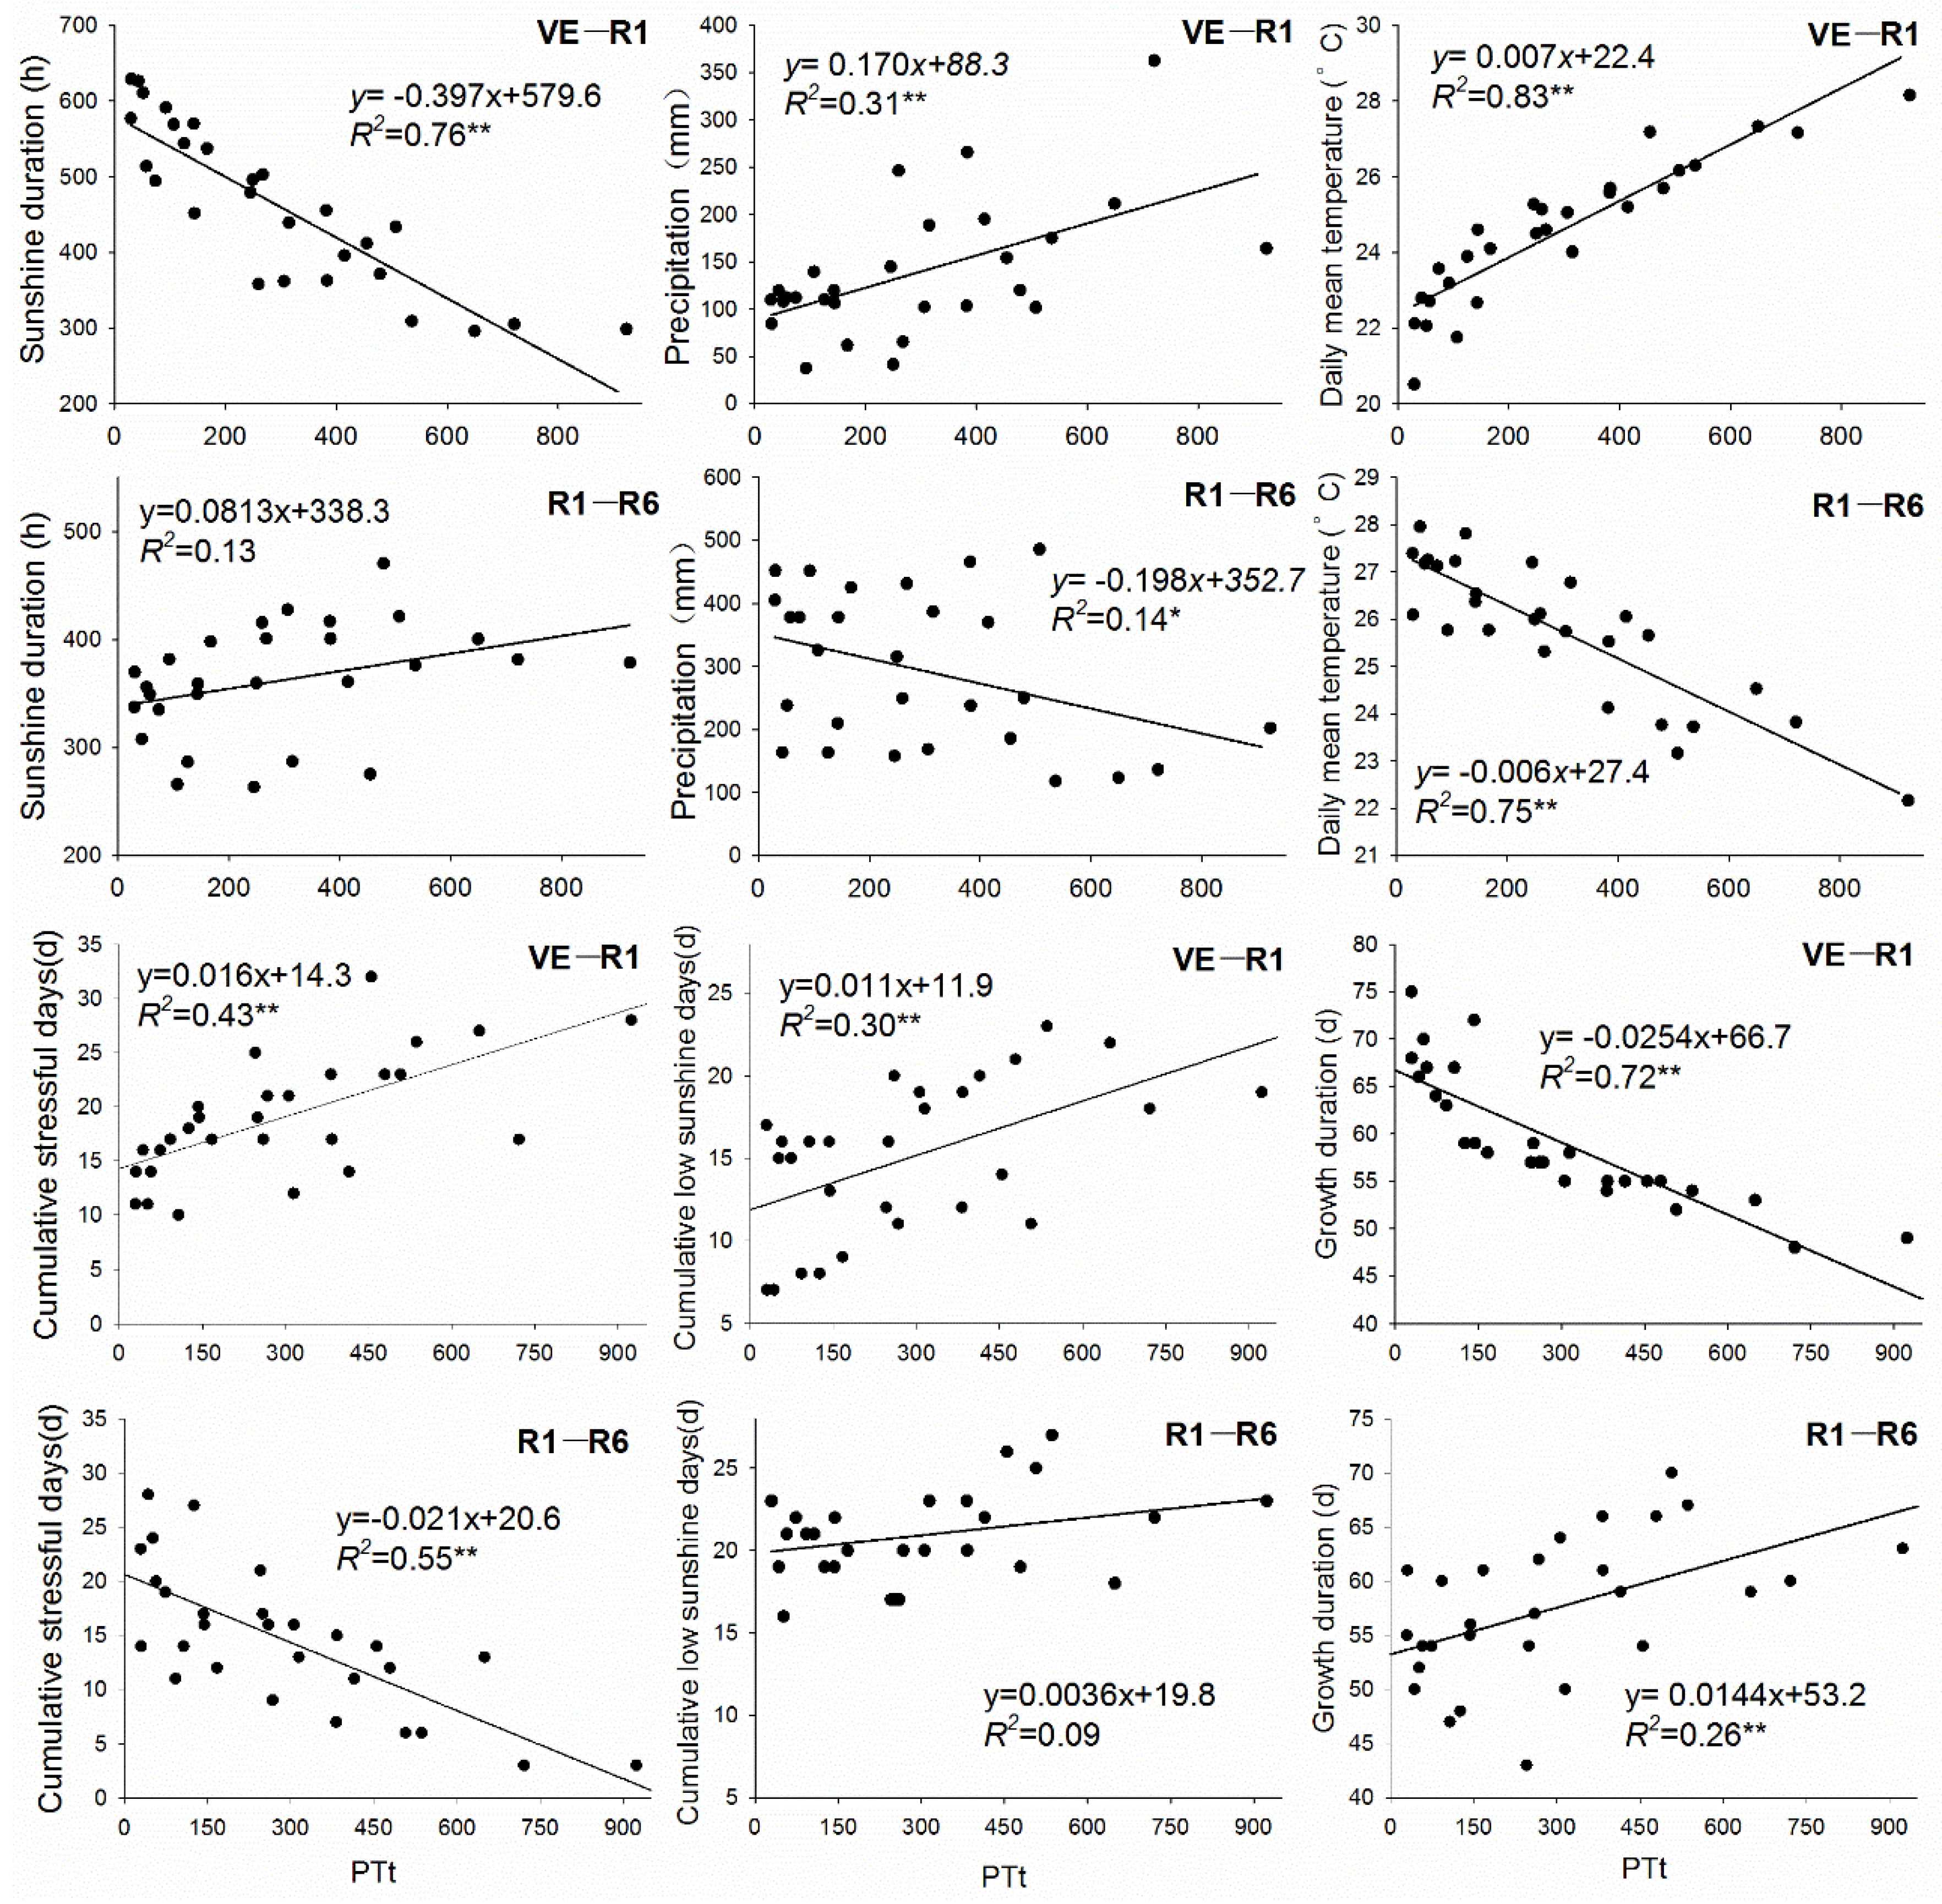
3.3. Correlation Analysis of Meteorological Factors and Yield in Different Growth Periods

To analyze the relationship between meteorological factors and yield, we divided the growth period associated with the formation of kernel number and weight into two major stages: the vegetative and reproductive co-growth stage (V12–R2) and reproductive stage (R2–R6) (Table 2). The cumulative precipitation of V12–R2 was negatively correlated with yield and kernel number. The Tmax and Td of V12–R2 were negatively correlated with yield, kernel number, and 1,000-kernel weight. During R2–R6, Tmax and Tmin were negatively correlated with yield, kernel number and 1000-kernel weight. According to the correlation coefficient, the temperature factors that affected the yield, kernel number, and kernel weight of maize were ranked as follows: Tmin > Tmax. Td was positively correlated with yield, kernel number, and 1000-kernel weight.

3.4. Influence of Different Meteorological Factors on Kernel Number and Weight Formation

In 2014, 2015, and 2017, to explain more clearly the effect of the maize plant morphology on the kernel set in different meteorological factors, we divided the V12–R6 into three stages: the developmental stage of the ear and tassel (from twelfth leaf to silking (V12–R1)), pollination and first grain-filling stage (from silking to blister (R1–R2)) and effective grain-filling stage (from blister to physiological maturity (R2–R6)).

3.4.1. Growing Conditions during Bracketing Flowering and the Grain-Filling Stage

The changes of cumulative Tmax, Tmin, Td, sunshine duration and precipitation during V12–R6 of different years in different sowing dates were investigated in this study (Table 3). During V12–R1, the Tmax of SD4 were the highest in 2014 and 2017 (34.0 °C and 34.6 °C for 2014 and 2017, respectively), and the Tmin of SD4 were also the largest. The Tmax of all of the treatments were less than 33 °C in 2015. In 2017, the Tmax was the least (29.4 °C) and the cumulative sunshine duration was only 29.1 h, which may be influenced by the most cumulative precipitation of SD5. During R1–R2, the Tmax and Tmin of SD3 were the highest in 2014. The Tmax of all the treatments were less than 33 °C in 2015. In 2017, both SD2 and SD3 had higher Tmax than other treatment (35.4 °C and 35.0 °C for SD2 and SD3, respectively). The Tmax of SD4 was the lowest (only 29.6 °C), which affected by the minimum cumulative sunshine duration (only 36.4 h) in 2017. During R2–R6, the Tmax and Tmin decreased gradually with the delay of sowing date and less than 33 °C in all the years. The cumulative sunshine duration increased with the delay of sowing date in 2015 and 2017.
The Td gradually decreased as the sowing date delayed during the period of V12–R1 and R1–R2 in all of the years, but it increased by degrees in R2–R6. The changes of Td, which related to changes of Tmax and Tmin, were also considered in this study. During V12–R1, Tmax and Tmin of SD3 were reduced by 1.3 °C and 2.0 °C compared with SD4 in 2014, respectively. In 2015, Tmax of SD3 was raised by 0.5 °C compare with SD4, but Tmin was reduced by 1.9 °C. In 2017, Tmax and Tmin of SD3 were reduced by 1.9 °C and 2.8 °C compared with SD4, respectively. It was indicated that the high Td of early-sown dates in V12–R1 was caused by the low Tmin. Likewise, the high Td of early-sown dates in R1–R2 was caused by the high Tmax, and the low Td of early-sown dates in R2–R6 was caused by the high Tmin.

3.4.2. Formation of the Kernel Number

As the sowing date was postponed, the floret number (FN) first increased and then decreased, and the number of florets in SD2 and SD3 were higher than other treatments in 2017 (p < 0.05) (Table 4). The sum of floret abortion number (FAN) and unfertilized floret number (UFN) of early-sown dates (SD1, SD2, and SD3) were higher than late-sown dates (SD4, SD5, and SD6). The final kernel number (FKN) in SD4 and SD5 were higher than SD2 and SD3. The percent loss of kernel number due to floret abortion (Loss 1) in SD5 was higher than other treatments (p < 0.05), and that in other sowing dates was small and had no distinction. The percent loss of kernel number due to pollination failure (Loss 2) of different sowing dates gradually decreased with the postponed sowing date. Loss 2 of SD1 and SD2 were higher than other treatments (p < 0.05). The percent loss of kernel number due to kernel abortion (Loss 3) first increased, then decreased and finally increased. Loss 3 of SD3 was higher than other treatments (p < 0.05) and up to 38.7%. The total loss rates (Loss 1 + Loss 2 + Loss 3) of the three abortion pathways in SD2 and SD3 were 48.5% and 50.6%, respectively. Within the three pathways of abortion scenarios, Loss 3 was greatest.

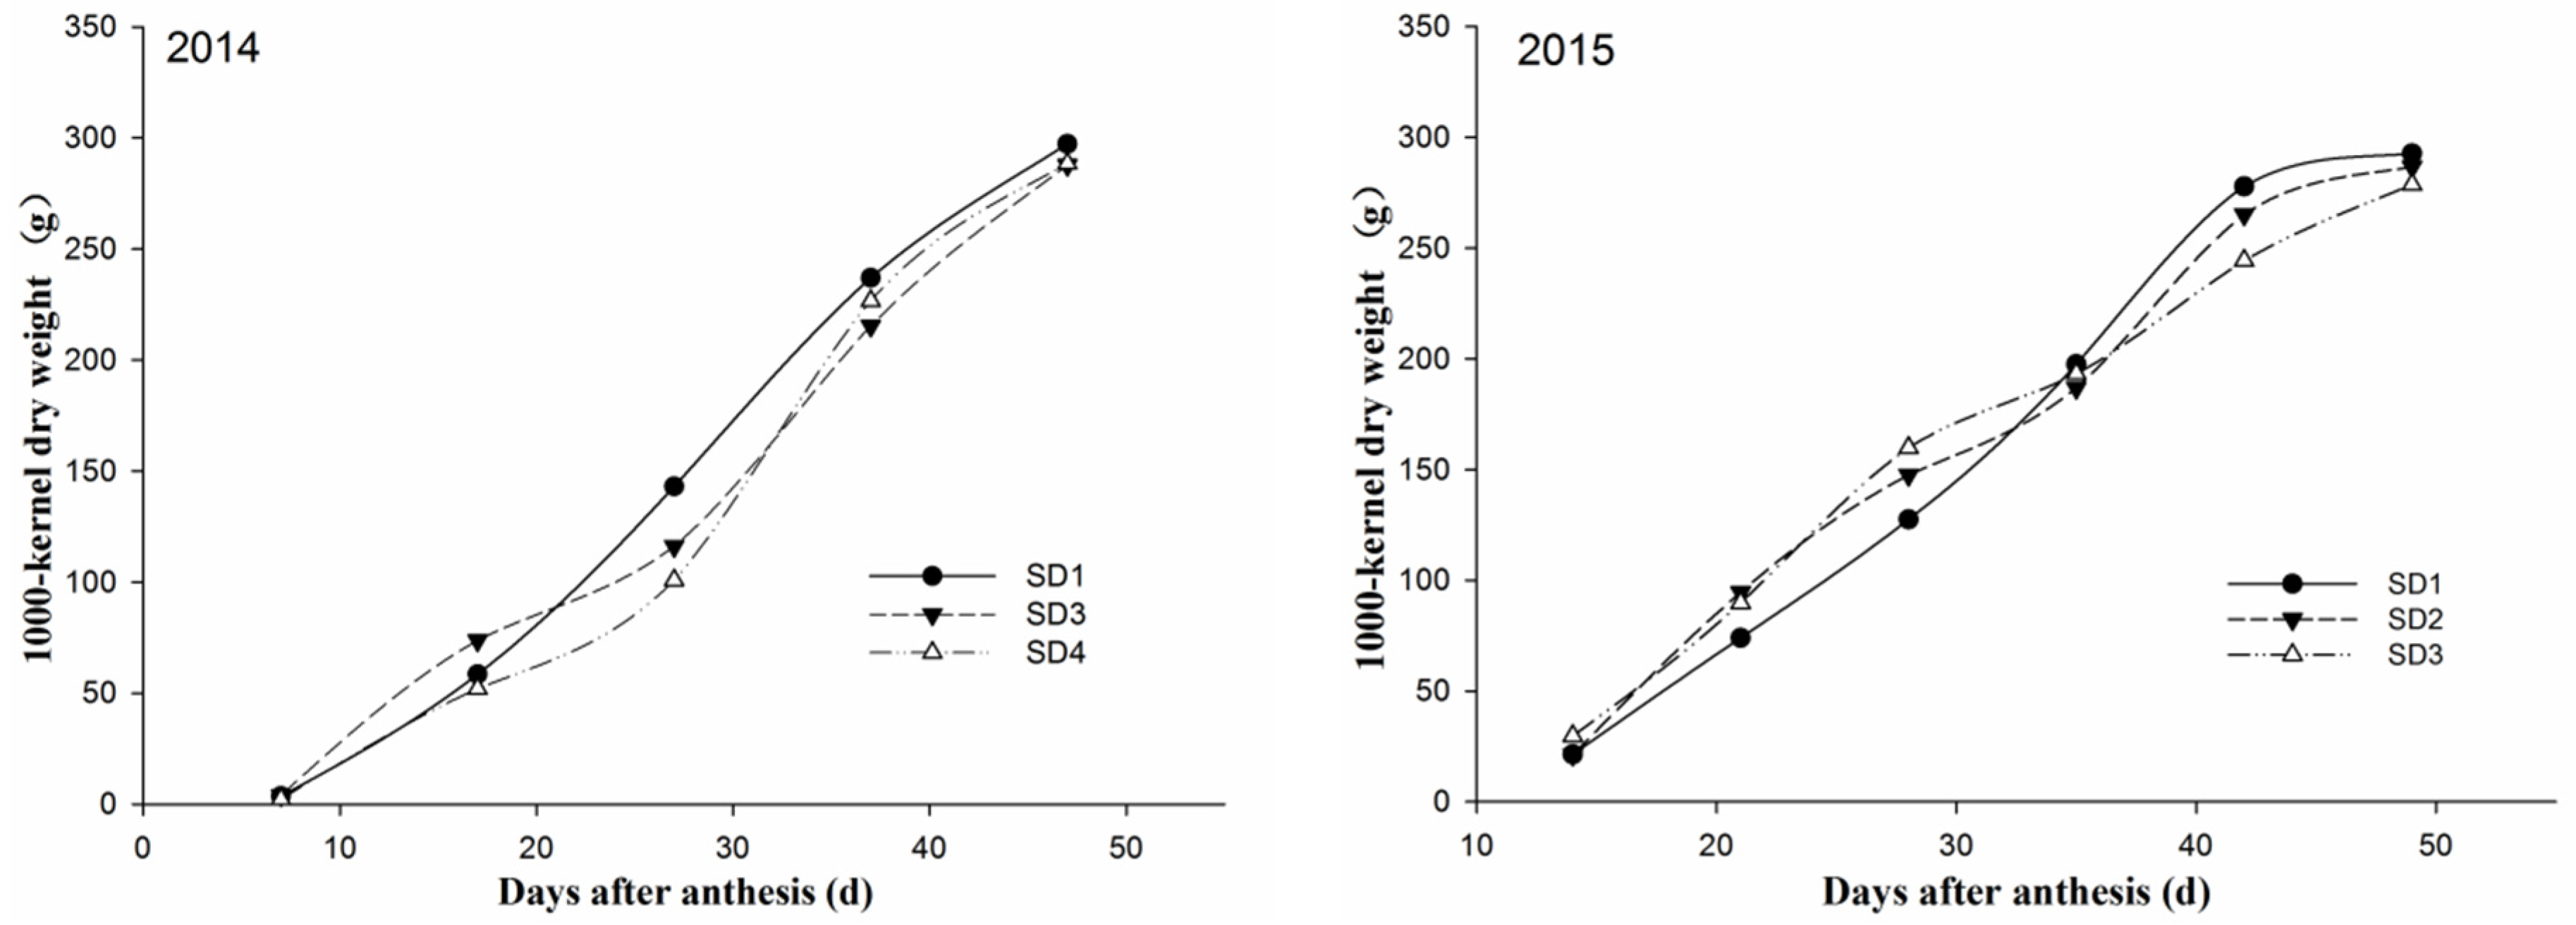
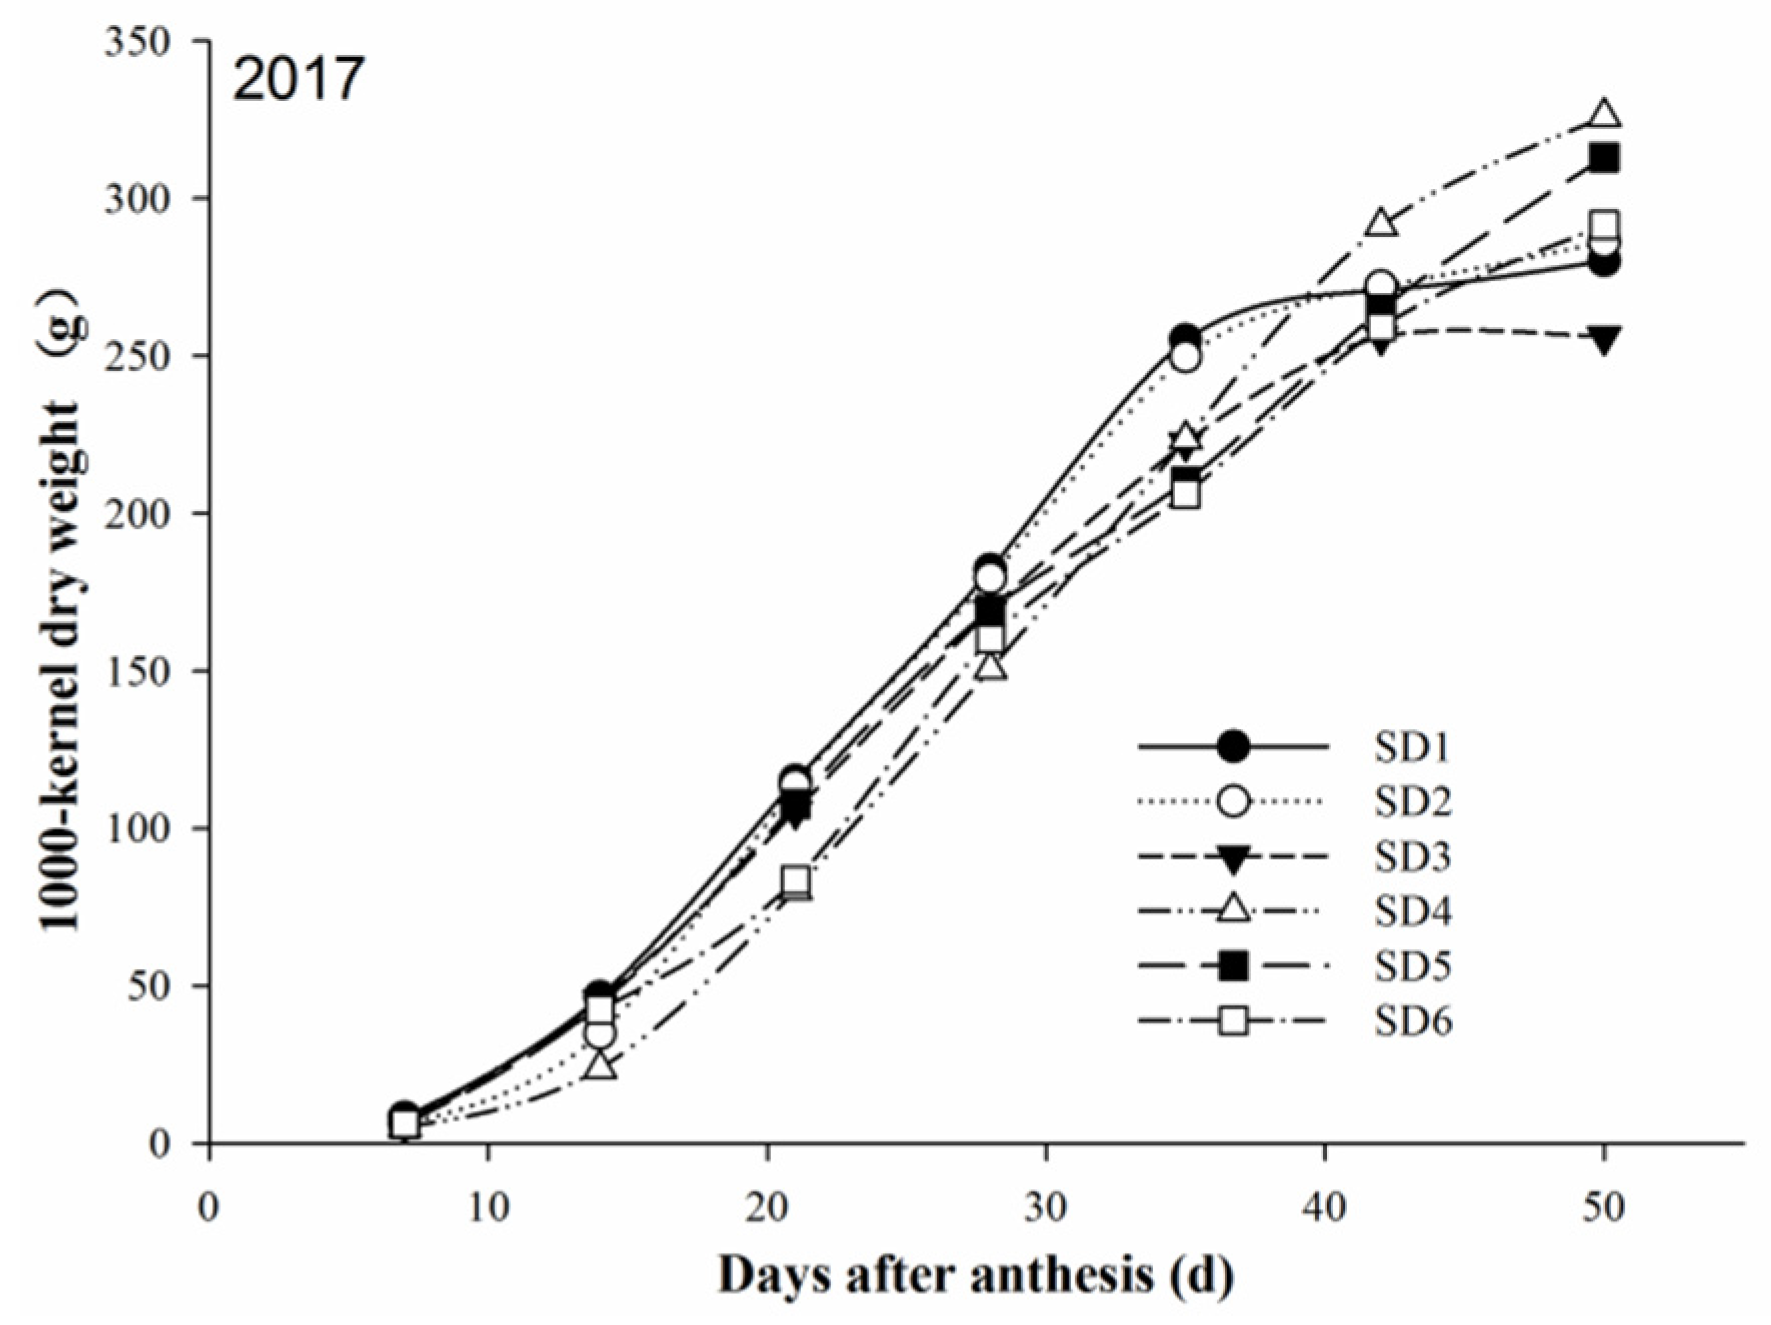
3.4.3. Formation of Kernel Weight

The change trend of the dry weight of 1000 kernels of maize in filling periods at different sowing dates was consistent with the Logistic mode (Figure 4), and r2 of the logistic equation was between 0.985 and 0.998, indicating an acceptable fitting degree (Table 5).
Most of the grain-filling parameters of late-sown dates (SD4, SD5, and SD6) were better than those in early-sown dates (SD1, SD2, and SD3) in all years (Table 5). More specifically, turning point 1 (t1), turning point 2 (t2), the fast-increasing period (Δt), the average grain-filling rate (Gmean), the weight of maximum grain-filling rate (Wmax), the days of maximum grain-filling (Dmax) and the grain-filling duration (P) of SD3 were usually the smallest in all years. Comparing the result of SD3 and that of SD4, we found that: The Δt of SD3 was less than that of SD4 (2.0 and 1.3 d in 2015 and 2017, respectively); The Gmean of SD3 was less than that of SD4 (0.08 and 1.42 mg kernel−1·d−1 in 2014 and 2017, respectively); The Wmax of SD3 was less than that of SD4 (5, 12 and 33 mg kernel−1 in 2014, 2015 and 2017, respectively); The P of SD3 was less than that of SD4 (0.9, 6.0 and 7.5 d in 2014, 2015 and 2017, respectively).

4. Discussion

4.1. Optimum Sowing Date

Without nutrient limitations, maize growth and development in the field are mainly influenced by temperature, radiation, photoperiod, and precipitation [33]. Under the influence of these factors, maize yield in this paper showed the trend of linear correlation (Figure 2). Among these factors, temperature has the greatest influence on development of modern maize varieties, as it determines the rate and duration of developmental phases [34]. Our results also showed that the daily mean temperatures (Tmean) from emergence to silking (VE–R1) and from silking to maturity (R1–R6) were correlated (r = 0.91**; r = −0.86**) with the sowing date, and these relationships were more significant than sunshine duration and precipitation (Figure 3). The Tmean and the cumulative stressful days of R1–R6 decreased with the postponement of the sowing date (r2 = 0.74**; r2 = 0.55**), which should be suitable for kernel growth. Due to the temperature reduction, the growth duration after silking increases with the postponement of the sowing date, which is more favorable for grain filling [35].
Maize was sown after a pre-thermal time (PTt) of 479 °C, the yield was steadily maintained at a high level (>10,500 kg ha−1). The average annual growing degree-days (GDD) in this district was 2612 °C during the six experimental years, and the GDD required for maturity of the Jinhai 5 variety used in this study was approximately 1850 °C. Therefore, it seems that maize should be sown before PTt 750 °C (the annual GDD minus the GDD required for Jinhai 5) to satisfy the GDD required for maturity. Since 75% of precipitation was concentrated from June to August (Figure 1), the precipitation of VE–R1 increased but then decreased during R1–R6 (Figure 3). Therefore, it is important for the maize mono-cropping system to make optimal use of natural precipitation in this stage. In this case, we can select an optimum sowing date when PTt is between 480 °C and 750 °C and when soil moisture is better, which can save groundwater and provide a more suitable environment (i.e., temperature, precipitation, growth duration) for maize reproductive growth.

4.2. Meteorological Factors Influence the Kernel Set

The vegetative and reproductive co-growth stage and reproductive stage are the key periods for kernel number and weight formation [28,31,32]. As global warming increases, temperature limits the growth and development of kernels, which is the main factor of maize yield reduction [36,37]. Results from six years showed that daily maximum temperature (Tmax) and daily minimum temperature (Tmin) from the twelfth leaf to blister (V12–R2) and from blister to physiological maturity (R2–R6) were negatively correlated with yield, kernel number and 1000-kernel weight (Table 2). Frequently, heat stress and drought stress simultaneously occur in the field [10,12,38,39]. To separate the interaction effect of drought stress on high temperature stress, our experiment provides sufficient irrigation supplementation to ensure that drought stress does not occur. As a result, precipitation was negatively correlated with yield and kernel number only during V12–R2. It is likely as rainfall increases that the sunshine duration and temperature will change, which will affect the development of reproductive organs and the process of pollination [40].

4.2.1. Meteorological Factors Influence the Kernel Weight Formation

The relationship between grain filling and meteorological factors have been discussed in 2014, 2015, and 2017. Three years of results showed that the higher Tmax and diurnal temperature (Td) of from silking to blister (R1–R2) in early-sown dates (SD1, SD2, and SD3) accelerated the time when the grain filling reached turning point 1 (t1) compared with late-sown dates (SD4, SD5, and SD6). The kernel assimilate availability per kernel during the first stages of grain filling was enhanced by high temperature stress and large Td, so the dry matter of kernel accumulated faster [31]. Thus, kernel entered the effective grain-filling period earlier. In addition, the high Td of early-sown dates in R1–R2 was caused by a high Tmax compare with late-sown dates (Table 3). Previous studies have shown that heat stress during the first stages of grain filling reduces the assimilate availability of the effective grain-filling period, which causes an earlier cessation of grain filling [31,32,41]. Therefore, the turning point 2 (t2) of early-sowed dates appeared earlier in our experiments, and then fast-increasing period (Δt) and grain-filling duration (P) were shortened. Most of the grain-filling parameters of SD3 were generally the smallest in all years (Table 5), which may be affected by the Tmax of this sensitive stage (R1–R2). In addition, the t1 of SD4 occurred at the latest point in 2017, because the combined effects of low sunshine, low Tmax, and low Td in R1–R2, which are caused by a great deal of rainfall (Table 2 and Table 4). It does not commonly occur with three years meteorological data.
Except for SD1, the Tmax values of R2–R6 were generally all less than 32 °C in 2017. That is, Tmax has a minimal influence on the effective grain-filling period, so the Td of R2–R6 maybe became the main influencing factor for grain filling. In addition, the Wmax of early-sown maize certainly decreased by the narrow Td of R2–R6 in all years. The Td values of early-sown dates of R2–R6 were minimized by increased Tmin compare with late-sown maize (Table 3). As the climate became warmer, Td was mainly driven by the rapid increase in the high night temperature [1,20,42]. Chen et al. (2017) [43] found that the nighttime temperature increase caused significant increments in grain yields for late rice, but this warming significantly reduced grain yields for early rice, consistent with our results in maize. It was hypothesized that this effect was because high night temperatures increase the respiratory assimilation demand at a given supplying level and the leaf blades and 1000-grain weight are inhibited, resulting in significant decreases in crop biomass production and grain yield [19,42,44]. To conclude, kernel weight of early-sown maize was primarily limited by the high Tmax of R1–R2 and high Tmin of R2–R6.

4.2.2. Meteorological Factors Influence the Kernel Number Formation

The relationship between kernel number and meteorological factors have also been discussed in 2017. High temperature stress influences meiosis, growth of the ovaries during the pre-anthesis period, production and transfer of pollen during anthesis, and flowering dynamics, all of which reduce the kernel number [32,37,38,45]. Compared with other sowing dates, the total floret numbers in SD2 and SD3 were increased, which benefited from the optimum temperature of V12–R1 (Table 4 and Table 5). Low light conditions before anthesis also reduce grain number in wheat [40]. Although SD5 has a finely optimum temperature of V12–R1, the sunshine duration was the least and Td was the smallest, which potentially led to the highest floret abortion (Loss 1).
The pollination failure rates (Loss 2) of early-sown dates (SD1, SD2, and SD3) were higher than those of late-sown dates (SD4, SD5, and SD6), and this change trend of Loss 2 was basically consistent with the Td of R1–R2. On the one hand, the high Tmax not only reduced the number of exposed silks but also increased abortion of fertilized ovaries [24,45,46]. On the other hand, the plant growth rate accelerated with the large Td. Thus, silking duration may be shortened by a large Td, which leads to an insufficient pollination time.
The formation kernel number and kernel weight interact with each other [35]. Since the grain filling of the middle part of the maize ear was restrained by the high Tmax of R1–R2 and high Tmin of R2–R6 under SD3 (Table 5), the grain filling of the apical kernel was also deficient. Kernel abortion (Loss 3) mainly occurs at the apical kernel of the maize ear [24]. Thus, kernel abortion under SD3 was the largest. Previous studies attributed the final reduction in grain number to kernel abortion but not the failure of pollination [45,47]. Our research also found that among the three pathways of the abortion scenarios (Loss 1, Loss 2, and Loss 3), kernel abortion (Loss 3) accounted for the most crucial proportion (Table 4).
In summary, both kernel number and kernel weight of early sown maize were mainly restricted by the high Tmax of R1-R2 and high Tmin of R2-R6. The high temperature also occurred during June to August in this region (Figure 1). Regulating the maize sowing date can avoid the high temperature in sensitive periods of the kernel set. Yet, avoidance measures may be limited regarding the ability to achieve the maximum yield. Furthermore, avoidance measures will not protect the crop when unexpected and frequent abiotic stress events occur in the future [48]. In this case, a tolerance measure achieved by breeding is required to protect plant reproductive development under all abiotic stress conditions [10]. We believe that future studies should concentrate on breeding varieties that are tolerant of a high Tmax at pollination and the first grain-filling stage and a high Tmin in the grain-filling stage to obtain the maximum final grain yield, as well as to adapt to extreme climate environments.

5. Conclusions

For early-sown dates, the effective grain-filling duration was shortened by a high daily maximum temperature (Tmax) form silking to blister (R1–R2). The kernel weight of the mean grain-filling rate was reduced by a high daily minimum temperature (Tmin) from blister to physiological maturity (R2–R6). As a result, kernel weight was reduced. Similarly, grain-filling of apical kernels was restrained, which led to an increase of kernel abortion. The pollination failure increased due to the high Tmax of R1–R2. Both pollination failure and kernel abortion could reduce the final kernel number. Consequently, when the annual growing degree-days are much larger than the growing degree-days needed for the maturity of maize in the North China Plain, the sowing date of the mono-maize cropping system should be appropriately delayed. Maize can effectively avoid the negative effects on kernel number and weight formation, due to the high Tmax of R1–R2 and high Tmin of R2–R6 when sown at a PTt of 480 °C~750 °C in NCP.

Author Contributions

Conceptualization, X.Z., Y.C., and P.S.; methodology, X.Z. and P.Y.; investigation, X.Z., J.C., P.Y., and B.W.; data curation, X.Z.; formal analysis, X.Z.; visualization, X.Z.; writing—original draft preparation, X.Z. and J.C.; writing—editing, B.W., P.Y., H.D., Y.C., and P.S.; supervision, Y.C. and P.S.; project administration, P.S.; funding acquisition, P.S.

Funding

This research was financially supported by the National Natural Science Foundation of China (31571601), and by the National Key R&D Program of China (2016YFD0300203).

Acknowledgments

This work is grateful to all the staff of the Wuqiao Experimental Station of China Agricultural University for their help in obtaining the data. In addition, the author is also greatly appreciative of Zhiqiang Tao from Chinese Academy of Agricultural Sciences and Yawen Shen from Peking University for improving the manuscript.

Conflicts of Interest

The authors declare no conflict of interest.

References

  1. Food and Agriculture Organization of the United Nations. FAO Statistical Pocketbook 2015: World Food and Agriculture; Food and Agriculture Organization of the United Nations: Rome, Italy, 2015; p. 38. [Google Scholar]
  2. Yuan, Z.J.; Shen, Y.J. Estimation of agricultural water consumption from meteorological and yield data: A case study of Hebei, North China. PLoS ONE 2013, 8, e58685. [Google Scholar] [CrossRef]
  3. Zhang, Y.P.; Zhang, Y.H.; Wang, Z.M.; Wang, Z.J. Characteristics of canopy structure and contributions of non-leaf organs to yield in winter wheat under different irrigated conditions. Field Crop Res. 2011, 123, 187–195. [Google Scholar] [CrossRef]
  4. Wang, X.; Li, X.B.; Xin, L.J. Impact of the shrinking winter wheat sown area on agricultural water consumption in the Hebei Plain. J. Geogr. Sci. 2014, 24, 313–330. [Google Scholar] [CrossRef]
  5. Yan, P.; Tao, Z.Q.; Chen, Y.Q.; Zhang, X.P.; Sui, P. Spring maize kernel number and assimilate supply responses to high-temperature stress under field conditions. Agron. J. 2017, 109, 1433–1442. [Google Scholar] [CrossRef]
  6. Wang, X.; Li, X.B. Irrigation water availability and winter wheat abandonment in the North China Plain (NCP): Findings from a case study in Cangxian county of Hebei Province. Sustainability 2018, 10, 354. [Google Scholar] [CrossRef]
  7. Ren, B.Z.; Cui, H.Y.; Camberato, J.J.; Dong, S.T.; Liu, P.; Zhao, B.; Zhang, J.W. Effects of shading on the photosynthetic characteristics and mesophyll cell ultrastructure of summer maize. Sci. Nat. 2016, 103, 7–8. [Google Scholar] [CrossRef] [PubMed]
  8. Ren, B.Z.; Zhu, Y.L.; Zhang, J.W.; Dong, S.T.; Liu, P.; Zhao, B. Effects of spraying exogenous hormone 6-benzyladenine (6-BA) after waterlogging on grain yield and growth of summer maize. Field Crops Res. 2016, 188, 96–104. [Google Scholar] [CrossRef]
  9. Wu, W.M.; Wang, S.J.; Chen, H.J.; Song, Y.H.; Zhang, L.; Peng, C.; Jing, L.L.; Li, J.C. Optimal nitrogen regimes compensate for the impacts of seedlings subjected to waterlogging stress in summer maize. PLoS ONE 2018, 13, e0206210. [Google Scholar] [CrossRef]
  10. Lawasl, L.M.F.; Zuther, E.; Jagadish, S.V.K.; Hinchal, D.K. Molecular mechanisms of combined heat and drought stress resilience in cereals. Curr. Opin. Plant Biol. 2018, 45, 212–217. [Google Scholar] [CrossRef]
  11. Hawkins, E.; Fricker, T.E.; Challinor, A.J.; Ferro, C.A.T.; Ho, C.K.; Osborne, T.M. Increasing influence of heat stress on French maize yields from the 1960s to the 2030s. Glob. Change Biol. 2013, 19, 937–947. [Google Scholar] [CrossRef]
  12. Lobell, D.B.; Bänziger, M.; Magorokosho, C.; Vivek, B. Nonlinear heat effects on African maize as evidenced by historical yield trials. Nat. Clim. Change 2011, 1, 42–45. [Google Scholar] [CrossRef]
  13. Schlenker, W.; Roberts, M.J. Nonlinear temperature effects indicate severe damages to U.S. crop yields under climate change. Proc. Natl. Acad. Sci. USA 2009, 106, 15594–15598. [Google Scholar] [CrossRef] [Green Version]
  14. Fang, S.B.; Cammarano, D.; Zhou, G.S.; Tan, K.Y.; Ren, S.X. Effects of increased day and night temperature with supplemental infrared heating on winter wheat growth in North China. Eur. J. Agron. 2015, 64, 67–77. [Google Scholar] [CrossRef]
  15. Zhu, R.R.; Zheng, H.X.; Wang, E.L.; Jakeman, A.J. A hybrid process-based empirical approach to identify the association between wheat productivity and climate in the North China Plain during the past 50 years. Environ. Model. Softw. 2018, 108, 72–80. [Google Scholar] [CrossRef]
  16. Peng, S.B.; Huang, J.L.; Sheehy, J.E.; Laza, R.C.; Visperas, R.M.; Zhong, X.H.; Centeno, G.S.; Khush, G.S.; Cassman, K.G. Rice yields decline with higher night temperature from global warming. Proc. Natl. Acad. Sci. USA 2004, 101, 9971–9975. [Google Scholar] [CrossRef] [PubMed] [Green Version]
  17. Laza, M.R.C.; Sakai, H.; Cheng, W.G.; Tokida, T.; Peng, S.B.; Hasegawa, T. Differential response of rice plants to high night temperatures imposed at varying developmental phases. Agric. Forest Meteorol. 2015, 209–210, 69–77. [Google Scholar] [CrossRef]
  18. Xiong, D.L.; Ling, X.X.; Huang, J.L.; Peng, S.B. Meta-analysis and dose-response analysis of high temperature effects on rice yield and quality. Environ. Exp. Bot. 2017, 141, 1–9. [Google Scholar] [CrossRef]
  19. Loka, D.A.; Oosterhuis, D.M. Effect of high night temperatures on cotton respiration, ATP levels and carbohydrate content. Environ. Exp. Bot. 2010, 68, 258–263. [Google Scholar] [CrossRef]
  20. Sunoj, V.S.J.; Shroyer, K.J.; Jagadish, S.V.K.; Prasad, P.V.V. Diurnal temperature amplitude alters physiological and growth response of maize (Zea mays L.) during the vegetative stage. Environ. Exp. Bot. 2016, 130, 113–121. [Google Scholar] [CrossRef]
  21. Binder, J.; Graeff, S.; Link, J.; Claupein, W.; Liu, M.; Dai, M.H.; Wang, P. Model-based approach to quantify production potentials of summer maize and spring maize in the North China Plain. Agron. J. 2008, 100, 862–873. [Google Scholar] [CrossRef]
  22. Tao, Z.Q.; Chen, Y.Q.; Li, C.; Zou, J.X.; Yan, P.; Yuan, S.F.; Wu, X.; Sui, P. The causes and impacts for heat stress in spring maize during grain filling in the North China Plain—A review. J. Intergr. Agric. 2016, 15, 2677–2687. [Google Scholar] [CrossRef]
  23. Zhou, B.Y.; Yue, Y.; Sun, X.F.; Ding, Z.S.; Ma, W.; Zhao, M. Maize kernel weight responses to sowing date associated variation in weather conditions. Crop J. 2017, 5, 43–51. [Google Scholar] [CrossRef]
  24. Yan, P.; Chen, Y.Q.; Sui, P.; Vogel, A.; Zhang, X.P. Effect of maize plant morphology on the formation of apical kernels at different sowing dates and under different plant densities. Field Crops Res. 2018, 223, 83–92. [Google Scholar] [CrossRef]
  25. Zhang, Z.T.; Yang, X.G.; Gao, J.Q.; Wang, X.Y.; Bai, F.; Sun, S.; Liu, Z.J.; Ming, B.; Xie, R.Z.; Wang, K.R.; et al. Analysis of suitable sowing date for summer maize in North China Plain under climate change. Sci. Agric. Sin. 2018, 51, 3258–3274. (In Chinese) [Google Scholar]
  26. Arnold, S.M.; Monteith, J.L. Plant development and mean temperature in a Teesdale habitat. J. Ecol. 1974, 62, 711–720. [Google Scholar] [CrossRef]
  27. McMaster, G.S.; Wilhelm, W.W. Growing degree-days: One equation, two interpretations. Agric. Forest Meteorol. 1997, 87, 291–300. [Google Scholar] [CrossRef]
  28. Ritchie, J.T.; Singh, U.; Godwin, D.C.; Bowen, W.T. Cereal growth, development and yield. In Understanding Options for Agricultural Production; Springer: Berlin, Germany, 1998; pp. 79–98. [Google Scholar]
  29. Richards, F.J. A flexible growth function for empirical use. J. Exp. Bot. 1959, 10, 290–300. [Google Scholar] [CrossRef]
  30. Jiang, Q.; Du, Y.L.; Tian, X.Y.; Wang, Q.S.; Xiong, R.H.; Xu, G.C.; Yan, C.; Ding, Y.F. Effect of panicle nitrogen on grain-filling characteristics of high-yielding rice cultivars. Eur. J. Agron. 2016, 74, 185–192. [Google Scholar] [CrossRef]
  31. Rattalino Edreira, J.I.; Mayer, L.I.; Otegui, M.E. Heat stress in temperate and tropical maize hybrids: Kernel growth, water relations and assimilate availability for grain filling. Field Crops Res. 2014, 166, 162–172. [Google Scholar] [CrossRef]
  32. Ciancio, N.; Parco, M.; Incognito, S.J.P.; Maddonni, G.A. Kernel setting at the apical and sub-apical ear of older and newer Argentinean maize hybrids. Field Crops Res. 2016, 191, 101–110. [Google Scholar] [CrossRef]
  33. Tsimba, R.; Edmeades, G.O.; Millner, J.P.; Kemp, P.D. The effect of planting date on maize grain yields and yield components. Field Crops Res. 2013, 150, 135–144. [Google Scholar] [CrossRef]
  34. Tsimba, R.; Edmeades, G.O.; Millner, J.P.; Kemp, P.D. The effect of planting date on maize: Phenology, thermal time durations and growth rates in a cool temperate climate. Field Crops Res. 2013, 150, 145–155. [Google Scholar] [CrossRef]
  35. Bonelli, L.E.; Monzon, J.P.; Cerrudo, A.; Rizzalli, R.H.; Andrade, F.H. Maize grain yield components and source-sink relationship as affected by the delay in sowing date. Field Crops Res. 2016, 198, 215–225. [Google Scholar] [CrossRef]
  36. Piao, S.L.; Ciais, P.; Huang, Y.; Shen, Z.H.; Peng, S.S.; Li, J.S.; Zhou, L.P.; Liu, H.Y.; Ma, Y.C.; Ding, Y.H.; et al. The impacts of climate change on water resources and agriculture in China. Nature 2010, 467, 43–51. [Google Scholar] [CrossRef] [PubMed]
  37. Rezaei, E.E.; Webber, H.; Gaiser, T.; Naab, J.; Ewert, F. Heat stress in cereals: Mechanisms and modelling. Eur. J. Agron. 2015, 64, 98–113. [Google Scholar] [CrossRef]
  38. Barnabas, B.; Jager, K.; Feher, A. The effect of drought and heat stress on reproductive processes in cereals. Plant Cell Environ. 2008, 31, 11–38. [Google Scholar] [CrossRef]
  39. Duc, N.H.; Csintalan, Z.; Posta, K. Arbuscular mycorrhizal fungi mitigate negative effects of combined drought and heat stress on tomato plants. Plant Physiol. Biochem. 2018, 132, 297–307. [Google Scholar] [CrossRef]
  40. Fischer, R.A.; Stockman, Y.M. Kernel number per spike in wheat (Triticum aestivum L.): Responses to preanthesis shading. Aust. J. Plant Physiol. 1980, 7, 169–180. [Google Scholar] [CrossRef]
  41. Shi, P.H.; Zhu, Y.; Tang, L.; Chen, J.L.; Sun, T.; Cao, W.X.; Tian, Y.C. Differential effects of temperature and duration of heat stress during anthesis and grain filling stages in rice. Environ. Exp. Bot. 2016, 132, 28–41. [Google Scholar] [CrossRef]
  42. Peraudeau, S.; Lafarge, T.; Roques, S.; Quinones, C.O.; Clement-Vidal, A.; Ouwerkerk, P.B.F.; Van Rie, J.; Fabre, D.; Jagadish, K.S.V.; Dingkuhn, M. Effect of carbohydrates and night temperature on night respiration in rice. J. Exp. Bot. 2015, 66, 3931–3944. [Google Scholar] [CrossRef] [PubMed] [Green Version]
  43. Chen, J.; Chen, C.; Tian, Y.L.; Zhang, X.; Dong, W.J.; Zhang, B.; Zhang, J.; Zheng, C.Y.; Deng, A.X.; Song, Z.W.; et al. Differences in the impacts of nighttime warming on crop growth of rice-based cropping systems under field conditions. Eur. J. Agron. 2017, 82, 80–92. [Google Scholar] [CrossRef]
  44. Kanno, K.; Mae, T.; Makino, A. High night temperature stimulates photosynthesis, biomass production and growth during the vegetative stage of rice plants. Soil Sci. Plant Nutr. 2009, 55, 124–131. [Google Scholar] [CrossRef] [Green Version]
  45. Rattalino Edreira, J.I.; Budakli Carpici, E.; Sammarro, D.; Otegui, M.E. Heat stress effects around flowering on kernel set of temperate and tropical maize hybrids. Field Crops Res. 2011, 123, 62–73. [Google Scholar] [CrossRef]
  46. Otegui, M.E.; Andrade, F.H.; Suero, E.E. Growth, water use, and kernel abortion of maize subjected to drought at silking. Field Crops Res. 1995, 40, 87–94. [Google Scholar] [CrossRef]
  47. Carcova, J.; Otegui, M.E. Ear temperature and pollination timing effects on maize kernel set. Crop Sci. 2001, 41, 1809–1815. [Google Scholar] [CrossRef]
  48. Dolferus, R.; Ji, X.M.; Richards, R.A. Abiotic stress and control of grain number in cereals. Plant Sci. 2011, 181, 331–341. [Google Scholar] [CrossRef] [PubMed]
Figure 1. Average daily temperature and precipitation for the period 2012–2017. Note: Tmean: daily mean temperature; Tmin: daily minimum temperature; Tmax: daily maximum temperature.
Agronomy 09 00198 g001
Figure 2. Changes in yield( (a) and yield components b: ear number; c: kernel number; d: 1000-kernel weight) of maize sown at different pre-thermal times (PTt). *: p < 0.05; **: p < 0.01.
Agronomy 09 00198 g002
Figure 3. Changes of the cumulative sunshine duration, cumulative precipitation, daily mean temperature, cumulative stressful days (number of days with Tmax ≥ 33 °C), cumulative low sunshine days (number of days with sunshine duration < 4 h), and growth duration from both emergence to silking (VE–R1) and silking to physiological maturity (R1–R6) at different sowing dates of maize in 2012–2017. *: p < 0.05; **: p < 0.01
Agronomy 09 00198 g003
Figure 4. One-thousand-kernel dry weight dynamics of the middle kernels from maize planted in 2014, 2015, and 2017. The three sowing dates of 2014 are SD1 (9 Apr.), SD3 (5 May) and SD4 (25 May). The three sowing dates of 2015 are SD1 (5 Apr.), SD3 (5 May) and SD4 (27 May). The six sowing dates of 2017 are SD1 (6 Apr.), SD2 (21 Apr.), SD3 (5 May), SD4 (21 May), SD5 (4 Jun.) and SD6 (21 Jun.).
Agronomy 09 00198 g004aAgronomy 09 00198 g004b
Table 1. Sowing dates and pre-thermal time prior to sowing in experiment conducted in 2012–2017.
SDs201220132014201520162017
DatePTtDatePTtDatePTtDatePTtDatePTtDatePTt
SD15 Apr305 Apr299 Apr1425 Apr518 Apr1076 Apr42
SD215 Apr9215 Apr57NANANANANANA21 Apr125
25Apr16625Apr74NANANANANANANANA
SD35 May2675 May1445 May3065 May2495 May3145 May245
SD415 May38215 May260NANANANA17 May41421 May454
25 May50725 May38325 May53627 May479NANANANA
SD5NANANANANANANANANANA4 Jun649
NANANANANANANANA10 Jun721NANA
SD6NANANANANANANANANANA21 Jun923
Note: SDs: sowing date; PTt: the pre-thermal time ( PTt = i = N 1 N 2 Δ T i , where N1 is 1 January, N2 is the sowing date, and ΔTi is the daily thermal time); NA: Not Available.
Table 2. Correlation analysis between meteorological factors and yield, ear number, kernel number per ear, and 1000-kernel weight during V12–R2 and R2–R6 in 2012–2017.
Period SunshinePrecipitationTmaxTminTd
V12–R2Yield−0.34−0.45 *−0.49 **0.28−0.49 **
Ear number0.02−0.240.31−0.240.35
Kernel number−0.46 *−0.59 **−0.52 **0.36−0.56 **
1000-kernel weight−0.240.26−0.57 **0.14−0.44 *
R2–R6Yield0.50 **−0.30−0.60 **−0.66 **0.49 **
Ear number0.02−0.25−0.17−0.210.12
Kernel number0.55 **−0.32−0.44 *−0.54 **0.49 **
1000-kernel weight0.78 **−0.11−0.47 *−0.62 **0.63 **
Note: Sunshine: cumulative sunshine duration; Precipitation: cumulative precipitation; Tmax: daily maximum temperature; Tmin: daily minimum temperature; Td: diurnal temperature; V12–R2: from twelfth leaf to blister; R2–R6: from blister to physiological maturity; *: p < 0.05; **: p < 0.01.
Table 3. Meteorological data of maize during V12–R1, R1–R2 and R2–R6 in 2014, 2015, and 2017.
YearSDsV12–R1R1–R2R2–R6
Sunshinea
h
Tmaxb
°C
Tminb
°C
Tdb
°C
Precipitationa
mm
Sunshine
h
Tmax
°C
Tmin
°C
Td
°C
Precipitation
mm
Sunshine
h
Tmax
°C
Tmin
°C
Td
°C
Precipitation
mm
2014SD17231.020.4 10.6265732.8 22.3 10.59029331.5 21.6 9.9120
SD36232.7 21.5 11.24910934.0 23.2 10.88131830.3 20.6 9.788
SD410934.0 23.5 10.5819531.5 22.5 9.01428128.4 18.4 10.0105
2015SD19931.2 19.7 11.5910832.9 20.7 12.2924832.3 23.0 9.3230
SD39832.7 20.6 12.197932.3 22.5 9.87928131.1 21.6 9.5237
SD47932.2 22.5 9.77910332.2 23.8 8.415136728.6 18.3 10.399
2017SD19633.3 19.9 13.4789133.3 22.6 10.74221732.5 23.7 8.8122
SD210132.7 20.4 12.37211635.4 24.4 11.04217131.7 23.4 8.3122
SD38232.7 22.3 10.48312435.0 25.2 9.82414030.9 22.6 8.3134
SD412034.6 25.1 9.5653629.6 22.5 7.19823930.2 20.9 9.388
SD52929.4 22.6 6.88512733.3 23.4 9.93127429.1 18.7 10.493
SD610533.0 23.4 9.6376329.4 21.6 7.88831625.8 15.3 10.5115
Note: Sunshine: cumulative sunshine duration; Precipitation: cumulative precipitation; Tmax: daily maximum temperature; Tmin: daily minimum temperature; Td: diurnal temperature; V12–R1: from twelfth leaf to silking; R1–R2: form silking to blister; R2–R6: from blister to physiological maturity; SDs: sowing date (SD1 (6th Apr.), SD2 (21st Apr.), SD3 (5th May), SD4 (21st May), SD5 (4th Jun.), and SD6 (21st Jun.)); a: Cumulative data during the growth stage; b: Average data during the growth stage.
Table 4. Sources of loss in kernel numbers in 2017.
SDsFN
Per Ear
FAN
Per Ear
PFN
Per Ear
UFN
Per Ear
FKN
Per Ear
Loss 1
%
Loss 2
%
Loss 3
%
SD1771 ± 35.4b9.3 ± 0.6d649 ± 39.6b113 ± 17.0a514 ± 25.2abc1.2 ± 0.1d14.5 ± 3.1a20.6 ± 3.2c
SD2831 ± 44.1ab35.7 ± 2.5b666 ± 51.2b129 ± 10.6a477 ± 13.7d4.3 ± 0.4b15.6 ± 1.9a28.6 ± 4.3b
SD3894 ± 45.2a31.0 ± 5.2bc787 ± 21.5a76 ± 16.5b483 ± 16.6cd3.5 ± 0.3bc8.4 ± 1.5b38.7 ± 1.7a
SD4777 ± 54.7b26.0 ± 7.8bcd688 ± 60.4b63 ± 7.9b525 ± 13.1ab3.3 ± 1.7bc8.2 ± 1.6b29.7 ± 7.4b
SD5765 ± 65.0b73.0 ± 19.3a669 ± 61.8b23 ± 8.9c532 ± 10.4a9.7 ± 1.7a3.0 ± 0.9c20.6 ± 2.8c
SD6751 ± 49.9b15.7 ± 1.5cd703 ± 54.4ab32 ± 4.6c494 ± 19.0bcd2.1 ± 0.4cd4.3 ± 0.9c29.5 ± 4.3b
Note: SDs: sowing date (SD1 (6th Apr.), SD2 (21st Apr.), SD3 (5th May), SD4 (21st May), SD5 (4th Jun.), SD6 (21st Jun.)); FN: floret number; FAN: floret abortion number; PFN: pollination floret number; UFN: unfertilized floret number; FKN: final kernel number; Loss 1: percent loss of kernel number due to floret abortion; Loss 2: percent loss of kernel number due to pollination failure; Loss 3: percent loss of kernel number due to kernel abortion. Different letters within a column indicate significant differences at p < 0.05 according to Fisher’s Least Significant Difference (LSD).
Table 5. Grain-filling characteristics of the middle kernels from maize planted at six sowing dates in 2014, 2015, and 2017.
YearSDsLogistic Equationr2t1
d
t2
d
Δt
d
Gmean
mg kernel−1·d−1
Gmax
mg kernel−1·d−1
Wmax
mg kernel−1
Dmax
d
P
d
2014SD1y = 31.14/(1 + 48.85 × 10−0.132t)0.99619.539.520.04.8410.315629.564.3
SD3y = 30.74/(1 + 37.61 × 10−0.127t)0.98518.239.020.84.759.815428.664.8
SD4y = 31.70/(1 + 105.5 × 10−0.141t)0.98923.742.418.74.8311.215933.165.7
2015SD1y = 32.68/(1 + 67.39 × 100.133t)0.99621.741.519.84.9510.916331.666.0
SD3y = 29.85/(1 + 46.10 × 100.134t)0.98618.838.519.74.7410.014928.663.0
SD4y = 32.23/(1 + 44.75 × 100.122t)0.99220.442.121.74.679.816131.369.0
2017SD1y = 28.43/(1 + 59.07 × 10−0.172t)0.99716.131.515.45.7212.214223.850.6
SD2y = 28.79/(1 + 69.58 × 10−0.174t)0.99716.932.015.25.8412.514424.550.9
SD3y=26.86/(1 + 47.58 × 10−0.159t)0.99716.032.616.65.2310.713424.353.3
SD4y = 33.48/(1 + 78.41 × 10−0.147t)0.99820.738.617.96.6512.316729.660.8
SD5y = 31.34/(1 + 30.87 × 10−0.124t)0.98917.038.321.26.399.715727.764.7
SD6y = 29.18/(1 + 45.23 × 10−0.139t)0.99818.036.919.05.9510.114627.460.5
Note: SDs: sowing date; r2: the coefficient of the fitfulness of the equation; t1: turning point 1; t2: turning point 2; Δt: fast-increasing period; Gmean: mean filling rate; Gmax: maximum grain-filling rate; Wmax: weight of maximum grain-filling rate; Dmax: days of maximum grain-filling; P: grain-filling duration.

