Article

An Automated Plot Heater for Field Frost Research in Cereals

1
UWA School of Agriculture and Environment, The University of Western Australia, 35 Stirling Highway, Crawley, WA 6009, Australia
2
Department of Primary Industries and Regional Development, 3 Baron-Hay Court, South Perth, WA 6151, Australia
*
Author to whom correspondence should be addressed.
Agronomy 2019, 9(2), 96; https://doi.org/10.3390/agronomy9020096
Submission received: 23 January 2019 / Revised: 12 February 2019 / Accepted: 13 February 2019 / Published: 19 February 2019

Abstract

:
Frost research to improve genetics or management solutions requires a robust experimental design that minimizes the effects of all other variables that can cause plant damage except for the treatment (frost). Controlled environment facilities cannot faithfully replicate field radiative frost processes, but field studies are limited by the reliability of field methods to exclude frost. An effective field frost exclusion method needs to prevent frost damage while not impacting growing microclimate or yield, and be automatic, modular, mobile, and affordable. In this study, we designed an effective prototype treatment with these features for field frost research that uses diesel heating. The effectiveness of the plot heater to provide an unfrosted control is evaluated by monitoring canopy temperature (CT) and air temperature during frost events, showing that these remain above zero in the heated plots when ambient temperature drops below zero. We find that the plot heater method can prevent potential frost damage at the plot-scale, while not appearing to have an impact on either plant development or yield components. This offers a potential new tool for frost field crop researchers to incorporate a plot-scale control into their experimental design.

1. Introduction

Frost damage to broadacre cereals can cause large yield penalties of 10–90% [1,2,3,4], and is a significant limitation to grain production globally, with frost damage reported from studies in Australia, Canada, USA, Argentina, UK, and New Zealand [5,6,7,8,9,10]. Countries that grow crops in winter and spring, such as Australia and Argentina, are particularly impacted [4], with the annual cost of frost to the grains industry estimated at $ 400 million in Australia alone [11,12,13].
The susceptibility of wheat (Triticum aestivum) to frost increases with plant maturity, with damage being the most severe after ear emergence throughout anthesis and early grain fill, where frost can cause sterility in individual florets or the whole spike [14,15,16]. The extent of damage is a complex process that is influenced by many factors including position in landscape, soil type, crop density, plant height, varietal cold tolerance, plant supercooling, antecedent wet weather, duration of cold, length of thawing, and presence of ice nucleation-active bacteria [15,17,18,19,20].
Agronomic field frost research has focused on genetic solutions, such as screening varieties for reduced frost susceptibility, identifying frost tolerant or resistant germplasm, and management solutions such as altering crop nutrition, stubble loads, grazing, row spacing or soil amelioration and the use of protective chemicals [12,21,22,23,24]. A key challenge for this frost research in the field is finding a suitable unfrosted control to compare the frosted treatments with.
Therefore, several studies have used Controlled Environment Facilities (CEF) to compare unfrosted control plants with those that have been subjected to frost-like conditions [16,25,26,27,28]. While a CEF offers the potential to include a unfrosted treatment, the conditions tend to poorly replicate field frost [29]. Field frosts develop under radiant cooling conditions with rapid heat loss to the night sky [30,31,32], while most CEF are convectively or conductively cooled [27]. Convective cooling often causes ice to develop on the chamber and not on the surface of the plant as in field frost. This allows the plants to supercool and only experience damage at much lower temperature than they naturally would [15,28,33]. The limitations of convectively/conductively cooled CEF mean there have been many attempts to build radiantly cooled CEF, such as Marcellos [26], who proposed using a refrigerated metal plate at the top of the chamber as a radiant heat sink and this design was further developed by Fuller & Le Grice [27], with other attempts outlined in Frederiks et al. [29]. While these radiant approaches more accurately reproduced field frost with the formation of dendric crystals on the surface of the plant, supercooling of plant tissue still appears to occur more than in field frosts. Fuller & Le Grice [27], proposed that this was due to greenhouse plants relying on different ice nucleators compared with those in field conditions. Recent work by Livingston et al. [34], using a high resolution thermal camera to compare freezing processes in the field in North Carolina and within a CEF, suggests that CEF may in-fact replicate field frost better than previously thought, as freezing commenced at the bottom of the plant in both conditions. While this is a novel finding, as freezing processes were thought to first occur in the upper part of leaves, it remains unknown if this process will occur in areas where the soil does not freeze, and it further highlights the complexity of plant freezing, and that further research is required. As CEF are not yet able to reproduce the subtle complexities of field frost and are unlikely to handle the large scale required for some studies, field trials will remain a necessary component of frost research [35].
Two approaches have been taken to provide an unfrosted control in the field, including passive shelters that limit radiant heat loss and active methods that provide an input of heat to replace the energy lost [36]. Previous attempts to create unfrosted controls in frost research in cereals have focused on passive shelters, built from materials such as shade cloth, plastic film, polyester fabric and tarpaulin which are wrapped around frames ~1 to 2 m2 and placed manually over the crop. This work is largely unpublished, except for Frederiks et al. [29], who discuss their attempt to create an automated shelter. The issue with shelters is that they are difficult to automate, can be ineffective at preventing severe frost due to failure to trap sufficient radiant heat, and can significantly impact the local microclimate and plant growth due to shading and edge effects if the covers and support structures are not removed daily. The manual removal and replacement of these shelters is labor-intensive, relies on accurate frost forecasts and reliable onsite technical support, and this requires that the research site is easily accessible [29].
Active heating methods such as heaters and fans to prevent frost, such as those used in orchards by Ribeiro et al. [37] and Ballard & Proebsting [38], have generally been dismissed for unfrosted control treatment purposes due to the inability to control the extent of impact [29]. However, heating methods tend to be easier to automate and have less issues with shading and alteration of the growing environment compared with shelters.
The lack of effective frost exclusion methods in current frost research is also evident in the recent development of a method to induce frost in the field by Nuttall et al. [39]. This method effectively builds a small CEF in the field and replicates the approach of Marcellos [26] and Fuller & Le Grice [27] by inducing radiative cooling from a cooled plate suspended above the crop, in this case using a platform filled with dry ice [39]. While a potential useful development for field research, this approach requires a trial site to be in an area free from frost, and it is known that plants grown in warmer climates can have different acclimation to cold temperatures [19,40]. There also remains uncertainty on where the freezing is initiated in this approach and whether it is representative of field radiant frost processes.
As frost events are unpredictable, researchers have developed field trial designs that attempt to maximize the uniformity of frost, these trials are then placed at frost prone sites and planted with multiple times of sowing (ToS), to ensure that there is a spread in flowering time (frost risk) across the season. In this way, the chance of experiencing frost during or shortly after anthesis is increased and the frost susceptibility of different varieties at the same phenological stage can be compared within and across ToS [41]. The major limitations of this approach are that there are no unfrosted controls within or between the ToS, and potential unfrosted yield is only able to be estimated from total maturity biomass. It is also hard to account for the effect of frost damage from single events and/or at key stages of phenological development. Frosts often occur over successive nights [42,43], and in seasons such as 2016 in Western Australia, on 5–10 days intervals. Hence it is not possible to determine if one or all the frost events had an equal impact, and what the critical temperatures for damage were. An effective frost exclusion method that is mobile would provide the ability to assess plant damage caused by a single frost event, or at key phenological development stages without the confounding impact of further frost events.
While decades of research have produced useful field research methods and advances in knowledge of frost impact on cereals, having effective unfrosted control plots within field trials remains a major limitation [29]. Ideally, an unfrosted control in the field trial should: prevent frost damage to plants, not impact the growing microclimate other than the treatment, and be modular, automated, mobile, and ultimately affordable.
The aim of this paper is to present a new approach to providing an unfrosted control for plot-scale field research, which was developed during a study to rapidly identify frost damaged wheat. An outline and schematic for the design is provided, and we also briefly discuss the evolution in the design and important lessons learned. The effectiveness of the plot heater to provide an unfrosted control is evaluated using thermal infrared canopy temperature and air temperature data within the heated plots and in nearby ambient plots, and drone thermal imagery. We present data during frost events across two seasons (2017 and 2018) to validate that the method is effective at keeping canopy and air temperature above 0 °C in the heated plot when ambient drops below 0 °C. As 2017 was a mild frost season with no measured frost damage to the crop, we also present harvest and phenology data for 2017 to validate that the plot heater did not impact plant growth or yield.

2. Materials and Methods

2.1. Plot Heater Design

The plot heater was developed in three phases; prototype one in 2016 and prototypes two and three in 2017. The focus of this paper is the successful prototype three, which was a modified version of prototype one and two. A full design of three is provided below, a brief description of the one and two is provided here to convey some of the limitations and issues when constructing effective heated frost exclusion methods and why a diesel heating source was required.

2.1.1. Prototype One and Two

Prototype one used five, 35 × 7 mm metal ceramic plate heating elements that were mounted within a 100 mm polyvinyl chloride (PVC) pipe, with a marine bilge fan used to pump ambient air across the plates and through an air diffusing manifold (full design outlined in protype three) in an attempt to prevent frost in the unfrosted control plots. This protype was powered by one 120 Ah 12 V Absorbent Glass Mat (AGM) battery connected to a solar panel. It was not able to generate a sufficient volume of warm air to heat the plot effectively.
In the second protype the ceramic plate heaters were replaced by two, 12 V 300 W car ceramic heaters. Due to the larger energy requirement three, 120 Ah 12 V AGM batteries were required. This protype was significantly less mobile due to the battery weight, and failed to prevent frost. The main reason for failure of prototypes one and two was the energy density of the power source used to generate heat, a lead-acid battery (0.56 MJ/l). Therefore, in protype three the heater elements and bilge fan were replaced with diesel fueled (35.8 MJ/l) space heater.

2.1.2. Prototype Three—Diesel Heated Unfrosted Control

A 12 V 2 KW diesel caravan air heater (Belief 2KW air heater, Diesel Heat, Australia) was installed within a weather-proof box and the air was piped through a PVC manifold that diffused the air across ~1 m × 1 m area in the unfrosted control plot (Figure 1a). The air diffusing manifold consisted of five, 65 mm PVC pipes with ~45 holes spaced 20 mm apart drilled on the top side (Figure 1a). The number of holes was determined by monitoring the energy consumption of the fan (used in, protype one), more holes were drilled until there was no back-pressure on the fan. The manifold was designed to slide in between the crop rows on the interrow soil surface.
The heater was rated to consume 0.12–0.24 l/h of diesel, and 14–29 W power [44]. Bench testing found power consumption was 8 A (100 W) on start-up and 2–2.5 A (25 W) when operating, and that it could generate temperatures of 90 °C at the outlet of the heater unit in ambient laboratory conditions. It was powered using the same 120 Ah 12 V AGM battery as prototype one (Figure 1c) (which was well in excess of required power to run the unit), with a 12 V 120 W solar panel and Victron BlueSolar MPPT 75/15 solar charge controller (Figure 1c).
The diesel heater controller was set to maximum output and triggered to start at a set temperature on a 12 V DC Digital thermostat temperature controller (STC-1000, unbranded eBay) with a PT-100 temperature probe placed at flag leaf height (Figure 1, Figure 2). The stated accuracy for the temperature probe was 1 °C, and it was calibrated in the field to (cold) ambient temperatures using a Kestrel 5500 (Kestrel Instruments, temperature accuracy 0.5 °C) by adjusting the temperature offset within the temperature controller unit. The heater was triggered to turn on when the temperature at canopy height was 2 °C at which point a constant flow of hot air was pumped through the manifold over the 1 m2 area until the target temperature of 4 °C at the canopy was reached, then it switched off.
Initial testing of the third prototype in June/July 2017 was promising so two more were built, making a total of three diesel plot heaters. The total cost of the components for the prototype three configuration was <$2000 AUD (~$1400 USD).

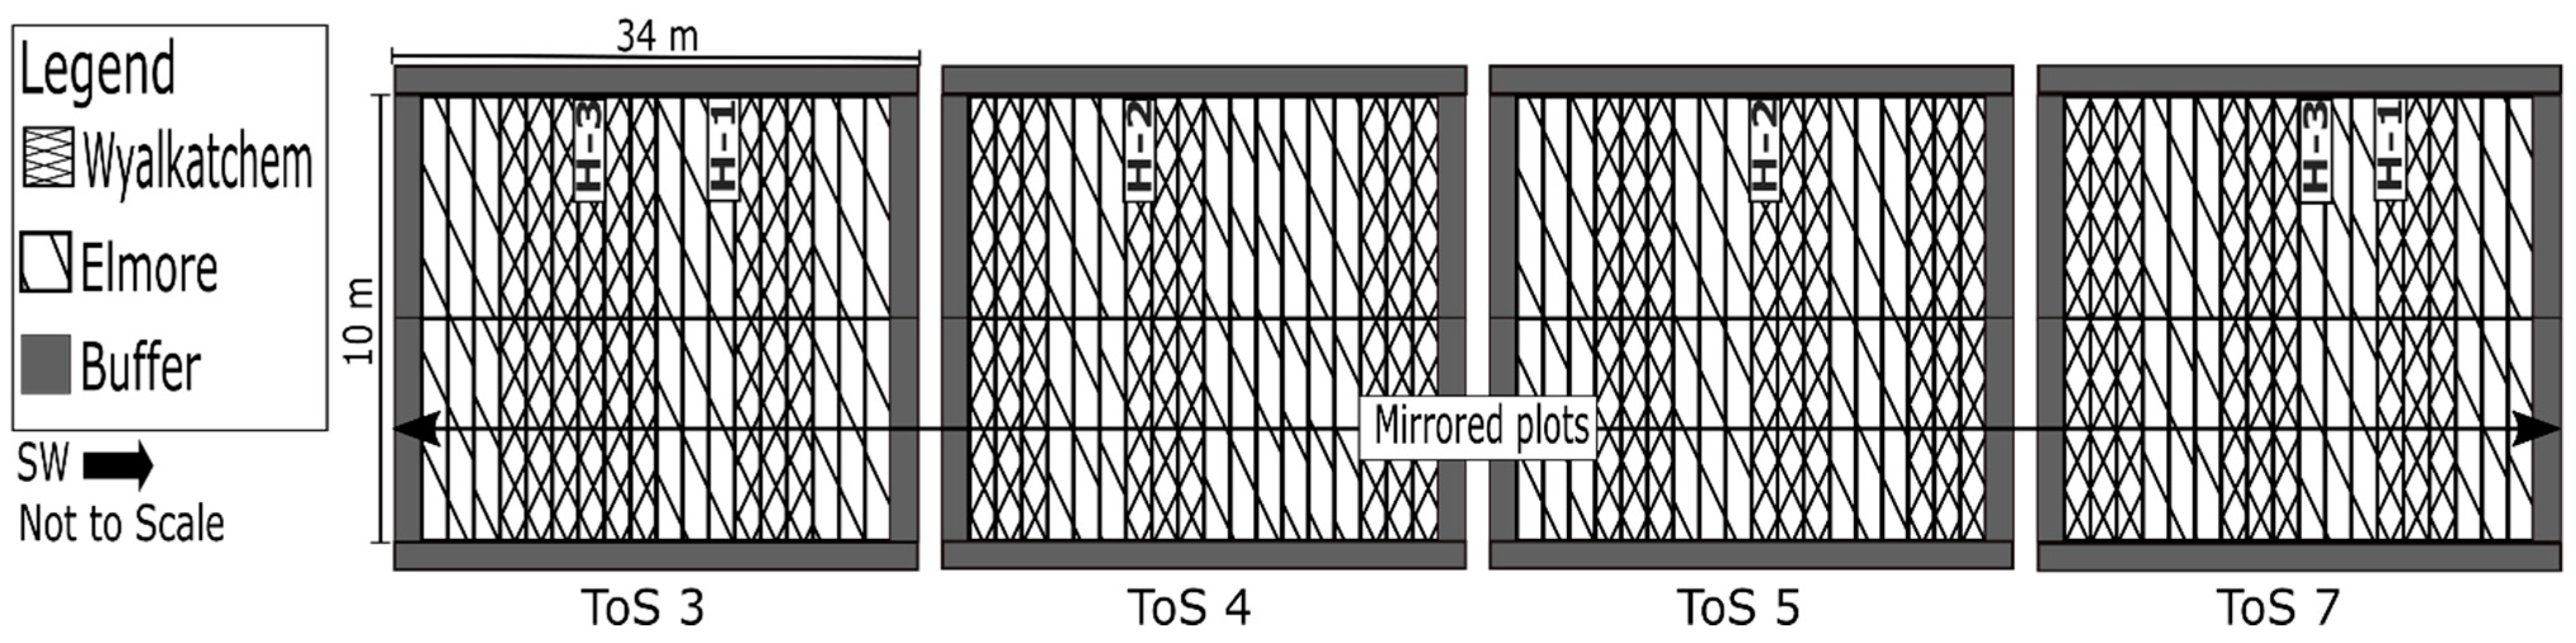
2.2. Field Deployment

The unfrosted control method was developed at The University of Western Australia, and then trialed over three field seasons 2016, 2017 and 2018 at Department of Primary Industries and Regional Development (DPIRD) frost nursery near Dale, Western Australia (32°12′24.48″ S,116°45′31.32″ E) (Figure 2). This paper focuses on results from the 2017 season, and the successful diesel heating system (prototype three) along with some additional air temperature data from the 2018.
In 2017 the trial had eight ToS from 13 April to 9 June at ~250 growing degree day intervals to give a range in flowering from July to October, and in each there were three replicates of two wheat varieties (Elmore Clearfield® Plus (Elmore) and Wyalkatchem). Plots were 5.0 × 1.7 m and each variety within a replicate consisted of three similar neighboring plots. In addition, the whole experiment was replicated in adjacent mirrored plots, to obtain yield data for an equivalent unheated plot, without the impact of human traffic that was required for assessing floret sterility and installation of equipment (Figure 3). Each ToS was sown with buffer plots to minimize edge effects. Plots were sown with a row spacing of 0.25 m at a seed rate of 75 kg/ha to achieve 150 plants/m². The heaters were placed in ToS 3 and 4 on 3 August, then moved to ToS 5 and 7 on 26 September once the wheat in the former was mature enough to be unaffected by frost, and remained there until 24 October 2017. The location of the heaters is shown in Figure 3.
The effectiveness of the unfrosted control method was determined by monitoring plant canopy temperature (CT) in the heated (“unfrosted”) and an ambient (“frosted”) plot using Arducrop® fixed thermal infrared (TIR) thermometers. The Arducrop® sensors provide an accurate measure of CT based on a 10° field-of-view (FOV) TIR sensor active across the 5.5–14 µm wavelength, and were developed by High Resolution Plant Phenomics Center (HRPPC), Canberra [45]. The accuracy of the Arducrop® sensors is ±0.5 °C which was checked against a black body before and after deployment. Drone thermal imagery using a FLIR® Tau®2 640, 25 mm 264,025 camera flown at a height of 30 m was collected above the heaters from 6:17 to 6:21 am on 27 September 2017. While these types of thermal cameras can have absolute temperature errors of 3.55 °C [46], we apply the camera to the sensing of relative temperature differences around the heater.
A calibrated Campbell Scientific CR5000 weather station was installed 49.5 m to the North-East side of ToS 1 in an uncropped area in 2017 and within the crop in 2018. It recorded wind speed (Vaisala WMT50 Ultrasonic, Helsinki, Finland), screen temperature and vertical temperature using unshielded thermocouples (T-Type, Temperature Controls Pty Ltd, Sydney, NSW, Australia) at 600 mm above bare ground at one-minute intervals.
The automated unfrosted control treatment was also deployed in 2018, as part of further research at the Dale frost nursery. Air temperature instead of CT was recorded within the heated plot and in an adjacent non-heated plot, using unshielded thermocouples (T-Type, Temperature Controls Pty Ltd) with 1 °C accuracy placed on a pole, spaced at 200 mm intervals, from 200 mm to 800 mm above ground level (AGL) fixed across the season.
Air temperature data was recorded by the thermocouples from frost events on 15 and 16 September 2018 where two heaters (heater two and three) were in ToS 5 in plots of Wyalkatchem that were at mid-anthesis. Heater one was not used in 2018 as the diesel fuel was contaminated with water causing the heater to malfunction. The heaters were set to the same trigger temperatures as 2017.

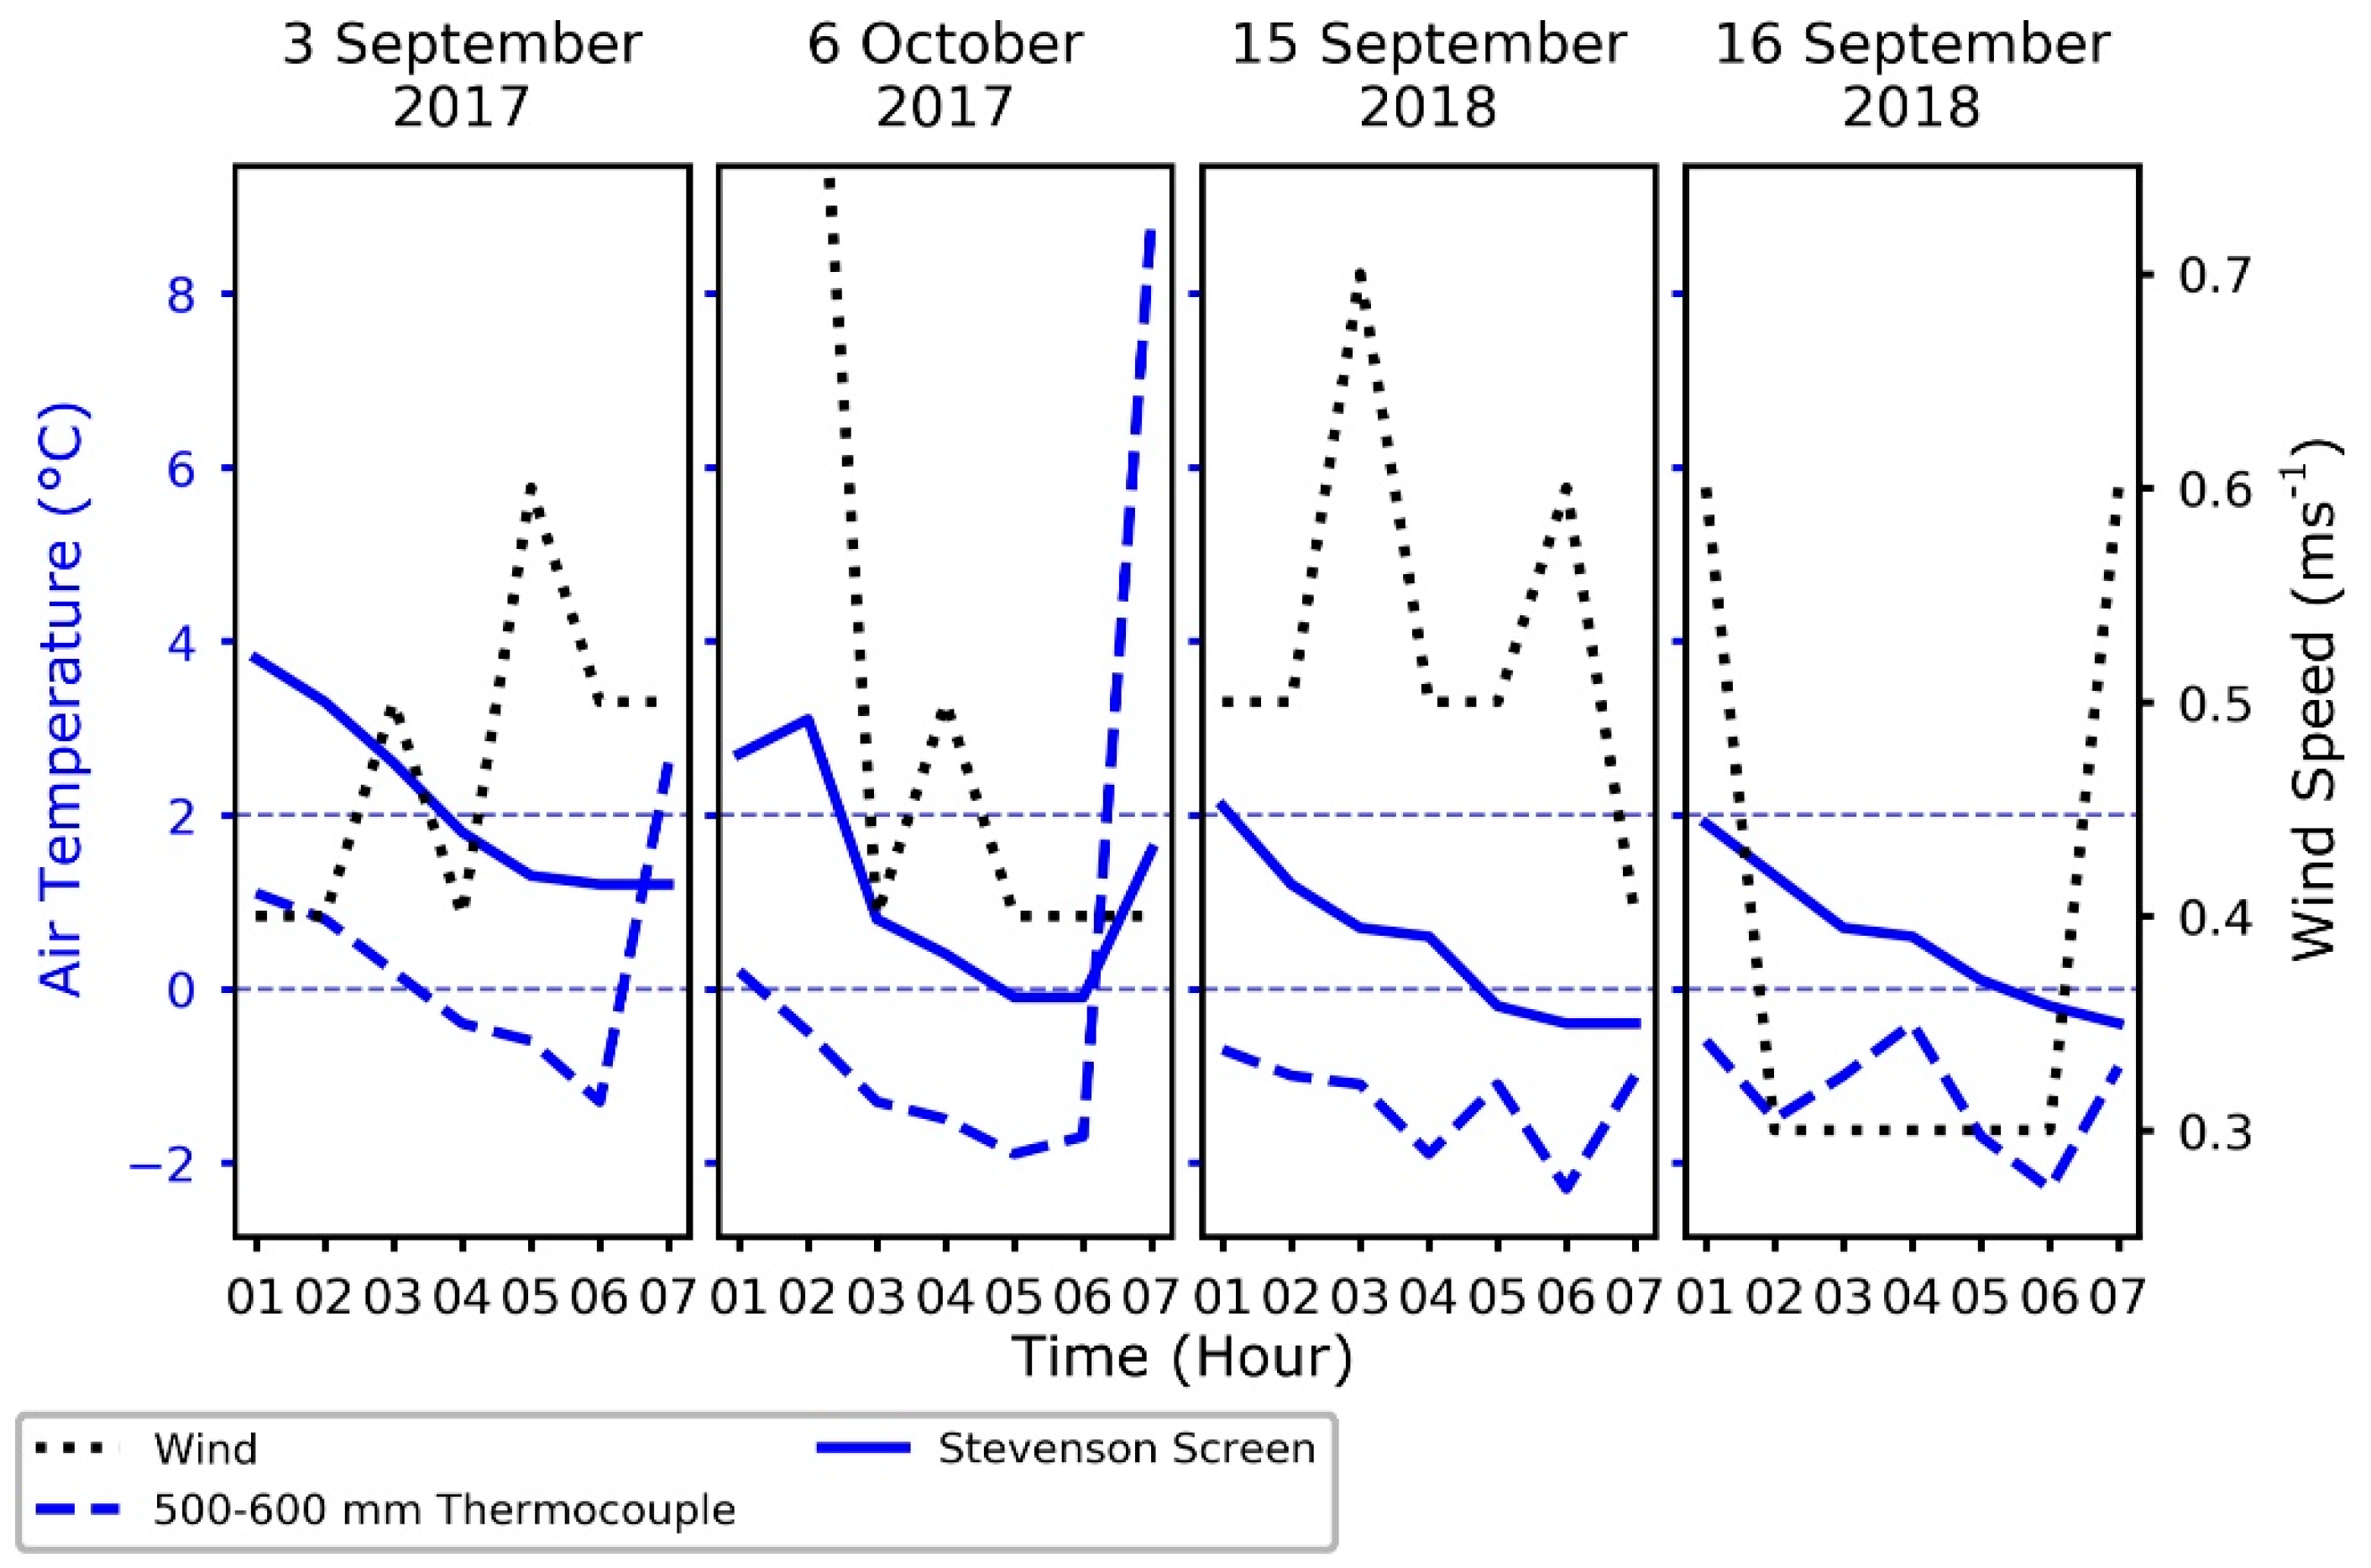
2.3. Weather Data for the Frost Events

In 2017 two frost events were selected to assess the heaters. The first event on 3 September 2017 was selected as it was the coldest night after the heaters were deployed in their final design in ToS 3 and 4, and the Arducrops® were recording data. The second event on the 6 October 2017 was the coldest night when the heaters where in their final position in ToS 5 and 7. For these respective frost events the minimum screen temperature recorded was 1.2 °C and −0.1 °C (Figure 4), therefore the events are best described as mild frost which are defined by screen temperatures between 0 °C and 2 °C [2,47]. For this reason, data from 15 and 16 September 2018 where the minimum screen temperature was −0.4 °C (Figure 4) is included to demonstrate the heaters operating during in more severe frost, which is defined by screen temperatures <0 °C [2,47].

2.4. Crop Data

To assess crop development Zadoks scores were documented weekly from ~Z 45–70 to estimate heading (Z 55) and flowering date (Z 65) [48]. To estimate frost damage, floret sterility (FS) samples were taken at Z 80–83. FS was assessed on a sample of 30 heads on the outside florets excluding the terminal, basal, and supernumerary spikelets by the method developed by Reinheimer et al. [49] and within the Australian National Frost Program [21] in the center plot of each replicate within a ToS, and is expressed as the percentage of sterile florets out of total florets. In this method sterile florets are determined during grain fill by visual inspection, where frost affected grain are yellow and shrunken with a dimpled, crimped appearance. To assess final grain yield and yield components, cuts of the crop were taken at physiological maturity (Z 90). These cuts were processed for biomass, viable heads, grain yield, and harvest index. The threshed grain was assessed for the quality parameters of screenings, grain size (thousand grain weight) to allow calculation of grains/m2 [50]. Canopy height was also measured throughout the season and is defined here as the distance from the soil surface to the top of the flag leaf or ear (if present). Canopy height is shown for the frost events in 2017 and 2018 in Table 1.

2.5. Statistical Analysis

Statistical analysis was undertaken in R version 3.5.0 (R Core Team, 2018), using paired t-tests and a linear mixed model from the “nmle” package [51]. A linear mixed model was applied for grain dry weight, total biomass, harvest index, number of tillers, and grain weight and included the main effects for heat (heat vs no heat), variety (Wyalkatchem vs Elmore) and ToS (four ToS 3,4,5,7) and the interaction between heat and variety. No interaction for ToS was included as not all varieties or heaters were present across the different sowing dates. The model for FS included the main effect and interactions for variety and ToS, as FS was only assessed in the unheated plots. Replicate was included in all models as a random effect.
A paired t-test was used to determine significance between the heated and the unheated “mirror” plots for grain dry weight, total biomass, harvest index, number of tillers, and grain weight.

3. Results

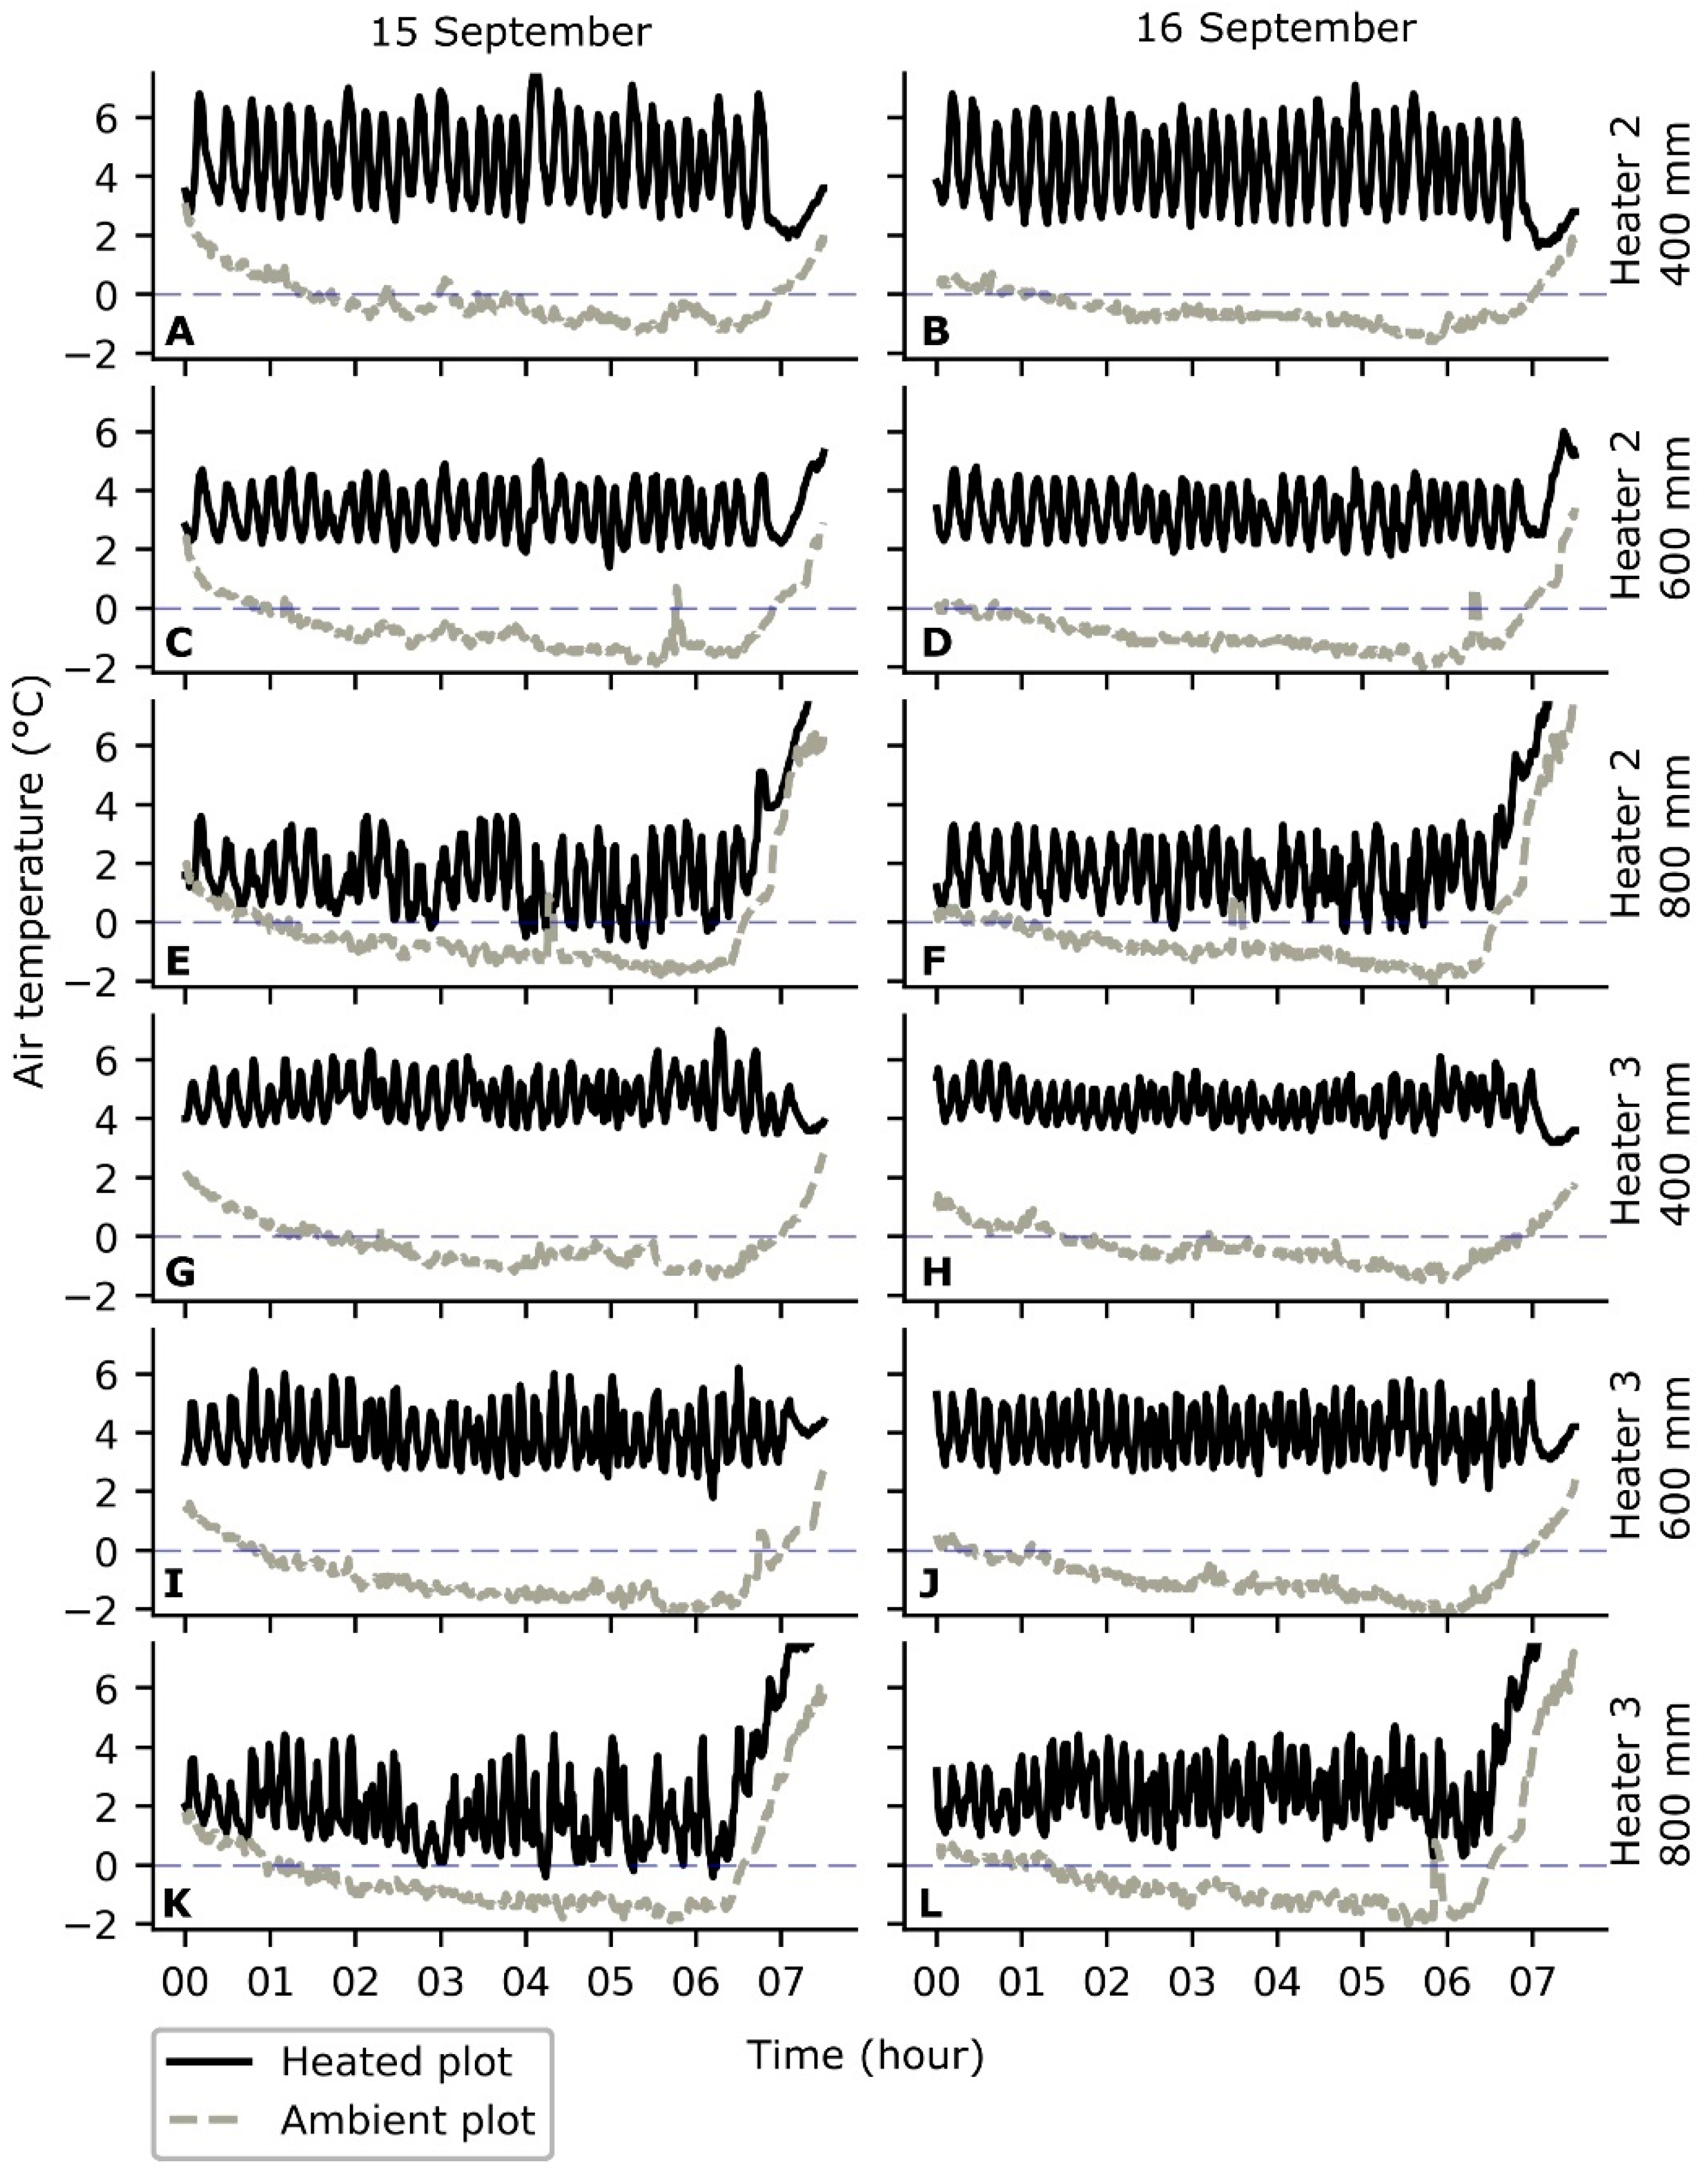
3.1. Canopy Temperature Data from 2017 and Air Temperature Data from 2018 in Heated and Unheated Plots

CT for the heated plots was compared to nearby unheated plots of the same variety, for frost events on 3 September and 6 October 2017 (Figure 5) for heater one (Figure 5A,B), heater two (Figure 5C,D) and heater three (Figure 5E,F).
On 3 September heater one was first triggered at 00:14 a.m. at 3.9 °C and then ran until CT was 5.9 °C at 00:24 a.m. (Figure 5A). The frequency of heating throughout the event fluctuated with intervals as short as 5 min and as long as 20 min. Minimum CT reached in the plot where heater one was located for this event was 2.2 °C while the ambient plot reached −0.9 °C. For the second frost event on 6 October the heater had a similar heating frequency to the 3 September event but there was a spike in CT at 1:49 a.m. where it reached 8 °C. A minimum CT of 0.5 °C was recorded in the heated plot and −0.2 °C in the ambient for this event.
Heater two behaved in a similar manner to heater one for the 3 September event with a heating frequency of ~5 to 20 min (Figure 5C,D). When compared to heater one it triggered at CTs around 2 °C instead of ~4 °C and there was a smaller range in CT. A minimum CT of 0.8 °C was recorded at in this plot and −1.2 °C in the ambient. On the 6 October, while CT remained >0 °C this heater had a technical issue caused by the sealant in the main section of the manifold cracking.
For heater three on 3 September the time from the heater triggering to turning off was ~20 min (Figure 5E,F). Between 3:35 a.m. and 4:50 a.m. there was a sustained period of heating. On 6 October, the heater ran with a similar frequency to 3 September. For both events, heater three had the largest range of CT from trigger to target. Minimum CT recorded in this heated plot was 0.4 °C on 3 September and 0.5 °C 6 October whereas, the ambient plot recorded −0.5 °C for both events.
This shows that while there was variation in the CT at which the heating commenced, and the duration of the heating, CT in the heated plots remains >0 °C when unheated CT dropped to <0 °C.
As the frost events in 2017 were mild frost events, air temperature at 400, 600, and 800 mm AGL for the heated and, unheated plots of Wyalkatchem in ToS 5 for frost events on 15 and 16 September 2018 are shown in Figure 6.
The heaters kept air temperature between 2–7 °C at 400 mm AGL, 1.5–6 °C at 600 mm AGL and −0.8–4.6 °C at 800 mm AGL across the two consecutive frost events. Demonstrating that the heaters keep air temperature within the canopy (canopy height = 680 mm) >0 °C when air temperature in the unheated plots drops to −2.2 °C. The duration from the heater triggering to turning off was ~10 min for both heaters, across the two events.

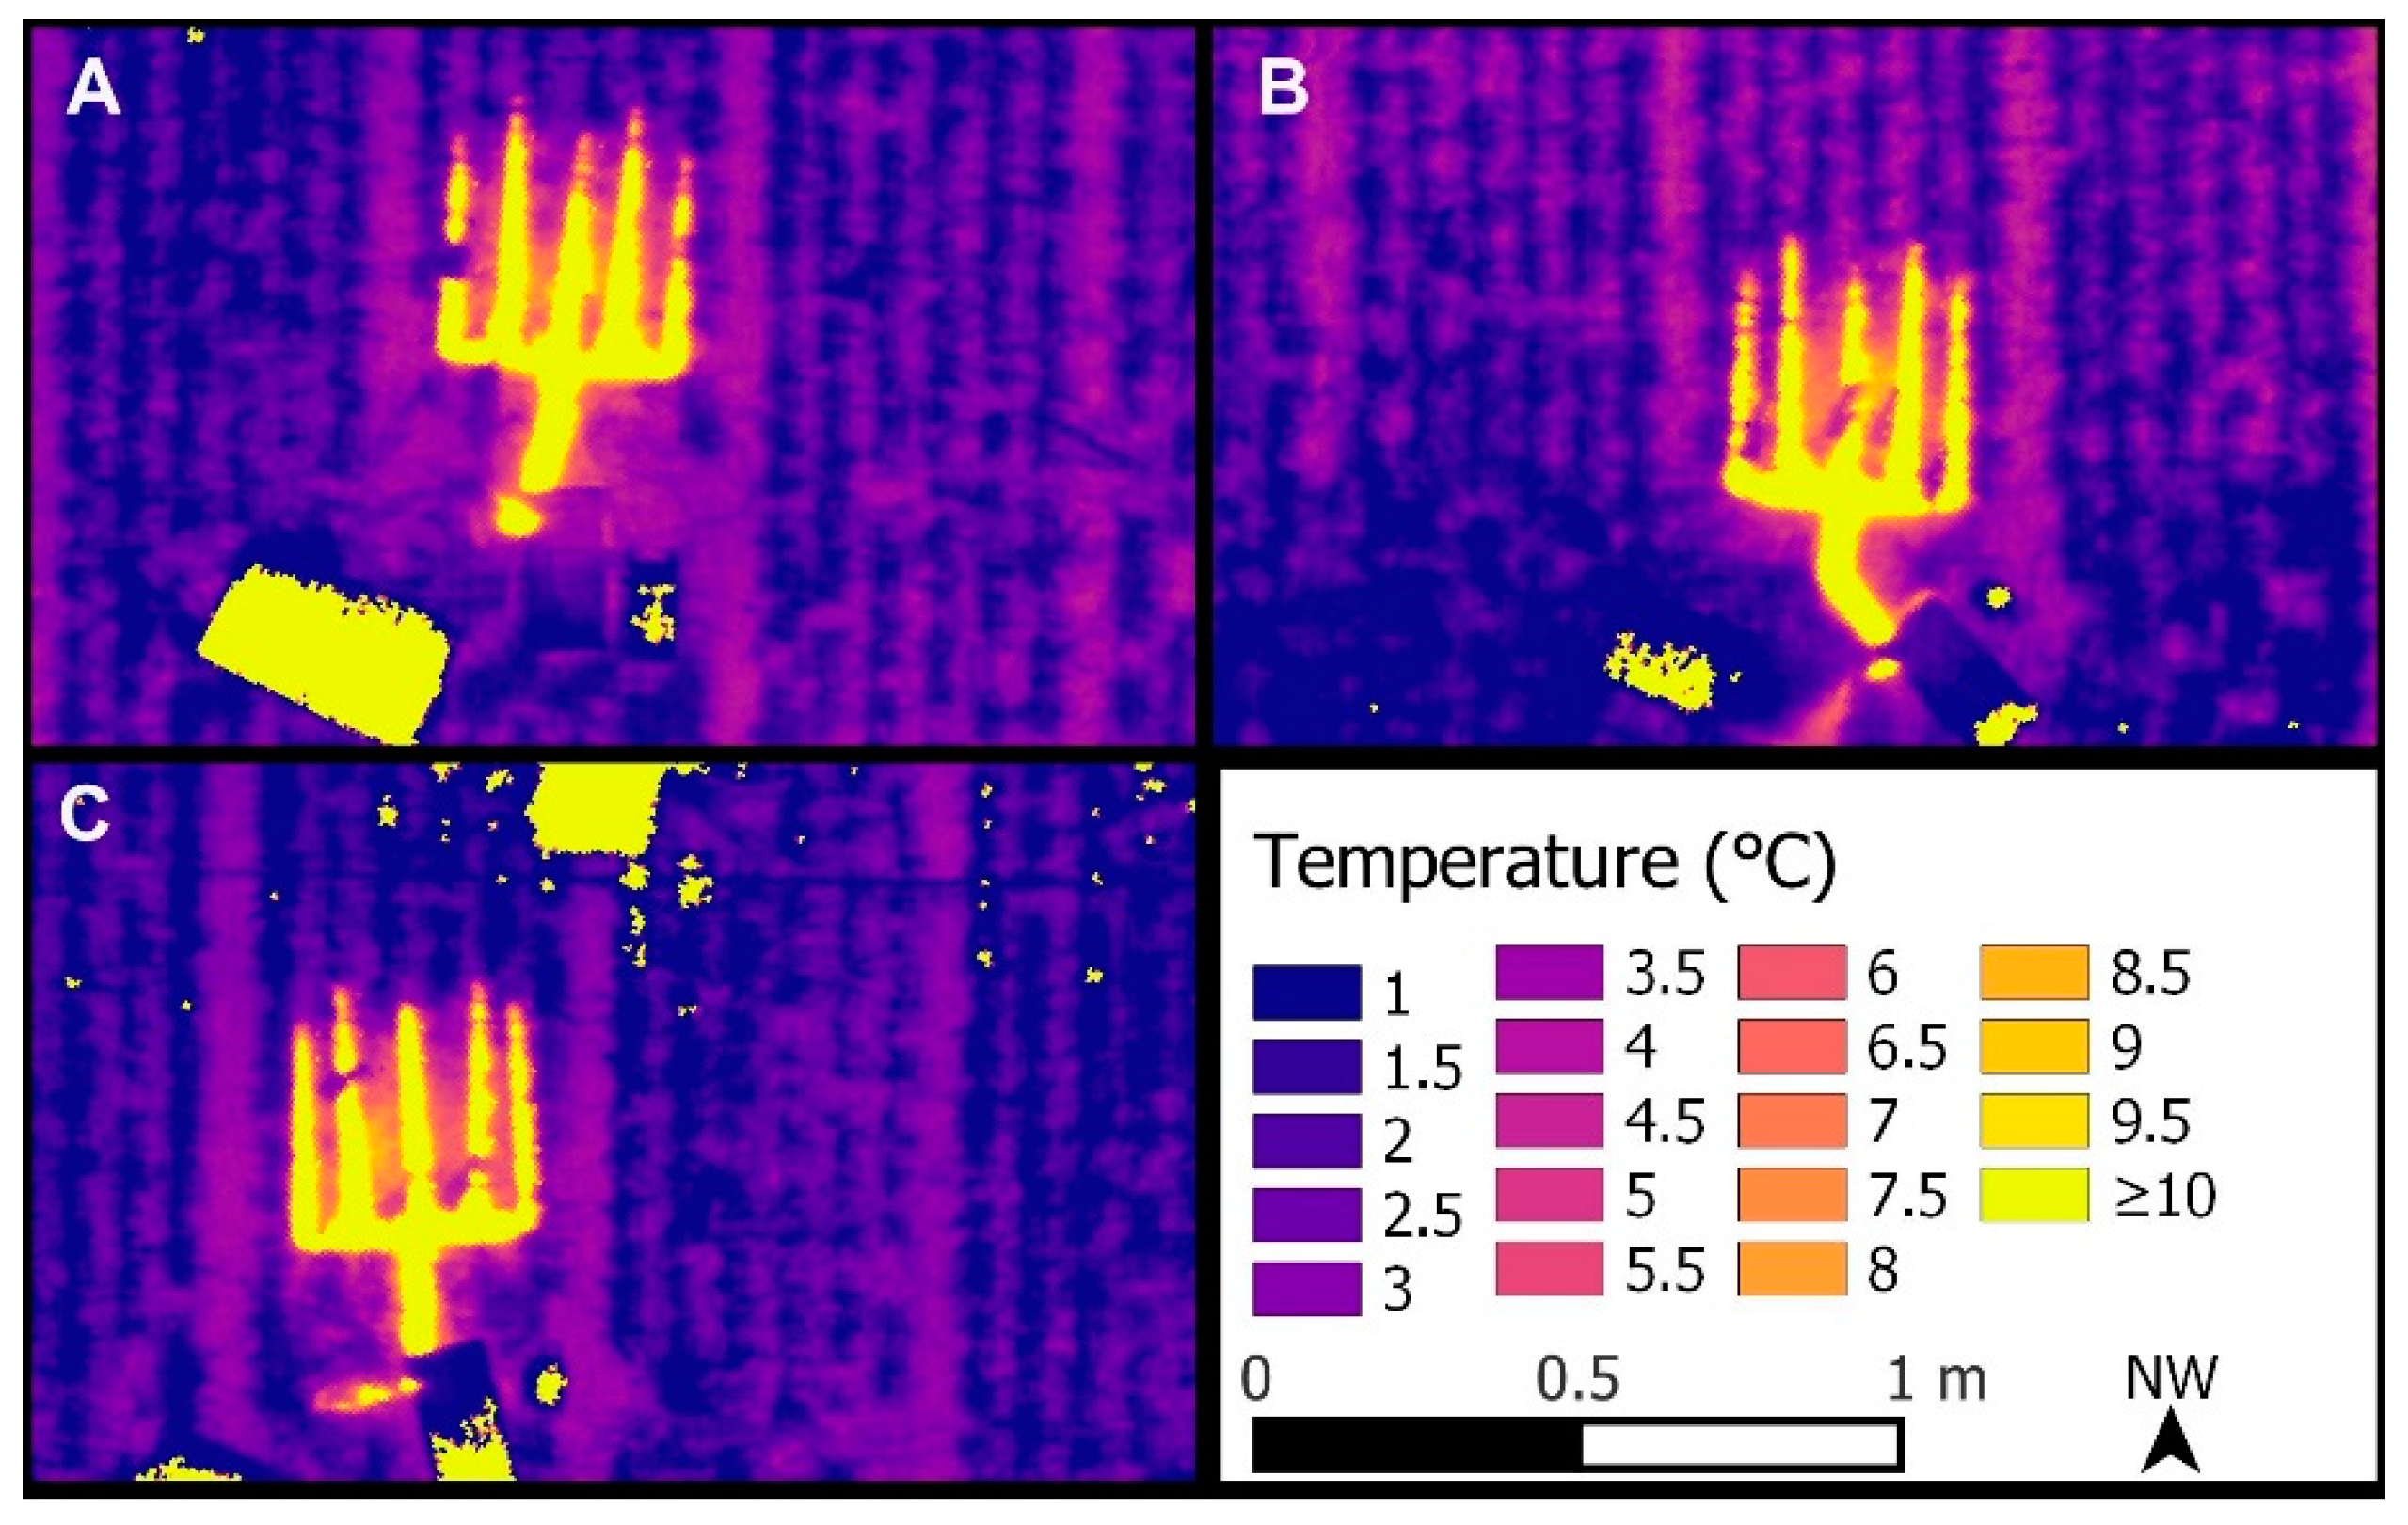
3.2. Spatial Extent of Heating

CT above and around the heaters as captured by a drone-mounted thermal camera is shown in Figure 7. These images demonstrate that the extent of the heated area was ~1.2 × 1.2 m and limited to the area in direct proximity to the manifold.

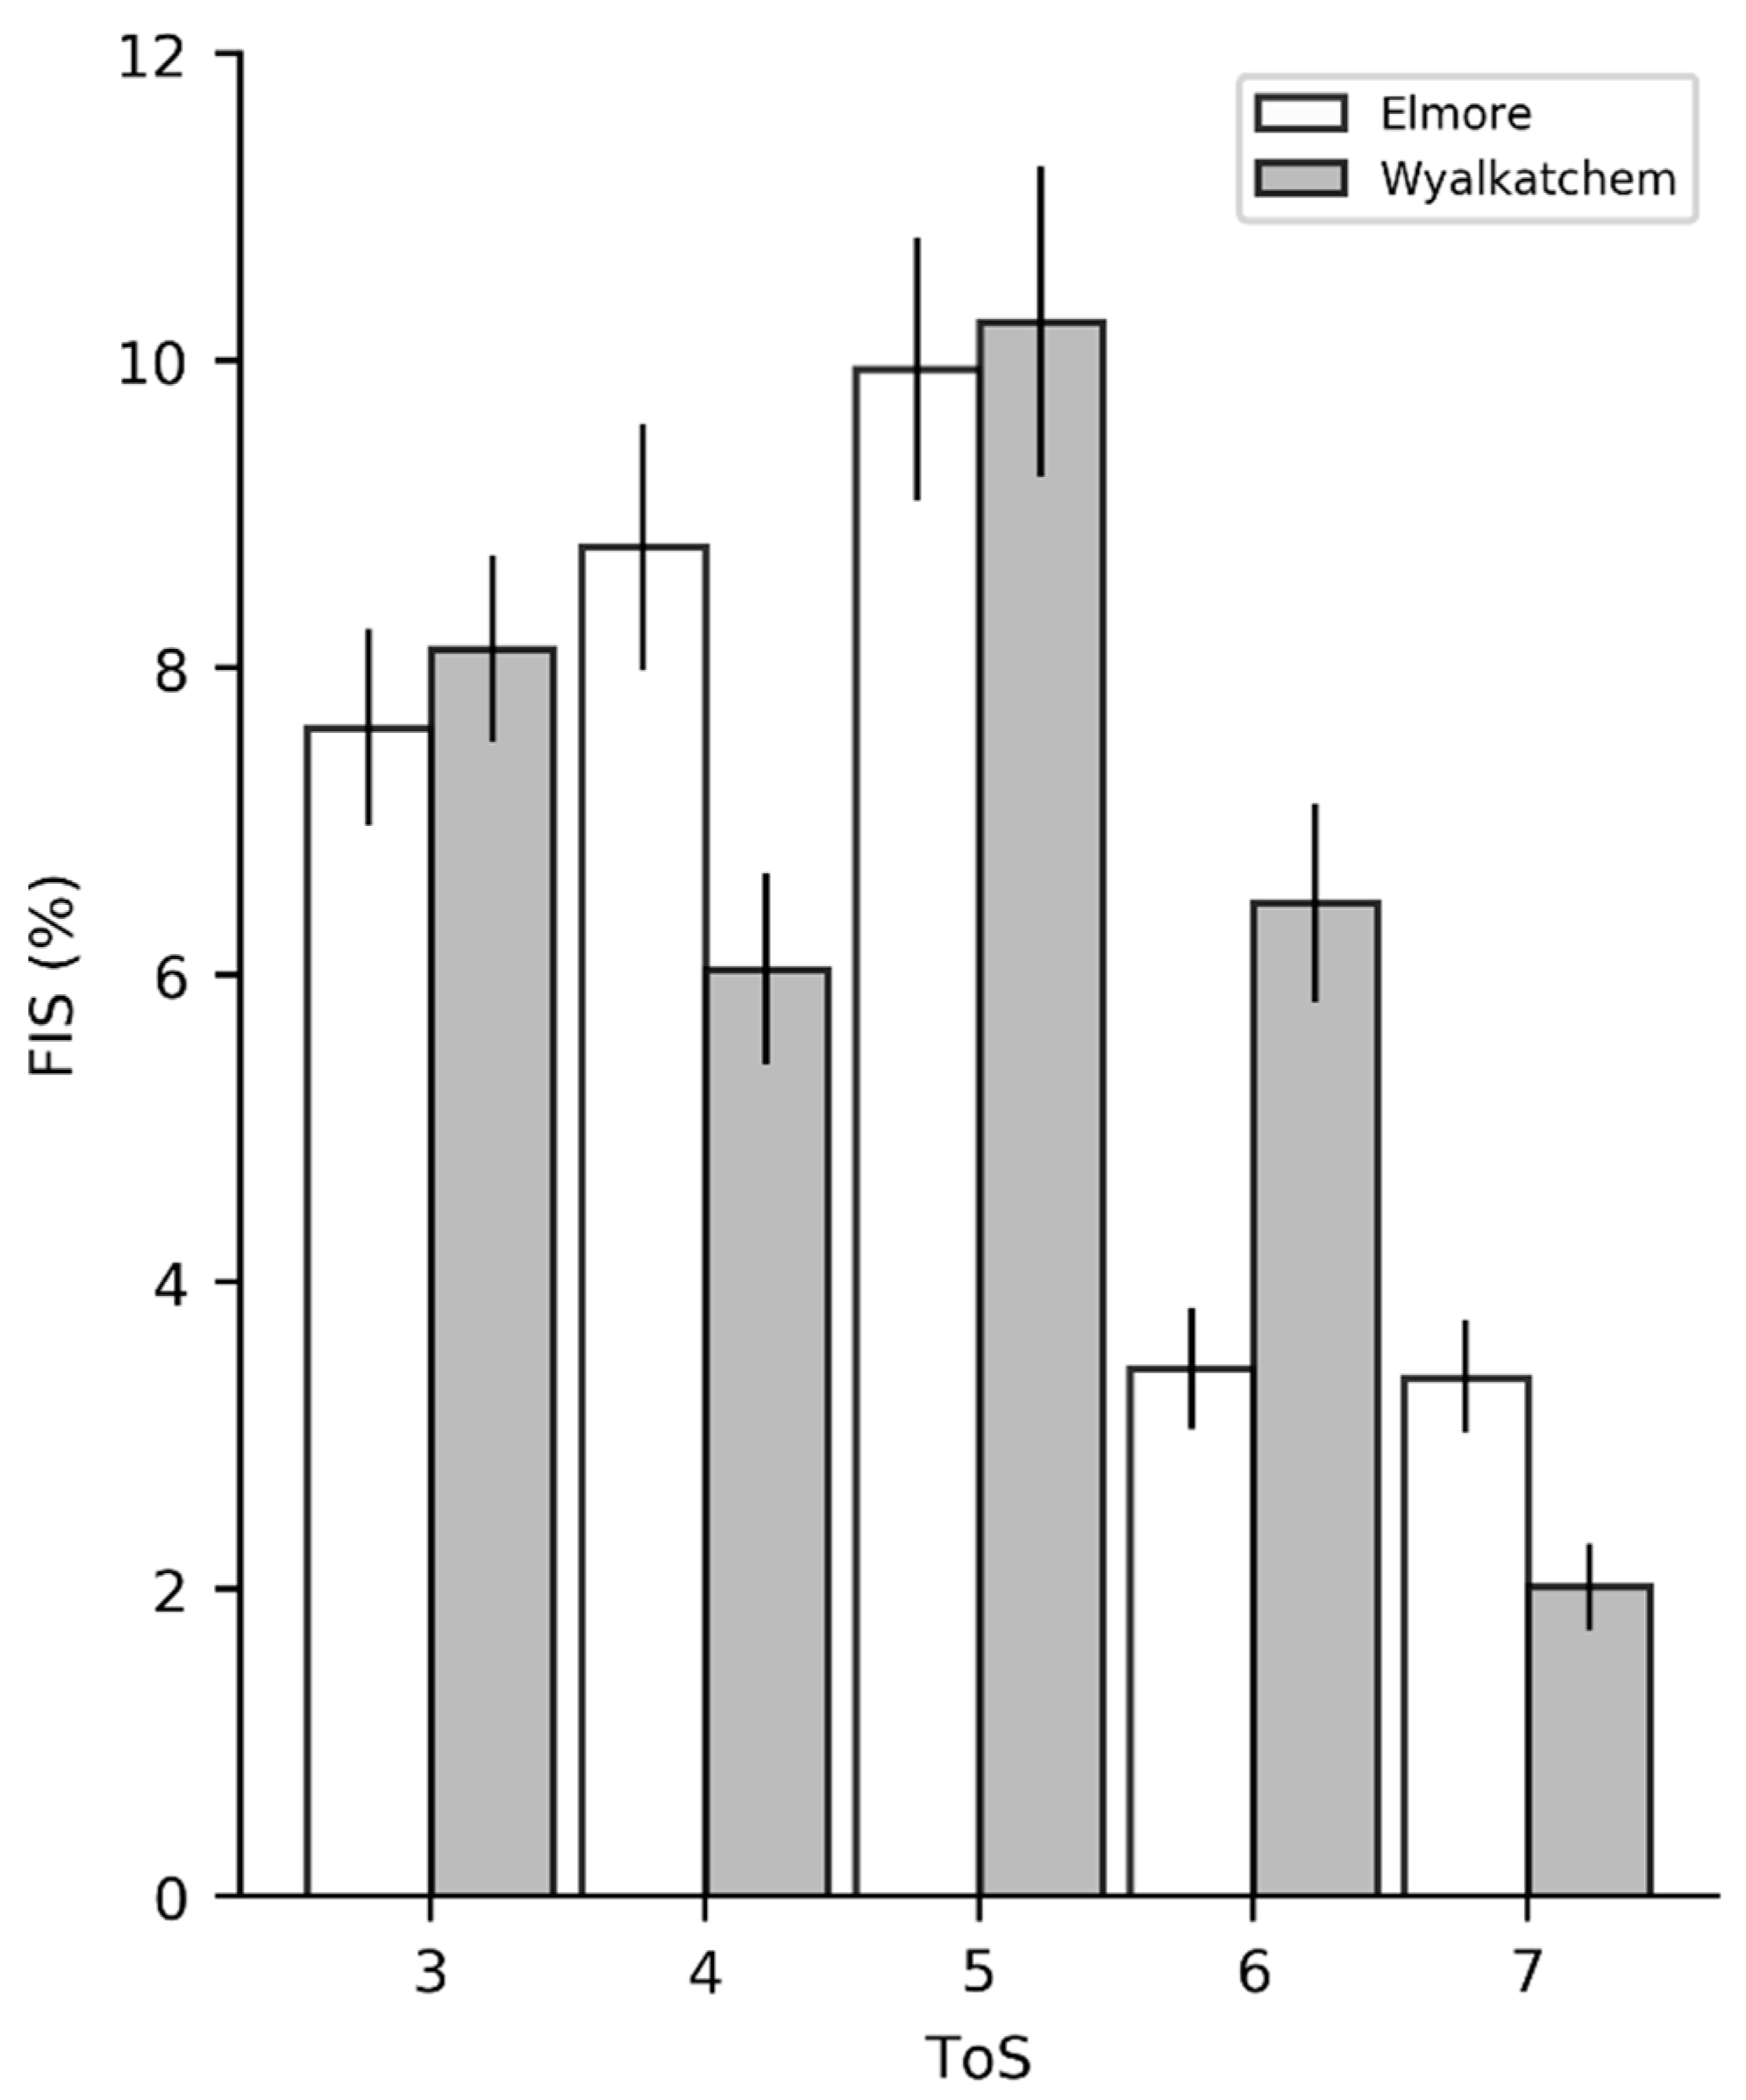
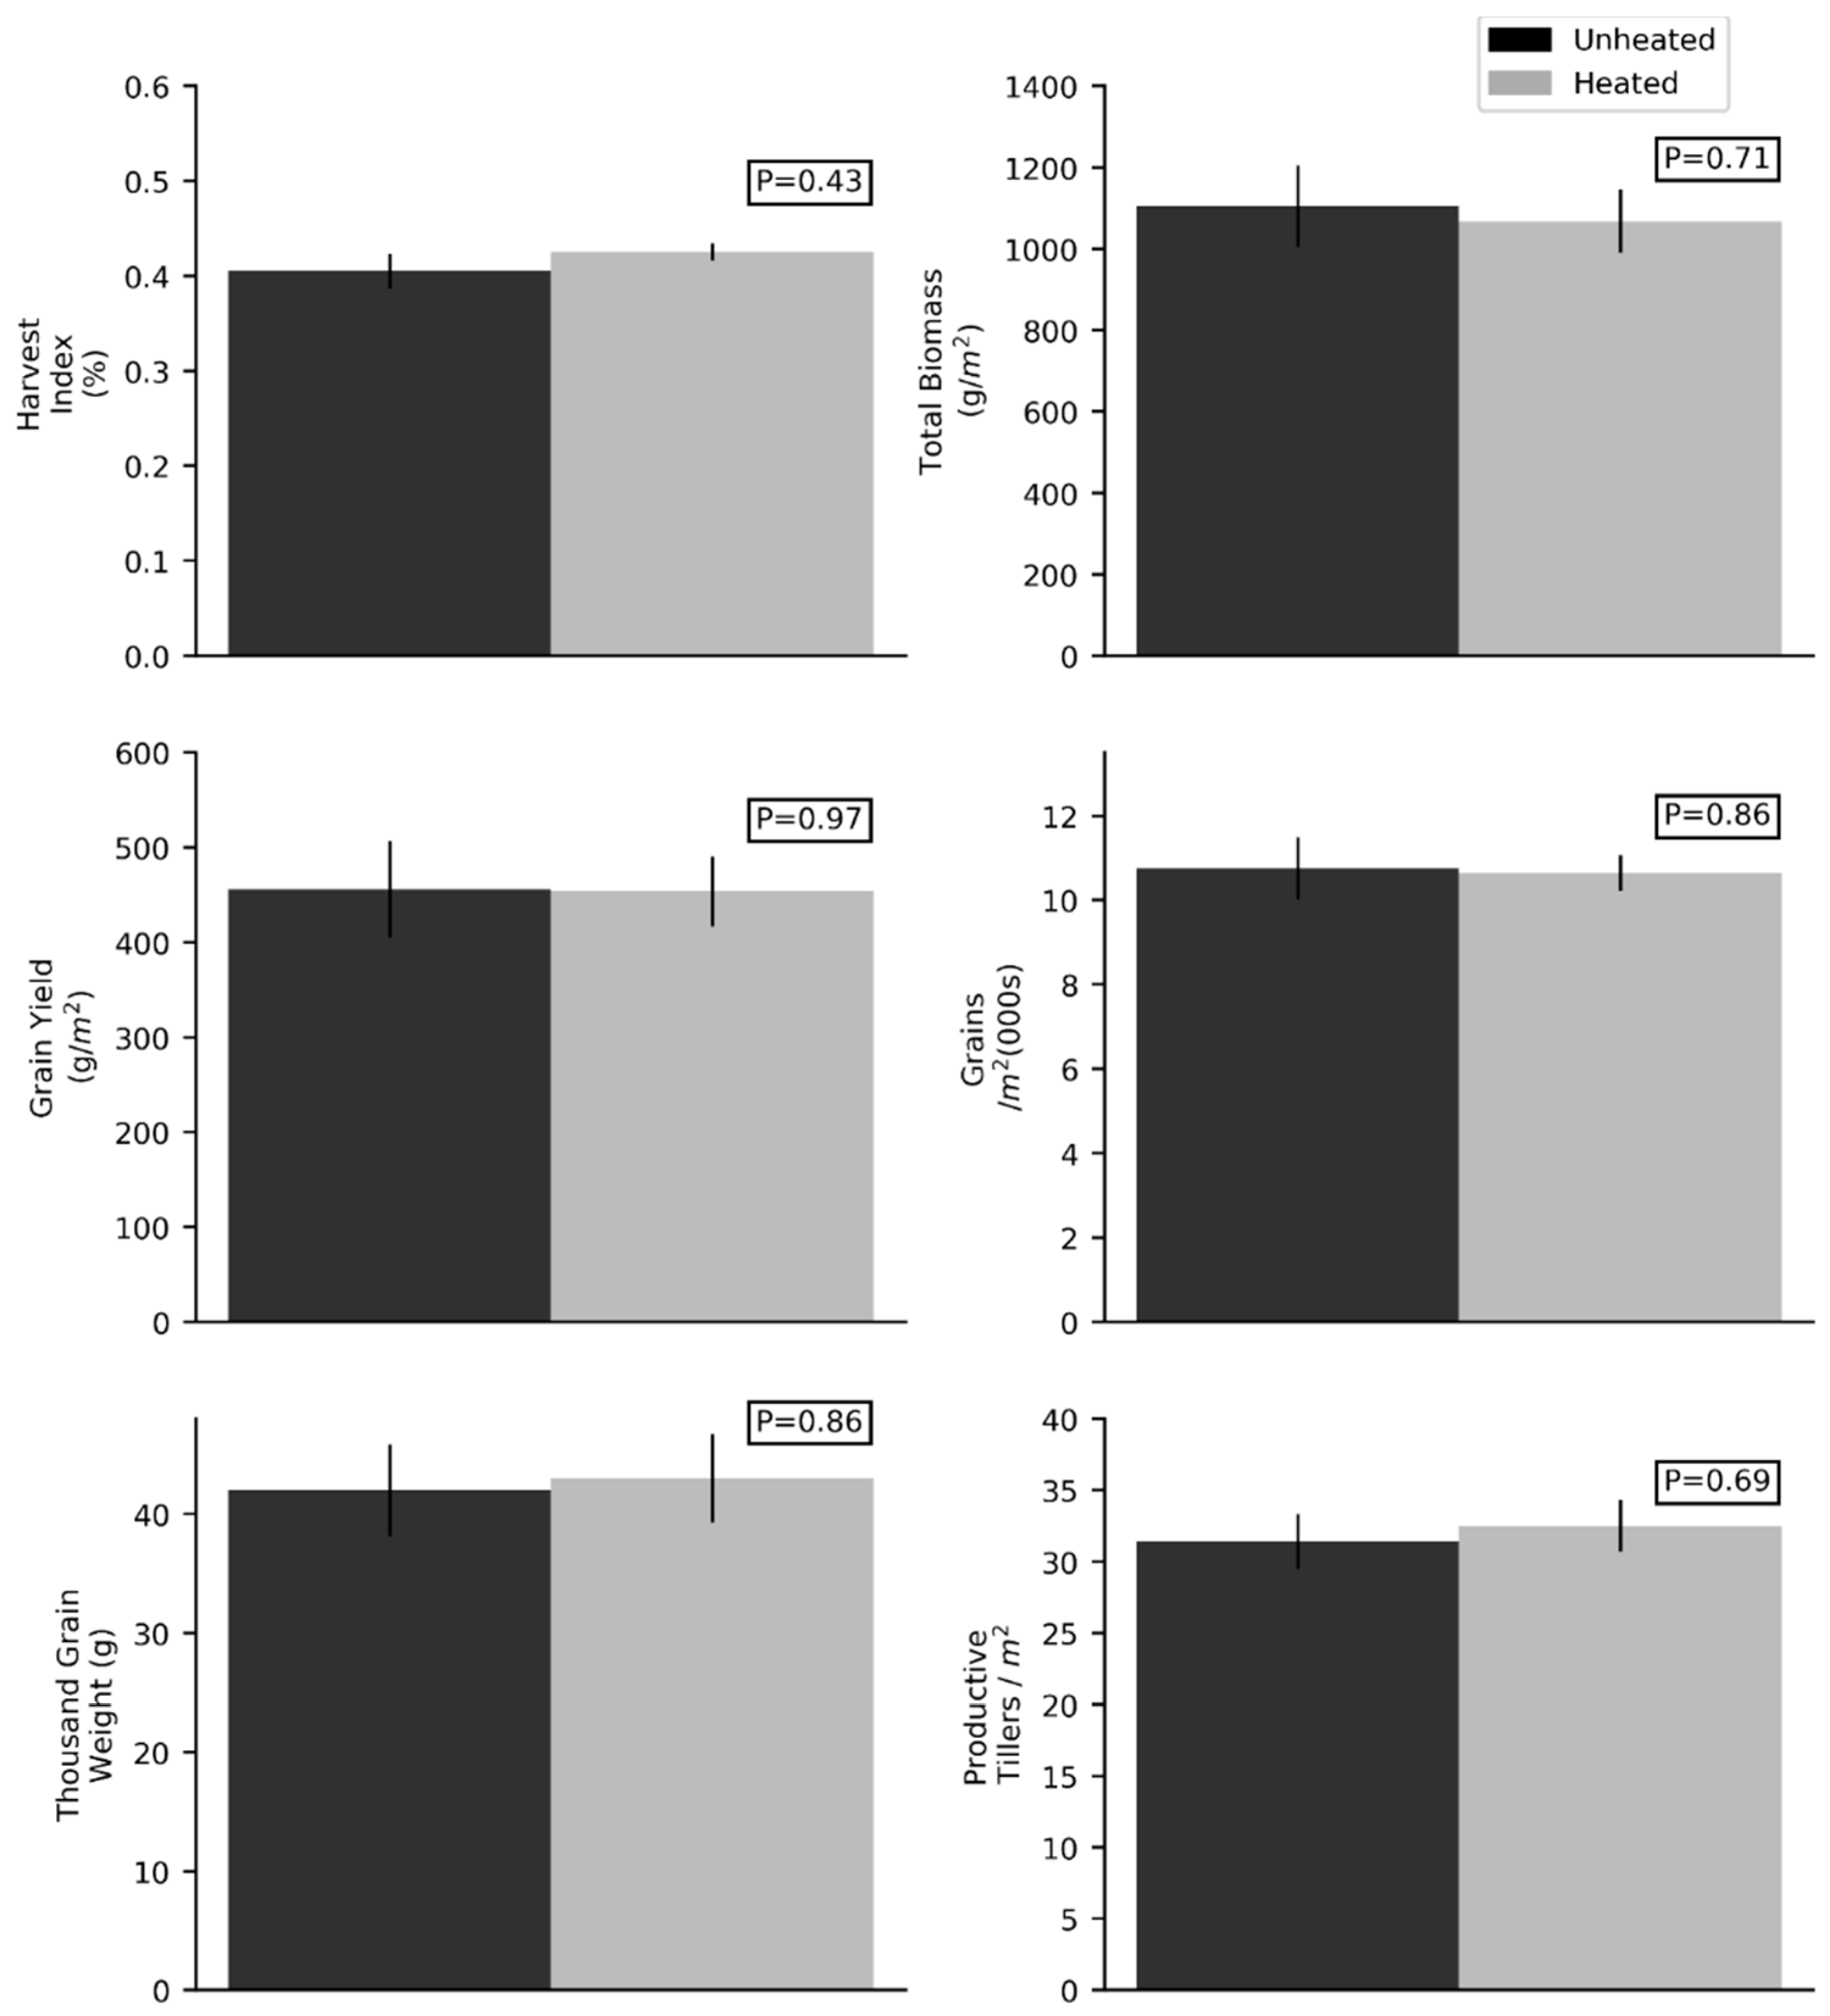
3.3. Wheat Growth and Harvest Results for Heated vs Unheated Plots

Harvest and phenology data is compared for the heated and non-heated plots in 2017 to understand if the heaters had an impact on plant growth. Zadok scores for phenological stage where similar between the heated and ambient plots (Table 2), demonstrating that there was no gross change in phenology caused by the plot heaters.
While the 2017 season presented the opportunity to capture data on the heaters ability to keep CT above zero, as sub-zero temperatures occurred at the site on several occasions; these events did not result in measurable frost damage to the inflorescence of the wheat in ToS 3 to 7, as estimated by FS across each ToS where the heaters where located (Figure 8).
FS had a maximum mean value of 10.25% and mean of 6.6% across Wyalkatchem and Elmore in ToS 3 to 7 in 2017 (Figure 8). Frost damage is not considered to have occurred until FS is significantly above 10%. As there was no frost damage in the ToS where the heaters were located harvest data in the heated plots could be compared to the non-heated plots in each ToS to understand if they were impacting plant growth. In comparison FS in 2018, in ToS 5, in the replicate of Wyalkatchem that did not have a plot heater was 71.5%.
For the harvest data, there were no significant differences (p ≥ 0.05) for the main effects of heating, variety or time of sowing, or for the interaction between heating and variety (Table 3). The means of the harvest components, for the heated plot and equivalent mirror plot are presented in Figure 9. Therefore, the heaters did not alter the overall productivity of the wheat, in the absence of frost damage.

4. Discussion

This study shows how diesel heaters, which use a fuel of a relatively high energy density, in a form that is inexpensive, stable, and easily manageable, can be used in field to prevent plants from freezing, by demonstrating that CT and air temperature remain >0 °C in the heated plots while ambient temperatures drop below.

4.1. Heater Design and Operation Parameter Considerations

As this study presents a successful protype, the design of the protype is discussed along with recommendations for future development and use.
Preliminary testing indicated the optimum parameter for triggering the heaters was 2 °C at canopy height. As this allowed sufficient time for the heater to go through its ignition sequence and still maintain CT > 0 °C. Switching the heater off at CT of 4 °C allowed the heater to build up a high internal temperature to ensure that soot and carbon build up in the heater turbine did not become a problem. This is a common issue with these units when not run at full capacity. These temperatures appeared to be the best compromise between preventing frost and not allowing the device to run for long periods of time, which reduced the frequency at which the heaters had to be refueled.
The variability in CT (measured by infrared using the Arducrops), at which the heater appeared to turn on and off in 2017 is likely explained by the fact that the heaters were set to trigger by the air temperature (PT-100 temperature probe), the accuracy of the probe (~1 °C), the calibration of the probe, and that the probe had different thermal properties to plant tissue. In frost events minimum plant temperature can be typically ~1 to 3 °C colder than canopy air temperature measured by exposed temperature probes [4]. However, this is relatively poorly studied, and the relationship likely changes based on location in the canopy AGL, due to the vertical temperature profile that develops in wheat during frost [52]. The vertical temperature profile in these environments also means that if the crop has grown above the probe and the probe has not been moved vertically it could be as much as 2 °C warmer than CT. Therefore the temperature probe should be regularly repositioned to be within ~200 mm of top of the ear. Measuring air temperature as well as CT within the heated plots in 2017 may have improved this understanding, but this was not done as the aim of the protype was to keep CT above freezing.
Heater three had a longer duration of heating and a larger range in CT from trigger to target temperature, compared with heaters one and two. This was likely driven by the fact that heater three was the original design and had a different brand of diesel heater and temperature controller. This could only be calibrated to whole degrees whereas the others were programable to tenths of a degree allowing for greater accuracy in the trigger and target temperature and when calibrating the temperature controller in field.
The 2018 thermocouple data further confirmed the heaters ability to keep temperature within the crop above zero during severe frost. Having the thermocouples at fixed 200 mm intervals throughout the crop showed that while air temperature within the canopy at 600 mm was maintained above 1.5 °C, it dropped to −0.8 °C above the canopy at 800 mm AGL, this was likely caused by the turbulent mixing of air above the crop surface. Showing the heaters are only effective within the crop.
The 2018 air temperature data also gives a more accurate indication of the heater running time than CT as recorded by the Arducrops in 2017, as the thermocouples respond more rapidly to changes in temperature due to their small thermal mass and, as the heaters are set to trigger based on air temperature not CT demonstrating the heating interval is ~10 min.

4.2. Extent of Heater Impact

The major criticism for heated fan method has been the issue of controlling their extent of impact on surround plots [29]. This was addressed in this diesel plot heater by designing the manifold to focus the dispersion of the warm air within the rows, as the presence of the wheat was thought to reduce air movement close to ground level. As radiant frost develops under still conditions, it was observed that the hot air diffused through the small holes facing upwards and rose vertically. The effectiveness of this plot heater method will need to be tested in cropping environments where soil freezing drives turbulence within the crop during frost [34].
The localized impact of the heaters on relative CT was demonstrated by the drone thermal images captured above the heaters, which showed that the heated area was constrained to the rows and plants in close proximity to the manifold and not to adjacent plots.

4.3. Impact on Plant Growth and Development

By comparing Zadok scores and yield components between the heated and adjacent non-heated plots we show that there was no effect of the heaters on plant growth and development (other than preventing frost). This demonstrates that they provide an effect way to compare between frosted and non-frosted plants without confounding results. Harvest data could be compared between the heated and ambient plots in 2017, as frost events at the site did not result in measurable frost damage. The lack of damage is likely attributed to the relative minor nature of the frost events experienced.
As the varieties used in this study were spring wheats with the main control on phenology being thermal time accumulation, the heaters were installed after floral initiation at ~ Z37–45 to prevent changing the accumulation of vernalization temperatures. The lack of difference in phenology between heated and non-heated plots demonstrated that the heaters were not causing any large changes in thermal time accumulation, as they only ran on nights with CT <2 °C and had short durations of heating. It should be noted that use of the heaters in vernalization responsive varieties prior to floral initiation or for longer durations in spring wheats may cause small changes through reduced vernalization temperatures or more rapid thermal time accumulation.
It is unlikely that the heaters would have caused any significant CO2 enrichment to the crop as they were only triggered at night when the crops where respiring. The relatively short (~10 min) duration of heating (short burst of exhaust gases), and the fact that CO2 is denser than air, and would likely drain away through the intercrop rows also makes it unlikely that CO2 enrichment to the crops would be an issue.

4.4. Advantages of a Plot Heater That Is Automated and Uses Diesel Heating and Its Application to Future Research

Currently in field frost research it is difficult to determine the impact of a single frost event as damaged heads need to develop in field for minimum of 7–14 days following a frost event to understand the extent of the damage [29]. It is rare for severe frost to occur as a single event, generally such frosts are the result of persistent high pressure systems which result in two or three successive frost nights [42] (2016 fieldsite data), these subsequent frosts mean that only cumulative effects can be understood. The mobility of the design means that for the first time the impact of individual frost events can be elucidated in the field by placing heaters into a plot on different occasions. For example, a heater could be deployed before the first frost to create an unfrosted control, and then another could be placed into a frost damaged plot after this to allow plant damage to be tracked across time without the confounding impact of further frost. In a similar way, the effect of multiple frosts across key development stages could also be determined.
To account for the damage caused by successive frost, Martino et al. [53] recently proposed a model using heat transfer in the wheat head, this plot heater method could be used to test this model. Being able to confirm and identify damage from a single event would allow a better understanding of temperature-damage-yield relationship in that the reduction in grain number per event could be determined.
The addition of this plot heater method to future research would also allow for a reliable comparison between frosted and non-frost plants immediately after a frost event before damage is visually identifiable. The need for a unfrosted control in these studies was recognized by Perry et al. [54] (p. 254), who stated “In order to acquire this data, experiments must be designed to induce frost damage and/or protect control plants from frost”. Making these heaters useful in studies to assess plant response to frost damage by collection of infield and remotely sensed data prior to damage being visually apparent [54].
This plot heater design addresses some of the significant limitations of previous attempts because it is mobile, modular, and automatically triggered.
The automated and flat to the ground nature of the design eliminates any shading effects, unlike traditional frost shelters, so it can remain in the field for the duration of the frost season. This removes the issue of crop damage that occurs from repeated human traffic to install and remove shelters. The automation also means the heater responds to local air temperature and is not dependent on frost forecast or labor to replace and remove a shelter. Having the unit automatically trigger on local plot canopy temperature also means that researchers using the heaters can address spatial and temporal variation in frost severity and duration across trial sites.
The ability of the heater to be switched on and off electronically and lack of mechanical moving parts, when compared to shelters such as discussed in Frederiks et al. [29], means it is less prone to failure. The modular nature of the design also means that in the unlikely case of a failure only a single replicate is affected and there are no moving parts to damage the crop or cloth to produce shading meaning the heater can be repaired and the treatment salvaged in the absence of frost.

4.5. Limitations

As the design process was iterative the successful protype presented here contains design elements carried over from earlier prototypes, such as the hole spacing on the manifolds and battery size, and these could be more efficiently designed in the future. For use in future research we also suggest that the PVC manifold could be connected to the heater using flexible piping, all manifold components be sealed with a heat rated sealant and for areas of severe frost winter diesel or kerosene be considered, as it may prevent the fuel solidifying.
The deployment of the heater in 2018 by another project provided further data to demonstrate that the heater worked effectively to keep air temperature above freezing. Unfortunately, in 2018 the heaters were removed before the last damaging frost, therefore FS and yield components could not be compared between heated and non-heated plots, to further validate the heaters lack of impact on plant growth. Confirming this further and validation of this protype under repeated frosts will be the focus of ongoing work.

5. Conclusions

This study demonstrated how a small (2 kW) space heater can be used to provide an effective, automated, mobile, modular, and economical unfrosted control treatment for field frost research in cereals. Our design meets a critical need as field trials are a necessary and essential component of frost research, but they have been limited by the inability to prevent frost and provide an adequate unfrosted control without artefacts and significant confounding effects.
The plot heater method builds on limitations of previous attempts in that it effectively keeps plant canopy and air temperature above 0 °C in the heated plot while not appearing to change plant growth and development. As it is modular and fully automated it can be incorporated into randomized experimental design at trial sites without reliance on frost forecasts or labor availability. By exploiting the energy density of diesel fuel the design remains light weight enough to be mobile offering flexibility in duration and location of frost exclusion throughout a field season. It is also affordable costing ~$ 1400 USD, making it a feasible option for field crop research. Providing a significant advancement for field frost research especially at remote trial sites where automated unfrosted control treatments can now be included in experimental design to allow for more robust results from natural field frosts.

Author Contributions

B.C. conceived of the idea for the design and led construction, with additional protypes built and tested by J.N.C. and B.M.S. B.M.S. designed and led the 2017 field experiment and data collection with support from J.N.C. K.F. provide statistical analysis and interpretation of results. T.B.B. provided design suggestions and interpretation of results. B.L. provided 2018 field data. B.M.S. led the manuscript writing and all authors contributed to editing and revision.

Funding

This work was funded by the Grains Research and Development Corporation (GRDC), National Frost Initiative, Project CSP00198 “Spatial temperature measurement and mapping tools to assist growers, advisers and extension specialists manage frost risk at farm scale”.

Acknowledgments

Thank you to landowner Bill Cleland, DPIRD staff Nathan Height and Mike Baker for trial site management and, Rebecca Smith, Living Farm for support in establishing and managing the field trial site. Peter Hanson maintained the onsite weather station data service and monitoring. The lead author was supported by an Australia Government Research Training Program (RTP) award, and GRDC PhD top-up award.

Conflicts of Interest

The authors declare no conflicts of interest. The funding sponsors had no role in study design, data collection and analysis, decision to publish, or preparation of the manuscript.

References

  1. Paulsen, G.M.; Heyne, E.G. Grain Production of Winter Wheat after Spring Freeze Injury. Agron. J. 1983, 75, 705–707. [Google Scholar] [CrossRef]
  2. Boer, R.; Campbell, L.; Fletcher, D.; Campbella, A.L.C.; David, J.; Hill, P. Characteristics of Frost in a Major Wheat-growing Region of Australia. Aust. J. Agric. Res. 1993, 44, 1731–1743. [Google Scholar] [CrossRef]
  3. Zheng, B.; Chapman, S.C.; Christopher, J.T.; Frederiks, T.M.; Chenu, K. Frost trends and their estimated impact on yield in the Australian wheatbelt. J. Exp. Bot. 2015, 66, 3611–3623. [Google Scholar] [CrossRef] [PubMed] [Green Version]
  4. Frederiks, T.M.; Christopher, J.T.; Sutherland, M.W.; Borrell, A.K. Post-head-emergence frost in wheat and barley: Defining the problem, assessing the damage, and identifying resistance. J. Exp. Bot. 2015, 66, 3487–3498. [Google Scholar] [CrossRef] [PubMed]
  5. Shroyer, J.P.; Mikesell, M.E.; Paulsen, G.M. Spring Freeze Injury to Kansas Wheat; Kansas State University: Manhattan, Kansas, 1995. [Google Scholar]
  6. Cromey, M.G.; Wright, D.S.C.; Boddington, H.J. Effects of frost during grain filling on wheat yield and grain structure. New Zeal. J. Crop Hortic. Sci. 1998, 26, 279–290. [Google Scholar] [CrossRef] [Green Version]
  7. Sadras, V.O.; Monzon, J.P. Modelled wheat phenology captures rising temperature trends: Shortened time to flowering and maturity in Australia and Argentina. F. Crop. Res. 2006, 99, 136–146. [Google Scholar] [CrossRef]
  8. Maqbool, A.; Shafiq, S.; Lake, L. Radiant frost tolerance in pulse crops—A review. Euphytica 2010, 172, 1–12. [Google Scholar] [CrossRef]
  9. Gu, L.; Hanson, P.J.; Mac Post, W.; Kaiser, D.P.; Yang, B.; Nemani, R.; Pallardy, S.G.; Meyers, T. The 2007 Eastern US Spring Freeze: Increased Cold Damage in a Warming World? Bioscience 2008, 58, 253–262. [Google Scholar] [CrossRef] [Green Version]
  10. Gomez, D.; Vanzetti, L.; Helguera, M.; Lombardo, L.; Fraschina, J.; Miralles, D.J. Effect of Vrn-1, Ppd-1 genes and earliness per se on heading time in Argentinean bread wheat cultivars. F. Crop. Res. 2014, 158, 73–81. [Google Scholar] [CrossRef]
  11. Knights, S.; Belford, B.; Juttner, J. GRDC ’s National Frost Initiative—Update February 2017. In Proceedings of the GRDC Grains Research Update, Crown Perth, WA, USA, 25–26 February 2019. [Google Scholar]
  12. March, T.; Knights, S.; Biddulph, B.; Ogbonnaya, F.; Maccallum, R.; Belford, R. The GRDC National Frost Initiative. In Proceedings of the GRDC Update Papers, Adelaide, Australia, 12–13 February 2019. [Google Scholar]
  13. Juttner, J. Frost: Turning Up the Heat on Frost in Cereals. GroundCoverTM. Canberra March 2014. pp. 12–13. Available online: https://grdc.com.au/resources-and-publications/groundcover/ground-cover supplements/gcs109 (accessed on 20 January 2019).
  14. Livingston, J.E.; Swinbank, J.C. Some Factors Influencing the Injury to Winter Wheat Heads by Low Temperatures. Agron. J. 1950, 42, 153–157. [Google Scholar] [CrossRef]
  15. Single, W.V. Studies on Frost Injury to Wheat I: Laboratory Freezing Tests In Relation to the Behaviour of Varieties in the Field. Crop Pasture Sci. 1961, 12, 767–782. [Google Scholar] [CrossRef]
  16. Marcellos, H.; Single, W.V. Frost Injury in Wheat Ears After Ear Emergence. Aust. J. Plant Physiol. 1984, 11, 7. [Google Scholar] [CrossRef]
  17. Single, W.V. Studies on frost injury to wheat. III. Screening of Varieties for Resistance to Ear and Stem Frosting. Crop Pasture Sci. 1966, 17, 601–610. [Google Scholar] [CrossRef]
  18. Single, W.V.; Marcellos, H. Studies on frost injury to wheat. IV.* Freezing of ears after emergence from the leaf sheath. Aust. J. Agric. Res. 1974, 25, 679–686. [Google Scholar] [CrossRef]
  19. Fuller, M.P.; Fuller, A.M.; Kaniouras, S.; Christophers, J.; Fredericks, T. The freezing characteristics of wheat at ear emergence. Eur. J. Agron. 2007, 26, 435–441. [Google Scholar] [CrossRef]
  20. Lindow, S.E.; Arny, D.C.; Upper, C.D. Bacterial Ice Nucleation: A Factor in Frost Injury to Plants. Plant Physiol. 1982, 70, 1084–1089. [Google Scholar] [CrossRef] [PubMed] [Green Version]
  21. March, T.; Laws, M.; Eckermann, P.; Reinheimer, J.; Biddulph, B.; Eglinton, J. Frost Tolerance: Identifying Robust Varieties; GRDC: Adelaide, Australia, 2013. [Google Scholar]
  22. Knell, G. On Farm Evaluation of Frost Minimisation Techniques and Risk Management Strategies; Canberra. 2007. Available online: https://grdc.com.au/research/reports/report?id=53 (accessed on 20 January 2019).
  23. Smith, R.; Minkey, D.; Butcher, T.; Hyde, S.; Jackson, S.; Reeves, K.; Biddulph, B. Stubble management recommendations and limitations for frost prone landscapes. In Proceedings of the GRDC Grains Research Update, Crown Perth, WA, USA, 25–26 February 2019. [Google Scholar]
  24. Rebbeck, M.; Knell, G.; Lynch, C.; Faulkner, M. Agronomic Practices to Reduce Frost Risk, Managing Frost Risk A Guide for Southern Australian Grains. Canberra. 2007. Available online: https://grdc.com.au/resources-and-publications/all-publications/bookshop/2007/06/managing-frost-risk-a-guide-for-southern-australian-grains (accessed on 20 January 2019).
  25. Al-Issawi, M.; Rihan, H.Z.; El-Sarkassy, N.; Fuller, M.P. Frost Hardiness Expression and Characterisation in Wheat at Ear Emergence. J. Agron. Crop Sci. 2013, 199, 66–74. [Google Scholar] [CrossRef]
  26. Marcellos, H. A Plant Freezing Chamber with Radiative and Convective Energy Exchange. J. Agric. Eng. Res. 1981, 26, 403–408. [Google Scholar] [CrossRef]
  27. Fuller, M.P.; Le Grice, P. A chamber for the simulation of radiation freezing of plants. Ann. Appl. Biol. 1998, 133, 111–121. [Google Scholar] [CrossRef]
  28. Fuller, M.P.; Christopher, J.; Frederiks, T.M. Low-temperature Damage to Wheat in Head—Matching Perceptions with Reality. In The Plant Cold Hardiness from the Laboratory to the Field; Gusta, L.V., Wisniewski, M.E., Tanino, K.K., Eds.; CAB International: Wallingford, UK, 2009; pp. 12–18. [Google Scholar]
  29. Frederiks, T.M.; Christopher, J.T.T.; Harvey, G.L.L.; Sutherland, M.W.W.; Borrell, A.K. Current and emerging screening methods to identify post-head-emergence frost adaptation in wheat and barley. J. Exp. Bot. 2012, 63, 5405–5416. [Google Scholar] [CrossRef] [PubMed] [Green Version]
  30. Hocevar, A.; Martsolf, J.D. Temperature distribution under radiation frost conditions in a central Pennsylvania valley. Agric. Meteorol. 1971, 8, 371–383. [Google Scholar] [CrossRef]
  31. Hogg, W. Frequency of Radiation and Wind Frosts During Spring in Kent. Meteorol. Mag. 1950, 79, 42–49. [Google Scholar]
  32. Lawrence, E. Frost Investigations. Meteorol. Mag. 1952, 81, 65–74. [Google Scholar]
  33. Marcellos, H.; Single, W.V. Ice Nucleation on Wheat. Agric. Meteorol. 1976, 16, 125–129. [Google Scholar] [CrossRef]
  34. Livingston, D.P.; Tuong, T.D.; Murphy, J.P.; Gusta, L.V.; Willick, I.; Wisniewski, M.E. High-definition infrared thermography of ice nucleation and propagation in wheat under natural frost conditions and controlled freezing. Planta 2018, 247, 791–806. [Google Scholar] [CrossRef] [PubMed]
  35. Single, W.V. Resistance to frost injury during stem elongation and early heading. In The Improvement and Management of Winter Cereals under Temperature, Drought and Salinity Stresses; Acevedo, E., Ed.; International Symposium ICARDA: Córdoba, Spain, 1991; pp. 131–141. [Google Scholar]
  36. Snyder, R.; De Paulo Melo-Abreu, J.; Matulich, S. Frost Protection: Fundamentals, Practice, and Economics Volume 1 and 2; Food and Agriculture Organization of the United Nations: Rome, Italy, 2005. [Google Scholar]
  37. Ribeiro, A.C.; De Melo-Abreu, J.P.; Snyder, R.L. Apple orchard frost protection with wind machine operation. Agric. For. Meteorol. 2006, 141, 71–81. [Google Scholar] [CrossRef]
  38. Ballard, J.K.; Proebsting, E.L. Frost and Frost Control in Washington Orchards; Washington State University: Pullman, WA, USA, 1972; pp. 2–27. [Google Scholar]
  39. Nuttall, J.G.; Perry, E.M.; Delahunty, A.J.; Leary, G.J.O.; Barlow, K.M.; Wallace, A.J. Frost response in wheat and early detection using proximal sensors. J. Agron. Crop Sci. 2018, 1–15. [Google Scholar] [CrossRef]
  40. Gusta, L.; Wisniewski, M.; Trischuk, R. Patterns of freezing in plants: The influence of species, environment and experiential procedures. In Plant Cold Hardiness from Laboratory to the Field; Gusta, L.V., Wisniewski, M.E., Tanino, K.K., Eds.; CAB International: Wallingford, UK, 2009; pp. 214–222. [Google Scholar]
  41. Leske, B.; Nicol, D.; Biddulph, B. Optimising sowing time in frost prone environments is key to unlocking yield potential of wheat. In Proceedings of the 18th Australian Society of Agronomy Conference, Ballarat, Australia, 24–28 September 2017; Australian Society of Agronomy: Ballarat, Australia, 2017; pp. 1–4. [Google Scholar]
  42. Grose, M.R.; Black, M.; Risbey, J.S.; Uhe, P.; Hope, P.K.; Haustein, K.; Mitchel, D. Severe Frosts in Western Australia in September 2016. In Explaining Extreme Events of 2016 from a Climate Perspective; Herring, S.C., Christidis, N., Hoell, A., Kossin, J.P., Schreck, C.J., III, Stott, P.A., Eds.; American Meteorological Society: Boston, MA, USA, 2016; p. 97. [Google Scholar]
  43. Crimp, S.; Bakar, K.S.; Kokic, P.; Jin, H.; Nicholls, N.; Howden, M. Bayesian space-time model to analyse frost risk for agriculture in Southeast Australia. Int. J. Climatol. 2014, 35, 2092–2108. [Google Scholar] [CrossRef] [Green Version]
  44. Diesel Heat Belief 2KW air heater. Available online: http://www.dieselheat.com.au/belief-2kw-air-parking-heater/ (accessed on 20 January 2019).
  45. O’Shaughnessy, S.A.; Hebel, M.A.; Evett, S.R.; Colaizzi, P.D. Evaluation of a wireless infrared thermometer with a narrow field of view. Comput. Electron. Agric. 2011, 76, 59–68. [Google Scholar] [CrossRef] [Green Version]
  46. Ribeiro-Gomes, K.; Hernández-López, D.; Ortega, J.; Ballesteros, R.; Poblete, T.; Moreno, M. Uncooled Thermal Camera Calibration and Optimization of the Photogrammetry Process for UAV Applications in Agriculture. Sensors 2017, 17, 2173. [Google Scholar] [CrossRef]
  47. Woodruff, D.; Tonks, J. Relationship between Time of anthesis and grain yield of winter genotypes with differing developmental patterns. Aust. J. Agric. Res. 1983, 34, 1–11. [Google Scholar] [CrossRef]
  48. Zadoks, J.C.; Chang, T.T.; Konzak, C.F. A Decimal Code for the Growth Stages of Cereals. Weed Res. 1974, 14, 415–421. [Google Scholar] [CrossRef]
  49. Reinheimer, J.L.; Barr, A.R.; Eglinton, J.K. QTL mapping of chromosomal regions conferring reproductive frost tolerance in barley (Hordeum vulgare L.). Theor. Appl. Genet. 2004, 109, 1267–1274. [Google Scholar] [CrossRef] [PubMed]
  50. Pietragalla, J.; Pask, A. Grain yield and yield components. In Physiological Breeding II: A Field Guide to Wheat Phenotyping; Pask, A., Pietragalla, J., Mullan, D., Reynolds, M.P., Eds.; International Maize and Wheat Improvement Centre: El Batán, Mexico, 2012; pp. 95–103. ISBN 978-970-648-182-5. [Google Scholar]
  51. Pinheiro, J.; Bates, D.; DebRoy, S.; Sarkar, D.; R Core Team. Linear and Nonlinear Mixed Effects Models 2018. Available online: https://www.r-project.org/ (accessed on 20 January 2019).
  52. Marcellos, H.; Single, W.V. Temperatures in wheat during radiation frost. Aust. J. Exp. Agric. Anim. Husb. 1975, 15, 818–822. [Google Scholar] [CrossRef]
  53. Martino, D.L.; Abbate, P.E. Frost damage on grain number in wheat at different spike developmental stages and its modelling. Eur. J. Agron. 2019, 103, 13–23. [Google Scholar] [CrossRef]
  54. Perry, E.M.; Nuttall, J.G.; Wallace, A.J.; Fitzgerald, G.J. In-field methods for rapid detection of frost damage in Australian dryland wheat during the reproductive and grain- filling phase. Crop Pasture Sci. 2017, 516–526. [Google Scholar] [CrossRef]
Figure 1. (a) Image of the air diffuser manifold (PVC pipes). (b) Image of heater set up inside of the waterproof casing. (c) Diesel plot heater diagram (plan view); A. Air diffuser manifold (PVC pipes) (note that while pipes are drawn to the same length pipes two and four are slightly longer due to the piece used to attach theses pipes to the manifold base), B. Waterproof casing with lid, C. 12 V 2 KW diesel caravan air heater, D. 5 L diesel fuel canister, E. PT-100 temperature probe (at flag leaf height) and 12 V DC digital thermostat temperature controller, F. 120 Ah 12 V AGM battery, G. Victron BlueSolar MPPT 75/15 solar charge controller, H. 12 V 120W solar panel. Note: green lines are where the rows of wheat would be within the plot.
Agronomy 09 00096 g001
Figure 2. Diesel plot heater set up in a plot at the Dale frost nursery.
Agronomy 09 00096 g002
Figure 3. Plot layout at the Dale trial site with the first and second location of heater one (H-1), heater two (H-2) and heater three (H-3) is shown.
Agronomy 09 00096 g003
Figure 4. Dale weather station data for the 3 September and 6 October 2017 and 15, 16 September 2018, with light blue dotted line at 2 °C and 0 °C to show how frost is categorized at screen height. Note: In 2017 the weather station thermocouple was at 600 mm AGL and at 500 mm AGL in 2018.
Agronomy 09 00096 g004
Figure 5. Canopy temperature recorded by thermal infrared Arducrop® (10° FOV) for the heated plot (solid line) and equivalent unheated plot (dashed line) on 3 September 2017 (A,C, and E) and 6 October 2017 (B,D, and F) for heaters number one (A,B), two (C,D) and three (E,F).
Agronomy 09 00096 g005
Figure 6. Air temperature record by T-Type thermocouples at 400, 600 and 800 mm AGL for the heated plot (solid line) and adjacent unheated plot (dashed line) on 15 September (A,C,E,G,I, and K) and 16 September 2018 (B,D,F,H,J, and L) for heaters number two (AF) and three (GL). Note heater 1 not deployed in 2018.
Agronomy 09 00096 g006
Figure 7. Thermal image captured by a drone-mounted FLIR Tau 2 640 25 mm camera above each heater between 6:17 to 6:21 am on 27 September 2017. (A) Heater one in ToS 7 (Wyalkatchem), (B) Heater two in ToS 5 (Wyalkatchem) and, (C) Heater three in ToS7 (Elmore). Note: The square areas with temperature ≥10 °C behind the heaters correspond components of the plot heaters (solar panel and waterproof box), and the area above heater three is a thermal ground control target panel.
Agronomy 09 00096 g007
Figure 8. Mean FS in ToS 3,4,5 and 7 for both Wyalkatchem and Elmore in 2017, with standard error bars of the mean (n = 90, 30 heads from each replicate, 3 replicates per ToS).
Agronomy 09 00096 g008
Figure 9. Mean HI, total biomass(g/m2), grain yield (g/m2), number of grains per m2, thousand grain weight and number of productive tillers per m2 for the 6 heated plots and non-heated mirror plots for 2017, with error bars representing standard error of the mean. p-value results from a paired t-test are report for the difference between the means. (n = 6).
Agronomy 09 00096 g009
Table 1. Crop canopy height in heated plots in 2017 and 2018.
Heater Number~Height to Top of Ear (mm)
3 September
1960
2760
3930
6 October
1700
2800
3800
15 and 16 September
2680
3680
Table 2. Zadok scores for heated plots and whole ToS in 2017.
Heater NumberToSVarietyZadok Score Heated plotZadok Score 1 Range for Variety across the ToS
3 September
13ElmoreZ 67Z 67–69
24WyalkatchemZ 61Z 60–63
33WyalkatchemZ 67Z 65–68
6 October
17WyalkatchemZ 69Z 67–69
25WyalkatchemZ 70Z 70
37ElmoreZ 69Z 69
1 Z 60–63 (start of anthesis); Z 65 (middle of anthesis); Z 68–70 (late anthesis to milk development) and Z > 70 (milk development or later).
Table 3. p-value result from the linear mixed model associated with heating, variety, and ToS in 2017.
Harvest ParameterHeating (H)Variety (V)ToSInteraction H × V
Total biomass0.620.270.290.81
Grain yield0.960.390.550.96
Harvest index0.090.591.000.19
Thousand grain weight0.100.080.150.63
Productive tillers0.690.890.920.87

