Article

Selection of Salicylic Acid Tolerant Epilines in Brassica napus

1
BASF Agricultural Solutions Belgium NV, Technologiepark 38, 9052 Ghent, Belgium
2
Centre for Microbial & Plant Genetics, Department Microbial & Molecular Systems, University of Leuven, Kasteelpark Arenberg 20, 3001 Leuven, Belgium
*
Author to whom correspondence should be addressed.
Agronomy 2019, 9(2), 92; https://doi.org/10.3390/agronomy9020092
Submission received: 21 December 2018 / Revised: 18 January 2019 / Accepted: 14 February 2019 / Published: 18 February 2019
(This article belongs to the Special Issue The Regulatory Functions of Epigenetic Mechanisms in Plants)

Abstract

:
Two of the major pathways involved in induced defense of plants against pathogens include the salicylic acid (SA)- and jasmonic acid (JA)-mediated pathways that act mainly against biotrophs and necrotrophs, respectively. However, some necrotrophic pathogens, such as Botrytis cinerea, actively induce the SA pathway, resulting in cell death that allows the pathogen to proliferate in the plant. Starting from an isogenic canola (Brassica napus) line, epilines were selected with a reduced sensitivity to SA. The genes belonging to the SA pathway had an altered transcription profile in the SA-tolerant lines, when treated with SA. Besides the already known genes of the SA pathway, new SA target genes were identified, creating possibilities to better understand the plant defense mechanism against pathogens. The SA-tolerant line with the lowest SA-induced gene expression is tolerant to Botrytis cinerea. When treated with SA, this line has also a reduced histone modification (histone H3 lysine 4 trimethylation) at the genes at the start of the SA pathway.

1. Introduction

Biotic stress remains one of the greatest challenges in agriculture today. It is a so-called complex trait, meaning that it is conferred by a large network of interacting genes. Plant pathogens, such as fungi, can be divided into necrotrophs, biotrophs, and hemi-biothrophs. Biotrophic pathogens exploit living host cells to continue their life cycle, whereas necrotrophs kill the cells of their hosts to feed on the cellular nutrients. However, most of the plant pathogens are hemi-biotrophic, including both a biotrophic and a necrotrophic phase in their life cycle, often in the early and late phase, respectively [1,2].
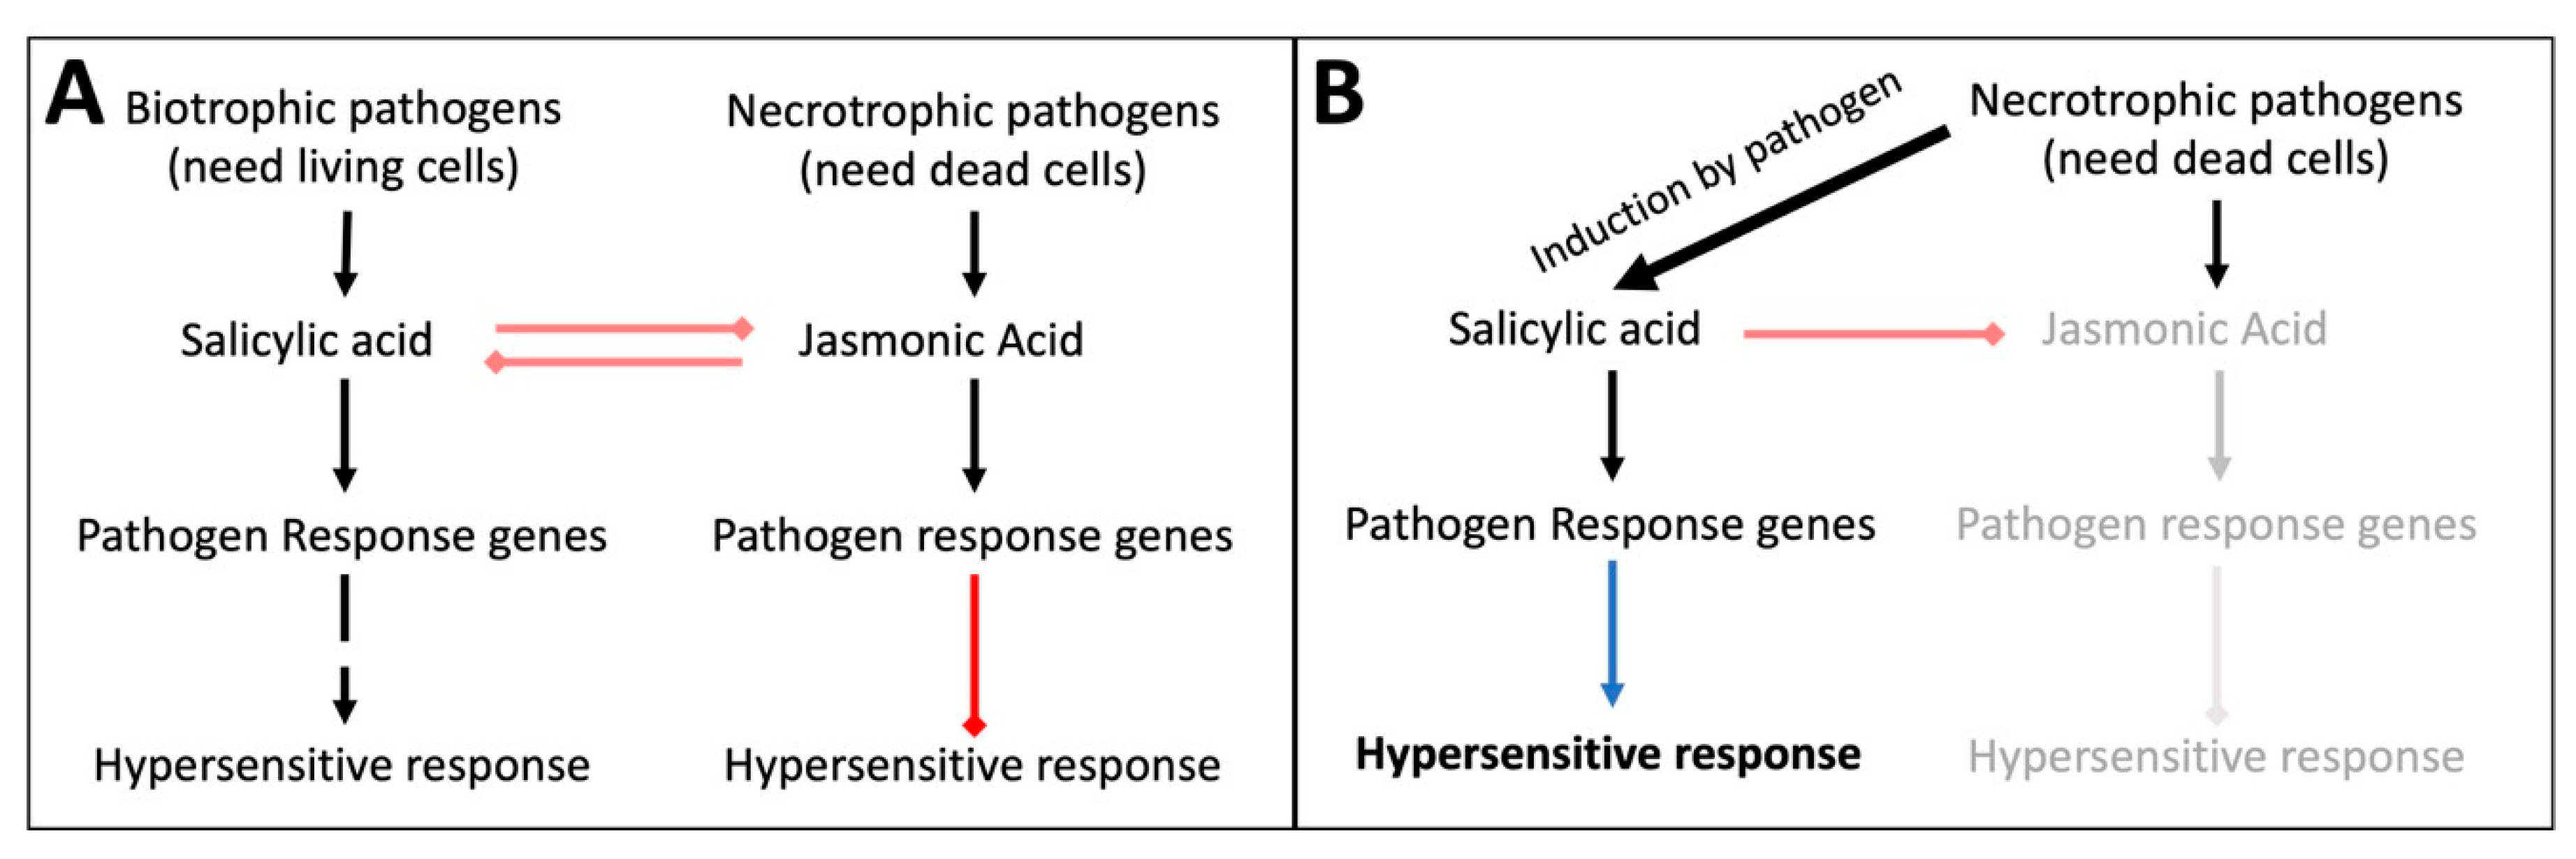
Plant innate immunity to fungi has two major pathways, the salicylic acid (SA) and the jasmonic acid (JA) pathway, induced by biotrophs and necrotrophs respectively [3,4]. Biotrophic fungi need alive host cells to feed on. When infected, the host plant activates the SA pathway, leading to the expression of specific pathogen response genes and, eventually, to hypersensitive response (HR) and local apoptosis that prevent the biotrophic fungus from spreading (Figure 1A). The central player in the SA pathway is NPR1 [5] that physically interacts with the kinases NIMIN1 and NIMIN2 [4,6] and induces transcription of transcription factors, such as WRKY70 [6,7]. The final step is the activation of pathogenesis-related (PR) genes, such as PR1 and PR2 [8,9] (Figure 2). All the genes involved are only transiently expressed, because they put a great stress on the plant. Necrotrophic pathogens will activate the JA pathway, triggering the expression of pathway-specific pathogen response genes, such as PR12 [10,11,12,13]) that lead to the suppression of HR [2] (Figure 1A).
Whereas the pathways have some mildly overlapping components, they generally repress each other to facilitate more rigid responses [7,14]. Some necrotrophic pathogens exploit the mutual exclusivity of these pathways by active induction of the SA pathway [15,16]. Thereby, they suppress the pathway that is supposed to fight them and kill host cells via HR to feed on (Figure 1B). These fungi, such as Botrytis cinerea and Sclerotinia sclerotiorum, pose a significant threat to agriculture, for instance, in canola (Brassica napus). During the infection process by these necrotrophic fungi, reactive oxygen species (ROS) are produced by the plant at the infection site. The ROS contribute to the host cell death, and as a consequence facilitate the infection and further growth of the fungi. By reducing the ROS production, the infection by necrotrophic pathogens can be inhibited [17,18,19]. Rossi et al. [19] increased the resistance of tobacco plants against the necrotrophic fungus Botrytis cinerea by overexpressing the chloroplast-targeted antioxidant protein flavodoxin. Here we describe an alternative method to combat necrotrophic fungi in Brassica napus by selecting plants with a reduced reaction to SA. In this manner, the plants become less sensitive to their own SA pathway.
To this end, we employed epigenetic rather than mutagenic selection, as previously established [20,21,22,23]. In this selection method, isogenic lines are used as starting material. From a population of about 200 plants, individual plants are selected for a specific trait as reduced respiration. The self-fertilized progenies of these plants are submitted to the same selection. These steps are repeated three times with the progenies obtained in the previous selection cycle. In this way epilines are obtained with distinct transcriptome, methylome and histone modifications. In rice epilines selected for higher energy use efficiency, the differentially expressed genes could be correlated with differential methylation and histone H3 lysine-4 trimethylation (H3K4me3) patterns [23]. In canola epilines selected for drought tolerance, the drought-responsive genes were specifically differentially expressed and had a H3K4me3 pattern facilitating the transcription of the drought-responsive genes [22]. In the three published cases, the selected properties remained stable over several generations: at least eight generations in the canola epilines [20,22] and four generations in the rice epilines [23]. Considering that defense response networks are very interconnected, mutations often are either too disruptive or are compensated by the network. An epigenetic approach is more holistic and allows the discovery of new involved genes. Additionally, this selection method can be utilized on very young seedlings, eliminating the need for a lengthy growth process.

2. Materials and Methods

2.1. Selection of Resistant Canola Lines

An isogenic line of canola (Brassica napus, Athena, property of BASF) was grown in Jiffy7® (Jiffy Product International BV, Zwijndrecht, Netherlands) in a growth chamber (21 °C, 16 h light). On day 11, plants were induced by watering the seedlings with 50 mg/L SA buffered with 0.5 g/L MES pH 5.8. After 16 h, one cotyledon per plant was sampled. Weight and ascorbate concentration were measured for every cotyledon. The 10 plants with high weight and high ascorbate concentration in the cotyledons, but falling above the 90% prediction interval of the regression line of weight versus ascorbate concentration (Supplementary Figure S1), were transferred to the greenhouse for seed production by self-fertilization (S1 generation, Figure S2). From the 10 seed lots, two were retained of which the seedlings had the highest weight and ascorbate concentration. Starting from these seed lots, a second round of selection was performed as described above. Three successive rounds of selections were done (Figure S2). After the last selection, seeds from the five highest seed producing plants were bulked (S3 generation, Figure S2). Fifty plants from the S3 generation were used for further upscaling in the greenhouse (generation S4, Figure S2). The S4 generation was used for field trials, tests for Botrytis cinearea tolerance, and gene expression studies.

2.2. Quantitative Reverse Transcription-PCR (RT-qPCR)

For the RT-qPCR, seeds from the upscaling in the greenhouse were used (generation S4, Figure S2). Total RNA was extracted from cotyledons of 12 days old seedlings with the RNeasy Plant Mini Kit (Qiagen, Antwerp, Belgium) and treated with DNase I prior to cDNA synthesis. cDNA was prepared from DNase I-treated total RNA with the iScript cDNA Synthesis Kit (Bio-Rad Laboratories NV, Temse, Belgium) according to the manufacturer’s instructions. The relative transcript abundance of selected genes (for genes and primers used, see Supplemental Table S1) was determined with the LightCycler 480 system and the LC480 SYBR Green I Master kit (Roche Diagnostics Belgium NV, Vilvoorde, Belgium). Per time point, three biological replicates (independently grown, induced and sampled material) and three technical replicates per biological repeat were measured for a total of eight timepoints. To obtain relative expression values, the amplification data were analyzed by means of qBase+ [24] with the second derivative maximum method and two reference genes (the Brassica napus genes TIP41 and EF1) for normalization.

2.3. Tolerance to Botrytis Cinerea

Seeds from the upscaling in the greenhouse were used (generation S4, Figure S2).
For the spray assay, four-week-old plants were sprayed with 8 × 10⁴ spores/mL of Botrytis cinerea B05.10. Four days after spraying, the leaf damage was scored as the percent non-green tissue. The green leaf surface was quantified by the image analysis software ‘ImageJ 1.52j’ (http://rsb.info.nih.gov/ij).
For the spot assay, both cotyledons of 12-day-old seedlings were inoculated by applying a drop of 5 µL of 1 × 10⁷ spores/mL of Botrytis cinereal B05.10 on each cotyledon half (=4 drops/plant). Lesion diameter was measured (perpendicularly to the main cotyledon vein) 7 days after inoculation.

2.4. Determination of Ascorbate Concentration

Samples were crushed and treated with 6% (w/v) meta-phosphoric acid (65% Fluka 79615). Ascorbic acid was measured with Reflectoquant® analytical test strips and a Reflectometer (RQflex 10 Merck).

2.5. Field Trials

For the field trials, seeds from the upscaling in the greenhouse were used (generation S4, Figure S2). The field trials were performed in Canada at three locations with different (from sandy to loamy) soil qualities. Diseases were controlled according to standard agronomic practices. Four repetitions per line were done per location. Each plot was 10 m2 in size, with different arrangements of the plots for each location. Yield was expressed as kg seed/plot.

2.6. Chromatin Immunoprecipitation Sequencing (ChIP-Seq)

For ChIP-Seq we collaborated with the company Active Motif® (La Hulpe, Belgium). For the ChIP-Seq analyses, seed bulks from the third selection cycle were used (generation S3, Figure S2). Results were confirmed with qPCR with seeds from the upscaled lines (generation S4, Figure S2). Plants were grown in strawberry boxes on soil in a growth chamber (21 °C, 16 h light). On day 10, plants were induced with either 0 mg/L or 50 mg/L salicylic acid with 0.5 g/L MES added and buffered to pH 5.8. Samples were taken 6 h after induction, one cotyledon per plant and several cotyledons per line. Per line, at least 3 g material was harvested. The samples were then processed by the collaborating company Active Motif®. ChIP-Seq was performed with antibodies for DNA polymerase II (Pol2) and histone H3 lysine 4 trimethylation (H3K4me3) and both twice on independently grown, induced and sampled material.

3. Results

3.1. Repeated Selection Leads to Canola Lines with Higher Tolerance to SA

To select lines tolerant to SA, a repeated selection approach was used as described [20,21,22,23]. When 12-day-old seedlings of canola are treated with 50 mg/L SA by watering, approximately 16 h after treatment the fresh weight of the cotyledons drops by approximately 15% (Figure 3A), mainly due to water loss (lower turgor of cotyledons). To increase tolerance to SA seedlings that after SA treatment have cotyledons with a high fresh weight were selected. As a second parameter ascorbate concentration in the cotyledons was used as a measure for vitality. Ascorbate is abundantly present in leaves and has diverse biological roles in the live cycle of a plant: plant growth and development, photosynthesis, senescence, protectant against both abiotic and biotic stresses, … [25,26]. Although it was noticed that the ascorbate concentration of cotyledons increases when treated with SA (Figure 3B), probably as a defense to oxidative stress induced by SA, seedlings were selected with a high ascorbate concentration as it was observed that seedlings with a low ascorbate concentration have a weak performance and had a very low seed set in the greenhouse (Figure S3).
A population of approximately 200 canola seedlings was treated with SA by watering. Approximately 16 h after treatment, the seedlings were selected with a high cotyledon weight and a high ascorbate concentration in the cotyledons and falling above the 90% prediction interval of the regression line of weight versus ascorbate concentration (Figure S1). These seedlings were transferred to the greenhouse for seed production by self-fertilization. The progenies of the first generation were subjected to the same selection, focusing on high cotyledon weight and ascorbate concentration, and the selected seedlings were transferred to the greenhouse for seed production. The selections and seed productions were done recurrently for three generations (Figure S2). Finally, eight selected lines were maintained of which the ascorbate concentration and weight after SA treatment were similar to those of the untreated control line. Two lines derived from two different plants from the original population were chosen for in-depth analysis. Seed upscalings were done from 50 plants for each selected line and for the original line from which the selection had been started. Selected lines are indicated further by ‘Line 1’ and ‘Line 2’, and the original line is indicated as ‘control’.

3.2. SA Treatment Induces Water Loss in Canola Seedlings

Twelve-day-old seedlings of the control and the selected Lines 1 and 2 were treated with 0 and 50 mg/L SA and both the ascorbate concentration and fresh weight of the cotyledons were measured. The results of this experiment are summarized in Table 1 and Table 2, showing respectively the weights and the ascorbate concentrations of the cotyledons of the same seedlings. The percent weight loss of the cotyledons by the SA treatment was significant in the control (minus 13.3%), whereas the weight losses in both Line 1 and Line 2 were lower and not significant (minus 8.6% and minus 9.2%, respectively) (Table 1). The ascorbate concentration per unit fresh weight had increased significantly in the control (12.3%) while the increase was less in the selected lines (6.3%) (Table 2). The increased ascorbate concentration in the control can, at least partly, be explained by the enhanced water loss.

3.3. The SA-Tolerant Lines are More Tolerant to BOTRYTIS Cinerea

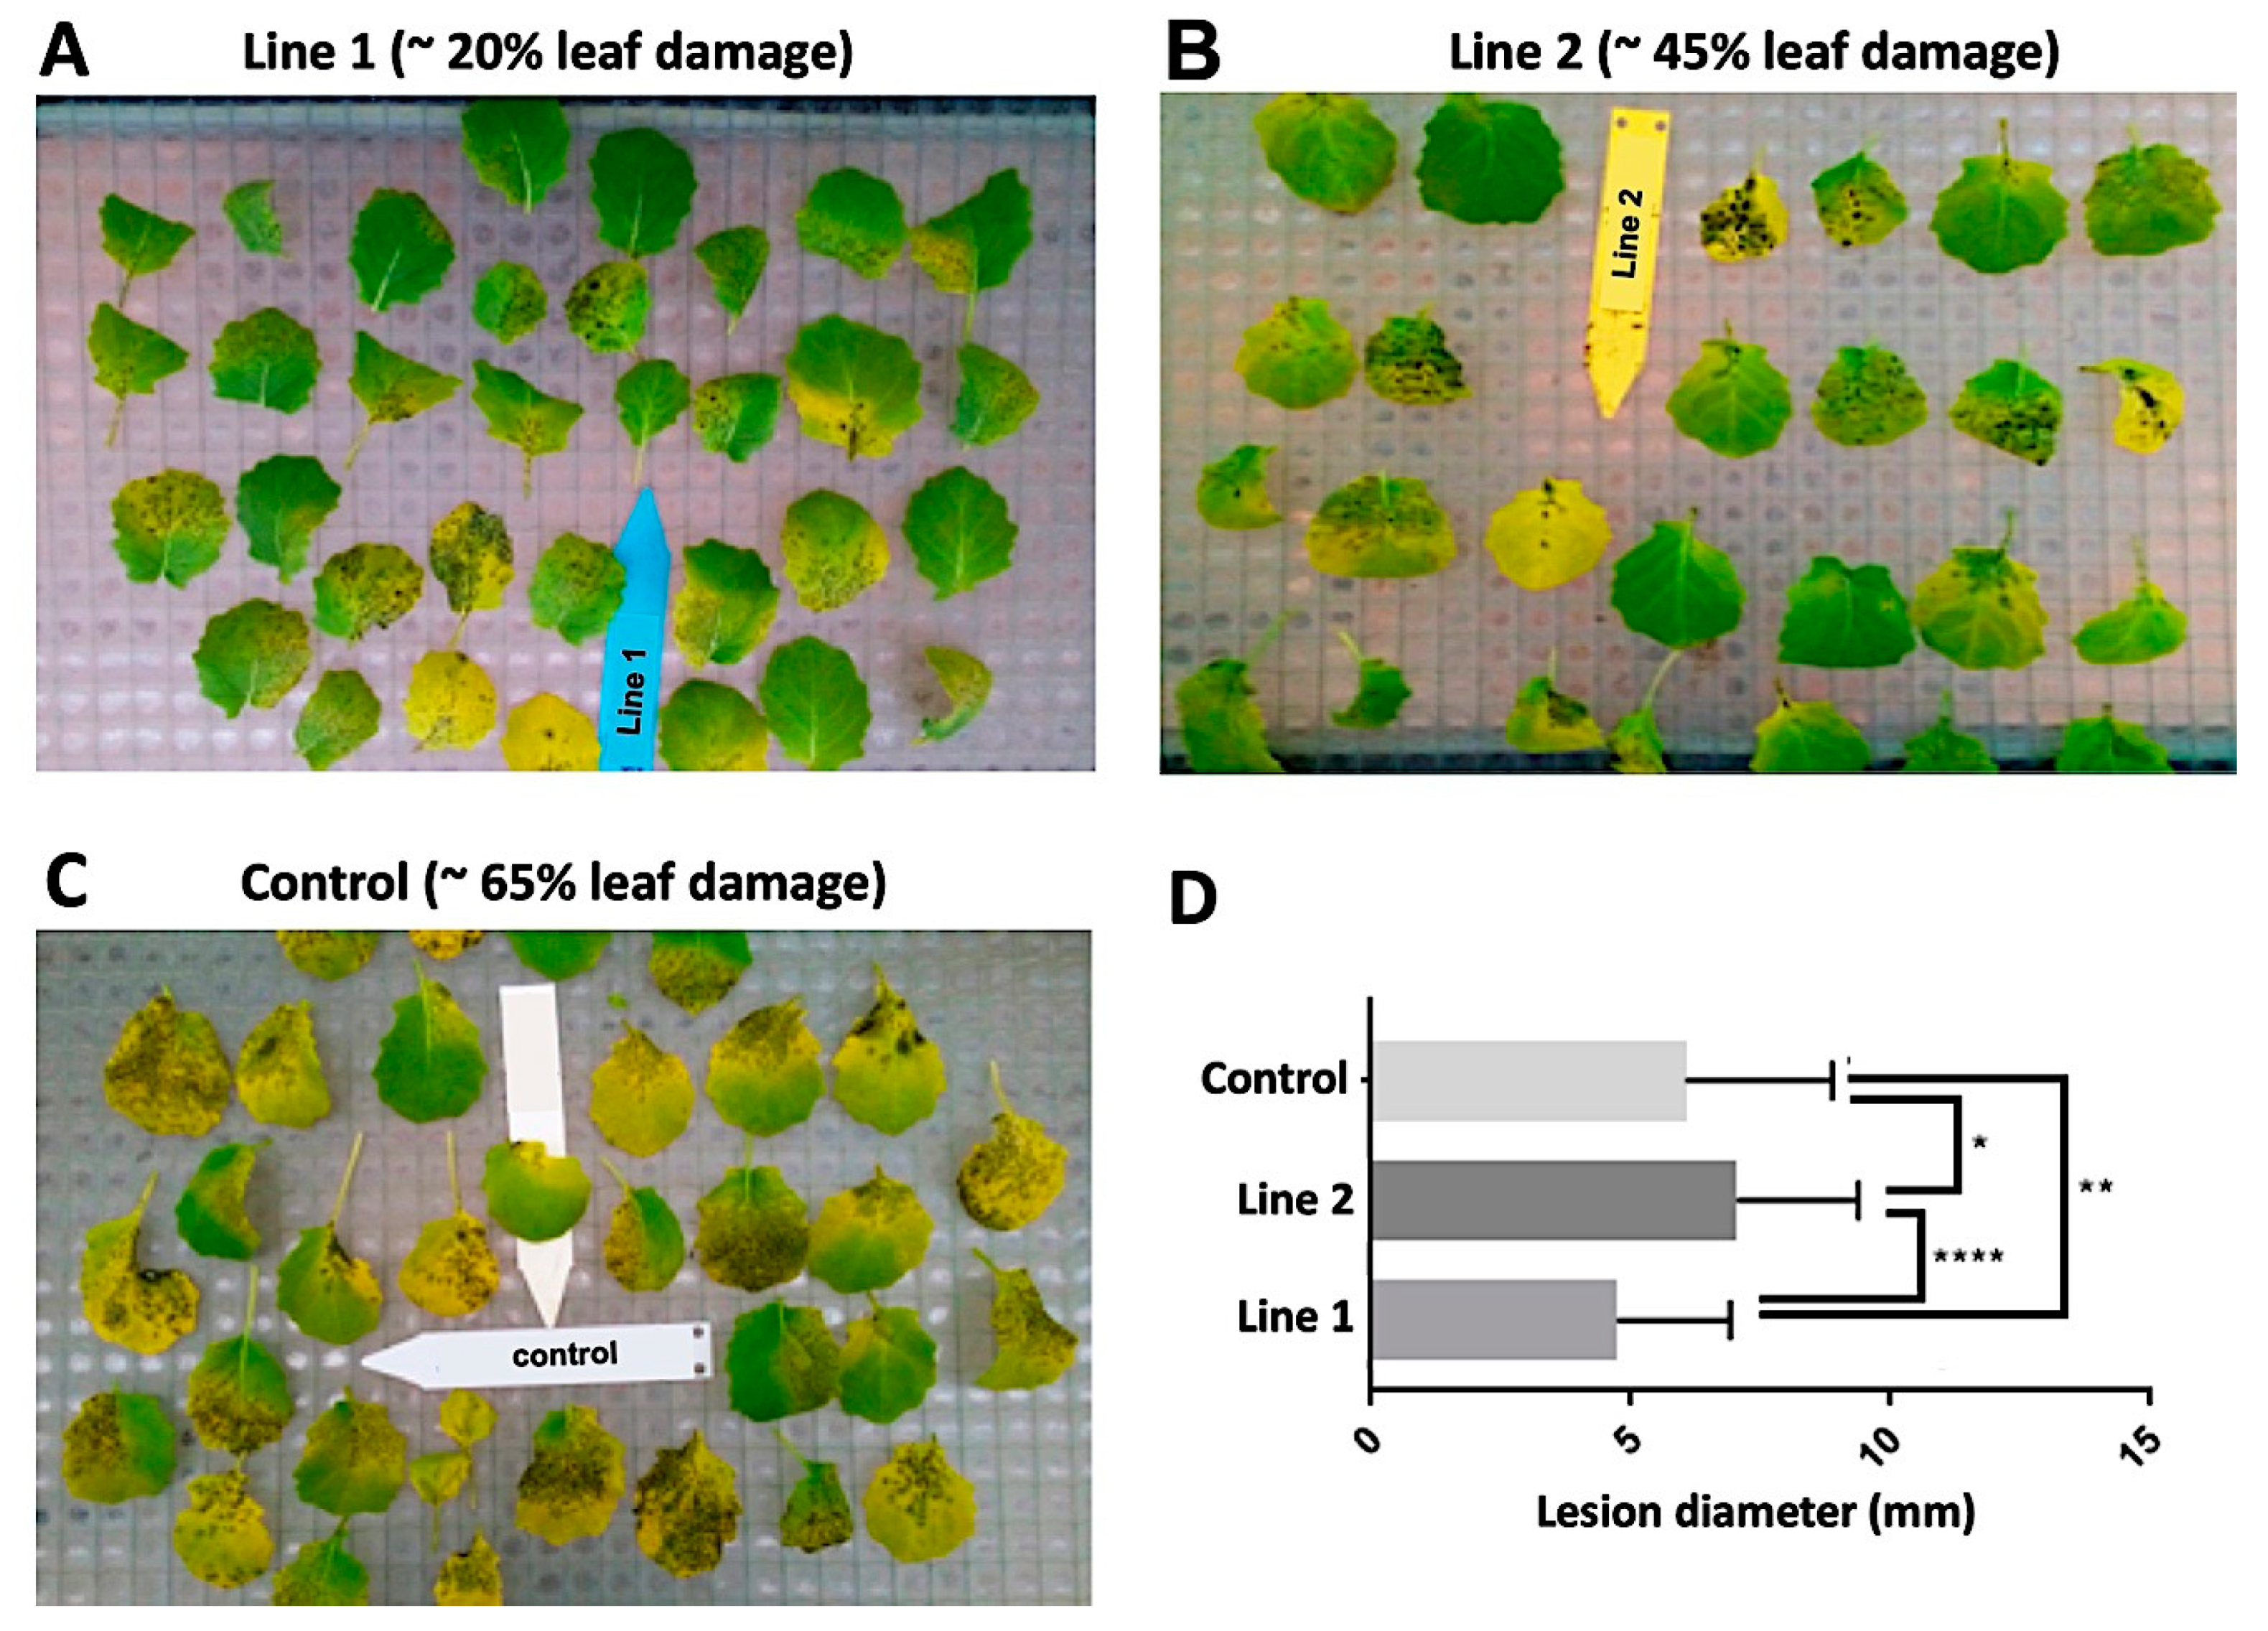
The sensitivity to Botrytis cinerea was evaluated on plants at different developmental stage and by different methods, more specifically by either spraying 4-week-old plants as a qualitative assay or by spotting a high density of spores on both cotyledons of 12-day-old seedlings as a quantitative assay.
In the spray assay the leaf damage by necrosis and chlorosis was scored by quantifying the non-green array versus the total area of the leaf. The control line infected by spraying with Botrytis cinerea showed approximately 65% leaf chlorosis four days after treatment (Figure 4C), indicative of heavy infection. In Line 1, this leaf chlorosis was reduced to 20% (Figure 4A), whereas in Line 2 it was by 45% (in between control and Line 1) (Figure 4B).
In spot assays on cotyledons, the lesion diameter was compared to that of the control. Line 1 was found to be significantly more tolerant to Botrytis cinerea, but not Line 2 that showed an even slightly increased susceptibility to Botrytis cinerea when compared to the control line (Figure 4D).

3.4. Seed Yield of the Selected Lines are Similar to Those of the Control

Tolerance to fungi may have a negative impact on yield, especially when the defense mechanism is constitutive or when the induced level is high or maintained for a long period. The selected lines and control were evaluated in field trials in Canada on three locations with four repetitions per line and per location for one year. Diseases were controlled by standard agronomic practices. The seed yield data showed no yield drag in the selected lines (Figure S4).

3.5. Known Genes in the SA Pathway Exhibit Changed Expression Levels

To understand the mechanism of the SA-tolerance, the expression of the genes of the SA pathway were studied in the control and the selected Lines 1 and 2, after induction by SA. The genes of the SA pathway are expressed transiently and at different time points after induction by SA, for this the transcription of the genes of the SA pathway were studied in time series after induction with SA for 0, 2, 3, 6, 9, 24, and 48 h. The genes studied were NIMIN1, NIMIN2, WRKY70, PR1, and PR2. Because NPR1 is regulated post-translationally [4,27] the transcription of NPR1 was not studied. When the transient expression of the SA response genes was checked by means of RT-qPCR, a strong transient induction was found in all tested previously reported genes, namely PR1, PR2, WRKY70, NIMIN1, and NIMIN2 that all reached a maximum after six to nine hours post induction (Figure 5). This expression was mostly lost within 48 h (Figure 5). In the selected populations, the genes were still induced, but at a much lower rate, with over 10-fold reduction in relative expression increase, indicating the holistic suppression without the loss of the pathway.

3.6. The Gene Expression with Unknown Connection to the SA Pathway Is Modified

ChIP-Seq experiments with an antibody against polymerase II (Pol2) were performed on uninduced and SA-induced seedlings. The cotyledons of the induced seedlings were harvested six hours after induction. 1713 genes were induced by the SA treatment, while 1123 genes were repressed. From the 1713 induced genes 1070 could be annotated and from the 1123 repressed genes 697 could be annotated. Figure S5 shows a summary of the gene ontology analyses. A set of differentially expressed genes previously unknown to be regulated directly or indirectly by SA were tested for their transient induction with RT-qPCR. Six new target genes were identified with altered transcription (Figure 6).
CDPK5 (CALMODULIN-DOMAIN PROTEIN KINASE 5) has a calmodulin-dependent protein kinase activity and is associated with the abscisic acid (ABA) pathway. The control showed an increased expression 6–9 h post induction, whereas no such an expression occurred in the selected lines.
LRL12(LEAF RUST 10 DISEASE-RESISTANCE LOCUS RECEPTOR-LIKE PROTEIN KINASE-like 1.2) is a serine/threonine kinase reportedly involved in cellular response to ABA stimulus, cellular response to water deprivation, photoperiodism and flowering. Whereas the expression was strong in the control 6 and 24 h post induction, the response in selected lines was barely visible.
WAKLG (Wall-associated receptor kinase-like 8) again displayed a strong increase in transcription approximately 9 h post induction, but the SA-tolerant line showed no significant response.
GAUTE (Probable galacturonosyltransferase 14) is a transferase associated with carbohydrate synthesis and pollen development. In the control the expression increased in two waves: a fast response 2 h post induction and a second approximately 24 h post induction with SA. The SA-tolerant line had a similar pattern, but greatly diminished, at the limit of detection.
TOM1 (AT4G21790) encodes a host factor that is required for TMV virus multiplication. The transcription was overall higher in the selected lines than that in the control.
M4E813 is a predicted protein with possible association to stress response. Its expression strongly increased 9–24 h post induction with SA, whereas the SA-tolerant lines did exhibit such an induction.

3.7. Changes in H3K4me3

To connect the altered expression profiles of the SA-induced genes in the selected lines to a possible epigenetic marker correlated with activation of transcription, the H3K4me3 histone modification was studied in the control and the selected Lines 1 and 2.
After induction by SA the overall H3K4me3 changes were subtler than the Pol2 distributions, often showing a mark elongation from the transcriptional start to the entire gene. Only in genes high in the cascade, such as WRKY70 and NPR3, the H3K4me3 deposition increased 6 h post induction, but in genes at the end of the induction cascade, such as PR1, the epigenetic mark did not change. Interestingly, the amounts of H3K4me3 deposition were lower in the selected Line 1 than those in the control (Figure 7). This selected Line 1 showed also a greater decrease in transcription and had a significantly higher tolerance to Botrytis cinerea than the control.

4. Discussion

The pathogen response network in plants is very complex and contains redundancies to compensate for inactivation by the pathogen interaction. The epigenetic selection method as used here was not only very rapid and limited to three selection cycles on very young plants, it also holistically shifted the entire SA response network without complete disruption.
As selection is based on a reduced reaction to SA treatments, the genes involved in the pathway are expected to be less activated than in the control. This effect occurred and was consistent over several SA pathway genes (Figure 5). Over 10-fold less induction was observed in the selected lines.
Variation in PR gene expression between individuals, especially in the early response, is unsurprising. The PR genes are located at the end of a long signaling cascade. Mild fluctuations in expression timing can have a large influence on the transcription level when sampled at a particular time point. Indeed, the variation seen (6 h post induction; Figure 5) is mostly due to one biological replicate.
Additionally, RNA-seq was used to identify genes, that after induction by SA, show the same abolished induction pattern as the known genes of the SA pathway. Two genes associated with the ABA pathway and dehydration were found. The ABA pathway has been reported to have some connections to the SA pathway [28,29]. Interestingly, one gene was identified that is involved in pollen development (GAUTE). This gene has a unique expression pattern, but its induction was clearly reduced in the selected lines. Only one predicted gene activated by SA stimulus (M4E813) has been computer annotated and, although it has been associated with a general response to stress (UniProt: M4E813_BRARP), including both biotic and abiotic stresses (GO:0006950), structural annotations range from the Usp domain-containing (InterPro: M4E813_BRARP) to the U-box proteins (Genebank XM_013841965.2). All the newly identified genes could be further investigated for possible involvement in SA signaling.
In the list of genes induced by SA generated by the Pol2 ChIP-Seq, a GO enrichment for receptor binding and stress response was found. Interestingly within the suppressed genes the energy pathways are enriched, possibly indicating cellular prioritizing of pathogen defense over metabolism (Figure S5). Additionally, stress response genes are enriched in repression, which hints at a mutual repression between pathways.
The selection method starting from an isogenic doubled haploid population and the altered H3K4me3 pattern in the selected lines demonstrate that the tolerance to SA is regulated at the epigenetic level. The epigenetic regulation had also been detected for H3K4me3 in the drought-tolerant canola lines [22] and the methylome in the energy use efficient rice lines [23], that had been selected in a manner similar to that used here to select the SA tolerance.
Although Lines 1 and 2 are selected likewise, Line 1 is more tolerant to Botrytis cinerea than Line 2 that shows only some tolerance in the spray assay. This result is in agreement with the more pronounced altered expression patterns of the SA-induced genes after SA treatment in Line 1. Also, after SA induction, the H3K4me3 deposition in Line 1 is lower than that in Line 2, which is similar to that in the control.
The use of epigenetics in agriculture is still in a developmental phase. During the life cycle of the crop, epigenetics is important for adaptation to the environment and strategies are being generated to use epigenetics to improve plant performance in the field [30]. Recently, Raju et al. [31] have demonstrated the potential utility of epilines in breeding. They had selected transgene-null epilines in soybean with the MSH1 system. The progenies obtained by crossing the epilines to the wild type had improved yield traits, namely in numbers of pods per plant, seed weight and seed yield.
Keeping in mind that the SA tolerance has an epigenetic origin, the question remains how stable the phenotype is over multiple generations. A high epigenetic stability is observed when plants are vegetatively propagated [32]. Hauben et al. [20] described the epigenetic stability in canola of energy use efficiency over eight generations of self-fertilizations. Raju et al. [31] reported a loss of the improved yield traits after four generations of self-fertilization in the F2 lines that had been obtained by crossing transgene-null MSH1-derived epilines to the wild type. Here, only two generations were studied after selection without loss of the SA tolerance in the two generations obtained by self-fertilization under non-selective conditions. By means of an analogous selection scheme for other traits in rice and canola, we observed a low to very high stability, depending on the selected trait. For the SA tolerance more generations made by both self-fertilizations and crossings have to be examined to get some insight into the stability of the SA tolerance.
It can be argued that the SA tolerant lines are more susceptible to biotrophic pathogens that require the SA pathway for efficient resistance. However, the SA-tolerant lines were produced to combat the specific threat of necrotrophic fungi, such as Botrytis cinerea. Further experiments are needed to assay the sensitivity of the SA-tolerant lines to biotrophic pathogens and to other necrotrophic pathogens such as Sclerotinia sclerotiorum and Leptospharia maculans which are currently a large agronomic concern.
We demonstrated that epigenetic selection methods based on performance after a mimicked pathogen attack can produce plants with reduced reaction to that perceived threat. These lines show an altered expression in pathway-specific genes without complete break-down of the pathway. In laboratory and greenhouse tests, these lines had an increased tolerance to Botrytis cinerea, but further field trials have to evaluate the performance of the SA-tolerant lines under pathogen pressure.

Supplementary Materials

The following are available online at https://www.mdpi.com/2073-4395/9/2/92/s1, Figure S1: Graph showing the linear regression line with a 90% prediction interval for the ascorbate concentration and weight of cotyledons of a population of 200 seedlings treated with 50 mg/L SA. Seedlings with high ascorbate concentration and weight falling above the 90% prediction interval were selected; Figure S2: Scheme used to select epilines of Brassica napus tolerant to SA; Figure S3: Seed set of plants obtained in the second selection cycle (generation S2, Figure S2); Figure S4: Yield of selected Lines 1 and 2 compared to the control; Figure S5: GO analysis. Annotated genes identified were analyzed with the PANTHER GO overrepresentation tool (http://www.pantherdb.org/) against Arabidopsis thaliana for overrepresentation versus a normalized sampling; Table S1: Primers used for RT-qPCR.

Author Contributions

Conceptualization, S.K. and M.D.B; Writing—Original Draft Preparation, S.K.; Writing—Review and Editing, M.D.B.; Methodology, S.K., Y.D.S., B.P.A.C., and M.D.B.; Formal Analysis, S.K., B.P.A.C., and M.D.B.; Supervision, M.D.B.; Funding Acquisition: M.D.B.

Funding

This research was funded by the European Union Seventh Framework Program and the European Commission Marie Curie Research Training Network ‘Chromatin in Plants–European Training and Mobility’ to M.D.B. and fellow S.K. (CHIP-ET, FP7-PEOPLE-2013-ITN607880).

Acknowledgments

We are grateful to Jo Dierickx for the follow-up of the plants in the greenhouse, Boris Haesendonckx and Marc Mansiere for the field trials and Andreas Goertz for performing the spray assay with Botrytis cinerea. We thank Martine De Cock for the help in preparing the manuscript.

Conflicts of Interest

The authors declare no conflict of interest.

References

  1. Lee, S.J.; Rose, J.K.C. Mediation of the transition from biotrophy to necrotrophy in hemibiotrophic plant pathogens by secreted effector proteins. Plant Signal. Behav. 2010, 5, 769–772. [Google Scholar] [CrossRef] [PubMed] [Green Version]
  2. Chowdhury, S.; Basu, A.; Kundu, S. Biotrophy-necrotrophy switch in pathogen evoke differential response in resistant and susceptible sesame involving multiple signaling pathways at different phases. Sci. Rep. 2017, 7, 17251. [Google Scholar] [CrossRef] [PubMed]
  3. Thomma, B.P.H.J.; Eggermont, K.; Pennickx, I.A.M.A.; Mauch-Mani, B.; Vogelsang, R.; Cammue, B.P.A.; Broekaert, W.F. Separate jasmonate-dependent and salicylate-dependent defense-response pathways in Arabidopsis are essential for resistance to distinct microbial pathogens. Proc. Natl. Acad. Sci. USA 1998, 95, 15107–15111. [Google Scholar] [CrossRef] [PubMed]
  4. Glazebrook, J. Contrasting mechanisms of defense against biotrophic and necrotrophic pathogens. Annu. Rev. Phytopathol. 2005, 43, 205–227. [Google Scholar] [CrossRef] [PubMed]
  5. Shah, J. The salicylic acid loop in plant defense. Curr. Opin. Plant Biol. 2003, 6, 365–371. [Google Scholar] [CrossRef]
  6. Ishikawa, K.; Yoshimura, K.; Harada, K.; Fukusaki, E.; Ogawa, T.; Tamoi, M.; Shigeoka, S. AtNUDX6, an ADP-ribose/NADH pyrophosphohydrolase in Arabidopsis, positively regulates NPR1-dependent salicylic acid signaling. Plant Physiol. 2010, 152, 2000–2012. [Google Scholar] [CrossRef] [PubMed]
  7. Li, T.; Hu, Y.; Du, X.; Tang, H.; Shen, C.; Wu, J. Salicylic acid alleviates the adverse effects of salt stress in Torreya grandis cv. Merrillii seedlings by activating photosynthesis and enhancing antioxidant systems. PLoS ONE 2014, 9, e109492. [Google Scholar] [CrossRef]
  8. Shah, J.; Kachroo, P.; Klessig, D.F. The Arabidopsis ssi1 mutation restores pathogenesis-related gene expression in npr1 plants and renders defensin gene expression salicylic acid dependent. Plant Cell 1999, 11, 191–206. [Google Scholar] [CrossRef]
  9. Alvarez, M.E.; Nota, F.; Cambiagno, D.A. Epigenetic control of plant immunity. Mol. Plant Pathol. 2010, 11, 563–576. [Google Scholar] [CrossRef]
  10. Clarke, J.D.; Volko, S.M.; Ledford, H.; Ausubel, F.M.; Dong, X. Roles of salicylic acid, jasmonic acid, and ethylene in cpr-induced resistance in Arabidopsis. Plant Cell 2000, 12, 2175–2190. [Google Scholar] [CrossRef]
  11. Mur, L.A.J.; Kenton, P.; Atzorn, R.; Miersch, O.; Wasternack, C. The outcomes of concentration-specific interactions between salicylate and jasmonate signaling include synergy, antagonism, and oxidative stress leading to cell death. Plant Physiol. 2006, 140, 249–262. [Google Scholar] [CrossRef] [PubMed]
  12. Van Loon, L.C.; Van Strien, E.A. The families of pathogenesis-related proteins, their activities, and comparative analysis of PR-1 type proteins. Physiol. Mol. Plant Pathol. 1999, 55, 85–97. [Google Scholar] [CrossRef] [Green Version]
  13. Van Loon, L.C.; Rep, M.; Pieterse, C.M.J. Significance of inducible defense-related proteins in infected plants. Annu. Rev. Phytopathol. 2006, 44, 135–162. [Google Scholar] [CrossRef] [PubMed]
  14. Dong, X. NPR1, all things considered. Curr. Opin. Plant Biol. 2004, 7, 547–552. [Google Scholar] [CrossRef] [PubMed]
  15. Dixelius, C.; Bohman, S.; Wretblad, S. Disease resistance. In Brassica; Pua, E.-C., Douglas, C.J., Eds.; Springer: Berlin, Germany, 2004; pp. 253–271. ISBN 978-3-642-05783-0. [Google Scholar] [CrossRef]
  16. Rahman, T.A.E.; Oirdi, M.E.; Gonzalez-Lamothe, R.; Bouarab, K. Necrotrophic pathogens use the salicylic acid signaling pathway to promote disease development in tomato. Mol. Plant Microbe Interact. 2012, 25, 1584–1593. [Google Scholar] [CrossRef] [PubMed]
  17. Tiedemann, A.V. Evidence for a primary role of active oxygen species in induction of host cell death during infection of bean leaves with Botrytis cinerea. Physiol. Mol. Plant Pathol. 1997, 50, 151–166. [Google Scholar] [CrossRef]
  18. Govrin, E.M.; Levine, A. The hypersensitive response facilitates plant infection by the necrotrophic pathogen Botrytis cinerea. Curr. Biol. 2000, 10, 751–757. [Google Scholar] [CrossRef]
  19. Rossi, F.R.; Krapp, A.R.; Bisaro, F.; Maiale, S.J.; Pieckenstain, F.L.; Carrillo, N. Reactie oxygen species generated in chloroplasts contribute to tobacco leaf infection by the necrotrophic fungus Botrytis cinerea. Plant J. 2017, 92, 761–773. [Google Scholar] [CrossRef]
  20. Hauben, M.; Haesendonckx, B.; Standaert, E.; Van Der Kelen, K.; Azmi, A.; Akpo, H.; Van Breusegem, F.; Guisez, Y.; Bots, M.; Lambert, B.; et al. Energy use efficiency is characterized by an epigenetic component that can be directed through artificial selection to increase yield. Proc. Natl. Acad. Sci. USA 2009, 106, 20109–20114. [Google Scholar] [CrossRef] [Green Version]
  21. De Block, M.; Van Lijsebettens, M. Energy efficiency and energy homeostasis as genetic and epigenetic components of plant performance and crop productivity. Curr. Opin. Plant Biol. 2011, 14, 275–282. [Google Scholar] [CrossRef]
  22. Verkest, A.; Byzova, M.; Martens, C.; Willems, P.; Verwulgen, T.; Slabbinck, B.; Rombaut, D.; Van de Velde, J.; Vandepoele, K.; Standaert, E.; et al. Selection for improved energy use efficiency and drought tolerance in canola results in distinct transcriptome and epigenome changes. Plant Physiol. 2015, 168, 1338–1350. [Google Scholar] [CrossRef] [PubMed]
  23. Schmidt, M.; Byzova, M.; Martens, C.; Peeters, M.; Raj, Y.; Shukla, S.; Verwulgen, T.; De Block, M.; Van Lijsebettens, M. Methylome and epialleles in rice epilines selected for energy use efficiency. Agronomy 2018, 8, 163. [Google Scholar] [CrossRef]
  24. Hellemans, J.; Mortier, G.; De Paepe, A.; Speleman, F.; Vandesompele, J. qBase relative quantification framework and software for management and automated analysis of real-time quantitative PCR data. Genome Biol. 2007, 8, R19. [Google Scholar] [CrossRef] [PubMed]
  25. Zhang, Y. Biological role of ascorbate in plants. In Ascorbic Acid in Plants: Biosynthesis, Regulation and Enhancement; Zhang, Y., Ed.; Springer: New York, NY, USA, 2013; pp. 35–43. ISBN 978-1-4614-4126-7. [Google Scholar]
  26. Akram, N.A.; Shafiq, F.; Ashraf, M. Ascorbic acid- a potential oxidant scavenger and its role in plant development and abiotic stress tolerance. Front. Plant Sci. 2017, 8, 613. [Google Scholar] [CrossRef] [PubMed]
  27. Withers, J.; Dong, X. Posttranslational modifications of NPR1: A single protein playing multiple roles in plant immunity and physiology. PloS Pathol. 2016, 12, e1005707. [Google Scholar] [CrossRef] [PubMed]
  28. Miura, K.; Tada, Y. Regulation of water, salinity, and cold stress responses by salicylic acid. Front. Plant Sci. 2014, 5, 4. [Google Scholar] [CrossRef]
  29. Liu, S.; Kracher, B.; Ziegler, J.; Birkenbihl, R.P.; Somssich, I.E. Negative regulation of ABA signaling by WRKY33 is critical for Arabidopsis immunity towards Botrytis cinerea 2100. eLife 2015, 4, e07295. [Google Scholar] [CrossRef]
  30. He, Y.; Li, Z. Epigenetic environmental memories in plants: establishment, maintenance, and reprogramming. Trends Genet. 2018, 34, 856–866. [Google Scholar] [CrossRef]
  31. Raju, S.K.K.; Shao, M.-R.; Sanchez, R.; Xu, Y.-Z.; Sandhu, A.; Graef, G.; Mackenzie, S. An epigenetic breeding system in soybean for increased yield and stability. Plant Biotechnol. J. 2018, 16, 1836–1847. [Google Scholar] [CrossRef] [Green Version]
  32. Busconi, M.; Soffritti, G.; Stagnati, L.; Marocco, A.; Marcos Martínez, J.; De Los Mozos Pascual, M.; Fernandez, J.A. Epigenetic stability in saffron (Crocus sativus L.) accessions during four consecutive years of cultivation and vegetative propagation under open field conditions. Plant Sci. 2018, 277, 1–10. [Google Scholar] [CrossRef]
Figure 1. Salicylic acid and jasmonic acid pathways react to different types of pathogens. (A) The plant responds to biotrophic pathogens via the SA pathway, inducing SA-specific pathogen response genes, resulting in hypersensitive responses that inhibit the spread of the pathogens. The response to necrotrophic pathogens occurs via the JA pathway, inducing JA-specific pathogen response genes that block the hypersensitive response. (B) Certain necrotrophic fungi actively induce the SA pathway to elicit the hypersensitive response and feed on the dead cells, while they also block the JA pathway.
Agronomy 09 00092 g001
Figure 2. Salicylic acid (SA) pathway. SA induces the expression and transfer to the nucleus of NPR1, where it interacts with the kinases NIMIN1&2 in a complex to trigger WRKY70. This transcription factor is responsible for the transcription of pathway-specific pathogen resistance genes, such as PR1 and PR2.
Agronomy 09 00092 g002
Figure 3. Weight loss (A) and increase of ascorbate concentration per fresh weight (B) in cotyledons of 12-day-old seedlings of the control line treated for 16 h with 50 mg/L SA. 45 cotyledons derived from 45 seedlings were used per condition. Statistical significance versus control using unpaired t-test (GraphPad Prism version 7.00 for OS X, GraphPad Software, La Jolla California USA, www.graphpad.com): *** p < 0.001.
Agronomy 09 00092 g003
Figure 4. Tolerance to Botrytis cinerea. (AC) Qualitative spray assay. Four-week old plants were sprayed with 8 × 10⁸ spores/mL of Botrytis cinerea. The pictures were taken four days after spraying. The leaf damage (necrosis and chlorosis) was scored by quantifying the non-green area versus the total leaf area using image analysis. In the selected lines (A,B), there is less leaf damage four days after infection than in the control (C), indicating less spread of the fungus in the leaves. The leaves derived from 18 treated plants per line are shown. (D) Quantitative spot assay. 2 × 5 µL of 1 × 10⁷ spores of Botrytis cinerea were spotted on both cotyledons of 12-day-old seedlings. Lesion diameter was measured 7 days after inoculation. Both selected lines were compared to the control. The horizontal error bars show the standard deviation. Statistical significance versus control with ANOVA and Tukey’s post-hoc test: * p < 0.05, ** p < 0.01, and *** p < 0.001.
Agronomy 09 00092 g004
Figure 5. Expression of known SA target genes (Figure 2) in the control and selected Lines 1 and 2 after treatment with 50 mg/L SA. The samples were taken at fixed time points after treatment. For each time point three biological replicates and three technical repeats per biological repeat were used. Error bars indicate standard deviation (n = 3).
Agronomy 09 00092 g005
Figure 6. Expression of newly identified SA target genes in the control, and selected Lines 1 and 2 after treatment with 50 mg/L SA. The samples were taken at fixed time points after treatment. For each time point three biological replicates and three technical repeats per biological repeat were used. Error bars indicate standard deviation (n = 3).
Agronomy 09 00092 g006
Figure 7. H3K4me3 deposition, marker for activation of transcription, on the SA target genes WRKY70 and PR1 in the control, and selected Lines 1 and 2. The SA pathway was induced by treating the seedlings with 50 mg/L SA. Samples were taken 6 h post induction at which point all known targets were expressed. Two independent replicates are shown, represented by two colors.
Agronomy 09 00092 g007
Table 1. Weight loss of cotyledons of canola seedlings treated for 16 h with 50 mg/L Salicylic acid (SA).
Linemg Fresh Weight of Three Cotyledons a50 mg/L versus 0 mg/L SA
0 mg/L SA50 mg/L SA
MeanSE bMeanSE b% Weight LossAdjusted p Value c
Line 1401.210.8366.58.68.60.091
Line 2364.58.8331.16.39.20.191
Control406.79.4352.59.413.30.0008
a Fifteen samples per line and per condition were used. Each sample contained three cotyledons derived from three seedlings; b Standard Error; c One-way ANOVA followed by Tukey’s multiple comparisons test was performed using GraphPad Prism version 7.00 for OS X, GraphPad Software, La Jolla California USA, www.graphpad.com.
Table 2. Increase in the ascorbate concentration per fresh weight in cotyledons of canola seedlings treated for 16 h with 50 mg/L SA.
Linemg Ascorbate/g Fresh Weight a50 mg/L versus 0 mg/L SA
0 mg/L SA50 mg/L SA
MeanSE bMeanSE b% Ascorbate IncreaseAdjusted p Value c
Line 149111522106.30.22
Line 24961152786.30.35
Control47295251012.30.003
a Fifteen samples per line and per condition were used. Each sample contained three cotyledons derived from three seedlings; b Standard Error; c One-way ANOVA followed by Tukey’s multiple comparisons test was performed using GraphPad Prism version 7.00 for OS X, GraphPad Software, La Jolla California USA, www.graphpad.com.

