Article

First Report of Herbicide-Resistant Echinochloa crus-galli in Uruguayan Rice Fields

by
Claudia Marchesi
1,* and
Nestor E. Saldain
2
1
Estación Experimental INIA Tacuarembó, Programa Producción de Arroz, Instituto Nacional de Investigación Agropecuaria (INIA), Ruta 5 Km 386, 45000 Tacuarembó, Uruguay
2
Estación Experimental INIA Treinta y Tres, Programa Producción de Arroz, Instituto Nacional de Investigación Agropecuaria (INIA), Ruta 8 Km 28, 33000 Treinta y Tres, Uruguay
*
Author to whom correspondence should be addressed.
Agronomy 2019, 9(12), 790; https://doi.org/10.3390/agronomy9120790
Submission received: 19 October 2019 / Revised: 18 November 2019 / Accepted: 20 November 2019 / Published: 22 November 2019
(This article belongs to the Special Issue Weed Management & New Approaches)

Abstract

:
Echinochloa crus-galli is the main weed in direct dry-seeded rice systems worldwide and is the target of most herbicide applications. Numerous cases of E. crus-galli biotypes with resistance to herbicides have been reported in different regions of the world; however, to date, no cases have been reported in Uruguay. The purpose of this research is to assess the presence of herbicide-resistant E. crus-galli in the rice fields of Uruguay. More than 40 E. crus-galli biotypes were sampled from eastern to northern regions in different years and assessed following the Herbicide Resistance Action Committee (HRAC) protocols of confirmation, using the herbicides propanil, quinclorac, clomazone, bispyribac–sodium, penoxsulam, imazapyr + imazapic, profoxidim and cyhalofop. Herbicides rates included 0, 0.125, 0.25, 0.50, 1, 2, 4 and 8 times the label rate. Most E. crus-galli biotypes (35) resulted as resistant to quinclorac. Furthermore, resistance was confirmed to propanil in at least seven biotypes, 12 to imazapyr + imazapic, and three to penoxsulam. Five biotypes showed multiple resistance to propanil and quinclorac, and one biotype was resistant to quinclorac, penoxsulam and imazapyr + imazapic. No biotype showed confirmed resistance to clomazone, bispyribac-sodium, cyhalofop or profoxidim—herbicides that ensure satisfactory control. The presence of E. crus-galli herbicide resistant-biotypes reduces herbicide options, threatening rice production in Uruguay. In this context, a redesign of the productive systems would represent an opportunity to complement the chemical control, integrating larger-scale cultural and management practices.

1. Introduction

Rice is one of the most important crops in Uruguay, with more than 90% of its production exported to many markets worldwide, where uniformity and quality standards are appreciated [1]. With a rice area of 165 thousand ha and average yields of about 8.5 t ha−1, rice systems include an important proportion of the acreage in rotation with sown pastures and other crops [2]. This characteristic is well known, attracting the attention of rice specialists worldwide, and is thought to be responsible for the low input level associated with this high yield [3]. Some of the main production system characteristics are summarized in Table 1.
Echinochloa crus-galli (L.) P. Beauv (barnyard grass) is the main weed in direct dry-seeded rice systems worldwide and, particularly in Uruguay, is the target of most herbicide applications. It is a C4 species, which has adapted well to compete with rice in these systems [4] because its seeds need oxygen to germinate. E. crus-galli is a highly competitive plant, and therefore, it is critical to achieve good control to obtain high rice yields. Global and local studies have reported 30% to 100% of rice yield losses when high E. crus-galli infestations interfere over the entire season [5,6,7,8]. In the last few years, further pressure to overcome high production costs and low rice grain prices has resulted in an intensification of rice systems, where the presence of sown pastures has decreased, and more rice after rice is seeded instead [9]. This new scenario includes an increase of herbicide application, using higher doses of single products and/or the spraying of more mixtures/sequences. It is widely known that an increase in herbicide use results in higher selection pressure on weeds and a greater risk of resistant types evolving [10,11]. Resistance is the result of an evolutional process driven by selection pressure, as susceptible individuals are removed—for example, with herbicides—leading towards an increasing prevalence of naturally-resistant individuals in the population [12,13]. Currently, herbicide resistance is one of the most important challenges for weed management [14]. Direct dry-seeded rice systems and E. crus-galli are not an exception, with 34 cases reported worldwide, including in Brazil and Argentina [15,16,17,18,19].
Despite being a ubiquitous weed, E. crus-galli used to be relatively well controlled in rice systems throughout the country. Nevertheless, farmers and advisors have been reporting herbicide failures in controlling this weed in dense spots without a discernible pattern over the last seasons, which could be attributable to other causes. In addition to this, an increase in the presence of red rice (Oryza sativa L.), especially in long rice-history systems, has also prompted the augmentation of the use of Clearfield technology [20]. Although a strong stewardship program existed, not all of the management recommendations have been followed in all situations, resulting in higher risks of selecting E. crus-galli biotypes resistant to imazapyr + imazapic (IMIS), in addition to resistant red rice [21,22]. It is an open secret that most farmers do not apply preventive measures unless they face the problem personally [23,24].
The aim of this paper is to report national findings about the presence of herbicide-resistant E. crus-galli associated with rice systems.

2. Materials and Methods

2.1. Seed Collections and Preparations

The collection of E. crus-galli seeds was done during late summer (February–March), where there were weed survivors in rice fields, in different years. In each site, 10 to 20 mature panicles were cut and saved in paper bags, previously georeferenced and appropriately identified. After being threshed and blow-cleaned, seeds were saved in sealed bags with silica gel and stored in cool and dry conditions. Different field background information for the biotypes was retrieved, with some of them coming from well known-history sites. Moreover, differentiation was performed by collection periods in the eastern region, due to it having a longer history of rice production associated with variable herbicide use. Specific data for each period of collection and field crop background are detailed in the following subsections.

2.1.1. Eastern Region Before the 2000s

Five E. crus-galli biotypes were taken from 5 to 25 ha paddocks with a known and documented cropping history, coming from semi-commercial scale experiments located at the experimental unit of Paso de la Laguna (33°16’23’’ S, 54°10’24’’ W). Biotype LCh01 was collected in 1993 from a rice paddock with 10 years of rice–soybean history (1979 to 1988), followed by five years of continuous rice–R5Y (1989 to 1993). Biotypes E3, E5, E6 and E7 were collected in 1995 from rice paddocks with 18 years under a rice–fallow–rice pasture (1:1:1:4) rotation (1974 and 1991), followed by three years of continuous rice–R3Y (1993 to 1995). At that time, rice herbicides were used in sequences of propanil and molinate, with the latter applied into the water. Quinclorac in a tank-mix with propanil was used in two of the three years for the R3Y scenario, while it was applied at least three times in the R5Y scenario. Clomazone was not available before 1995; therefore, the biotypes had not been exposed to it. All biotypes were tested with quinclorac, propanil, and clomazone, but due to the low seed quantity available for the E5 biotype, only the quinclorac response was assessed. The molinate dose–response was not evaluated because it was no longer available when the evaluation was carried out. Further details are available in Appendix A.

2.1.2. Eastern Region from 2006 to 2010

Twenty-five biotypes were collected from rice fields where herbicide spraying was correctly done, and the timing of water entry and flooding was uninterrupted until the final crop stages. Echinochloa crus-galli survivors were present without a discernible pattern associated with any agronomic practice used (e.g., airplane misapplication, delay in the water entry, unlevelled field, heavy fertilization). Twenty-one of them were collected where propanil, molinate, quinclorac, clomazone—and to a much lesser extent, bispyribac-sodium and penoxsulam—were used. The remaining four biotypes, collected in 2008, came from fields where IMIS was used with variable intensity, representing variable field situations. The biotype E3CL had three years of continuous Clearfield rice (CL), with four applications of IMIS. The biotype E2CL had two consecutive years of CL, with two applications in total. The biotype E1CL had one year of CL with just one application, and finally, E0CL came from a field where IMIS had never been used before. In those fields, bispyribac–sodium had been applied the decade before, when this specific acreage was under a low rice intensity system. Further information about field background can be found in Appendix A.

2.1.3. Eastern Region in 2015, 2016 and 2018

Over the last years, the focus of assessment was on CL rice systems because of its relevance in terms of acreage and due to the higher intensity of CL rice use in the same fields. The evaluation of the 26 collected biotypes was done using an E. crus-galli seed-bioassay with IMIS, following the procedure described by Matzenbacher et al. (2013) [25]. This technique exposes biotypes to a discriminant concentration of imazapyr + imazapic (126.5 + 38.5 mg/l, respectively), allowing the separation of susceptible and resistant biotypes. Further information about field background is available in Appendix B.

2.1.4. Northern Region Since 2014

Samples of E. crus-galli were collected from fields where weed control was not completely satisfactory, with remaining groups of healthy plants as well as random sampling in neighbouring areas. The collection was initiated in 2014, mainly from conventional rice systems (no CL), with annual new additions. The first 12 biotypes from the mentioned origin were screened and analysed in the present study. Over the last years, most of the samples with suspected resistance came from CL systems, in accordance with an increase in the area covered by this system. Eight biotypes from this source have already been analysed. The nomenclature of the biotypes indicates the region and farm, as well as the correlative number in the collection.

2.2. Seed Germination

For germination, the seeds were placed in Petri dishes with distilled water for seven days, using a germination chamber with controlled temperature (30/25 °C day/night) and light (14/10 h day/night). When the coleoptile reached two centimetres, eight to nine plants were transplanted to pots (500 cm3), filled with substrate. After approximately two weeks, the pots were thinned to five plants each to achieve a uniform stand.

2.3. Herbicide Screening and Data Analysis

While the collected biotypes were taken at different periods, the seedling-assays for herbicide dose–response were mainly conducted in spring 2011 to summer 2012 (eastern biotypes), and spring 2014 to summer 2015 (northern biotypes). Following the Herbicide Resistance Action Committee (HRAC) [25] protocol, dose–response assays were done using various biotypes and different herbicides normally used to control this weed, such as propanil, quinclorac, clomazone, imazapyr + imazapic, penoxsulam, bispyribac–sodium, cyhalofop–butyl and profoxidim. These herbicides correspond to Groups C, O, F, B, B, B, A and A, respectively, as described by the HRAC [26].
Herbicide applications were done over two- to three-leaf plants grouped in five per pot. For each herbicide, eight doses and four replicates were undertaken and repeated twice. The reference dose (1 X) was the herbicide label rate for each herbicide used to control E. crus-galli, and the series included 0, 0.125, 0.25, 0.5, 2, 4 and 8 times that rate. An additional dose–response experiment was conducted just for quinclorac, on four selected biotypes, using a wider range of doses: 0, 0.032, 0.063, 0.125, 1, 8, 16 and 32 times. Each herbicide was used with its recommended adjuvant, and the control treatment included only the adjuvant. Applications were done with a DeVries research track sprayer (https://devriesmfg.wordpress.com), equipped with an 8002 E flat nozzle, spraying a volume of 113 L ha−1 at 200 kPa. Two to three days after herbicide applications, pots were flooded into basins and maintained in a glasshouse for 21 days during spring or summer time. The plants’ fresh weights per pot were measured, and statistical analysis was performed using the drc package [27] in R (http://www.r-project.org/). Dose–response curves were adjusted, and the model parameters (d, c, e and b) were estimated when possible. Parameter b denotes the steepness of the dose–response curve; c and d, the lower and upper limits of the response; and e, the effective dose GR50 (the herbicide dose at which 50% of biomass reduction occurred). For each biotype and herbicide tested, the estimated GR50 was compared with the GR50 of a susceptible one (with GR50 and GR90 below the label rate), obtaining the resistance factor (RF = GR50x/GR50S). In addition, the herbicide dose at which 90% of biomass reduction happens (GR90) is estimated to improve our judgment about the probable evolution of resistance in some biotypes. A GR90 higher than the recommended label rate should be a warning message to consider and provide a more agricultural viewpoint of the problem of herbicide-resistant weeds. In the case of the seed-assays, the analysis carried out with CL Eastern biotypes was a pairwise comparison between each biotype and the susceptible or resistant one using a Dunnett test with alpha = 0.05. The mixed procedure of the statistical analysis system program was used for statistical analysis (SAS Institute, Inc v 9.4).

3. Results and Discussion

3.1. Eastern Region Before the 2000s

The data indicated that biotypes E3, E6 and E7, from R3Y, had low and medium levels of resistance to propanil, compared with an intermediate susceptibility biotype (LCh02). Their RF values were statistically significant but lower than 10 (Table 2). The GR50 values of these biotypes were higher than (E7) or close to the label rate (E3 and E6). However, the GR90 values were higher than the label rate for the three biotypes, especially in E7, at almost three times that amount. Conversely, the LCh01 biotype was susceptible, showing an RF of 1, which is not significant, and also a GR50 and GR90 much lower than the label rate (Table 2). LCh01 susceptibility attracted our attention because it came from a field in which a rice–soybean-alternating rotation was in place from 1979 to 1988, followed by five years of continuous rice (R5Y). During this 10-year period, trifluralin alone or triflurain and imazaquin tank-mixes were used as preemergence in a non-glyphosate-resistant soybean crop. Possibly, this management contributed to lessening the selection pressure on the E. crus-galli biotype, due to the fact that these herbicides present different modes of action than those used in rice.
With the range of doses used for quinclorac evaluation (Table 2), it was not possible to estimate GR50 for the susceptible biotype (LM04), and consequently, RF could not be estimated. However, it was observed that GR50 values for biotype E3, E6, E7 and LCh01 were higher than the label rate (375 g ha−1) and even higher than the maximum dose evaluated (3000 g ha−1), especially in E3, E7 and LCh01. The same pattern was determined for GR90, showing that quinclorac resistance had evolved. The biotype E5 was also quinclorac-resistant; in spite of GR50 and GR90 being below label rate, the coefficient for the “c” parameter was not near zero on the x-axis. The four biotypes coming from the R3Y (E3, E5, E6 and E7) resulted in resistance to quinclorac, and also the one collected from R5Y (LCh01). The selection process in those cases occurred under just two sprayings of quinclorac tank-mixed with propanil in R3Y, and with at least three sprayings in R5Y. At that time, herbicide applications used to be performed with high propanil doses (2400 to 3360 g ai ha−1) and quinclorac (320 g ai ha−1) over E. crus-galli populations with a high proportion of four-leaf plants, or even with tillers. Besides, water flushing after two weeks of herbicide application was usual, and the flooding date was established at around 50 to 60 days after seeding, on average. Under this management scheme, we can hypothesize that quinclorac was the herbicide that withstood the major selection pressure.
Concerning clomazone evaluation (Table 2), all biotypes seemed to be susceptible, showing non-significant RF values (E3, E6, E7 and ZA03). For the LCh01 biotype, no model was adjusted, because it was very sensitive to the lowest dose used, and the ZA03 biotype needed very little clomazone to reach GR50. Most of the GR90 values were lower than the label rate, although E7 showed a slightly greater value. None of these E. crus-galli biotypes had been exposed to clomazone before.
In summary, the E7 biotype showed a medium resistance level to propanil and a high resistance level to quinclorac, while E3 and E6 biotypes had a low resistance level to propanil and a high resistance level to quinclorac. Besides this, LCh01 and E5 biotypes showed a high level of resistance only to quinclorac. Similar results were reported by other authors [28,29,30], in situations where propanil or quinclorac were used without rotation, in either crops or herbicides (modes of action).

3.2. Eastern Collection, 2006-2010

Twenty-one biotypes were evaluated primarily with propanil, quinclorac and clomazone. For propanil (Table 3), statistically significant RF values ranged from 0.5 to 4.9, related to the GR50 of 896 g ha−1 corresponding to the susceptible biotype, LCh02. Some differences were observed in the degree of resistance between biotypes. For example, CL44, LM01 and RTb01, with RF values between 3 and 5, reached GR50 and GR90 values higher than the propanil label rate (1920 g ha−1), denoting a noteworthy resistance level. Meanwhile, other biotypes such as CB02, RB281, RB282, ZA01, showed RF values below 1 and GR50 values lower than the label rate, but GR90 values higher than the label rate. The rest of the biotypes were susceptible, presenting GR50 and GR90 values lower than the label rate of propanil. The screening reflects differences in the evolutionary process, probably caused by variances in selection pressure, mainly due to rice being cropped many seasons in the same paddock, at times when few chemical options were available.
Data for the quinclorac dose–response assay (Table 4) showed that it was not possible to estimate GR50 values for the susceptible biotype (LM04) and two more, because no model was adjusted with the dose range utilized. All the other biotypes reached a GR50 value higher than the label rate (375 g ha−1), indicating resistance. Even though no model could be fitted for RB281, it turned out to be quinclorac-resistant, which is explained by the fact that its fresh weight decrease was not achived with 3000 g ha−1 of quinclorac. In the second study carried out for quinclorac, with a more ample dose range, the GR50 values for RB281 and ZA01 were much higher than the rate of quinclorac (375 g ha−1) and their RF values were significant, while for E7 biotype, the RF was not significant (Table 5). However, the “c” coefficient remained high for the E7 biotype and was not tangent to zero on the x-axis, indicating that fresh weight was not depleted in the dose range used, confirming its high level of resistance.
For clomazone, RF values were not significant; thus, none of the evaluated biotypes showed resistance to this herbicide (Table 6). Nevertheless, some biotypes such as LCh02, LM01 and LM03 showed a slightly greater GR90 than the label rate (480 g ha−1), perhaps indicating a selection process was occuring. During this period, most of the clomazone was used in a tank-mix with propanil and quinclorac, on early or late postemergence applications. In the last decade, clomazone use has changed, and more the 40% of rice acreage has begun to be treated with glyphosate and clomazone tank-mixed in preemergence [31], which could explain why clomazone is still highly effective in E. crus-galli control.
From this set of biotypes evaluated, LM01 and RTb01 presented a medium level of resistance to propanil and a high level of resistance to quinclorac, while RB281, RB282 and ZA01 presented a high level of resistance to quinclorac. Finally, biotype CL44 only showed medium-level resistance to propanil. The most used herbicide combination between 1995 and 2010 was a tank-mix with propanil + quinclorac, and plus clomazone (since 1995). Irrigation management in early years was not appropriately carried out, meaning that herbicide applications and the water lamina were concreted 45 to 60 days after seeding, with overgrown weeds. In that scenario, we hypothesize that selection pressure leaned more towards quinclorac, facilitating the evolution of resistance in many situations. In the last years of the mentioned period, early postemergence applications covered more acreage, and water management was also improved. In addition to this, more molecules appeared, enabling farmers to diversify in terms of chemical control.
Some of the above evaluated biotypes were also tested with acetolactate synthase-inhibitor herbicides (ALS, Group B-HRAC), along with some collections which originated from side-by-side fields with variable CL history (E0CL, E1CL, E2CL and E3CL). Seventeen biotypes were assessed, and only one showed resistance to IMIS (Table 7). Biotype E0CL was considered the susceptible one for IMIS, although a model could not be adjusted. It was never previously exposed to those herbicides, and it did not produce any biomass with a small dose as 12.25 g ha−1 of imazapyr + imazapic. On the other hand, the GR50 and GR90 values of E3CL were two and six times higher than the label rate, respectively. This biotype (E3CL) originated from a rice field that was cropped with CL rice three years in a row, and four IMIS applications were performed in total.
In the evaluation of bispyribac–sodium (Table 8) and penoxsulam (Table 9), all biotypes were susceptible, with the lowest dose enough to control E. crus-galli. Therefore, no cross-resistance was detected to bispypribac–sodium or penoxsulam and IMIS in biotypes coming from CL fields. The average use of those herbicides before 2010 was not above 20% of the total area, mainly including bispyribac and tank-mixes with other modes of action. Therefore, it was expected not to find biotypes with resistance in such situations.
Obtained results are in accordance with what took place in other regions, where the high reliance on any molecule induces the selection of resistant biotypes [13,15,17,32,33].

3.3. Eastern Collection, 2015, 2016 and 2018

This collection was assessed using a seed-biossay with discriminating concentrations of imazapyr + imazapic. The biotypes came from CL rice fields where E. crus-galli survived without any discernible patterns. The production systems used included three or more years in a row of CL rice, or alternating CL rice–fallow. Most of the evaluated biotypes from 2015 to 2016 were susceptible, except for RT1503, which came from a field with three consecutive years of CL rice, which presented an intermediate behavior (r) denoting a low resistant level (Table 10). In the 2018 collection, biotypes CY1803 and RB1804 were detected to be resistant (R), while biotypes CL441802, RB1803 and ZA1809 showed an intermediate response (r) (Table 11). Biotypes CY1803, RB1804, and RB1803 came from fields with 10 years of alternate CL rice–fallow, and ZA1809 from a field with four CL rice crops in five years. It clearly appears that a higher selection pressure of using the same mode of action increases the development of E. crus-galli biotypes with diverse levels of resistance.

3.4. Northern Region, Since 2014

In the case of propanil, one biotype (TSF7) from the 12 tested had a significant RF of 6, although its GR90 was below the label rate, possibly denoting a low level of resistance. Other biotypes reached an RF of about 6 to 7, but this was not significant. The TVA8 biotype had a GR90 higher than the label dose (Table 12), indicating an early alert sign that could be evolving resistance. Although propanil is the oldest rice herbicide in use in Uruguay, its use has significantly declined in the last decade, due to the availability of new molecules. Furthermore, it has been used mostly in tank-mixes with other modes of action, contributing to delaying the evolutionary process.
For quinclorac, the first series of assays yielded 100% resistance, evidenced by the fact that all biotypes were not controlled by this herbicide. Since there was no good reference for a susceptible biotype for this herbicide in the collection, a biotype from the eastern reference (LM04) was used. Resistance factors from 10 to more than 10 thousand were determined (Table 13), and in all cases, the effective dose to control 90% of the biotype (GR90) was much higher than the herbicide label rate. The biotype TSF7 was the exception because it showed no significant RF; nevertheless, eight times the label rate did not reduce its biomass production much. In some biotypes, such as TAP4, TEV9 and ARI11, even eight times the label rate did not reach any biomass reduction; therefore, no parameters could be calculated (GR50 or RF). Such results are in accordance with the extended history of the widespread use of this herbicide in rice systems, alone or in tank-mixes with propanil and clomazone, among others. Quinclorac has been used with continuous increases of its recommended dose from 320 to 375 g ai ha−1, to 450 to 500 g ai ha−1 in the last 20 years, and complaints about its failures are usual among farmers.
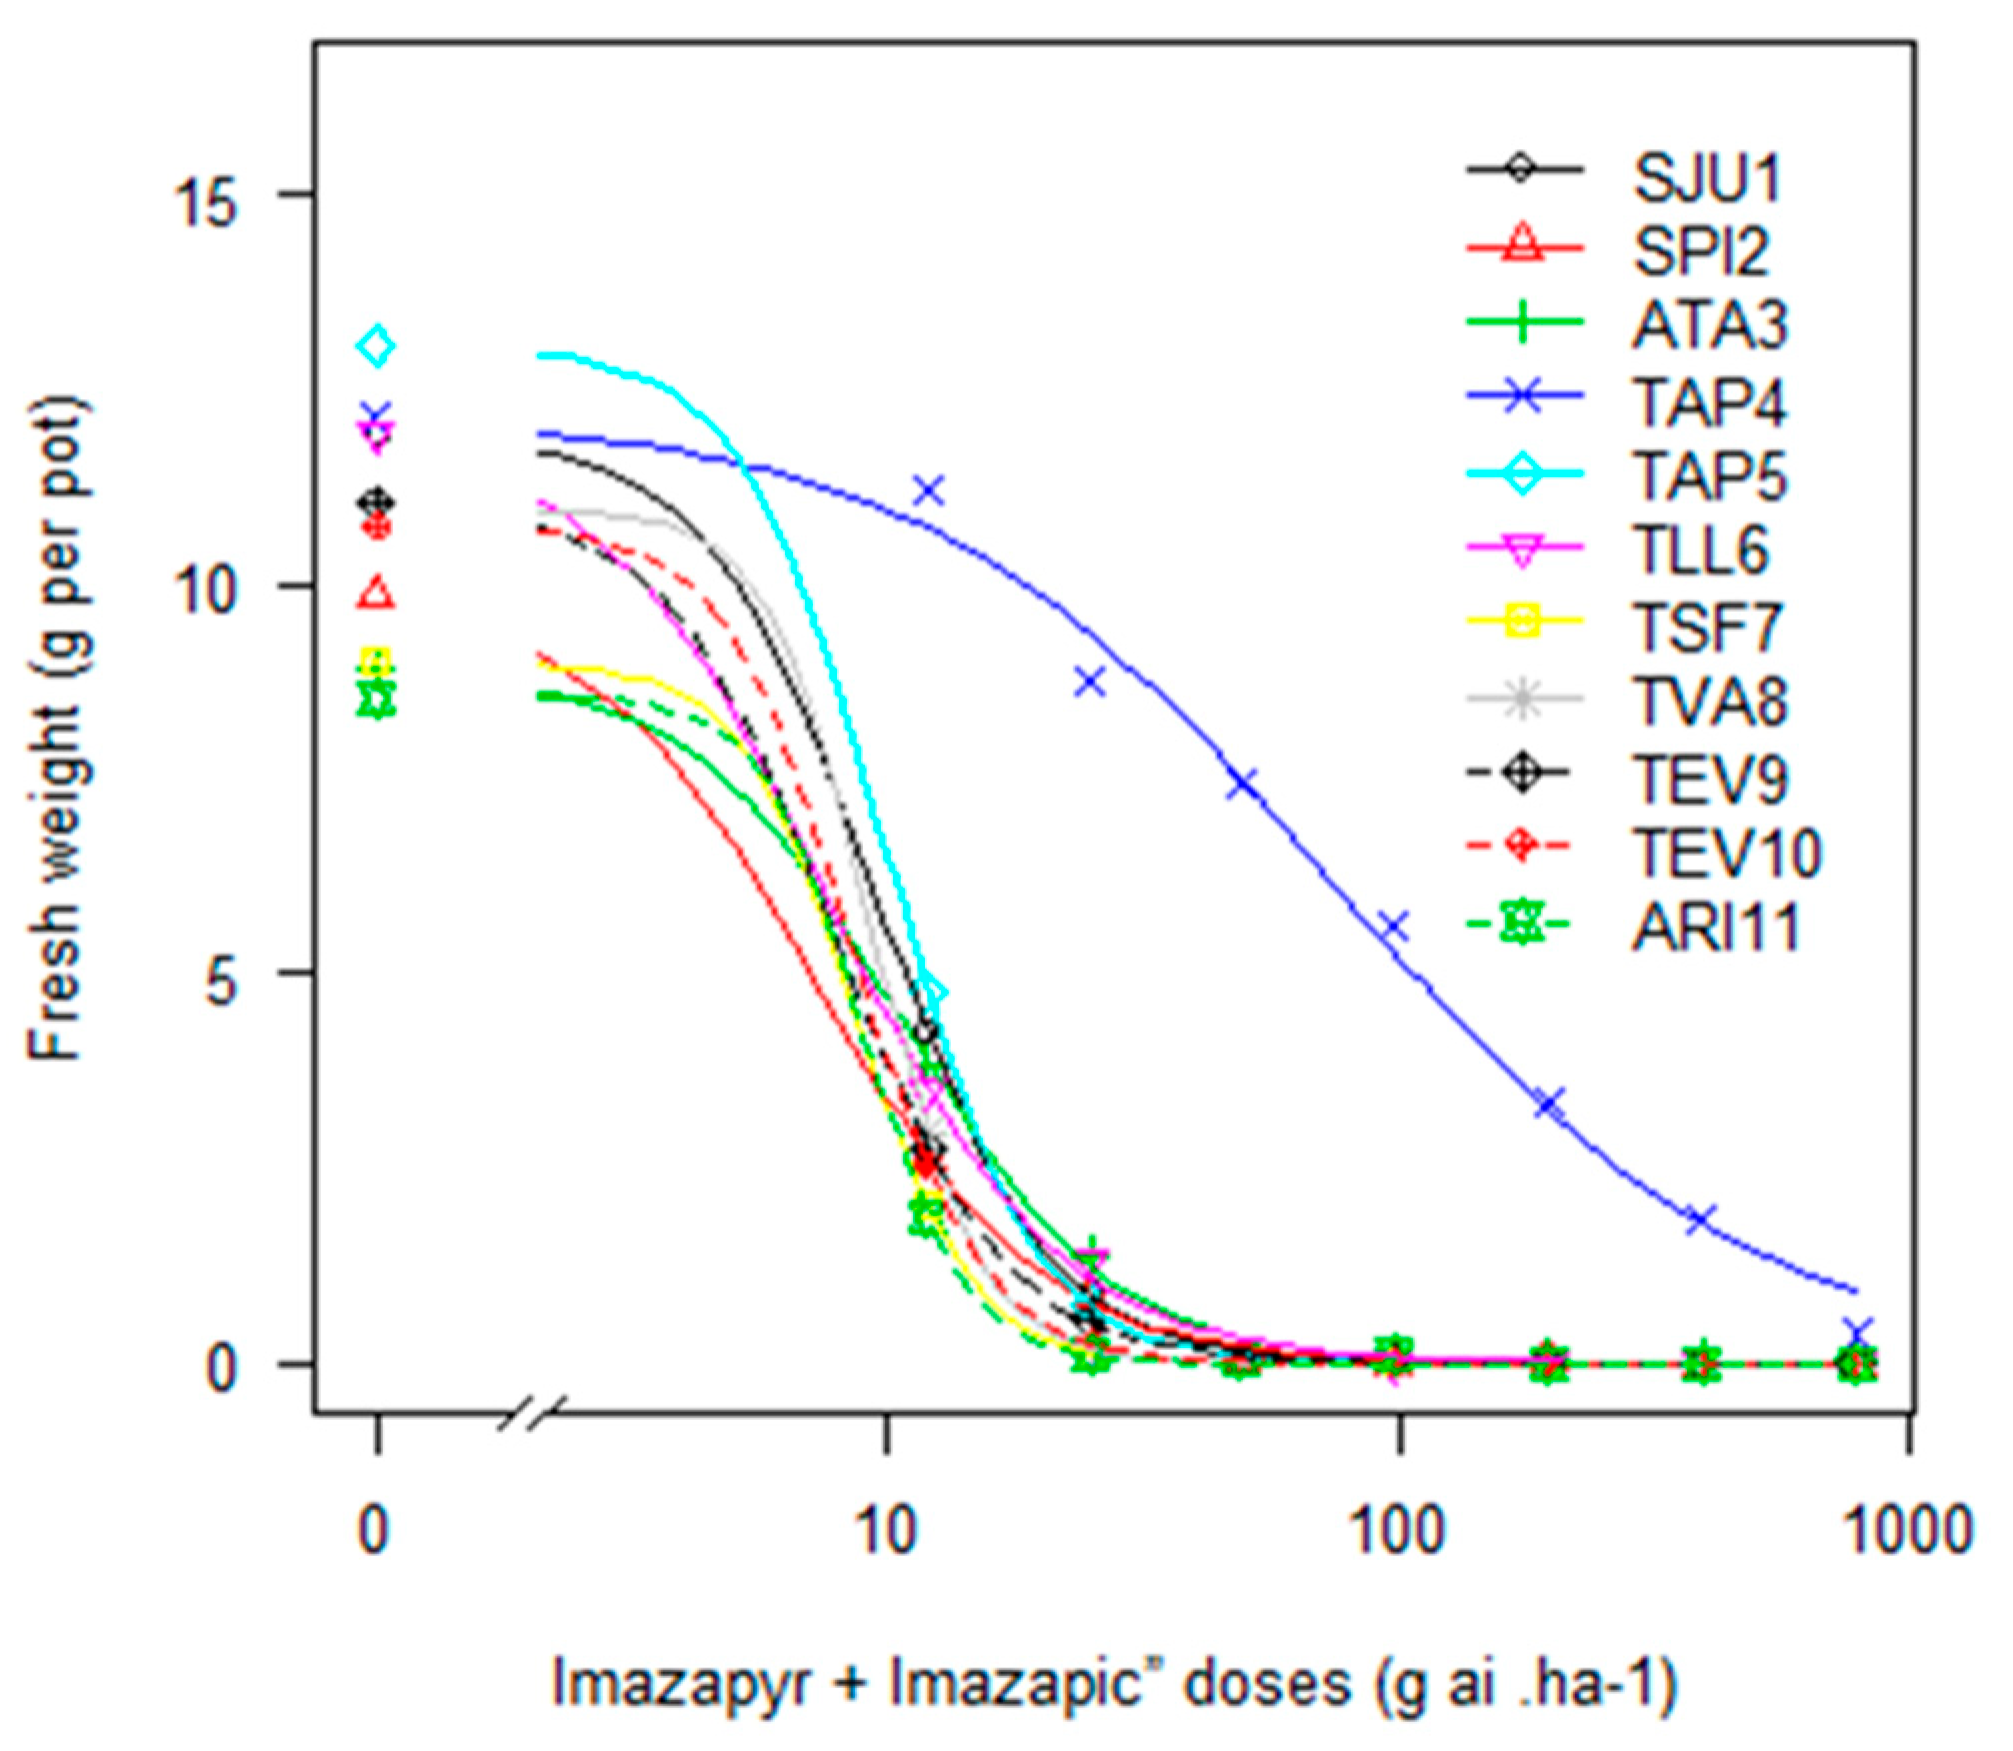
In the study carried out with IMIS, one of the 12 biotypes (TAP4) evidenced resistance (Figure 1). This biotype originated from a CL rice system, presenting a significant RF of 11 ± 2.5, compared to the susceptible biotype (SPI2). The effective dose to control 90% of TAP4 biomass was six times greater than the label recommended rate, denoting the complicated situation for a farmer to deal with this problem. Furthermore, the preliminary results of response curves carried out with recently collected biotypes (four from eight) from CL systems show alarming levels of E. crus-galli IMIS resistance (with GR50 values five to 50 times the label recommended rate of 98 g ai ha−1 (data not shown)).
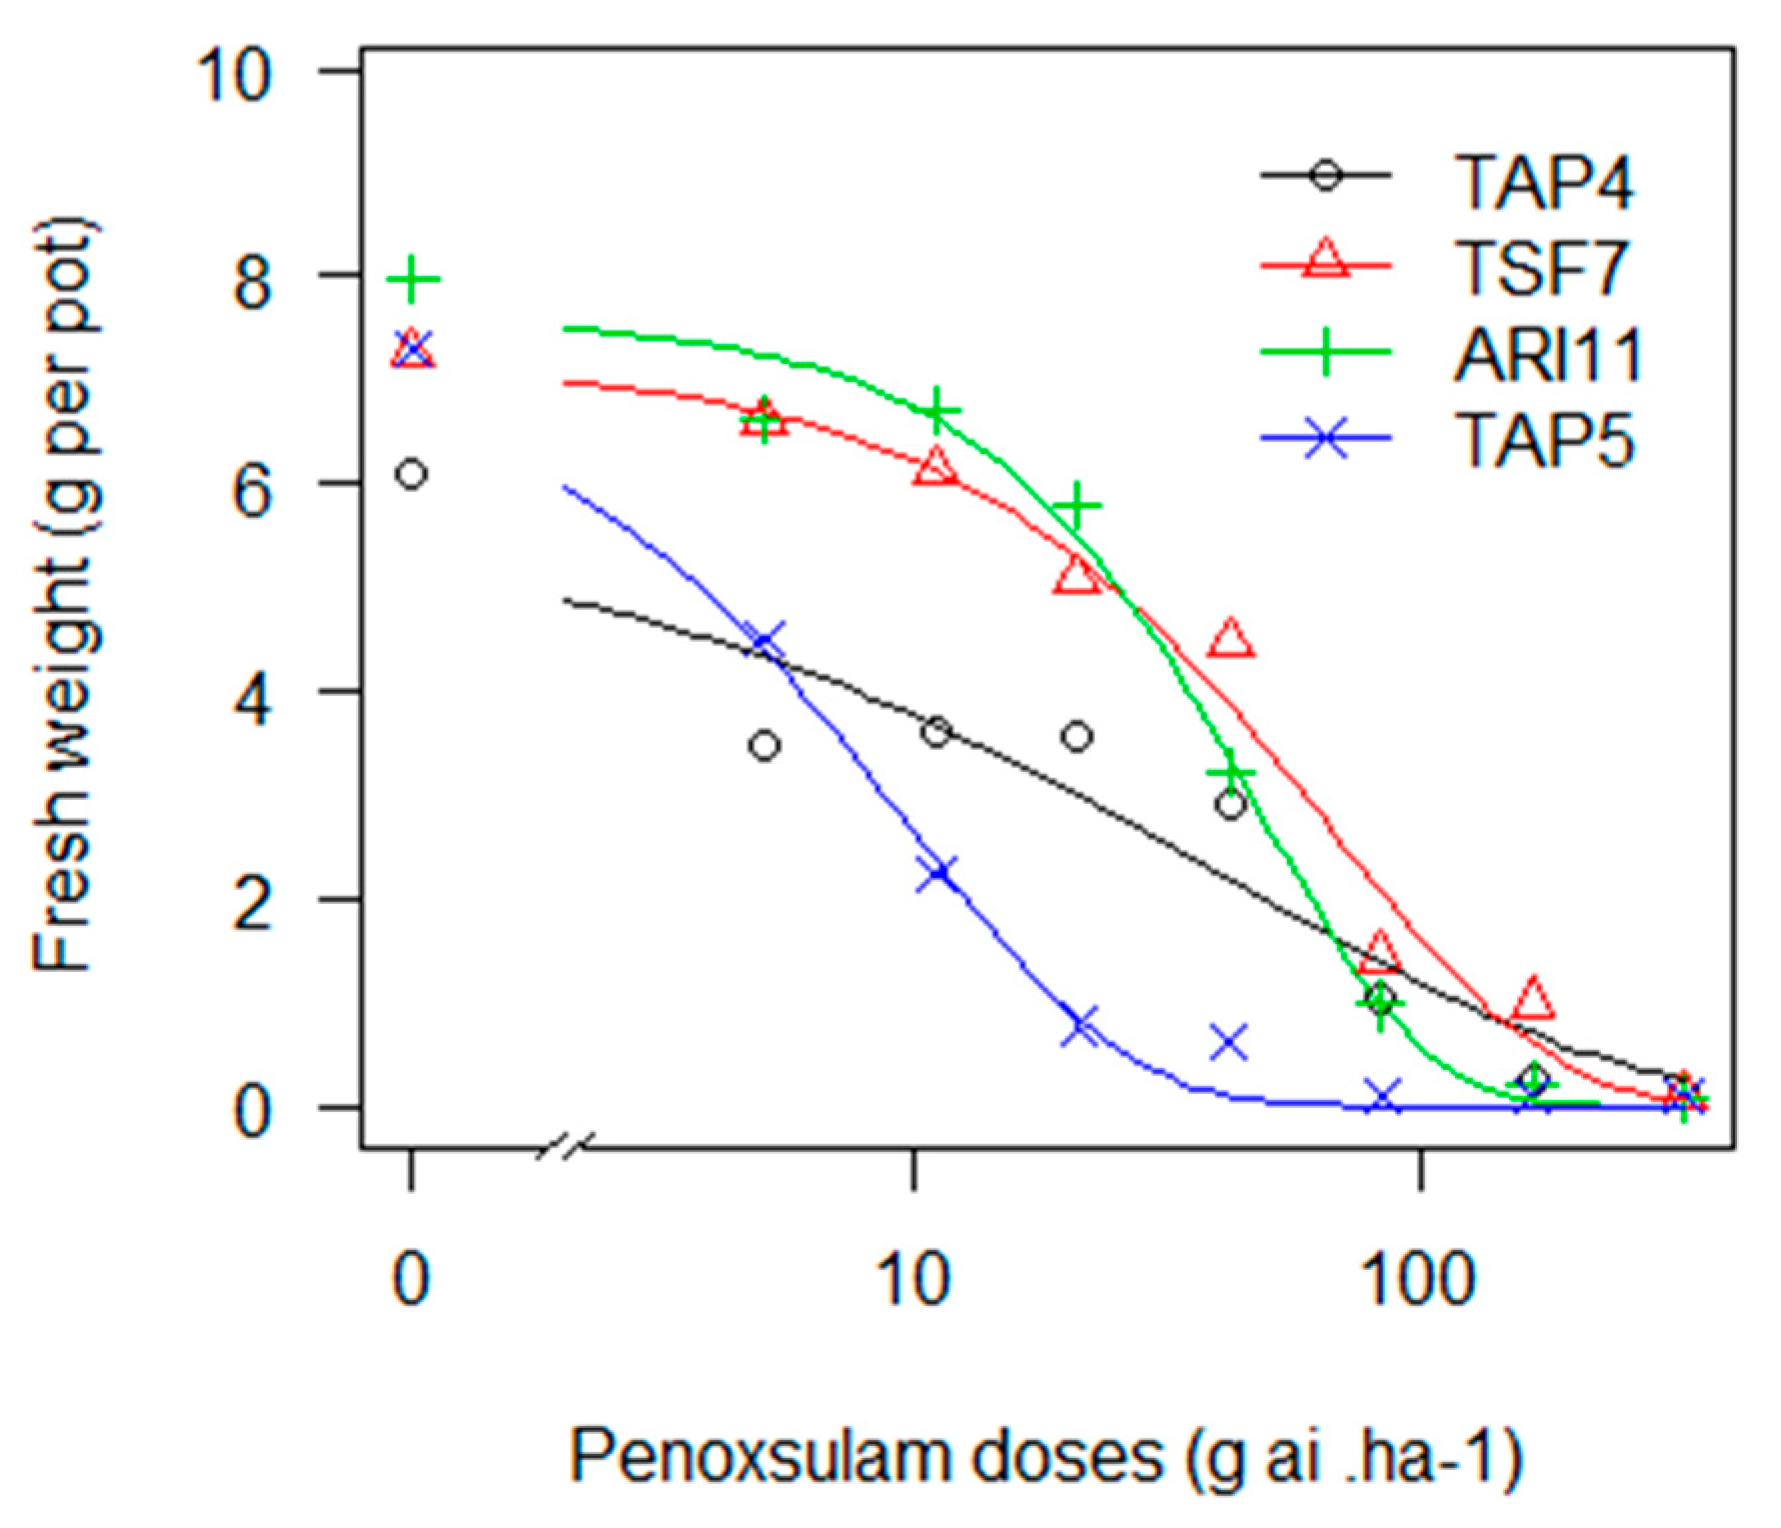
Despite most of the 12 biotypes exhibiting a low GR50 with penoxsulam, TAP4, TSF7 and ARI11 showed a different behaviour (Figure 2). Intermediate and significant RF values (3, 7 and 6, respectively) when compared to the susceptible biotype (TAP5) and a higher GR90 than the label dose (Table 14) may indicate that these biotypes have become resistant to this herbicide. Penoxsulam was introduced in 2004 and has become a relevant molecule in the last decade. In the early years, it was applied alone as a very highly efficient herbicide, but it endured high selection pressure. Moreover, as with IMIS, more emphasis should be placed on the higher risk resulting from the overuse of an ALS herbicide [10]. Most recently, its use has become frequently in mixes with other modes of action.
Biotype TAP4, in summary, showed a wide-ranging ability to survive quinclorac, IMIS, and penoxsulam. This behaviour, characteristic of a multiple resistant biotype, could suggest an eventual metabolic resistance mechanism [34,35]. Such studies are underway, as well as the identification of target site mutations in the ALS enzyme in IMIS and penoxsulam-resistant biotypes, alongside the mechanism involved in quinclorac resistance [36,37,38,39].
Lastly, it is worth mentioning that, in this collection, fortunately, no resistance was found to have evolved against bispyribac–sodium and for both acetyl-CoA carboxylase-inhibitors (ACCase), profoxidim and cyhalofop (data not shown). The use of bispyribac has been reduced to 10% of the total area, mainly in mixes with other modes of action, while cyhalofop has increased its presence to 10%, with profoxidim used in a very small proportion.

3.5. Implications of Herbicide-Resistant E. crus-galli for Rice Production in Uruguay

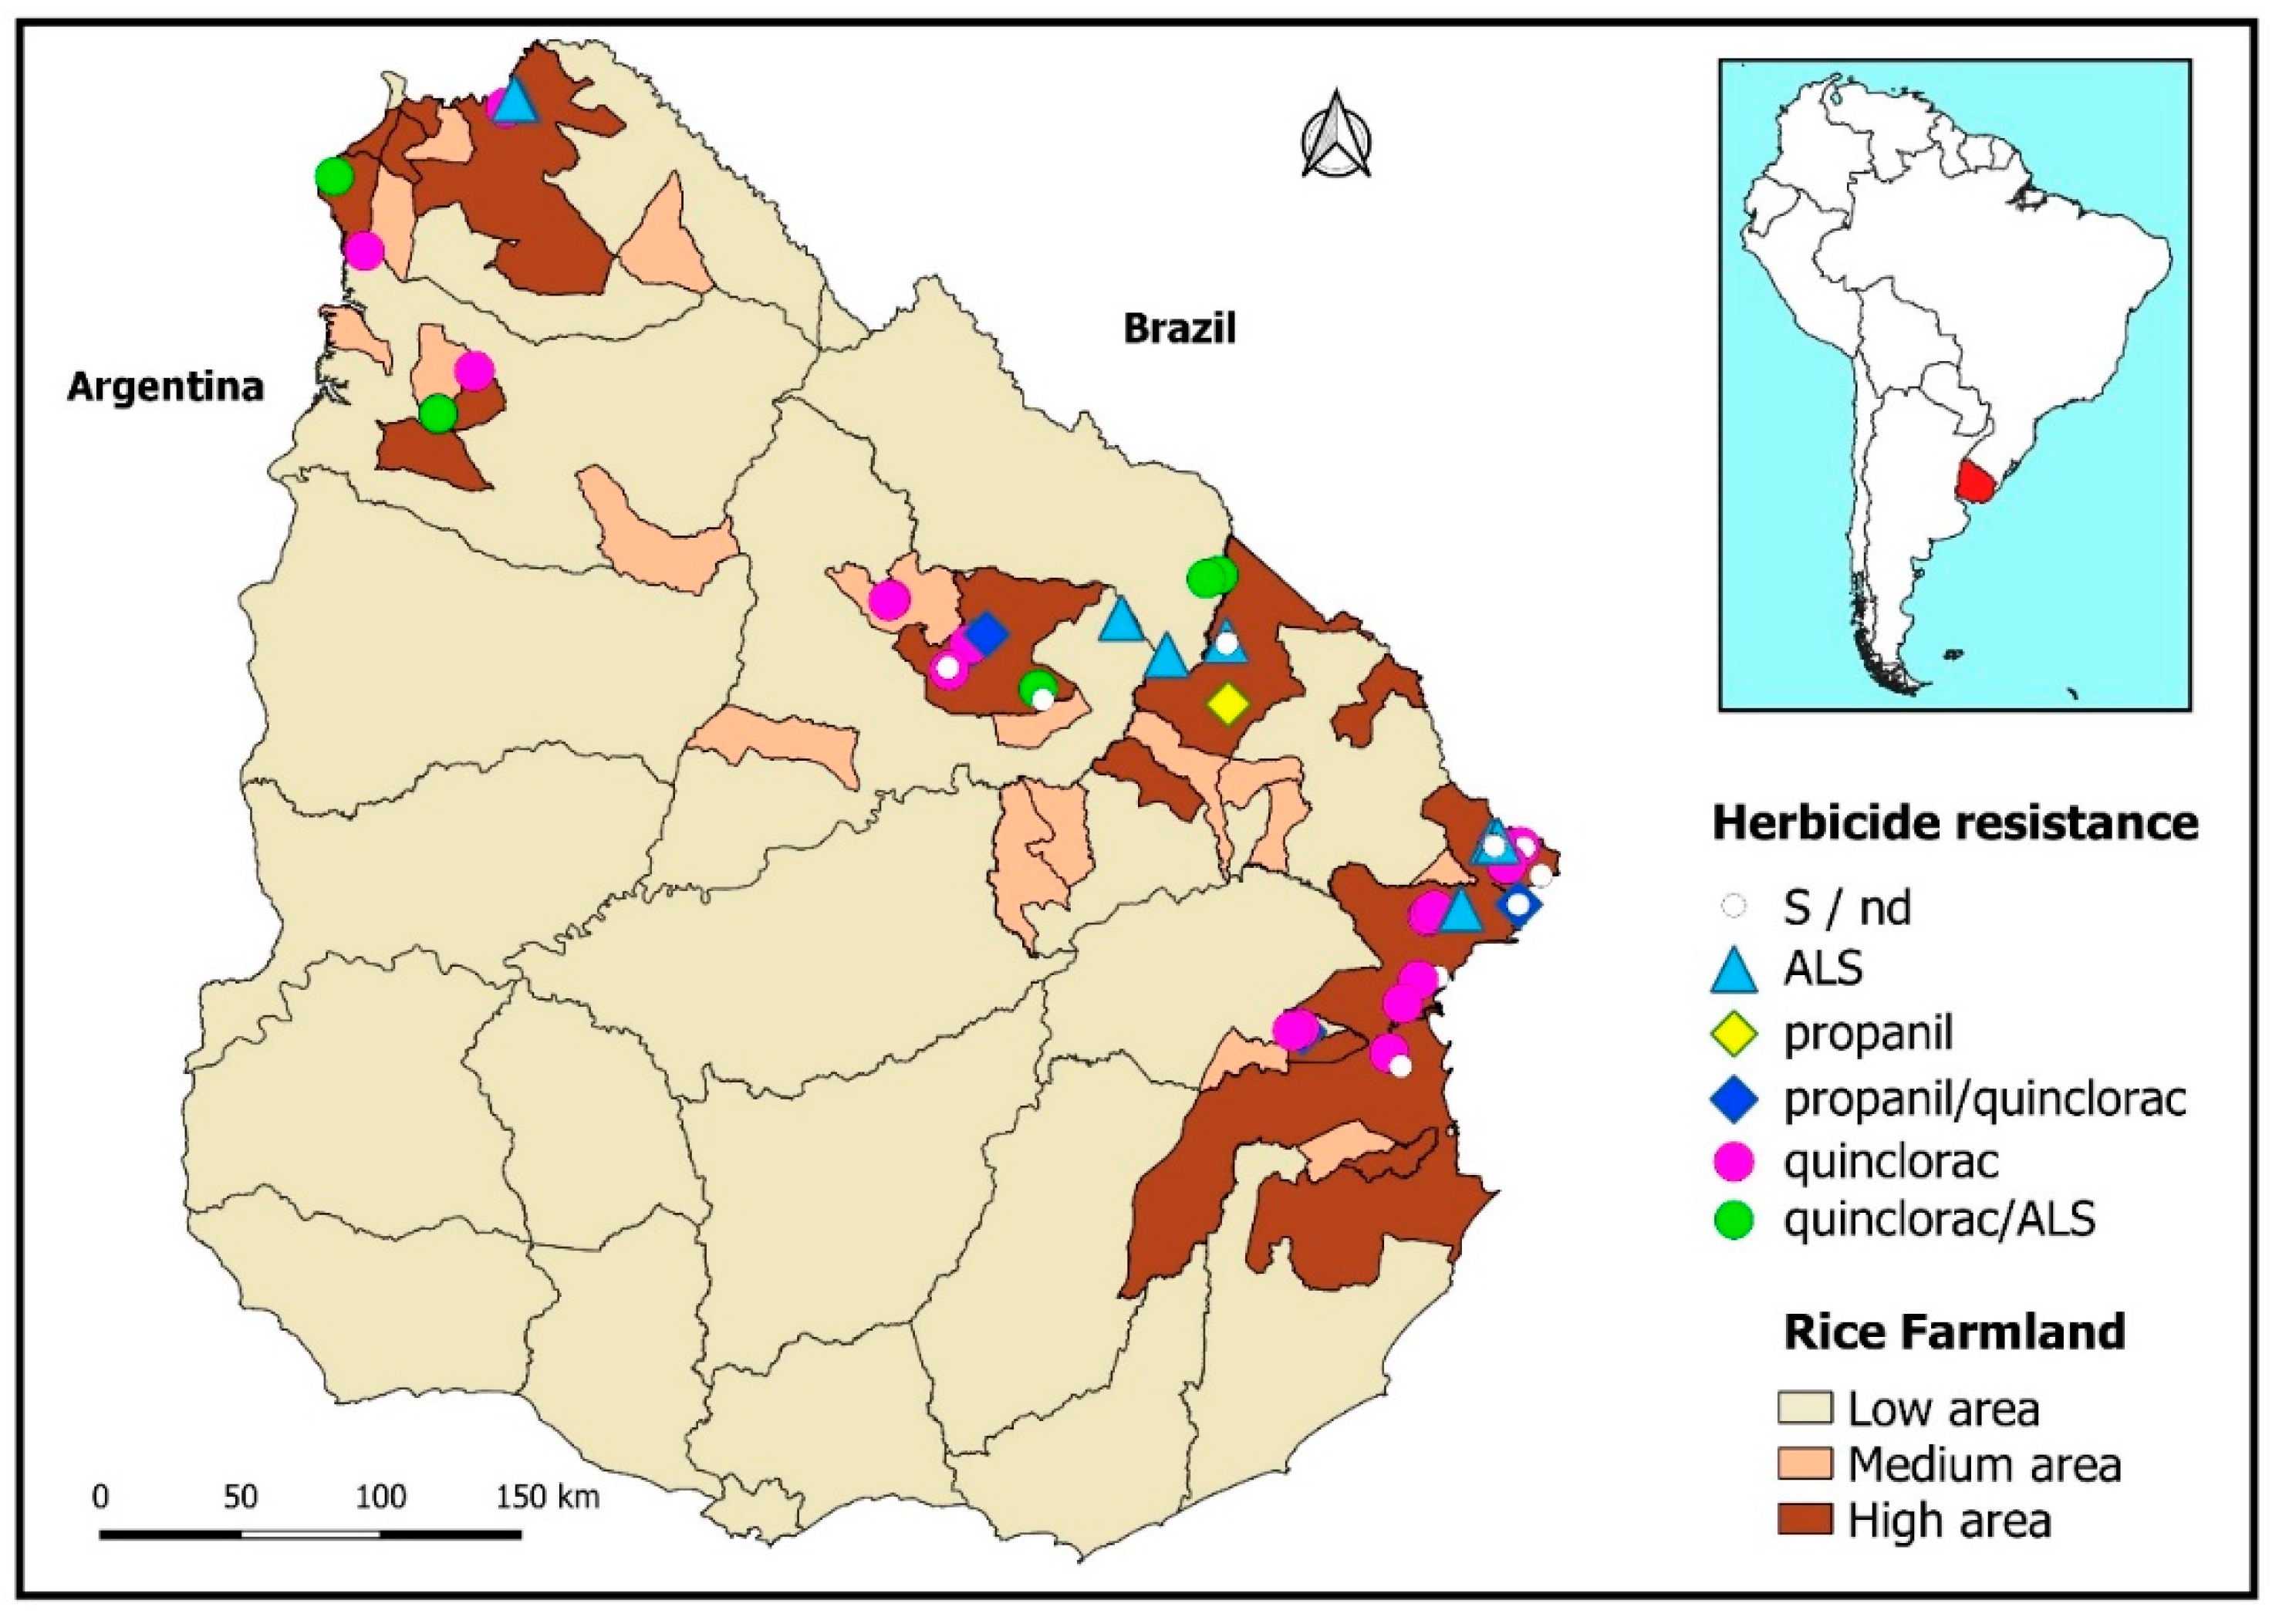
A synopsis of the different biotypes’ resistance statuses can be visualized as disseminated throughout the territory, along with the densest rice cropping areas (Figure 3).
This situation denotes a serious problem for rice farmers because their main weed control management tool is at risk. Not only do they have reduced herbicide options, but also insufficient control leads to low yields and grain quality losses, increased production costs and farmland depreciation. Undoubtedly, a fundamental route to slowing down herbicide resistance is the application of integrated management practices [13,23,40] in which chemical and cultural controls complement each other. These practices could contribute to reducing weed prevalence and dissemination, facilitating the crops’ competition ability or implying a change in the environmental conditions for weed growth through the reduction of their survival rate. Examples of these management actions are the reduction of weed seed entry to the soil seed bank (survivors from herbicide applications) to avoid an in-field increase of them and the use of clean machinery, especially the harvester, to reduce the dispersion of problematic weed biotypes, or the contamination from field to field.
In addition, the use of rotations with other crops could facilitate the use of different combinations of herbicide modes of actions than the ones currently used in rice and with perennial pastures that could break the weeds’ life cycles. This effort should be a collaborative compromise between farmers, researchers, industry and policymakers if the project is to succeed in maintaining sustainable commercial production systems. Moreover, and considering the dimension of the problem, our findings may be of assistance to further research elucidating the underlying resistance mechanism/s. Such information should be the base for developing management strategies to retard the evolution processes. Our paradigm should be to determine how it is possible to maintain both the productivity and sustainability of these highly productive rice systems.

4. Conclusions

This paper contributes to establishing the presence of herbicide-resistance E. crus-galli biotypes in rice production systems in Uruguay.
At the rice field level, quinclorac-resistant biotypes were much more extended than propanil-resistance ones. Meanwhile, under semi-commercial experimental areas of continuous rice at least two-quinclorac spraying were enough to select multiple resistance to propanil- and quinclorac-resistant biotypes.
There was not confirmed clomazone-resistant biotypes until present, and probably, it is due to changes in the clomazone use. In the last decade, it’s use in tank-mix with propanil and quinclorac on early postemergence spraying was replaced by applications in tank mixed with glyphosate in preemergence, followed by a second spraying of other modes of action in postemergence.
Resistance to bispyribac-sodium, cyhalofop-butyl or profoxidim was not detected; instead, resistant biotypes to penoxsulam and to imazapyr + imazapic were confirmed. The latter is associated with an intensive use of Clearfield rice systems and lack of other crop or pasture rotations.
Finally, multiple resistance was also reported for quinclorac, imazapyr + imazapic and penoxsulam in biotype TAP4.

Author Contributions

Conceptualization, C.M. and N.E.S.; methodology, C.M. and N.E.S.; software, C.M. and N.E.S.; validation, C.M. and N.E.S.; formal analysis, C.M. and N.E.S.; investigation, C.M. and N.E.S.; resources, C.M. and N.E.S.; data curation, C.M. and N.E.S.; writing—original draft preparation, C.M.; writing—review and editing, C.M. and N.E.S.; visualization, C.M. and N.E.S.; supervision, C.M. and N.E.S.; project administration, C.M. and N.E.S.; funding acquisition, N.E.S.

Funding

This research was partially funded by FONTAGRO through the project FTG-RF 0608 (Environmental impact of imidazolinonas-resistant rice adoption in contrasting production systems of Latin America).

Acknowledgments

Thanks go to all farmers and technicians that provided seeds and field history information, as well as to Martin Jaurena and Fiorella Cazzuli for their suggestions to improve the manuscript.

Conflicts of Interest

The authors declare no conflict of interest.

Appendix A

Table A1. Echinochloa crus-galli biotypes collected from survivors in rice fields with different history, at lowlands of the Merín Lagoon basin, Eastern region, in 2006, 2007, 2008 and 2010.
Year ofBiotypeDetailed Paddock BackgroundsCoordinates
CollectionCode 1Latitude SLongitude W
2006RTb01Survivors of field sprayed with quinlorac at the double of the label rate−32.019660−55.422555
RTb02"−32.022804−55.435715
2007LM04Few years of rice and quinclorac was never used before−33.057130−53.626280
LM05Many years of propanil and quinclorac tank-mixed and −33.070220−53.700071
ultimately clomazone was added to the mixture. Adequate water
management always was used.
2008CL44Upland sorghum field on the hill, never rice was cropped −32.198969−54.452049
CY01Rice-fallow alternating rotation, year after year−32.630835−53.329310
CY02"−32.633125−53.315492
RB281"−32.689233−53.380479
RB282"−32.686919−53.376712
RBsa0"−32.630013−53.417774
ZA01Rice intensity very variable with scarce short-lived pasture rotation −32.863414−53.673112
ZA02"−32.857430−53.666137
ZA03"−32.844569−53.645979
LM01Rice-fallow alternating rotation, year after year−32.816187−53.328603
LM02"−32.816260−53.328638
LM03Rice intensity very variable with scarce short-lived pasture rotation −33.146640−53.757714
LCh02Pasture paddock from a rice-fallow-rice-pasture rotation (1:1:1:4). −33.244608−54.175697
In a rainy summer, barnyardgrass produced an huge quantity of seeds
CB01Rice intensity very variable −33.307674−53.802677
CB02"−33.348520−53.757084
Test008Seeds were collected in the pre-cleaning discard of the rice industry nana
2010Test010"nana
1 = two, three or four letters refers to a site, followed by the number of biotype; na=not available.

Appendix B

Table A2. Echinochloa crus-galli populations collected from survivors in rice fields with different backgrounds of use of clearfield rice on the Eastern region, 20015, 2016 and 2018.
Year ofPopulationDetailed Paddock BackgroundsSite of CollectionCoordinates
CollectionCode 1Latitude SLongitude W
2015RB1502Clearfield (CL) rice-fallow alternating rotation, three years of CL rice−32.617318−53.437902
RT1501Three CL rice in a rowRice field on a high plain adyacent to−32.834448−53.55156
RT1503"Tacuarí River towards San Fernando−32.835528−53.547022
2016RB1605Clearfield (CL) rice-fallow alternating rotation, three years of CL riceRice field around of Río Branco city−32.625950−53.428719
RB1606""−32.631339−53.426416
RB1607 "−32.720543−53.246457
2018CL441801Clearfield (CL) rice-fallow alternating rotation, year after yearRice field at northwest of the city of32 01.04254 29.476
CL441802"Melo32 01.03254 29.446
CY1803Clearfield (CL) rice-fallow alternating rotation, five years CL riceRice field around of Río Branco city32 35.69953 25.447
LM1806"Rice fields nearby Merín Lagoon town32 41.92953 18.140
LM1807""32 41.92253 18.181
RB1801"Rice fields around of Río Branco city32 39.55653 18.139
RB1802""32 39.53853 18.137
RB1803""32 39.53653 18.113
RB1804""32 37.74053 26.926
RB1805""32 37.70753 26.397
RB1806""32 37.74553 26.923
RT1801CL rice-CL rice-fallow-fallow-CL rice rotationRice field on a high plain adyacent to32 47.37353 30.721
RR1801Frequency of Clearfield rice unknownRice field adyacent to the road from nana
ZA1805CL rice-CL rice-fallow-CL rice-CL rice rotationRice field adjacent to the road towards32 50.35453 39.754
ZA1806"a tip named Zapata on Merín Lagoon32 50.36453 39.742
ZA1807"shore32 50.36953 39.746
ZA1808" 32 50.36853 39.728
ZA1809" nana
RCa1801Frequency of Clearfield rice unknownRice fields adyacent to a road from33 20.94553 53.211
RCa1802"route 13 to Cebollatí river33 21.54453 52.787
1 = two letters (uppercase or uppercase + number) or three letters (two uppercase and one lowercase) refers to a site followed by year of collection and a number of population, na=not available.

References

  1. Fernandez, E.; Ferraro, B.; Lanfranco, B. Uruguay Rice Production: Efficient in the International Market and Supportive of the National Economy. In Proceedings of the 37th Rice Technical Working Group, Long Beach, CA, USA, 22 February 2018; Salassi, M., Linquist, B., Tarpley, L., Eds.; pp. 155–156. [Google Scholar]
  2. MGAP. Anuarios DIEA. Available online: http://www.mgap.gub.uy/unidad-organizativa/oficina-de-programacion-y-politicas-agropecuarias/publicaciones/anuarios-opypa/2017 (accessed on 2 December 2018).
  3. Palmer, N. Uruguay: A Small Country, Big in Rice; Rice Today IRRI: Los Baños, Philippines, 2012; pp. 21–23. [Google Scholar]
  4. Holm, L.; Pucknett, D.; Pancho, J.; Heberger, J. The World’s Worst Weeds; University Press of Hawaii: Honolulu, HI, USA, 1977. [Google Scholar]
  5. Singh, M.; Bhullar, M.S.; Chauhan, B.S. The Critical Period for Weed Control in Dry-Seeded Rice. Crop Prot. 2014, 66, 80–85. [Google Scholar] [CrossRef]
  6. Bhullar, M.S.; Kumar, S.; Kaur, S.; Kaur, T.; Singh, J.; Yadav, R.; Chauhan, B.S.; Gill, G. Management of Complex Weed Flora in Dry-Seeded Rice. Crop Prot. 2016, 83, 20–26. [Google Scholar] [CrossRef]
  7. Deambrosi, E.; Saldain, N. Evaluación de Herbicidas En Distintas Épocas de Aplicación. In Arroz. Resultados Experimentales 2004-2005; INIA: Treinta y Tres, Uruguay, 2005; pp. 1–8. [Google Scholar]
  8. Marchesi, C.; Chauhan, B.S. The Efficacy of Chemical Options to Control Echinochloa Crus-Galli in Dry-Seeded Rice under Alternative Irrigation Management and Fi Eld Layout. Crop Prot. 2019, 118, 72–78. [Google Scholar] [CrossRef]
  9. INIA. Informe de Zafras. Available online: http://www.inia.uy/investigación-e-innovación/programas-nacionales-de-investigación/Programa-Nacional-de-Investigacion-en-Produccion-de-Arroz/informes-de-zafras (accessed on 21 June 2019).
  10. Beckie, H.J. Herbicide-Resistant Weeds: Management Tactics and Practices. Weed Technol. 2006, 20, 793–814. [Google Scholar] [CrossRef]
  11. Neve, P. Simulation Modelling to Understand the Evolution and Management of Glyphosate Resistance in Weeds. Pest Manag. Sci. 2008, 64, 392–401. [Google Scholar] [CrossRef] [PubMed]
  12. Gressel, J.; Segel, L.A. Paucity of Plants Evolving Genetic Resistance to Herbicides—Possible Reasons and Implications. J. Theor. Biol. 1978, 75, 349–371. [Google Scholar] [CrossRef]
  13. Norsworthy, J.K.; Ward, S.M.; Shaw, D.R.; Llewellyn, R.S.; Nichols, R.L.; Webster, T.M.; Bradley, K.W.; Frisvold, G.; Powles, S.B.; Burgos, N.R.; et al. Reducing the Risks of Herbicide Resistance: Best Management Practices and Recommendations. Weed Sci. 2012, 60, 31–62. [Google Scholar] [CrossRef]
  14. Neve, P.; Barney, J.; Buckley, Y.; Cousens, R.; Graham, S.; Jordan, N.R.; Lawton-Rauh, A.; Liebman, M.; Mesgaran, M.; Schut, M.; et al. Reviewing Research Priorities in Weed Ecology, Evolution and Management: A Horizon Scan. Weed Res. 2018, 58, 250–258. [Google Scholar] [CrossRef]
  15. Andres, A.; Theisen, G.; Concenco, G.; Galon, L. Weed Resistance to Herbicides in Rice Fields in Southern Brazil. In Herbicides—Current Research and Case Studies in Use; Intech: Lexington, KY, USA, 2013; pp. 3–26. [Google Scholar] [CrossRef]
  16. Eberhardt, D.S.; Oliveira Neto, A.M.; Noldin, J.A.; Vanti, R.M. Barnyardgrass with Multiple Resistance to Synthetic Auxin, ALS and ACCase Inhibitors. Planta Daninha 2016, 34, 823–832. [Google Scholar] [CrossRef]
  17. Rouse, C.E.; Roma-Burgos, N.; Norsworthy, J.K.; Tseng, T.M.; Starkey, C.E.; Scott, R.C. Echinochloa Resistance to Herbicides Continues to Increase in Arkansas Rice Fields. Weed Technol. 2017, 32, 34–44. [Google Scholar] [CrossRef]
  18. Heap, I.M. The International Survey of Herbicide Resistant Weeds. Available online: www.weedscience.org (accessed on 2 December 2018).
  19. Rampoldi, A.; INTA, Concepción del Uruguay, Argentina. Personal Communication, 2018.
  20. Rosas, J.; Sprunk, B.; Diaz, L.; Ripoll, M.; Perez Ois, M.; Nieto, C.; Sosa, B.; Marchesi, C.; Saldain, N. Intensidad de Uso Del Sistema Clearfield En Arroz y Ocurrencia de Arroz Maleza Resistente a Imidazolinonas. In Arroz 2018; Zorrilla, G., Terra, J., Martinez, S., Eds.; INIA: Montevideo, Uruguay, 2018; pp. 23–25. [Google Scholar]
  21. Goulart, I.; Pacheco, M.; Nunes, A.; Merotto, A., Jr. Identification of Origin and Analysis of Population Structure of Field-Selected Imidazolinone-Herbicide Resistant Red Rice (Oryza Sativa). Euphytica 2012, 187, 437–447. [Google Scholar] [CrossRef]
  22. Kalsing, A.; Goulart, I.; Mariot, C.; Menezes, V.; Matzenbacher, F.; Merotto, A., Jr. Spatial and Temporal Evolution of Imidazolinone-Resitant Red Rice in ’ Clearfield ’ Rice Cultivations. Pesqui. Agropecu. Bras. 2019, 54, S1678–S3921. [Google Scholar] [CrossRef]
  23. Owen, M.D.; Beckie, H.J.; Leeson, J.; Norsworthy, J.K.; Steckel, L.E. Integrated Pest Management and Weed Management in the United States and Canada. Pest Manag. Sci. 2015, 71, 357–376. [Google Scholar] [CrossRef] [PubMed]
  24. Moss, S. Integrated Weed Management (IWM): Why Are Farmers Reluctant to Adopt Non-Chemical Alternatives to Herbicides? Pest Manag. Sci. 2019, 75, 1205–1211. [Google Scholar] [CrossRef] [PubMed]
  25. Matzenbacher, F.; Kalsing, A.; Menezes, V.; Barcelos, J.; Merotto Junior, A. Rapid Diagnosis of Resistance to Imidazolinone Herbicides in Barnyardgrass (Echinochloa Crus-Galli) and Control of Resistant Biotypes with Alternative Herbicides. Planta Daninha 2013, 31, 645–656. [Google Scholar] [CrossRef]
  26. Herbicide Resistance Action Comitee. Available online: https://hracglobal.com/tools/world-of-herbicides-map (accessed on 27 June 2019).
  27. Ritz, C.; Baty, F.; Streibig, J.C.; Gerhard, D. Dose-Response Analysis Using, R. PLoS ONE 2015, 10, 1–13. [Google Scholar] [CrossRef]
  28. Vasilakoglou, I.B.; Eleftherohorinos, I.G.; Dhima, K.V. Propanil-Resistant Barnyardgrass (Echinochloa Crus-Galli) Biotypes Found in Greece. Weed Technol. 2000, 14, 524–529. [Google Scholar] [CrossRef]
  29. Andres, A.; Concenco, G.; Melo, P.; Schmidt, M.; Resende, R. Detection of Echinochloa Sp. Resistance to Quinclorac in Rice Fields in Southern Brazil. Planta Daninha 2007, 25, 221–226. [Google Scholar] [CrossRef]
  30. Malik, M.S.; Burgos, N.R.; Talbert, R.E. Confirmation and Control of Propanil-Resistant and Quinclorac-Resistant Barnyardgrass (Echinochloa Crus-Galli) in Rice. Weed Technol. 2010, 24, 226–233. [Google Scholar] [CrossRef]
  31. Molina, F.; Terra, J.; Roel, A. Evolución de Algunas Variables Tecnológicas En El Cultivo de Arroz En Uruguay. In XI Congresso Brasileiro de Arroz Irrigado; SOSBAI, Ed.; SOSBAI: Camboriu, Brazil, 2019. [Google Scholar]
  32. Talbert, R.E.; Burgos, N.R. History and Management of Herbicide-Resistant Barnyardgrass (Echinochloa Crus-Galli) in Arkansas Rice. Weed Technol. 2007, 21, 324–331. [Google Scholar] [CrossRef]
  33. Chen, G.; Wang, Q.; Yao, Z.; Zhu, L.; Dong, L. Penoxsulam-Resistant Barnyardgrass (Echinochloa Crus-Galli) in Rice Fields in China. Weed Biol. Manag. 2016, 16, 16–23. [Google Scholar] [CrossRef]
  34. Matzenbacher, F.O.; Bortoly, E.D.; Kalsing, A. Distribution and Analysis of the Mechanisms of Resistance of Barnyardgrass (Echinochloa Crus-Galli) to Imidazolinone and Quinclorac Herbicides. J. Agric. Sci. 2015, 153, 1044–1058. [Google Scholar] [CrossRef]
  35. Yu, Q.; Powles, S.B. Resistance to AHAS Inhibitor Herbicides: Current Understanding. Pest Manag. Sci. 2014, 70, 1340–1350. [Google Scholar] [CrossRef] [PubMed]
  36. Mithila, J.; Godar, A. Understanding Genetics of Herbicide Resistance in Weeds: Implications for Weed Management. Adv. Crop. Sci. Technol. 2013, 1, 3–5. [Google Scholar] [CrossRef]
  37. Marchesi, C.; Diez, M.; Saldain, N.; Bonnecarrere, V.; Diaz, P. Limited Induction of Ethylene and Cyanide Biosynthesis Appears to Be Involved in Resistance to Quinclorac in Echinochloa Crus-Galli Biotype Found in Uruguay. In Proceedings of the Global Herbicide Resistance Challenge 2017, Denver, CO, USA, 14–18 May 2017. [Google Scholar]
  38. Wright, A.A.; Rodriguez-Carres, M.; Sasidharan, R.; Koski, L.; Peterson, D.G.; Nandula, V.K.; Ray, J.D.; Bond, J.A.; Shaw, D.R. Multiple Herbicide—Resistant Junglerice (Echinochloa Colona): Identification of Genes Potentially Involved in Resistance through Differential Gene Expression Analysis. Weed Sci. 2018, 66, 1–8. [Google Scholar] [CrossRef]
  39. Peng, Q.; Han, H.; Yang, X.; Bai, L.; Yu, Q.; Powles, S. Quinclorac Resistance in Echinochloa Crus-Galli from China. Rice Sci. 2019, 26, 300–308. [Google Scholar]
  40. Beckie, H.J. Beneficial Management Practices to Combat Herbicide-Resistant Grass Weeds in the Northern Great Plains. Weed Technol. 2007, 21, 290–299. [Google Scholar] [CrossRef]
Figure 1. Fresh weight of E. crus-galli biotypes exposed to increasing doses of imazapyr + imazapic, in a logarithmic scale.
Agronomy 09 00790 g001
Figure 2. Fresh weight of E. crus-galli biotypes exposed to increasing doses of penoxsulam in a logarithmic scale.
Agronomy 09 00790 g002
Figure 3. Distribution of the resistant and susceptible Echinochloa crus-galli biotypes in the rice regions of Uruguay. Darker areas denote greater rice farmland per unit area.
Agronomy 09 00790 g003
Table 1. Characterization of rice production systems in Uruguay.
CharacteristicsEastern RegionNorthern Region
LocationLat. 32–34° Long. 53–54°Lat. 30–32° Long. 54–57°
Rice acreage60%–70%30%–40%
LandscapeFlat with slopes less than 1%Hilly with slopes less than 3%
Main water sourceRiversDams
Main rotationRice/pasturesRice/fallow
Yield average (last 5 years)8.35 ton/ha8.40 ton/ha
Clearfield systems area≥25%<25%
Source: elaborated from official data, Ministerio de Ganadería, Agricultura y Pesca, Dirección de Estadísticas Agropecuarias (MGAP-DIEA) and Asociación de Cultivadores de Arroz (ACA).
Table 2. Coefficients of models adjusted for propanil, quinclorac and clomazone, and resistance factors (RF) for the collection before 2000.
Biotypeb ± sec ± sed ± seGR501 ± seRF2pGR90 ± se
propanil
E332.0 ± 0.2 -6.6 ± 0.71854 ± 10 1.8 ± 0.04<0.00012824 ± 120
E53-------
E631.8 ± 0.1-8.1 ± 0.81779 ± 10 1.7 ± 0.04<0.00012822 ± 115
E733.9 ± 0.5-7.3 ± 0.74123 ± 10 4.3 ± 0.09<0.00015112 ± 150
LCh0131.0 ± 0.09-7.2 ± 1.586 ± 90.07 ± 0.011.0000205 ± 18
LCh02414.9 ± 3.7 -3.0 ± 0.5 896 ± 10 --948 ± 11
quinclorac
E350.2 ± 0.1-10.5 ± 0.654422 ± 58402--4 × 10⁸ ± 1 × 10⁹
E562.1 ± 3.68.9 ± 0.411.4 ± 0.7327 ± 119 --482 ± 327
E651.1 ± 0.3-10.4 ± 0.42958 ± 569--22342 ± 13478
E750.7 ± 0.2-11.6 ± 0.56204 ± 2478--173920 ± 225940
LCh0172.2 ± 0.8-8.2 ± 0.23827 ± 551--5565 ± 1483
LM044No model was adjusted, susceptible
clomazone
E371.4 ± 0.3-7.1 ± 0.5197 ± 2512.0 ± 9.80.2603358 ± 63
E5-------
E672.0 ± 0.5-7.6 ± 0.5214 ± 1914.1 ± 11.40.2501324 ± 46
E771.4 ± 0.3-8.4 ± 0.5334 ± 3420.6 ± 16.70.2413592 ± 86
LCh017No model was adjusted, susceptible
ZA03470.5 ± 0.2-10.5 ± 0.526 ± 14--136 ± 36
1 GR50 = e parameter; 2 RF = GR50×/GR50s; 3 Weibull type 1 model adjusted with three parameters and box-cox transformation (W1.3); 4 susceptible biotype; 5 log logistic model adjusted with three parameters (LL.3); 6 Weibull type 1 model adjusted with four parameters (W1.4); 7 Weibull type 1 model adjusted with three parameters (W1.3). Label rate propanil (1×) = 1920 g ai ha−1; label rate quinclorac (1×) = 375 g ai ha−1; label rate clomazone (1×) = 480 g ai ha−1.
Table 3. Coefficients of the Weibull model type 1 adjusted with three parameters (W1.3) for propanil, and resistance factors (RF).
Biotypeb ± sed ± seGR501 ± seRF2pGR90 ± se
CB011.5 ± 0.1 6.8 ± 0.9565 ± 10 0.5 ± 0.02 <0.0001999 ± 49
CB020.9 ± 0.064.9 ± 0.61246 ± 100.96 ± 0.03<0.00013080 ± 202
CL442.2 ± 0.23.5 ± 0.43233 ± 103.12 ± 0.08<0.00014742 ± 202
CY012.0 ± 0.36.7 ± 1.2670 ± 10 0.64 ± 0.02 <0.00011008 ± 60
CY02------
LCh02315.0 ± 3.73.0 ± 0.5896 ± 10--948 ± 11
LM012.6 ± 0.210.0 ± 0.93455 ± 103.43 ± 0.07<0.00014776 ± 140
LM020.5 ± 0.059.7 ± 1.925 ± 80.01 ± 0.0061.000127 ± 25
LM030.8 ± 0.066.2 ± 1.0247 ± 100.18 ± 0.011.000701 ± 54
LM04------
LM05------
RB2811.1 ± 0.098.3 ± 0.91218 ± 10 0.99 ± 0.03<0.00012614 ± 159
RB2821.0 ± 0.085.1 ± 0.7924 ± 10 0.74 ± 0.02<0.00012062 ± 122
RBsa01.0 ± 0.08 7.2 ± 1.2 218 ± 10 0.18 ± 0.011.000481 ± 30
RTb013.6 ± 0.38.3 ± 0.74771 ± 104.92 ± 0.09<0.00016023 ± 130
RTb020.7 ± 0.06 6.4 ± 1.3 97 ± 100.67 ± 0.0081.000305 ± 29
Test0101.0 ± 0.07 3.0 ± 0.6254 ± 100.19 ± 0.011.000645 ± 51
Test008107.9 ± 100.9 ± 0.21811 ± 102.06 ± 0.03<0.00011825 ± 10
ZA011.0 ± 0.06 12.2 ± 1.21023 ± 100.83 ± 0.02<0.00012250 ± 110
ZA021.1 ± 0.094.8 ± 0.9262 ± 100.22 ± 0.011.000547 ± 35
ZA030.6 ± 0.03 9.3 ± 1.2 326 ± 100.21 ± 0.011.0001242 ± 94
1 GR50 = e parameter; 2 RF = GR50×/GR50s; 3 susceptible biotype. Label rate (1×) = 1920 g ha−1.
Table 4. Coefficients of models adjusted for quinclorac, and resistance factor (RF).
Biotypeb ± sec ± sed ± seGR501 ± seRF2pGR90 ± se
CB0131.5 ± 0.7na5.9 ± 0.33000 ± 510--5250 ± 1937
CB02No model was adjusted, susceptible
CL44No model was adjusted, susceptible
CY0141.4 ± 0.3na7.5 ± 0.41016 ± 176--4655 ± 1522
CY02nananana--na
LCh0241.2 ± 0.5na10.4 ± 0.3814 ± 470--54,059 ± 76,952
LM0140.9 ± 0.3na7.8 ± 0.43134 ± 968--34,711 ± 37,663
LM02nananana--na
LM0330.8 ± 0.6na4.6 ± 0.451,025 ± 10--142,610 ± 116,730
LM045No model was adjusted, susceptible
LM0530.3 ± 0.1na9.4 ± 0.96949 ± 6415--110,501 ± 208,456
RB281No model was adjusted, resistant--
RB28242.0 ± 0.6na6.9 ± 0.3874 ± 125--2551 ± 803
RBsa031.1 ± 0.8na6.6 ± 0.38043 ± 6932--17,269 ± 24,323
RTb0140.6 ± 0.2na13.3 ± 0.512,863 ± 8580--423,770 ± 737,170
RTb0240.4 ± 0.2na6.9 ± 0.65751 ± 4150--948,070 ± 227,7000
Test01030.4 ± 0.2na3.6 ± 0.455,406 ± 10--386,500 ± 362,720
Test00830.01 ± 0.01na3.5 ± 0.42.5x10114 ± 10--4.8 × 10142±2.6 × 10144
ZA016−0.5 ± 4.9na9.9 ± 0.1180,820 ± 7.0 × 10⁶--11.4 × 10⁶ ± 8.7 × 10⁸
ZA0240.3 ± 0.2na7.0 ± 0.634072 ± 77917--2.1 × 10⁷ ± 1.4 × 10⁸
ZA0342.7 ± 1.0na7.3 ± 0.32304 ± 248--5216 ± 1683
1 GR50 = e parameter; 2 RF = GR50x/GR50s; 3 Weibull type 1 model adjusted with three parameters (W1.3); 4 log logistic model adjusted with three parameters (LL.3); 5 susceptible biotype; 6 Weibull type 2 model adjusted with three parameters (W2.3). Label rate (1×) = 375 g ha−1; na = not applicable.
Table 5. Coefficients of the Weibull model type 1 adjusted with four parameters (W1.4) for quinclorac, and resistance factor (RF) of selected biotypes.
Biotypeb ± sec ± sed ± seGR501 ± seRF2pGR90 ± se
E7−0.06 ± 0.0615.8 ± 0.910.0 ± 2.9232,270 ± 106.7 × 10⁶ ± 3.3 × 1070.83985.5 × 1019 ± 1.6 × 10²¹
RB2822.4 ± 1.714.9 ± 0.719.3 ± 0.45032 ± 10574 ± 2700.03507155 ± 1798
ZA010.9 ± 0.31.3 ± 0.810.4 ± 0.54621 ± 10405 ± 1950.03911,945 ± 4007
LM0430.5 ± 0.20.06 ± 0.514.6 ± 0.816 ± 4--99 ± 71
1 GR50 = e parameter; 2 RF = GR50×/GR50s; 3 susceptible biotype. Label rate (1×) = 375 g ha−1.
Table 6. Coefficients of models adjusted for clomazone, and resistance factors (RF).
Biotypeb ± sed ± seGR501 ± seRF2pGR90 ± se
CB01No model was adjusted, susceptible
CB0233.8 ± 1.26.7 ± 0.356 ± 31.7 ± 0.60.2565100 ± 16
CL4440.6 ± 0.18.7 ± 0.571 ± 171.8 ± 2.00.6815271 ± 70
CY01No model was adjusted, susceptible
CY024 50.9 ± 0.87.9 ± 0.532 ± 22--81 ± 23
LCh0240.8 ± 0.34.6 ± 0.5239 ± 667.1 ± 7.80.4371672 ± 274
LM0141.2 ± 0.210.1 ± 0.5315 ± 311.1 ± 1.10.3905633 ± 86
LM02------
LM0340.8 ± 0.24.9 ± 0.5253 ± 697.3 ± 8.10.4362754 ± 265
LM04No model was adjusted, susceptible
LM05------
RB28141.0 ± 0.211.8 ± 0.5115 ± 113.8 ± 4.00.4861256 ± 35
RB28240.5 ± 0.25.6 ± 0.591 ± 362.0 ± 2.40.6718485 ± 211
RBSA0No model was adjusted, susceptible
RTb0142.1 ± 0.68.5 ± 0.5306 ± 241.2 ± 1.30.3851452 ± 57
RTb02------
Test01041.8 ± 0.74.3 ± 0.5164 ± 306.3 ± 6.70.4309257 ± 68
Test00841.1 ± 0.35.3 ± 0.5171 ± 345.7 ± 6.20.4458369 ± 101
ZA0140.6 ± 0.113.7 ± 0.590 ± 132.2 ± 2.40.6057388 ± 66
ZA02No model was adjusted, susceptible
ZA0340.5 ± 0.210.5 ± 0.526 ± 14--136 ± 36
1 GR50 = e parameter; 2 RF = GR50x/GR50s; 3 log logistic model adjusted with three parameters (LL.3); 4 Weibull type 1 model adjusted with three parameters (W1.3); 5 susceptible biotype. Label rate (1×) = 480 g ha−1.
Table 7. Coefficients of Weibull model type 2 adjusted with three parameters (W2.3) for imazapyr + imazapic, and resistance factors (RF).
Biotypeb ± sed ± seGR501 ± seRF2pGR90 ± se
CB01No model was adjusted, susceptible
CB02No model was adjusted, susceptible
CL44No model was adjusted, susceptible
CY01No model was adjusted, susceptible
CY02 No model was adjusted, susceptible
E0CL3No model was adjusted, susceptible
E1CLNo model was adjusted, susceptible
E2CLNo model was adjusted, susceptible
E3CL–2.3 ± 0.92.4 ± 0.1 189 ± 33--567 ± 258
LCh02No model was adjusted, susceptible
LM01No model was adjusted, susceptible
LM03No model was adjusted, susceptible
RBSA0No model was adjusted, susceptible
RTb01No model was adjusted, susceptible
ZA01No model was adjusted, susceptible
ZA02No model was adjusted, susceptible
ZA03No model was adjusted, susceptible
1 GR50 = e parameter; 2 RF = GR50x/GR50s; 3 susceptible biotype. Label rate (1×) = 98 g ha−1.
Table 8. Coefficients of the Weibull model type 2 adjusted with three parameters (W2.3) for bispyribac–sodium, and resistance factors (RF).
Biotypeb ± sed ± seGR501 ± seRF2pGR90 ± se
CB01No model was adjusted, susceptible
CB02No model was adjusted, susceptible
CL44No model was adjusted, susceptible
CY01No model was adjusted, susceptible
CY02 No model was adjusted, susceptible
E0CLNo model was adjusted, susceptible
E1CL3–0.6 ± 0.77.4 ± 0.30.01 ± 0.1--0.5 ± 2.1
E2CLNo model was adjusted, susceptible
E3CL–0.8 ± 0.37.2 ± 0.3 0.9 ± 0.767.1 ± 508.80.896833.5 ± 4.2
LCh02No model was adjusted, susceptible
LM01No model was adjusted, susceptible
LM03No model was adjusted, susceptible
RBSA0No model was adjusted, susceptible
RTb01No model was adjusted, susceptible
ZA01No model was adjusted, susceptible
ZA02No model was adjusted, susceptible
ZA03No model was adjusted, susceptible
1 GR50 = e parameter; 2 RF = GR50x/GR50s; 3 susceptible biotype. Label rate (1×) = 40 g ha−1.
Table 9. Coefficients of the Weibull model type 2 adjusted with three parameters (W2.3) for penoxsulam, and resistance factors (RF).
Biotypeb ± sed ± seGR501 ± seRF2pGR90 ± se
CB01No model was adjusted, susceptible
CB02No model was adjusted, susceptible
CL44No model was adjusted, susceptible
CY01No model was adjusted, susceptible
CY02 No model was adjusted, susceptible
E0CL−3.1 ± 1.15.5 ± 0.34.4 ± 0.31.3 ± 0.20.18919.1 ± 2.2
E1CL−3.0 ± 1.26.3 ± 0.33.9 ± 0.31.1 ± 0.20.44698.4 ± 2.0
E2CL3−3.4 ± 2.75.4 ± 0.33.5 ± 0.7--6.7 ± 2.1
E3CL−2.4 ± 0.68.5 ± 0.33.7 ± 0.31.1 ± 0.20.54029.3 ± 1.7
LCh02−2.0 ± 0.610.1 ± 0.52.6 ± 0.50.8 ± 0.20.27228.0 ± 1.4
LM01No model was adjusted, susceptible
LM03No model was adjusted, susceptible
RBSA0No model was adjusted, susceptible
RTb01No model was adjusted, susceptible
ZA01No model was adjusted, susceptible
ZA02No model was adjusted, susceptible
ZA03No model was adjusted, susceptible
1 GR50 = e parameter; 2 RF = GR50x/GR50s; 3 susceptible biotype. Label rate (1×) = 42 g ha−1.
Table 10. Echinochloa crus-galli growth and level of resistance, after being exposed to a discriminating rate of imazapyr + imazapic, 2015–2016.
BiotypeFresh WeightPairwise Comparison 1Resistance Level
E0CLE3CL
E0CL20.1520 a –0.134 bS
E3CL30.2850.134 b 0 aR
RB15020.1730.022 a –0.112 bS
RB16050.147−0.005 a –0.138 bS
RB16060.1800.028 a –0.106 bS
RB16070.1530.002 a –0.132 bS
RT15010.1880.036 a –0.097 bS
RT15030.2300.078 b –0.055 br
1 Pairwise comparison between each biotype and the susceptible or resistant one, using the Dunnet test with alpha = 0.05; 2 susceptible biotype; 3 resistant biotype. Discriminating concentration = 126.5 + 38.5 mg/L of imazapyr + imazapic.
Table 11. Echinochloa crus-galli growth and level of resistance, after being exposed to a dicriminating rate of imazapyr + imazapic, 2018.
BiotypeFresh WeightPairwise Comparison 1Resistance Level
E0CLE3CL
E0CL 20.1520 a–0.134bS
E3CL 30.2850.134 b0 aR
CL4418010.2110.018 a–0.104 bS
CL4418020.2550.062 b–0.060 br
CY18030.2740.081 b–0.042 aR
LM18060.185−0.008 a–0.130 bS
LM18070.171−0.022 a–0.144 bS
RB18010.177–0.015 a–0.138 bS
RB18020.2320.039 a–0.084 bS
RB18030.2500.057 b–0.065 br
RB18040.2800.087 b–0.035 aR
RB18050.190–0.003 a–0.125 bS
RB18060.2240.031 a–0.091 bS
RCa18010.2290.036 a–0.087 bS
RCa18020.2350.042 a–0.080 bS
RR18010.158–0.035 a–0.158 bS
RT18010.2200.027 a–0.095 bS
ZA18050.2060.013 a–0.109 bS
ZA18060.2370.044 a–0.078 bS
ZA18070.2370.044 a–0.078 bS
ZA18080.2180.024 a–0.099 bS
ZA18090.2410.048 b–0.074 br
1 Pairwise comparison between each biotype and the susceptible or resistant one, using the Dunnet test with alpha = 0.05; 2 susceptible biotype; 3 resistant biotype. Discriminating concentration = 126.5 + 38.5 mg/l of imazapyr + imazapic.
Table 12. Coefficients of models adjusted for propanil, and resistance factor (RF).
Biotypeb ± sed ± seGR501 ± seRF 2 pGR90 ± se
SJU1340.48 ± 0.139.60 ± 0.53173 ± 63----975 ± 309
SPI231.47 ± 0.279.56 ± 0.52597 ± 555.8 ± 3.20.13731175 ± 192
ATA351.85 ± 0.2610.21 ± 0.45338 ± 313.2 ± 1.10.05631107 ± 179
TAP452.10 ± 0.3110.53 ± 0.45313 ±252.9 ± 1.00.0643891 ± 133
TAP535.54 ± na6.21 ± 0.53281 ± nanana785 ± 191
TLL632.05 ± 0.527.93 ± 0.51553 ± 515.8 ± 3.20.1372578 ± na
TSF752.54 ± 0.329.78 ± 0.40655 ± 526.1 ± 2.30.02731556 ± 208
TVA830.98 ± 0.1014.80 ± 0.53850 ± 657.3 ± 4.00.12022394 ± 300
TEV930.90 ± 0.1213.12 ± 0.52580 ± 534.8 ± 2.70.15571560 ± 261
TEV1031.33 ± 0.239.82 ± 0.52710 ± 676.7 ± 3.70.12721512 ± 248
ARI1131.19 ± 0.1910.17 ± 0.52621 ± 615.7 ± 3.20.14031374 ± 236
TEP1231.22 ± 0.1910.80 ± 0.52712 ± 656.6 ± 3.60.12801611 ± 252
1 GR50 = e parameter; 2 RF = GR50x/GR50s; 3 Weibull type 1 model adjusted with three parameters (W1.3); 4 susceptible biotype; 5 log logistic model adjusted with three parameters (LL.3); Label rate (1×) = 1920 g ha−1.
Table 13. Coefficients of models adjusted for quinclorac, and resistance factors (RF).
Biotypeb ± sed ± seGR501 ± seRF2pGR90 ± se
SJU131.75 ± 0.355.3 ± 0.25279 ± 3911.1 ± 40.0125979 ± 284
SPI240.72 ± 0.106.5 ± 0.28313 ± 109.6 ± 40.01751004 ± 195
ATA340.91 ± 0.108.1 ± 0.28448 ± 1015.3 ± 60.01211114 ± 155
TAP4No model was adjusted, resistant
TAP541.50 ± 0.325.8 ± 0.175580 ± 10225 ± 830.00749566 ± 5686
TLL640.27 ± 0.066.8 ± 0.341,220,400 ± 1015,720 ± 75070.036928,086,000 ± na
TSF7347.7 ± 48275.2 ± 0.15270 ± 898210.7 ± 3560.9780282 ± 8850
TVA840.25 ± 0.056.4 ± 0.35638 ± 1074.9 ± 350.0344182,300 ± 237,020
TEV9No model was adjusted, resistant
TEV1040.29 ± 0.065.9 ± 0.3313,120 ± 101903 ± 8500.02542,289,000 ± 34,574,000
ARI11No model was adjusted, resistant
TEP1231.38 ± 0.454.1 ± 0.24520 ± 15920.6 ± 90.03672553 ± 1895
LM04 351.21 ± 0.486.4 ± 0.3025.2 ± 8.4----155 ± 75
LM04 450.60 ± 0.186.4 ± 0.3536.4 ± 7.8----na
1 GR50 = e parameter; 2 RF = GR50x/GR50s; 3 log-logistic model with four-parameters (LL.4), with “c” = 0.05 ± 0.3; 4.45 ± 0.2; 0.14 ± 0.6 and 0.03 ± 0.2 for biotypes SJU1, TSF7, TEP12 and LM04, respectively; 4 Weibull type 1 model with three parameters (W1.3); 5 susceptible biotype. Label rate (1×) = 375 g ai ha−1; na = not applicable.
Table 14. Coefficients of the Weibull type 1 model with three parameters (W1.3) models adjusted for penoxsulam and resistance factor (RF).
Biotypeb ± sed ± seGR501 ± seRF 2 pGR90 ± se
SJU11.57 ± 0.425.0 ± 0.3623.1 ± 2.92.7 ± 0.60.0520?39.2 ± 7.5
SPI21.10 ± 0.236.0 ± 0.3919.3 ± 2.62.1 ± 0.50.027841.2 ± 8.6
ATA30.85 ± 0.176.0 ± 0.4025.8 ± 4.22.5 ± 0.60.022469.0 ± 16.2
TAP40.55 ± 0.105.9 ± 0.4343.1 ± 9.93.3 ± 1.20.0485193.7 ± 54.3
TAP531.00 ± 0.277.3 ± 0.469.7 ± 1.3----22.3 ± 5.7
TLL60.85 ± 0.147.5 ± 0.4013.5 ± 1.71.3 ± 0.30.335636.1 ± 6.8
TSF70.99 ± 0.187.2 ± 0.3667.5 ± 7.96.9 ± 1.50.0001155.6 ± 28.4
TVA80.48 ± 0.086.4 ± 0.4116.5 ± 3.91.1 ± 0.40.743795.5 ± 28.6
TEV90.54 ± 0.124.8 ± 0.4124.7 ± 6.81.9 ± 0.70.2416114.9 ± 41.6
TEV100.74 ± 0.136.6 ± 0.4025.2 ± 4.02.3 ± 0.60.030077.5 ± 18.1
ARI111.32 ± 0.297.6 ± 0.4148.9 ± 5.15.5 ± 1.20.000192.0 ± 15.7
TEP121.14 ± 0.217.4 ± 0.4224.2 ± 2.62.6 ± 0.60.005750.5 ± 7.5
1 GR50 = e parameter; 2 RF = GR50x/GR50s; 3 susceptible biotype; label rate (1×) = 42 g ai ha−1.

