Article

Lessons from Assessing Uncertainty in Agricultural Water Supply Estimation for Sustainable Rice Production

1
Department of Agricultural and Biological Engineering & Tropical Research and Education Center, University of Florida, Homestead, FL 33031, USA
2
Department of Rural Systems Engineering, Seoul National University, Seoul 08826, Korea
3
Prediction Research Department, APEC Climate Center, Busan 48058, Korea
4
Department of Rural Systems Engineering, Research Institute for Agriculture and Life Sciences, Institute of Green Bio Science and Technology, Seoul National University, Seoul 08826, Korea
*
Author to whom correspondence should be addressed.
Agronomy 2019, 9(10), 662; https://doi.org/10.3390/agronomy9100662
Submission received: 14 August 2019 / Revised: 14 October 2019 / Accepted: 17 October 2019 / Published: 21 October 2019
(This article belongs to the Special Issue Model Application for Sustainable Agricultural Water)

Abstract

:
Agricultural water supply (AWS) estimation is one of the first and fundamental steps of developing agricultural management plans, and its accuracy must have substantial impacts on the following decision-making processes. In modeling the AWS for paddy fields, it is still common to determine parameter values, such as infiltration rates and irrigation efficiency, solely based on literature and rough assumptions due to data limitations; however, the impact of parameter uncertainty on the estimation has not been fully discussed. In this context, a relative sensitivity index and the generalized likelihood uncertainty estimation (GLUE) method were applied to quantify the parameter sensitivity and uncertainty in an AWS simulation. A general continuity equation was employed to mathematically represent the paddy water balance, and its six parameters were investigated. The results show that the AWS estimates are sensitive to the irrigation efficiency, drainage outlet height, minimum ponding depth, and infiltration, with the irrigation efficiency appearing to be the most important parameter; thus, they should be carefully selected. Multiple combinations of parameter values were observed to provide similarly good predictions, and such equifinality produced the substantial amount of uncertainty in AWS estimates regardless of the modeling approaches, indicating that the uncertainty should be counted when developing water management plans. We also found that agricultural system simulations using only literature-based parameter values provided poor accuracy, which can lead to flawed decisions in the water resources planning processes, and then the inefficient use of public investment and resources. The results indicate that modelers’ careful parameter selection is required to improve the accuracy of modeling results and estimates from using not only information from the past studies but also modeling practices enhanced with local knowledge and experience.

1. Introduction

Many studies have attempted to understand and quantify the hydrologic consequences of man-made disturbances from different perspectives, and the human activities associated with agriculture are now commonly incorporated into hydrological modeling in the forms of farming (land use), irrigation (water resource management), and drainage (water quantity and quality control) [1,2,3,4,5,6]. Modeling a hydrological cycle considering direct human interventions remains challenging, as it is difficult to determine the set of parameter values (i.e., parameterization) that represent human interventions, including reservoir operation [7,8,9], water diversion [10], groundwater pumping [11], and surface drainage from cultivated fields [2,3,4]. The limitations of anthropogenic component parameterization must be considered when modeling agricultural systems, including irrigation water supply, as they can significantly affect the following decision-making processes for improved agricultural sustainability.
Agricultural water supply (AWS) is the amount of water supplied from irrigation facilities, and its accurate estimation is essential, considering the combination of limited water resources and the ever-growing water demand [7,8,9,12]. The prediction of accurate variations in the demand for irrigation water by irrigation districts is important to ensure a stable irrigation water supply and to operate irrigation reservoirs efficiently [2]. Monitoring is the most accurate way to quantify AWS, but irrigation facilities are generally distributed in low densities across areas, so it is often economically challenging to measure them all for both developed and developing countries [13]. The AWS could be indirectly estimated from gate operation records, using hydraulic calculations [14,15,16]; however, small agricultural reservoirs operated by farmers usually do not have detailed operation records, and it is difficult to obtain such records for large reservoirs because of security reasons, especially where water conflicts exist or multiple use interests are involved [17,18].
The AWS can be estimated by calculating the irrigation water requirement (IWR) and delivery management water requirement (DMWR). The IWR for rice paddy fields can be determined by estimating the daily water demand necessary to maintain the optimal water levels for paddy rice growth during each cropping period; this is calculated as a function of meteorological data and farming practice parameters [8,9,12,19]. The DMWR is usually calculated by adopting the irrigation efficiency ( E s ) parameter [8,10,20]. However, the actual AWS is controlled by the managers (or operators) of irrigation facilities, considering water demand estimates based on their customary experience, and is not usually determined by calculating the IWR. Therefore, it is necessary to evaluate whether AWS estimation can reflect the pattern of the actual AWS.
In the mathematical model for simulating AWS, water control practices for rice paddy fields, such as the height of the outlet weir and minimum ponding depth, are used as model parameters. However, measuring these parameters at fields of interest is often impractical, particularly when considering the fact that there are many paddy fields distributed and surrounded by levees in a single irrigation and drainage district [3,21]. In addition, the parameters representing the hydrological characteristics of paddy fields, such as the infiltration parameter ( I N F ), are also too expensive to be measured through field experiments and laboratory tests for the same reason [8]. These parameters are associated with the characteristics of irrigation districts and farm management practices, which are highly variable depending on the hydrological characteristics [22]. Several studies have applied AWS models to estimate water requirements; however, these sensitive parameters were determined on the basis of the literature [7,9,23,24], which has often led to substantial errors in the estimates [9,20].
Furthermore, some studies have attempted to calibrate the AWS parameters to observations made at fields. Anan et al. [21] estimated regional water requirements by incorporating empirical water management practices into the Tank model, which is a widely used lumped bucket-type daily rainfall–runoff model, prepared for an irrigation district of interest. They calibrated the model parameters associated with water management practices using a sampling-based optimization algorithm, the shuffled complex evolution algorithm (SCE). Im et al. [25] and Song et al. [8] linked an AWS model to a reservoir routing model, and then calibrated the AWS parameters by setting the reservoir water levels as a calibration target to estimate the AWS.
However, in previous studies, the parameter sensitivity and uncertainty in agricultural system modeling have not been sufficiently discussed to provide a clear idea of their impacts on AWS determination and the following decision-making processes, even though equifinality issues have been discussed in the field of hydrological modeling [8,20,26,27,28]. In particular, the irrigation efficiency in rice paddy fields has been reported to vary substantially every year, and small changes in the irrigation efficiency could lead to large differences in the AWS estimate and the following management and construction decisions [8]. Therefore, it is necessary to evaluate the parameter selection practices and schemes for AWS estimation and to quantify the parameter uncertainty and its impacts on AWS modeling. This study assessed the parameter sensitivity by employing a relative sensitivity index, and the generalized likelihood uncertainty estimation (GLUE) framework was applied in the AWS model to identify the parameter uncertainty. Finally, we assessed the efficiency of four parameter selection schemes with the goal of providing considerations on parameter selection for reliable AWM estimation.

2. Materials and Methods

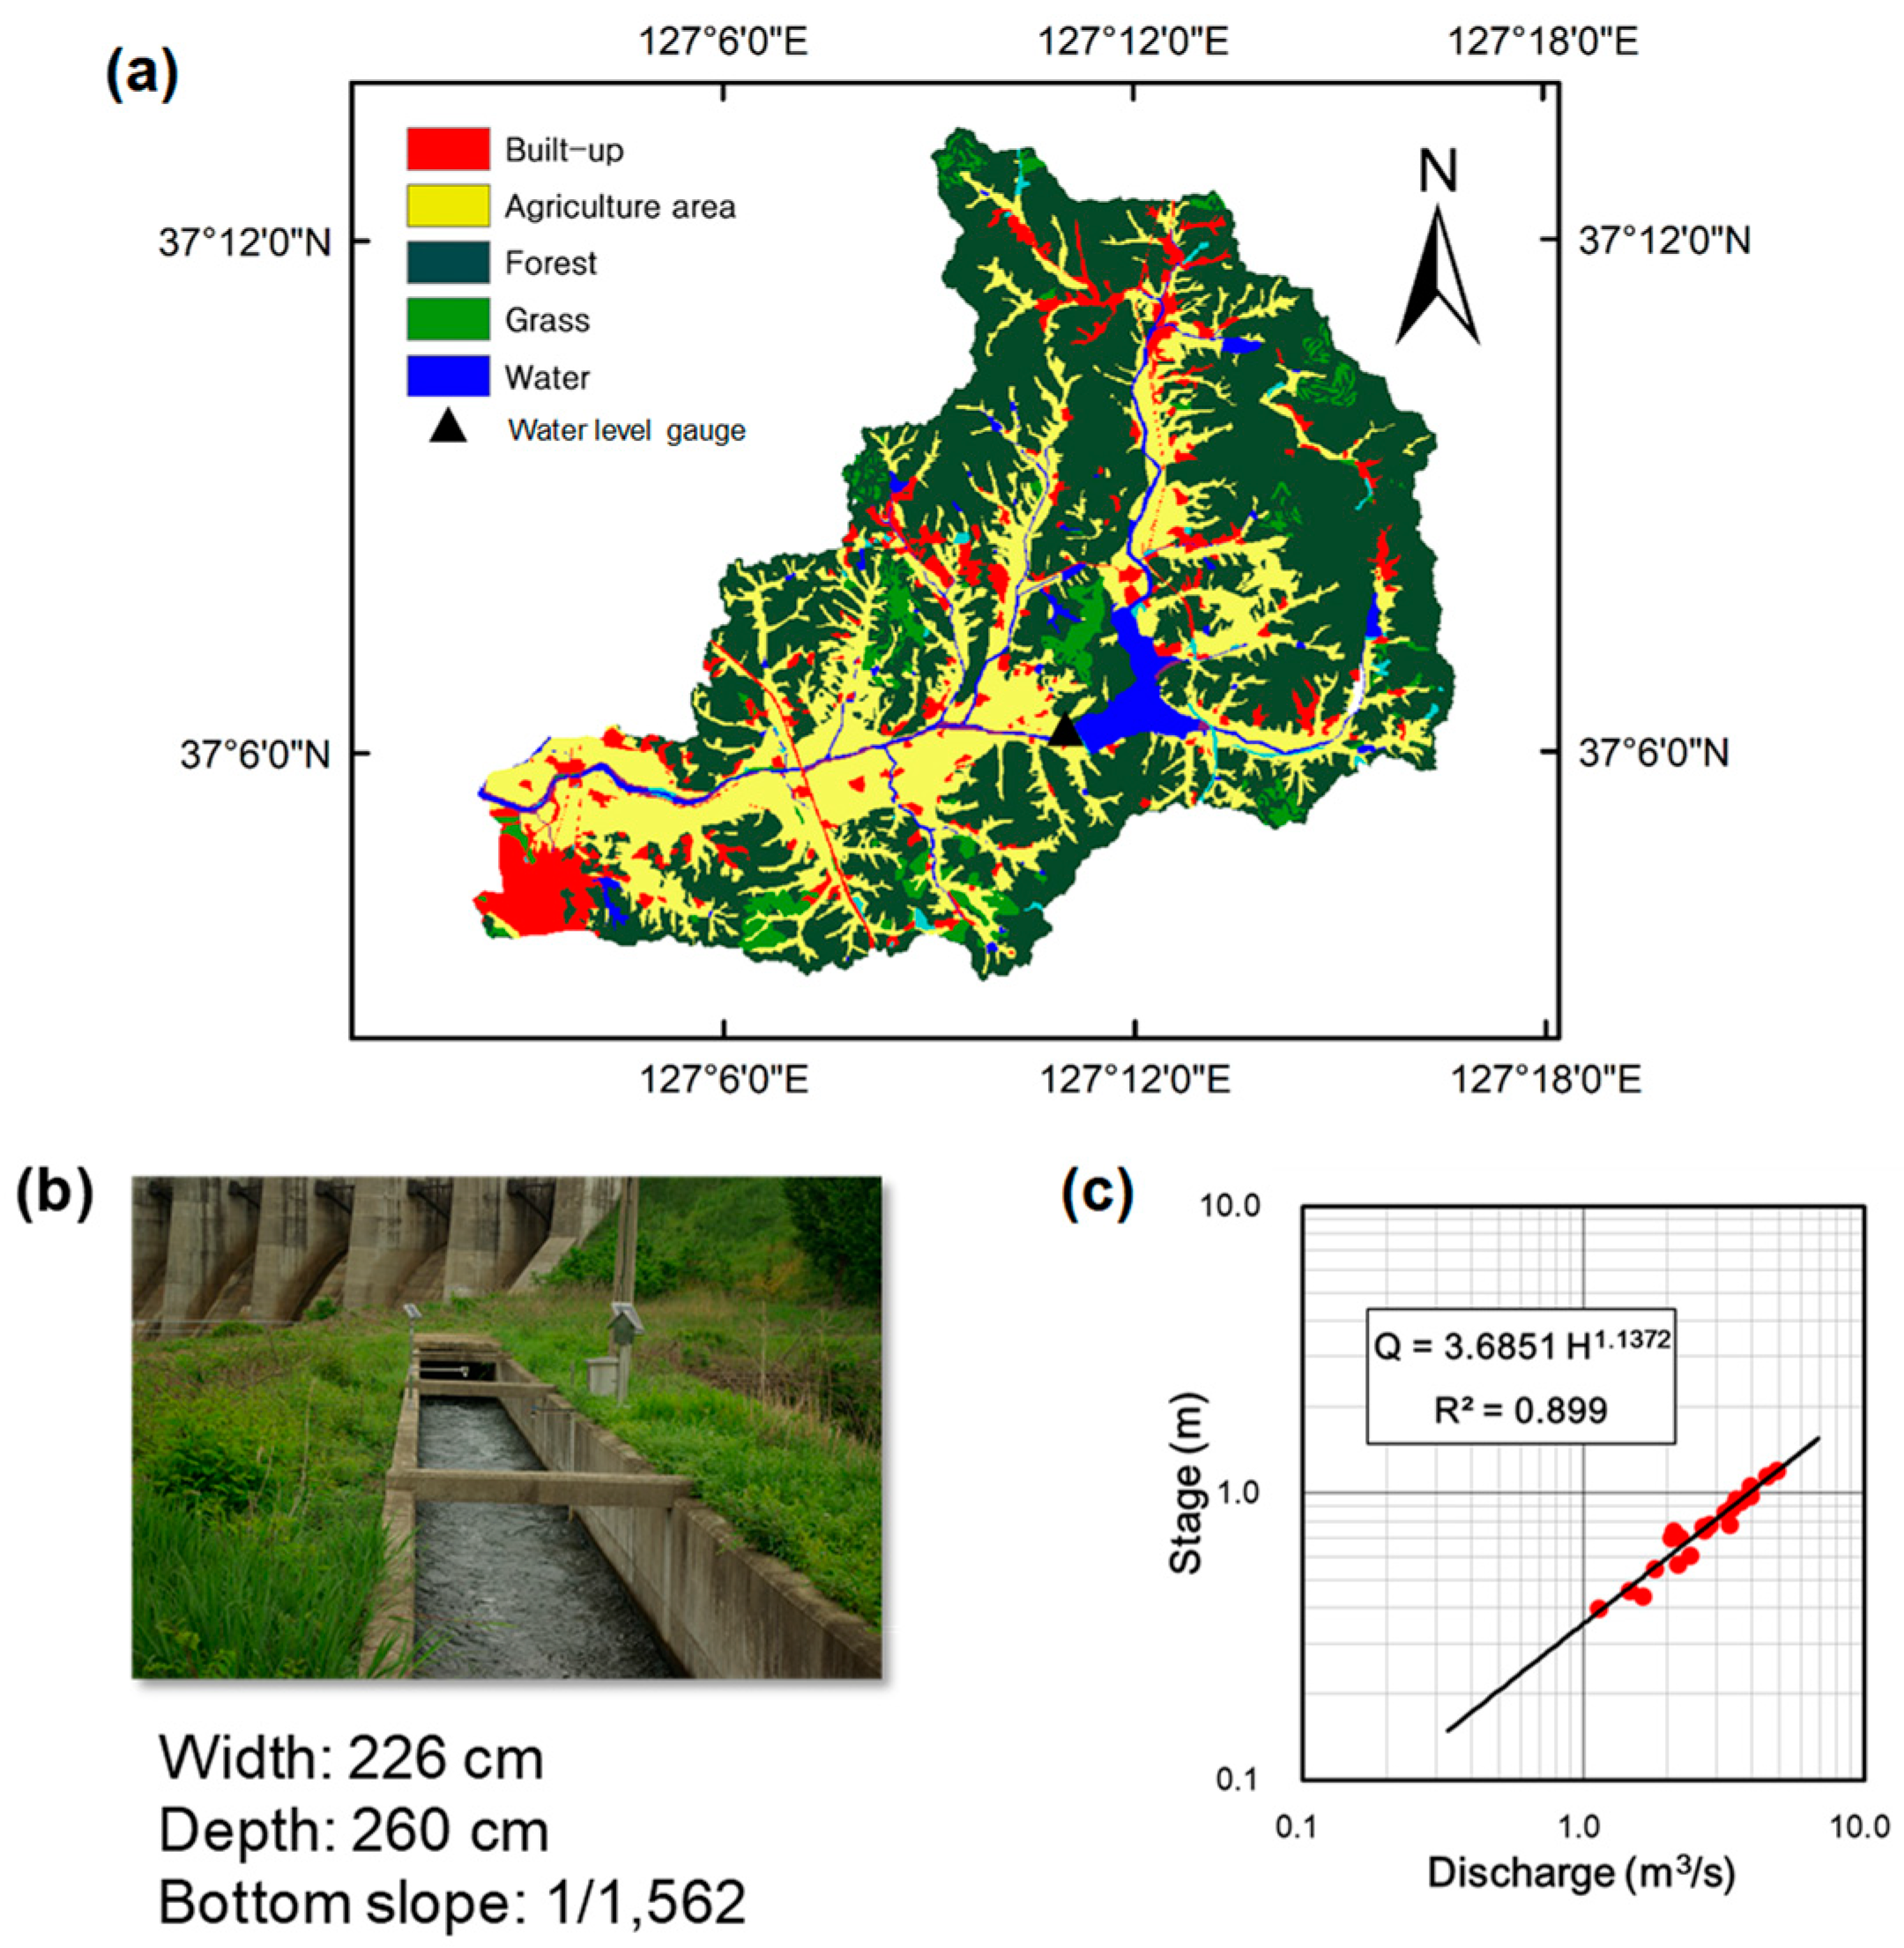
2.1. Study Reservoir and Irrigation Districts

Rice self-sufficiency has long been the main focus of agricultural policy in South Korea, and agricultural water resources have mainly been managed to secure water supply for rice cultivation [8,9,29]. The majority (82%) of the rice paddy fields in Korea are irrigated, and reservoirs are the main water sources (61%) for the irrigation [30]. The irrigation and drainage canals are 190,000 km long [30]. The agricultural water and irrigation infrastructure are provided by local and central governments at no charge to farmers, and thus irrigation facilities are often inappropriately managed by the water users [13,29]. Besides, empirical and literature-based practices are common for planning agricultural water management [2,9]. As a result, agricultural water management in South Korea suffers from low water-use efficiency.
We chose to study the Idong reservoir and its irrigation district, located in Korea (37°07′, 127°12′), because of the length of AWS monitoring records and their quality (Figure 1a). From 2001 to 2013, the Korea Rural Community Corporation (KRC) measured the water level every 10 min, using ultrasonic sensors installed at the head of the main irrigation canal (Figure 1b). The observations were subsequently converted to discharges using the stage–discharge relationship developed for the point (Figure 1c) [20]. The amount of water supplied to the irrigation district was compared with predicted AWS to assess the performance and uncertainty of the AWS model. Weather records including the temperature, wind speed, relative humidity, and solar radiation were obtained from the Suwon National Weather station 20 km away from the study area, and the data was used as input for the AWS simulation.

2.2. Agricultural Water Supply (AWS) Model

The AWS is determined based on the IWR, the efficiency of water conveyance, and distribution to a rice paddy field [8,10,20]. An irrigation system efficiency ( E s ) is used to determine the DMWR [10,20]. The AWS was calculated using the following equations [8,31]:
A W S i = A r i c e E s I W R i 1000   for   A W S i < A W S m a x
A W S i = A W S m a x   for   A W S i A W S m a x
where A r i c e is the irrigated area (m2), I W R is the irrigation water requirement, as denoted above (mm), E s is the irrigation efficiency (%), A W S m a x is the maximum amount of irrigation water supply (m3), and i is time interval (day).

2.2.1. Irrigation Efficiency

The E s represents the relative portion of agricultural water delivered to the target paddy fields, and it considers the combined efficiency of the water conveyance and distribution systems [32,33]. The E s for paddy fields has been reported to vary substantially over time, even daily, mainly due to differences in weather conditions, reservoir operation, and water management practices employed by the local farmers [8,20,34]. In Asian paddy fields, the E s was observed to vary from 34% to 93%. It is known that E s is relatively high under the drought condition, because farmers tend to pay additional care to managing irrigation water [10]; however, the functional relationships between time-varying E s and other variables have not been fully investigated enough to provide a solid E s estimate for this study [8].
E s is usually neither known nor observed for the study areas. Even when E s was measured for a short period, the measurement could not show long-term variations. Thus, it is common to determine the value of E s from the literature, and assume that it is constant over time to avoid the introduction of unnecessary complexity and uncertainty into irrigation studies and planning [2,9,23,31]. AWS estimates are sensitive to E s , and the time-invariant E s values are likely to bring errors into the estimation of AWS [8]. A few studies attempted to devise methods to construct time-varying E s for ungauged conditions or tried to improve the accuracy of E s estimates by considering the annual variations of hydrology when determining E s [18].
In this study, we prepared a mathematical model, the AWS model, to accommodate both methods, a fixed and time-varying E s . The sensitivity of AWS modeling outputs to the E s estimates was quantified, and uncertainty associated with employing the E s estimation methods was also investigated in this study.

2.2.2. Irrigation Water Requirement

The rice-growing season was split into the nursery, transplanting, rice-planting, and mid-summer drainage periods [35]. We set the water requirements during the nursery period ( N W R ) and the transplanting period ( T W R ) as input parameters, and water that reached the entrance of the irrigation district was assumed to be evenly distributed across the rice paddies during the growing season from the reservoir operators’ perspective. The IWR during the rice-planting period can be calculated according to the following water balance (or continuity) equation:
P D t = P D t 1 + R A I N t + I W R t ( D R t + E T t + I N F t )
where P D is the ponding depth, R A I N is the rainfall (mm), D R is the surface drainage (mm), E T is the actual evapotranspiration (mm), and I N F is the infiltration (mm). The E T is calculated by multiplying the reference evapotranspiration by the crop coefficient. We used the Food and Agriculture Organization (FAO) Penman–Monteith equation [36] for estimation of the reference evapotranspiration and adopted the crop coefficient for a Korean rice paddy [9]. The I N F rates vary from 1.0 to 8.8 mm/day in Korea, depending on the soil conditions [37,38]. The D R occurs when the P D is greater than the height of the outlet weir ( P D m a x ) [20,38]:
D R i = P D i P D m a x   for   P D i > P D m a x
D R i = 0   for   P D i P D m a x
The I W R can be estimated by subtracting the P D from the minimum ponding depth ( P D m i n ) when the P D drops below P D m i n :
I W R i = P D m i n P D i   for   P D i < P D m i n
I W R i = 0   for   P D i P D m i n
It has been reported that the AWS model parameters ( P D m a x , P D m i n , I N F , E s , N W R , and T W R ) are highly variable, depending on the regional characteristics [8,20,22]. Besides, there is no known study that accurately related their values to a specific local area [39]. Thus, the feasible ranges of AWS model parameters were investigated from the literature (Table 1), and the range is used as a constraint in the calibration and uncertainty analysis.

2.3. Parameter Selection Scheme

The parameter calibration of an AWS model is usually unavailable due to the lack of observations. In such cases, the values reported in other studies have been commonly used instead, which could significantly affect simulation results. In this study, parameter selection schemes based on either calibration or the literature were compared (Table 2). In Cases I and II, all parameter values were obtained from the literature. Case I used a fixed P D m a x (80 mm) [42], and P D m i n (30 mm) [18,40], while Case II considered the seasonal variation of the P D m a x and P D m i n values [3,12] (Table 3). We investigated the I N F (4.6 mm/day), E s (75%), N W R (140 mm), and T W R (140 mm) values, considering the characteristics of the study area, and common values were applied in Cases I and II [43,44,45]. Meanwhile, Cases III and IV were schemes whereby all or some of the parameters were calibrated. In Case III, all six parameters were calibrated, and the parameter set with the highest Nash–Sutcliffe Efficiency ( N S E ) [46] among the behavioral sets was selected. In Case IV, only E s was calibrated on a yearly basis to minimize the absolute value of the Percent BIAS ( P B I A S ) (%) [47], and the same parameter values selected in Case II were used for the other parameters.
N S E = 1 [ j = 1 n ( O j S j ) 2 j = 1 n ( O j O ¯ ) 2 ]
P B I A S = i = 1 n ( O i S i ) 2 i = 1 n ( O i ) 2
where O and S represent the observed and simulated AWS, respectively, n is the number of time steps at time step j (here, a 10-day time interval), and the over-bar represents an average of the given variable over the selected period.

2.4. Sensitivity and Uncertainty Analysis Methods

2.4.1. Sensitivity Analysis

Parameter sensitivity analysis was implemented to determine the influence that a set of parameters had on predicting the AWS [48,49]. The sensitivity was measured using a relative sensitivity ( S r ), which explains how the model output varies with changes in input parameters [8,50]:
S r = Δ O / O b Δ P / P b = ( O O b ) / O b ( P P b ) / P b
where Δ O is the change in the output, O b is the base output, O is the output according to the new input parameter, Δ P is the change in the parameter value, and P b is the base parameter value. The median of the feasible value range of each parameter was selected to represent its base value ( P b ), and the corresponding simulation result ( O b ) was tracked to calculate the relative sensitivity while changing parameter values in the sensitivity analysis. The greater the S r , the more sensitive a model output variable was to that particular parameter [8,49,51]. The S r was calculated at six different levels (+50%, +25%, +10%, −10%, −25%, and −50% change from base value) to consider the non-linear response of the model to input parameters [8,51]. A sensitivity index ( S I ), providing a method to compare the overall relative sensitivities of the output variables, was then calculated as follows:
S I = 1 N i = 1 N S r ( i )
where N is the total number of levels of parameter changes for S r . The overall relative sensitivities were categorized based on the following criteria [8,52,53]: insensitive ( | S I | < 0.01 ), slightly sensitive ( 0.01 < | S I | < 0.1 ), moderately sensitive ( 0.1 < | S I | < 1.0 ), sensitive ( 1.0 < | S I | < 2.0 ), and extremely sensitive ( | S I | > 2.0 ).

2.4.2. Uncertainty Analysis

Parameter calibration (or optimization) practices may not always give reasonable modeling results, and there are many reasons for a calibrated model to fail to provide reliable outputs beyond the calibration period due to the uncertainty and equifinality caused by incomplete values used for calibration, simplifications, and approximations introduced into the modeling exercise, and the parameter estimation method [28,54,55]. It is essential that an uncertainty analysis is conducted in order to determine the reliability of the model predictions and account for various sources of uncertainty [54,56,57,58] A GLUE [26,27], known as a Monte Carlo-based analysis, is commonly used to quantify the equifinality of parameters and uncertainty of model outputs in this study. Multiple parameter sets that satisfy the predefined performance requirements were identified as behavioral sets under the GLUE framework [27,59,60]. These behavioral sets are defined as “equally good” in this study [61]. The uncertainty analysis applied in this study includes the following steps: (1) Monte Carlo random sampling from a feasible parameter space with uniform distribution; (2) defining a likelihood function and a threshold value for the behavioral parameter sets; (3) calculating likelihood values for the behavioral parameter sets; and (4) deriving the posterior distributions of the calibration parameters and the 90% confidence interval (90CI) for the AWS [27,28,58,60]. The feasible parameter spaces were investigated from the previous observations considering the acceptable ranges in Korea (Table 1). The uniform distribution was chosen because the prior parameter distributions of the model were not known [60,62]. In this study, the N S E was selected as the likelihood function, as it has been the most frequently used likelihood measure for GLUE based on the literature [27,28,57,60]. A cut-off threshold of a N S E greater than 0.65 was applied to identify a behavioral parameter set. The threshold of N S E > 0.65 has been widely used as a criterion for the “good” performance in hydrological modeling [61]. The identified behavioral parameter sets were utilized to derive the posterior distributions of the calibration parameters.

3. Results

3.1. Parameter Sensitivity in Estimating Total AWS Volume

The sensitivity analysis showed that the level of predicted AWS increased with increases in I N F , P D m i n , T W R , and N W R and decreases in P D m i n and E s . When I N F rates are large, frequent water supply is required to avoid drought stress [63,64,65]. The decrease in the P D m i n saves irrigation water in regions with a shallow ponding depth and increases storage for more effective rainfall [66,67]. The increasing P D m a x allowed the conservation of rainfall and minimized the supplemental irrigation requirements during the dry periods [67,68]. The improvement of E s indicates a decrease in the amount of water required to maintain the desired water level, which decreases the AWS. [8]. From Figure 2, we can see that the total AWS volume was the most sensitive to E s ( 1.0 < | S I | < 2.0 ), but the least sensitive to N W R ( | S I | < 0.01 ). The P D m a x , P D m i n , I N F , and T W R values were identified as moderately ( 0.1 < | S I | < 1.0 ) or slightly ( 0.01 < | S I | < 0.1 ) sensitive parameters.

3.2. Parameter Uncertainty in Reproducing actual AWS

A total of 200,000 samples were drawn from the Monte Carlo simulation, and 5023 (2.5% of the total samples) parameter sets that provided N S E values greater than 0.65 were retained as behavioral sets. The posterior parameter distributions were derived from the 5023 behavioral parameter values, and the spread of each distribution indicates the degree of uncertainty (Figure 3). Sharp and peaked distributions are associated with well-identifiable parameters, while flat distributions indicate greater parameter uncertainty [58]. As shown in Figure 3, five parameters, P D m a x , P D m i n , I N F , E s , and T W R , were not uniformly or normally distributed, whereas, in comparison, N W R exhibited a distribution close to uniform. As shown by the wide range of parameter values, there may be many combinations of parameter sets that would result in similar model performance statistics. Such a result is also consistent with the well-known fact that there are many different parameter sets within a chosen model that may be behavioral or acceptable in reproducing the observed behavior of the system [26,27].
The degree of uncertainty in simulating AWS was also expressed with the 90CI, which was constructed by ordering the 5023 behavioral outputs, and then identifying the 5% and 95% threshold values (Figure 4). The uncertainty analysis showed that the variations of streamflow simulated with the behavioral parameters could be significant, as shown by the fact that the annual average of the AWS of the 95th percentile (2085 mm) was more than twice than that of the lower 5th percentile limit (906 mm), even though they were evaluated using the same ‘ N S E > 0.65’ premise.

3.3. Evaluation of Parameter Selection Schemes

In this study, we used both visual and statistical measures to assess the performance of the parameter selection schemes in Cases I–IV ( Table 2 and Table 4). Time-series and scatter plots were used to identify general trends, potential sources of error, and differences between the observed and predicted values [69] (Figure 5 and Figure 6). As quantitative criteria, N S E was used to measure the overall fit between the observed and simulated data [61]. The P B I A S measures the average tendency of the simulated data as larger or smaller than their observed counterparts [47,55] (Table 5), and the performance evaluation criteria proposed by [61] were applied.
The simulation results for Cases I and II showed an underestimation of the AWS (Figure 5 and Figure 6), with P B I A S values of 39.0% and 31.9%, respectively (Table 5). Case II yielded slightly better N S E values compared to Case I, but both cases were classified as “Not Satisfactory” (Table 5) [61]. Such findings indicate that the value (from the literature) of E s , the most sensitive parameter, was not appropriate for the study site. The actual E s of the Idong reservoir that was calculated from the observations was much lower than the values applied in Cases I and II.
Calibration scheme Case III provided P B I A S and N S E values of 6.4% and 0.85, respectively, at a monthly scale, which is much better than those of Case I and II (Table 5). The AWS simulated from Case III follows the trends in measurements well (Figure 5 and Figure 6). Case IV, only considering the yearly variation of E s based on Case II, produced “Very Good” performance statistics, a P B I A S of 0.0%, and N S E of 0.83 at a monthly scale [61], even though the N S E values were slightly lower than those of Case III (Table 5).

4. Discussion

The sensitivity analysis indicates that the AWS simulation is sensitive to P D m a x , P D m i n , E s , and I N F , with E s , the irrigation efficiency, being the most sensitive parameter. The irrigation efficiency is known to vary over time, being influenced by various factors, including climate, weather conditions, irrigation system maintenance, farming practices, and reservoir operation [10,32,67]. It has also been reported that, in a modeling approach, the time-varied irrigation efficiency could provide better simulation compared with using fixed parameter values [8,34,39]. This finding was also observed in the performance of Case IV in this study.
From the GLUE analysis, we found that different combinations of parameter values could yield similar model performances, in what has been termed “equifinality” in the literature [26,27,58,60,70]. Such a finding indicates that a modeler who uses a parameter set among those providing equally good performances could obtain significantly different simulation results, depending on which set was selected [28]. We also evaluated the impact of the parameter-selection scheme on the AWS simulation performance in Cases I–IV. Cases I and II provided poor simulations, which indicates that literature-based parameters, rather than a careful selection, may lead to inaccurate simulations. Cases III and IV produced better results than I and II, indicating that although AWS is related to human activities, simulation using appropriate parameter values could represent the actual AWS trend precisely [8].
Of the four schemes, Case III, where all parameters were calibrated, yielded the best N S E results, and P D m a x and P D m i n were calibrated to 40 mm and 8 mm, respectively. These values were within the ranges that were determined considering the water management practices (shallow irrigation) that are actually implemented in the study areas (Table 1) [71,72]. It should be worth noting that the parameter value ranges should be adjusted to make the calibration realistic and obtain reasonable modeling results in the case of implementing other practices such as deep ponding irrigation [3,12]. Such results suggest that, in the calibration processes, a modeler should use all possible information and knowledge to make a realistic and reasonable parameter selection that represents the characteristics of a study area. It also confirms that the decision-making processes balance between experience, prior knowledge and understanding, and modeling.
To demonstrate the importance of a realistic representation of the study system, we investigated the results of calibration additionally implemented with a parameter value range that represents a deep irrigation practice that is different from the reality (shallow irrigation) (Table S1 and Figure S1). In the calibration, we changed the parameter value ranges of P D m a x and P D m i n to 60–150 mm and 60–80 mm respectively, to describe the deep irrigation practice under the original Case III scenario. From the additional analysis, we found that the deep irrigation scenario provided poorer performance ( N S E : 0.72) compared to the original scenario ( N S E : 0.78). We also found that the calibrated values of the P D m a x and P D m i n were converged to the minimum values (60 mm and 60 mm) of the ranges. Such calibration results indicate the shallow irrigation practice (rather than deep irrigation one) would be better explained by the model and observations in the study area, emphasizing the importance of using realistic parameter constraints and local knowledge for reasonable agricultural water modeling.
Compared to Case III, the parameter values inputted from Case IV were more practical, as the scheme adopted values for P D m a x , P D m i n , and I N F from the literature. We calibrated only E s on a yearly basis, and the simulation performance was evaluated as “Very Good”. This result indicates that a combination of annually calibrated E s values (Table 4) and literature-based parameter values (Table 2) for the other parameters is the most recommended scheme, as it could provide acceptable performance as well as realistic parameter values. This scheme could be applicable when AWS observations are available, although most agricultural reservoirs do not have AWS observations. As an alternative, if reservoir water levels are measured, as is relatively common in Korea, it would be expected that the E s parameter could be calibrated by linking the AWS model to a reservoir water balance model, with the reservoir water levels as a calibration target [8].

5. Conclusions

In this study, the parameter sensitivity and uncertainty in simulating agricultural water supply for paddy fields were analyzed using the Idong reservoir and its irrigation districts as the study area. We measured the parameter sensitivity based on a relative sensitivity index, while the GLUE method was used to assess the parameter uncertainty. We also evaluated four parameter selection schemes to provide useful assistance for future selection procedures. The sensitivity analysis indicates that P D m a x , P D m i n , E s , and I N F are sensitive and significantly affected our AWS simulations. Among them, E s appears to be the most sensitive; thus, values for the irrigation efficiency should be carefully selected to produce more accurate simulations. Conversely, N W R was insensitive, indicating that the calibration of this parameter might be infeasible. Through the uncertainty analysis, even though the posterior distributions for the four sensitive parameters, P D m a x , P D m i n , E s , and I N F , were not uniformly distributed, there were multiple possible values satisfying the cut-off threshold (here N S E > 0.65 ). The distributions in the ‘behavioral’ parameter sets were systemically related to parameter uncertainty, which even led to equifinality in the AWS modeling.
Furthermore, this study demonstrated that reasonable water use estimates could be obtained only when actual water management practices were appropriately considered as constraints in the calibration processes (Case III), which emphasizes that modelers should carefully check if their calibrated parameter values agree with the understanding of study areas and parameters. We also found that simulations with uncalibrated parameters, based purely on the literature, could produce poor results (Cases I and II), but that a combination of E s values varied annually with uncalibrated values for the other parameters (Case IV) could provide good performance. In the future, the establishment of the functional relationships between the time-varying irrigation efficiency and dependent variables should be investigated to help modelers make more informed parameter selections. This study suggests that modelers should not only perceive the parameter uncertainty and equifinality but also understand the relationships between the hydrological meaning of parameters and hydrological processes that occur in a watershed, including rice paddy fields and blocks.

Supplementary Materials

The following are available online at https://www.mdpi.com/2073-4395/9/10/662/s1, Figure S1: Scatter and time-series plots for deep irrigation scenario under Case III., Table S1: Calibrated parameter values for deep irrigation scenario under Case III.

Author Contributions

Conceptualization, J.-H.S., Y.H., and M.-S.K.; methodology, J.-H.S., Y.H., and M.-S.K.; software, J.-H.S.; validation, J.-H.S., S.H., S.M.J. and J.P.; investigation, J.-H.S. and Y.H.; resources, M.-S.K. and Y.H.; data curation, S.H., S.M.J. and J.P.; writing—original draft preparation, J.-H.S.; writing—review and editing, Y.H. and M.-S.K.; visualization, S.H., S.M.J. and J.P.; supervision, M.-S.K. and Y.H.; funding acquisition, M.-S.K. and J.-H.S.

Funding

This research was supported by the Basic Science Research Program through the National Research Foundation of Korea (NRF) funded by the Ministry of Education (NRF-2017R1D1A1B03034463) and the Korea Institute of Planning and Evaluation for Technology in Food, Agriculture and Forestry (IPET) through the Advanced Production Technology Development Program, funded by the Ministry of Agriculture, Food and Rural Affairs(MAFRA) (112041-3).

Acknowledgments

We are grateful to the Rural Research Institute, Korea Rural Community Corporation for providing the agricultural water supply data sets of the Idong reservoir.

Conflicts of Interest

The authors declare no conflict of interest.

References

  1. Haddeland, I.; Heinke, J.; Biemans, H.; Eisner, S.; Flörke, M.; Hanasaki, N.; Konzmann, M.; Ludwig, F.; Masaki, Y.; Schewe, J.; et al. Global water resources affected by human interventions and climate change. Proc. Natl. Acad. Sci. USA 2014, 111, 3251–3256. [Google Scholar] [CrossRef] [PubMed]
  2. Kang, M.; Park, S. Modeling water flows in a serial irrigation reservoir system considering irrigation return flows and reservoir operations. Agric. Water Manag. 2014, 143, 131–141. [Google Scholar] [CrossRef]
  3. Kang, M.S.; Park, S.W.; Lee, J.J.; Yoo, K.H. Applying SWAT for TMDL programs to a small watershed containing rice paddy fields. Agric. Water Manag. 2006, 79, 72–92. [Google Scholar] [CrossRef]
  4. Kim, H.K.; Jang, T.I.; Im, S.J.; Park, S.W. Estimation of irrigation return flow from paddy fields considering the soil moisture. Agric. Water Manag. 2009, 96, 875–882. [Google Scholar] [CrossRef]
  5. Veldkamp, T.I.E.; Zhao, F.; Ward, P.J.; de Moel, H.; Aerts, J.C.; Schmied, H.M.; Portmann, F.T.; Masaki, Y.; Pokhrel, Y.; Liu, X.; et al. Human impact parameterizations in global hydrological models improve estimates of monthly discharges and hydrological extremes: A multi-model validation study. Environ. Res. Lett. 2018, 13, 055008. [Google Scholar] [CrossRef]
  6. Wang, D.; Cai, X. Detecting human interferences to low flows through base flow recession analysis. Water Resour. Res. 2009, 45. [Google Scholar] [CrossRef]
  7. Nam, W.-H.; Choi, J.-Y. Development of an irrigation vulnerability assessment model in agricultural reservoirs utilizing probability theory and reliability analysis. Agric. Water Manag. 2014, 142, 115–126. [Google Scholar] [CrossRef]
  8. Song, J.-H.; Kang, M.S.; Song, I.; Jun, S.M. Water balance in irrigation reservoirs considering flood control and irrigation efficiency variation. J. Irrig. Drain. Eng. 2016, 142, 04016003. [Google Scholar] [CrossRef]
  9. Yoo, S.-H.; Choi, J.-Y.; Lee, S.-H.; Oh, Y.-G.; Yun, D.K. Climate change impacts on water storage requirements of an agricultural reservoir considering changes in land use and rice growing season in Korea. Agric. Water Manag. 2013, 117, 43–54. [Google Scholar]
  10. Kim, J.-S.; Oh, S.-Y.; Oh, K.-Y.; Cho, J.-W. Delivery management water requirement for irrigation ditches associated with large-sized paddy plots in Korea. Paddy Water Environ. 2005, 3, 57–62. [Google Scholar] [CrossRef]
  11. Zipper, S.C.; Dallemagne, T.; Gleeson, T.; Boerman, T.C.; Hartmann, A. Groundwater Pumping Impacts on Real Stream Networks: Testing the Performance of Simple Management Tools. Water Resour. Res. 2018, 54, 5471–5486. [Google Scholar] [CrossRef] [Green Version]
  12. Lee, S.-H.; Yoo, S.-H.; Choi, J.-Y.; Engel, B.A. Effects of climate change on paddy water use efficiency with temporal change in the transplanting and growing season in South Korea. Irrig. Sci. 2016, 34, 443–463. [Google Scholar] [CrossRef]
  13. Nam, W.-H.; Kim, T.; Hong, E.-M.; Choi, J.-Y.; Kim, J.-T. A Wireless Sensor Network (WSN) application for irrigation facilities management based on Information and Communication Technologies (ICTs). Comput. Electron. Agric. 2017, 143, 185–192. [Google Scholar] [CrossRef]
  14. Deng, C.; Liu, P.; Guo, S.; Wang, H.; Wang, D. Estimation of nonfluctuating reservoir inflow from water level observations using methods based on flow continuity. J. Hydrol. 2015, 529, 1198–1210. [Google Scholar] [CrossRef]
  15. Liu, P.; Cai, X.; Guo, S. Deriving multiple near-optimal solutions to deterministic reservoir operation problems. Water Resour. Res. 2011, 47. [Google Scholar] [CrossRef]
  16. Liu, P.; Li, L.; Chen, G.; Rheinheimer, D.E. Parameter uncertainty analysis of reservoir operating rules based on implicit stochastic optimization. J. Hydrol. 2014, 514, 102–113. [Google Scholar] [CrossRef]
  17. Habets, F.; Molénat, J.; Carluer, N.; Douez, O.; Leenhardt, D. The cumulative impacts of small reservoirs on hydrology: A review. Sci. Total Environ. 2018, 643, 850–867. [Google Scholar] [CrossRef] [Green Version]
  18. Song, J.-H. Hydrologic analysis system with multi-objective optimization for agricultural watersheds. Ph.D. Thesis, Seoul National University, Seoul, Korea, 2017. [Google Scholar]
  19. Doorenbos, J.; Kassam, A.H. Yield Response to Water; FAO–Food and Agriculture Organization of the United Nations: Rome, Italy, 1979. [Google Scholar]
  20. Song, J.-H.; Song, I.; Kim, J.T.; Kang, M.S. Simulation of agricultural water supply considering yearly variation of irrigation efficiency. J. Korea Water Resour. Assoc. 2015, 48, 425–438. [Google Scholar] [CrossRef]
  21. Anan, M.; Yuge, K.; Nakano, Y.; Funakoshi, T.; Haraguchi, T. The relationship between water intake rates, paddy ponding depth, and farmers’ water management techniques. Paddy Water Environ. 2004, 2, 11–18. [Google Scholar] [CrossRef]
  22. Suresh, K.R.; Mujumdar, P.P. A fuzzy risk approach for performance evaluation of an irrigation reservoir system. Agric. Water Manag. 2004, 69, 159–177. [Google Scholar] [CrossRef] [Green Version]
  23. Fowe, T.; Karambiri, H.; Paturel, J.-E.; Poussin, J.-C.; Cecchi, P. Water balance of small reservoirs in the Volta basin: A case study of Boura reservoir in Burkina Faso. Agric. Water Manag. 2015, 152, 99–109. [Google Scholar] [CrossRef]
  24. Panigrahi, B.; Panda, S.N. Optimal sizing of on-farm reservoirs for supplemental irrigation. J. Irrig. Drain. Eng. 2003, 129, 117–128. [Google Scholar] [CrossRef]
  25. Im, S.-J.; Park, S.-U.; Kim, H.-J. Methodology for estimating agricultural water supply in the Han River basin. J. Korea Water Resour. Assoc. 2000, 33, 765–774. [Google Scholar]
  26. Beven, K.; Binley, A. The future of distributed models: Model calibration and uncertainty prediction. Hydrol. Process. 1992, 6, 279–298. [Google Scholar] [CrossRef]
  27. Beven, K.; Freer, J. Equifinality, data assimilation, and uncertainty estimation in mechanistic modelling of complex environmental systems using the GLUE methodology. J. Hydrol. 2001, 249, 11–29. [Google Scholar] [CrossRef]
  28. Her, Y.; Chaubey, I. Impact of the numbers of observations and calibration parameters on equifinality, model performance, and output and parameter uncertainty. Hydrol. Process. 2015, 29, 4220–4237. [Google Scholar] [CrossRef]
  29. Choi, D.-H.; Jung, J.-W.; Yoon, K.-S.; Baek, W.-J.; Choi, W.-J. Farmers’ water management practice and effective rainfall and runoff ratio of paddy fields. Irrig. Drain. 2016, 65, 66–71. [Google Scholar] [CrossRef]
  30. MAFRA. Statistical Yearbook of Land and Water Development for Agriculture 2017; Ministry for Food, Agriculture, Forestry and Fisheries: Gwacheon, Korea, 2018.
  31. Georgiou, P.E.; Papamichail, D.M. Optimization model of an irrigation reservoir for water allocation and crop planning under various weather conditions. Irrig. Sci. 2008, 26, 487–504. [Google Scholar] [CrossRef]
  32. Bos, M.G.; Nugteren, J. On Irrigation Efficiencies; International Institute for Land Reclamation and Improvement: Wageningen, The Netherlands, 1990. [Google Scholar]
  33. Jensen, M.E. Beyond irrigation efficiency. Irrig. Sci. 2007, 25, 233–245. [Google Scholar] [CrossRef]
  34. Kangrang, A.; Chaleeraktrakoon, C. A Fuzzy-GAs Model for Determining Varied Irrigation Efficiency. Am. J. Appl. Sci. 2007, 4, 339–345. [Google Scholar] [CrossRef]
  35. Joo, U.J. A Study on Water Supply Methods Considering Variation of Farming Conditions in Paddy Field; Korea Agricultural and Rural Infrastructure Corporation: Uiwang, Korea, 2005. [Google Scholar]
  36. Allen, R.G.; Pereira, L.S.; Raes, D.; Smith, M. Crop Evapotranspiration-Guidelines for Computing Crop Water Requirements; FAO—Food and Agriculture Organization of the United Nations: Rome, Italy, 1998. [Google Scholar]
  37. Im, S.J.; Park, S.W.; Chin, Y.M.; Yoon, K.S. Development of CREAMS-PADDY model. In Proceedings of the Development of CREAMS-PADDY Model; American Society of Agricultural Engineers: Milwaukee, WI, USA, 2000; pp. 1–13. [Google Scholar]
  38. Song, J.-H.; Kang, M.-S.; Song, I.; Hwang, S.-H.; Park, J.; Ahn, J.-H. Surface drainage simulation model for irrigation districts composed of paddy and protected cultivation. J. Korean Soc. Agric. Eng. 2013, 55, 63–73. [Google Scholar]
  39. Wu, Y.; Chen, J. Estimating irrigation water demand using an improved method and optimizing reservoir operation for water supply and hydropower generation: A case study of the Xinfengjiang reservoir in southern China. Agric. Water Manag. 2013, 116, 110–121. [Google Scholar] [CrossRef]
  40. Huh, Y.M.; Park, S.W.; Im, S.J. A streamflow network model for daily water supply and demands on small watershed (1): Simulating daily streamflow from small watersheds. J. Korean Soc. Agric. Eng. 1993, 35, 40–49. [Google Scholar]
  41. Chung, H.W.; Kim, S.J.; Kim, J.S.; Noh, J.K.; Park, K.U.; Son, J.K.; Yoon, K.S.; Lee, K.H.; Lee, N.H.; Chung, S.O.; et al. Irrigation and Drainage Engineering. Dong Myeong Publishers: Paju, Korea, 2006. [Google Scholar]
  42. Yoo, S.-H.; Choi, J.-Y.; Jang, M.-W. Estimation of design water requirement using FAO Penman–Monteith and optimal probability distribution function in South Korea. Agric. Water Manag. 2008, 95, 845–853. [Google Scholar] [CrossRef]
  43. Kim, J.T. Research on a Test Watershed for Integrated Agricultural Water Resources; Rural Research Institute: Ansan, Korea, 2011. [Google Scholar]
  44. MAF. Agricultural Infrastructure Design Standards: Irrigation; Ministry of Agriculture and Forestry: Gwacheon, Korea, 1998.
  45. MAF. A Study on the Water Requirement Variation with the Farming Conditions in the Paddy Field; Ministry of Agriculture and Forestry: Gwacheon, Korea, 1997.
  46. Nash, J.E.; Sutcliffe, J.V. River flow forecasting through conceptual models part I–A discussion of principles. J. Hydrol. 1970, 10, 282–290. [Google Scholar] [CrossRef]
  47. Gupta, H.V.; Sorooshian, S.; Yapo, P.O. Status of automatic calibration for hydrologic models: Comparison with multilevel expert calibration. J. Hydrol. Eng. 1999, 4, 135–143. [Google Scholar] [CrossRef]
  48. Hamby, D.M. A review of techniques for parameter sensitivity analysis of environmental models. Environ. Monit. Assess. 1994, 32, 135–154. [Google Scholar] [CrossRef]
  49. White, K.L.; Chaubey, I. Sensitivity analysis, calibration, and validations for a multisite and multivariable SWAT model. J. Am. Water Resour. Assoc. 2005, 41, 1077–1089. [Google Scholar] [CrossRef]
  50. James, L.D.; Burges, S.J. Selection, calibration, and testing of hydrologic models. In Hydrologic Modeling of Small Watersheds; American Society of Agricultural Engineers: St. Joseph, MI, USA, 1982. [Google Scholar]
  51. Cho, J.; Mostaghimi, S. Dynamic agricultural non-point source assessment tool (DANSAT): Model application. Biosyst. Eng. 2009, 102, 500–515. [Google Scholar] [CrossRef]
  52. Jesiek, J.B.; Wolfe, M.L. Sensitivity analysis of the Virginia phosphorus index management tool. Trans. ASABE 2005, 48, 1773–1781. [Google Scholar] [CrossRef]
  53. Storm, D.E.; Dillaha, T.A., III; Mostaghimi, S.; Shanholtz, V.O. Modeling phosphorus transport in surface runoff. Trans. ASAE 1988, 31, 0117–0127. [Google Scholar] [CrossRef]
  54. Muleta, M.K.; Nicklow, J.W. Sensitivity and uncertainty analysis coupled with automatic calibration for a distributed watershed model. J. Hydrol. 2005, 306, 127–145. [Google Scholar] [CrossRef] [Green Version]
  55. Song, J.-H.; Her, Y.; Park, J.; Kang, M.-S. Exploring parsimonious daily rainfall-runoff model structure using the hyperbolic tangent function and Tank model. J. Hydrol. 2019, 574, 574–587. [Google Scholar] [CrossRef]
  56. Fang, Q.; Ma, L.; Harmel, R.D.; Yu, Q.; Sima, M.W.; Bartling, P.N.S.; Malone, R.W.; Nolan, B.T.; Doherty, J. Uncertainty of CERES-Maize calibration under different irrigation strategies using PEST optimization algorithm. Agronomy 2019, 9, 241. [Google Scholar] [CrossRef]
  57. Freer, J.; Beven, K.; Ambroise, B. Bayesian estimation of uncertainty in runoff prediction and the value of data: An application of the GLUE approach. Water Resour. Res. 1996, 32, 2161–2173. [Google Scholar] [CrossRef]
  58. Jin, X.; Xu, C.-Y.; Zhang, Q.; Singh, V.P. Parameter and modeling uncertainty simulated by GLUE and a formal Bayesian method for a conceptual hydrological model. J. Hydrol. 2010, 383, 147–155. [Google Scholar] [CrossRef]
  59. Her, Y.; Seong, C. Responses of hydrological model equifinality, uncertainty, and performance to multi-objective parameter calibration. J. Hydroinf. 2018, 20, 864–885. [Google Scholar] [CrossRef] [Green Version]
  60. Shen, Z.Y.; Chen, L.; Chen, T. Analysis of parameter uncertainty in hydrological and sediment modeling using GLUE method: A case study of SWAT model applied to Three Gorges Reservoir Region, China. Hydrol. Earth Syst. Sci. 2012, 16, 121–132. [Google Scholar] [CrossRef]
  61. Moriasi, D.N.; Arnold, J.G.; Van Liew, M.W.; Bingner, R.L.; Harmel, R.D.; Veith, T.L. Model evaluation guidelines for systematic quantification of accuracy in watershed simulations. Trans. ASABE 2007, 50, 885–900. [Google Scholar] [CrossRef]
  62. Migliaccio, K.W.; Chaubey, I. Spatial distributions and stochastic parameter influences on SWAT flow and sediment predictions. J. Hydrol. Eng. 2008, 13, 258–269. [Google Scholar] [CrossRef]
  63. Abuarab, M.E.; El-Mogy, M.M.; Hassan, A.M.; Abdeldaym, E.A.; Abdelkader, N.H.; El-Sawy, M. The effects of root aeration and different soil conditioners on the nutritional values, yield, and water productivity of potato in clay loam soil. Agronomy 2019, 9, 418. [Google Scholar] [CrossRef]
  64. De Vries, M.E.; Rodenburg, J.; Bado, B.V.; Sow, A.; Leffelaar, P.A.; Giller, K.E. Rice production with less irrigation water is possible in a Sahelian environment. Field Crops Res. 2010, 116, 154–164. [Google Scholar] [CrossRef]
  65. Tribulato, A.; Toscano, S.; Di Lorenzo, V.; Romano, D. Effects of water stress on gas exchange, water relations and leaf structure in two ornamental shrubs in the Mediterranean area. Agronomy 2019, 9, 381. [Google Scholar] [CrossRef]
  66. Choi, J.-D.; Park, W.-J.; Park, K.-W.; Lim, K.-J. Feasibility of SRI methods for reduction of irrigation and NPS pollution in Korea. Paddy Water Environ. 2013, 11, 241–248. [Google Scholar] [CrossRef]
  67. Song, J.-H.; Ryu, J.H.; Park, J.; Jun, S.M.; Song, I.; Jang, J.; Kim, S.M.; Kang, M.S. Paddy field modelling system for water quality management. Irrig. Drain. 2016, 65, 131–142. [Google Scholar] [CrossRef]
  68. Mishra, A.; Ghorai, A.K.; Singh, S.R. Rainwater, soil and nutrient conservation in rainfed rice lands in Eastern India. Agric. Water Manag. 1998, 38, 45–57. [Google Scholar] [CrossRef]
  69. Song, J.-H.; Her, Y.; Park, J.; Lee, K.-D.; Kang, M.-S. Simulink implementation of a hydrologic model: A Tank model case study. Water 2017, 9, 639. [Google Scholar] [CrossRef]
  70. Freni, G.; Mannina, G.; Viviani, G. Uncertainty in urban stormwater quality modelling: The effect of acceptability threshold in the GLUE methodology. Water Res. 2008, 42, 2061–2072. [Google Scholar] [CrossRef]
  71. Won, J.G.; Choi, J.S.; Lee, S.P.; Son, S.H.; Chung, S.O. Water saving by shallow intermittent irrigation and growth of rice. Plant Prod. Sci. 2005, 8, 487–492. [Google Scholar] [CrossRef]
  72. Ryu, J.H.; Song, J.H.; Kang, S.M.; Jang, J.S.; Kang, M.S. Impact of Water Management Techniques on Agricultural Reservoir Water Supply. J. Korean Soc. Agric. Eng. 2018, 60, 121–132. [Google Scholar]
Figure 1. (a) Location of the Idong reservoir irrigated district, (b) the photo of the main irrigation canal, and (c) the stage–discharge relationship curve (modified from [20]).
Agronomy 09 00662 g001
Figure 2. Parameter sensitivity in estimating agricultural water supply.
Agronomy 09 00662 g002
Figure 3. Frequency histograms of behavioral parameters.
Agronomy 09 00662 g003
Figure 4. Uncertainty band (90% confidence interval, or 90CI) for the simulated agricultural water supply (AWS) due to parameter uncertainty, calculated using generalized likelihood uncertainty estimation (GLUE), at 10-day intervals.
Agronomy 09 00662 g004
Figure 5. Time-series plots of observed vs. simulated agricultural water supply.
Agronomy 09 00662 g005
Figure 6. Scatter plots of observed vs. simulated agricultural water supply.
Agronomy 09 00662 g006
Table 1. Range of calibration parameters for agricultural water supply simulation.
ParameterDefinitionRangeReferences
P D m a x Outlet height in paddy fields (mm)34.6–123.7[3]
P D m i n Minimum ponding depth for rice cultivation (mm)3.0–60.0[21,40]
I N F Infiltration in paddy fields (mm)1.0–8.8[37,38]
E s Irrigation efficiency (%)34–93[10,32]
N W R Water requirement during the nursery period (mm)80–250[41]
T W R Water requirement during the transplanting period (mm)80–250[41]
Table 2. The overview of the parameter selection schemes compared in this study.
ParameterParameter Selection Schemes
Case ICase IICase IIICase IV
P D m a x (mm)80.0 aS.V.P. fC.P.S.V.P. f
P D m i n (mm)30.0 bS.V.P. gC.P.S.V.P. g
I N F (mm/day)4.6 c4.6 cC.P.4.6 c
E s (%)75 d75 dC.P.Y.C.P.
N W R (mm)140.0 e140.0 eC.P.140.0 e
T W R (mm)140.0 e140.0 eC.P.140.0 e
S.V.P. is seasonally varying parameters, C.P. is calibrated parameters, Y.C.P. is yearly calibrated parameter. a [42] b [18,40], c [43], d [44], e [45], f [3] g [12]. P D m a x is outlet height in paddy fields, P D m i n is minimum ponding depth for rice cultivation, I N F is infiltration in paddy fields, E s is irrigation efficiency, N W R is water requirement during the nursery period, T W R is water requirement during the transplanting period.
Table 3. Seasonal crop coefficients, minimum ponding depths, and outlet heights of paddy fields that are commonly found in the literature for the rice paddy field condition of Korea [3,9,12,19].
ParameterP.S.T.S.Growing and Harvesting Season
123456789101112131415
K c 0.780.780.780.971.071.161.281.451.51.581.461.451.251.011.011.011.01
P D m i n 2060404020203030304040404040404040
P D m a x 66.180.97457.334.672.967.257.763.467.266.166.166.166.166.166.166.1
P.S. is a preparation season for transplanting, T.S. is a season for transplanting.
Table 4. Calibrated parameter values for Case III and Case IV.
SchemeParameterValue
Case III P D m a x (mm)40
P D m i n (mm)8
I N F (mm)8.6
E s (%)60
N W R (mm)232
T W R (mm)234
Case IV E s (%)200158
200275
200343
200456
200549
200650
200761
200852
200956
201048
201150
201257
201350
Table 5. Model simulation statistics for parameter-selection schemes.
StatisticsCase ICase IICase IIICase IV
N S E 10-day0.290.420.780.67
Monthly0.090.330.850.83
P B I A S (%)39.031.96.40.0

