Genotypic Variation in Anthocyanins, Phenolic Compounds, and Antioxidant Activity in Cob and Husk of Purple Field Corn


Abstract
:1. Introduction
2. Materials and Methods
2.1. Plant Materials
2.2. Field Experiment
2.3. Sample Preparation and Extraction
2.4. Determination of Monomeric Anthocyanin Content (MAC)
(A × MW × DF × 103)/(ε × 1)
2.5. Determination of Total Phenolic Content (TPC)
2.6. Determination of Antioxidant Assay
2.7. Color Measurement
2.8. Statistical Analysis
3. Results and Discussion
3.1. Genotypic Variability
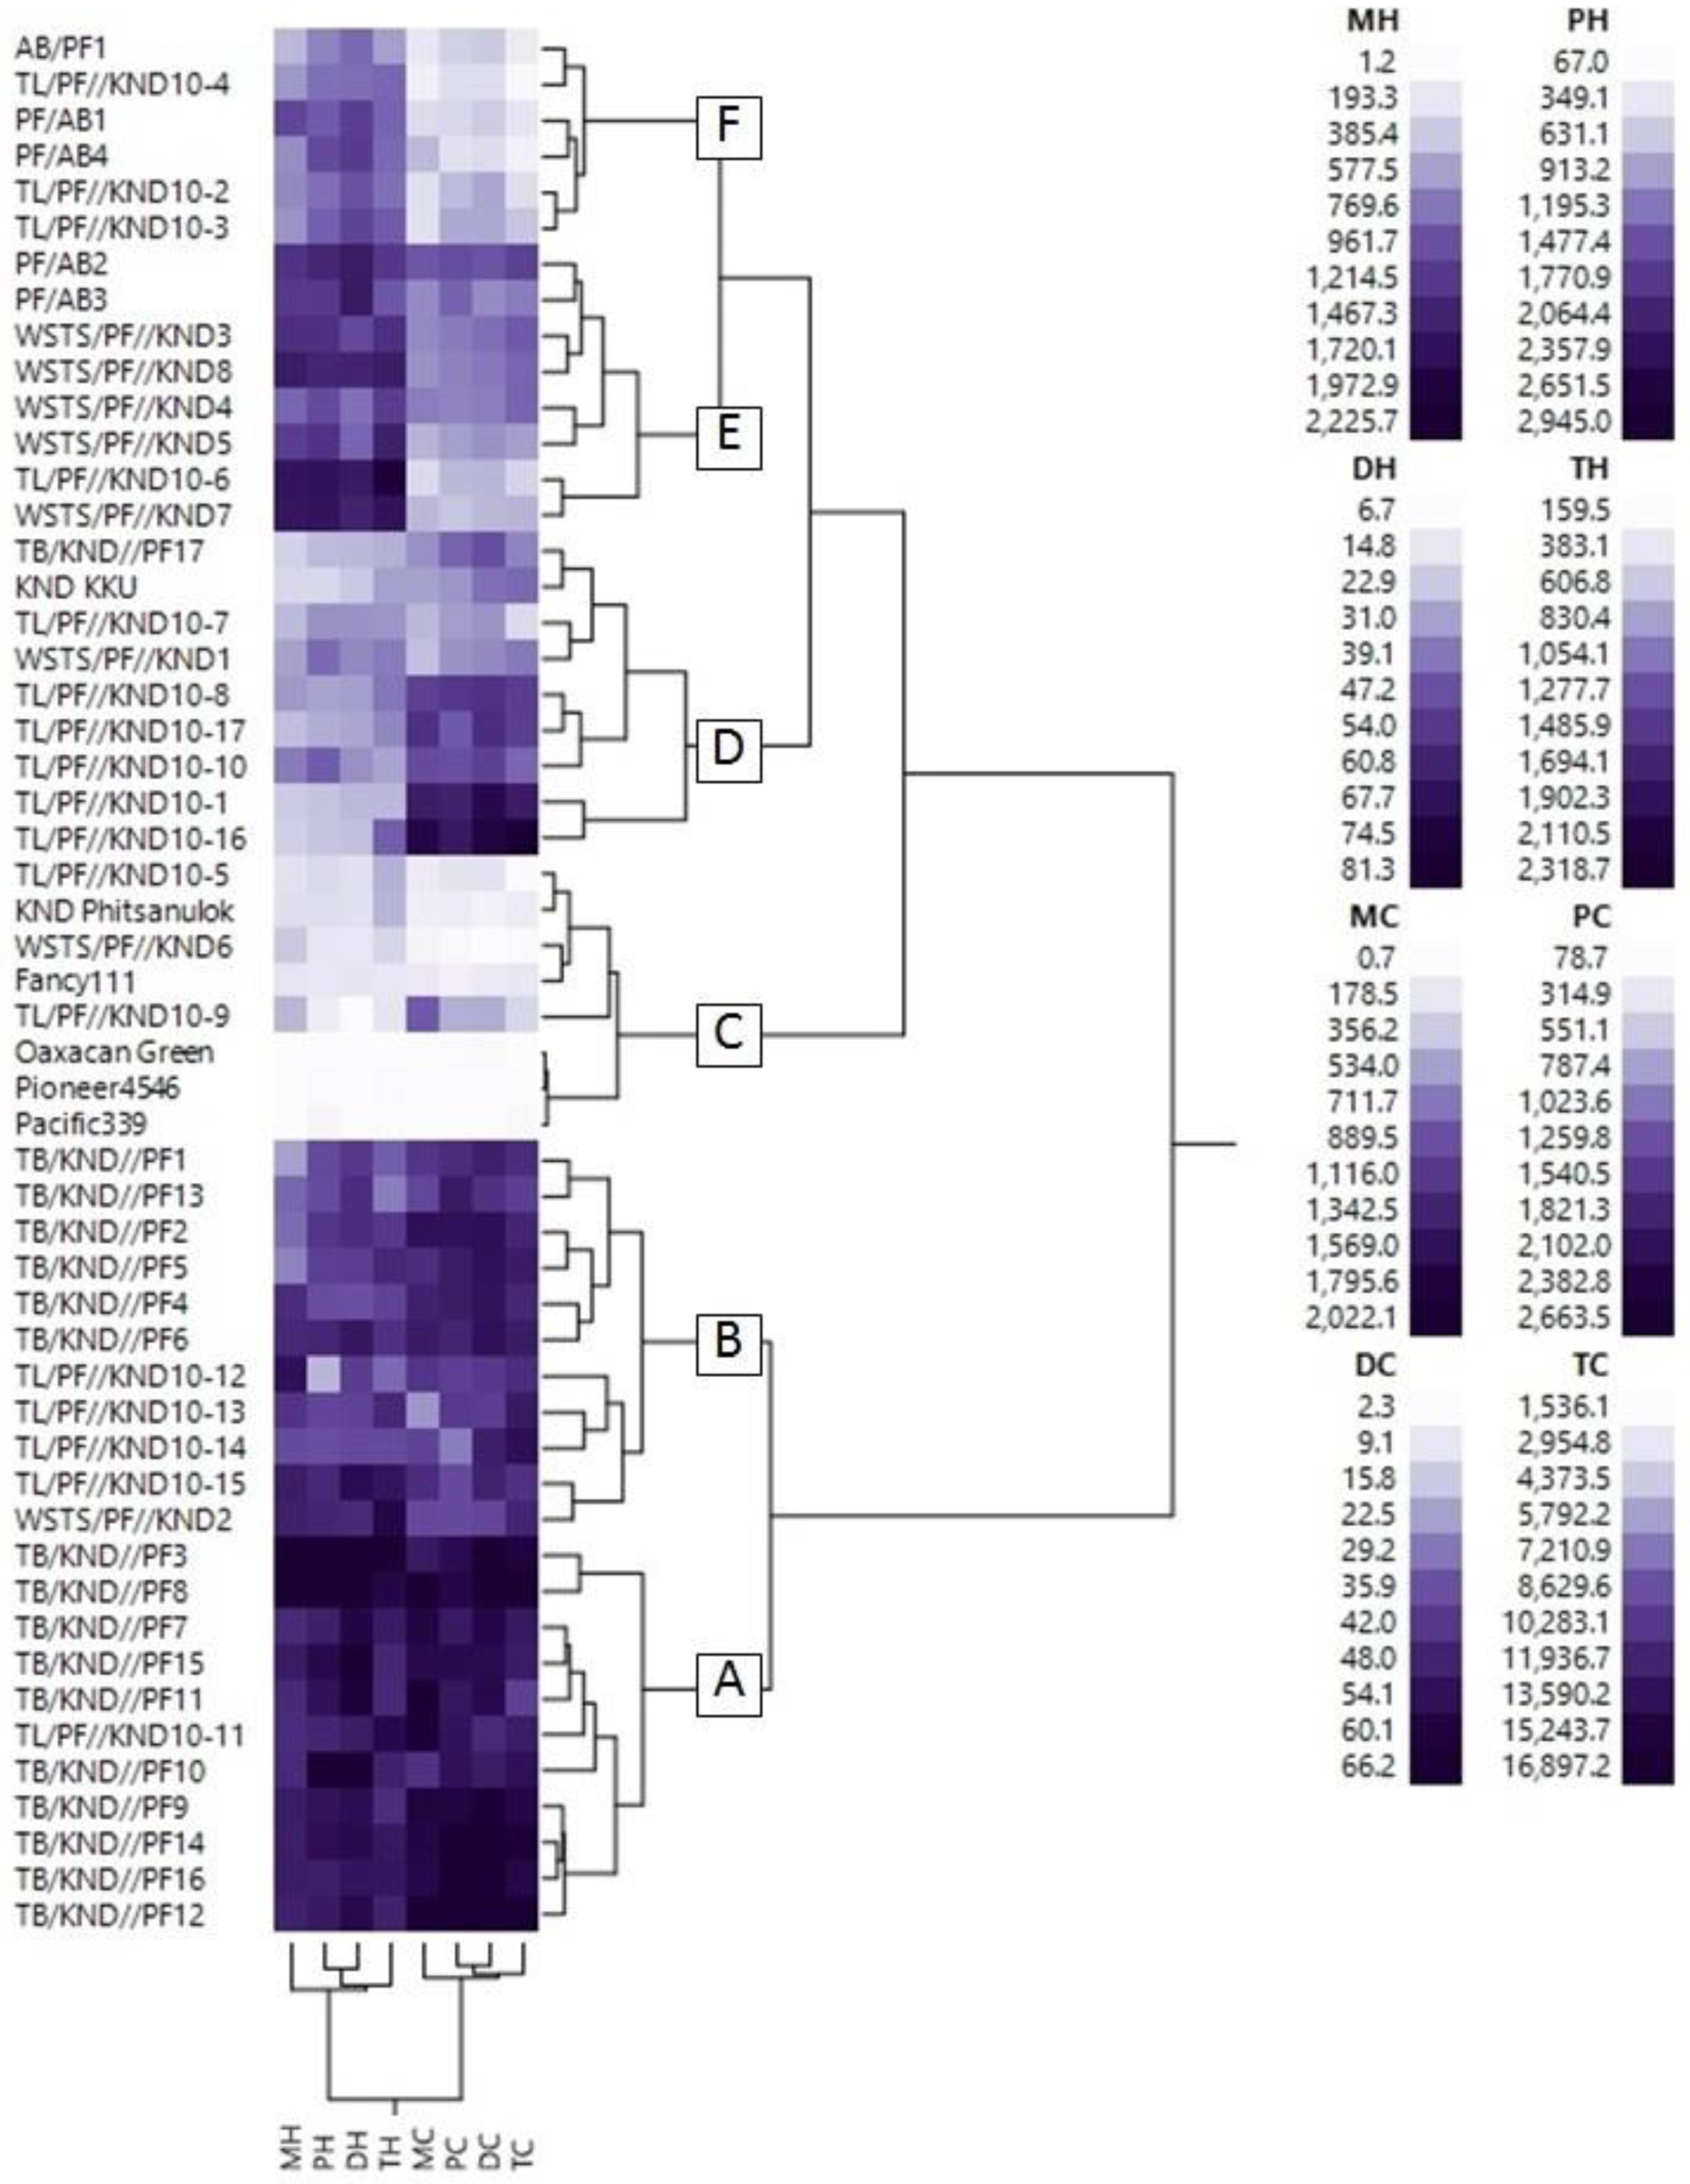
3.2. Cluster Analysis
3.3. Monomeric Anthocyanin Content
3.4. Total Phenolic Content
3.5. Antioxidant Activity
3.6. Correlation
3.6.1. Color Parameters vs. Antioxidant Content Relationship
3.6.2. Antioxidant Content vs. Antioxidant Activity Relationship
4. Conclusions
Author Contributions
Funding
Acknowledgments
Conflicts of Interest
References
- Shiferaw, B.; Prasanna, B.M.; Hellin, J.; Bänziger, M. Crops that feed the world 6: Past successes and future challenges to the role played by maize in global food security. Food Sec. 2011, 3, 307. [Google Scholar] [CrossRef]
- Poramacom, N. Maize production, prices and related policy in Thailand. BJASS 2013, 11, 162–173. [Google Scholar]
- Burt, A.J.; Caston, L.; Leeson, S.; Shelp, B.J.; Lee, E.A. Development and utilization of high carotenoid maize germplasm: Proof concept. Crop Sci. 2013, 53, 554–563. [Google Scholar] [CrossRef]
- Lopez-Martinez, L.X.; Oliart-Ros, R.M.; Valerio-Alfaro, G.; Lee, C.H.; Parkin, K.L.; Garcia, H.S. Antioxidant activity, phenolic compounds and anthocyanins content of eighteen strains of Mexican maize. Food Sci. Technol. 2009, 42, 1187–1192. [Google Scholar] [CrossRef]
- Ramos-Escudero, F.; Muñoz, M.A.; Alvarado-Ortíz, C.; Alvarado, A.; Yáñe, J.A. Purple corn (Zea mays L.) phenolic compounds profile and its assessment as an agent against oxidative stress in isolated mouse organs. J. Med. Food 2012, 15, 206–215. [Google Scholar] [CrossRef] [PubMed]
- Li, C.Y.; Kim, H.W.; Won, S.R.; Min, H.K.; Park, K.J.; Park, J.Y.; Ahn, M.S.; Rhee, H.I. Corn husk as a potential source of anthocyanins. J. Agric. Food Chem. 2008, 56, 1413–1416. [Google Scholar] [CrossRef] [PubMed]
- Yang, Z.; Zhai, W. Identification and antioxidant activity of anthocyanins extracted from the seed and cob of purple corn (Zea mays L.). Innov. Food Sci. Emerg. Technol. 2010, 11, 169–176. [Google Scholar] [CrossRef]
- Khampas, S.; Lertrat, K.; Lomthaisong, K.; Suriharn, B. Variability in phytochemicals and antioxidant activity in corn at immaturity and physiological maturity stages. Int. Food Res. J. 2013, 20, 3149–3157. [Google Scholar]
- Harakotr, B.; Suriharn, B.; Scott, M.P.; Lertrat, K. Genotypic variability in anthocyanins, total phenolics, and antioxidant activity among diverse waxy corn germplasm. Euphytica 2015, 203, 237–248. [Google Scholar] [CrossRef]
- Simla, S.; Boontang, S.; Harakotr, B. Anthocyanin content, total phenolic content, and antiradical capacity in different ear components of purple waxy corn at two maturation stages. Aust. J. Crop Sci. 2016, 10, 675–682. [Google Scholar] [CrossRef]
- Sarepoua, E.; Tangwongchai, T.; Suriharn, B.; Lertrat, K. Relationships between phytochemicals and antioxidant activity in corn silk. Int. Food Res. J. 2013, 20, 2073–2079. [Google Scholar]
- Jing, P. Purple Corn Anthocyanins: Chemical Structure, Chemoprotective Activity and Structure/Function Relationships. Ph.D. Thesis, Ohio State University, Columbus, OH, USA, 2016. [Google Scholar]
- He, J.; Giusti, M.M. Anthocyanins: Natural Colorants with Health-Promoting Properties. Annu. Rev. Food Sci. Technol. 2010, 10, 163–187. [Google Scholar] [CrossRef] [PubMed]
- Herrera-Sotero, M.Y.; Cruz-Hernández, C.D.; Trujillo-Carretero, C.; Rodríguez-Dorantes, M.; García-Galindo, H.S.; Chávez-Servia, J.L.; Oliart-Ros, R.M.; Guzmán-Gerónimo, R.I. Antioxidant and antiproliferative activity of blue corn and tortilla from native maize. Chem. Cent. J. 2017, 11, 1–8. [Google Scholar] [CrossRef] [PubMed]
- Wang, L.S.; Stoner, G. Anthocyanins and their role in cancer prevention. Cancer Lett. 2008, 269, 281–290. [Google Scholar] [CrossRef] [PubMed] [Green Version]
- Faria, A.; Pestana, D.; Teixeira, D.; de Freitas, V.; Mateus, N.; Calhau, C. Blueberry anthocyanins and pyruvic acid adducts: Anticancer properties in breast cancer cell lines. Phytother. Res. 2010, 24, 1862–1869. [Google Scholar] [CrossRef] [PubMed]
- Ghasemzadeh, A.; Karbalaii, M.T.; Jaafar, H.Z.E.; Rahmat, A. Phytochemical constituents, antioxidant activity, and antiproliferative properties of black, red, and brown rice bran. Chem. Cent. J. 2018, 12, 17. [Google Scholar] [CrossRef] [PubMed]
- Zhao, C.; Giusti, M.M.; Malik, M.; Moyer, M.P.; Magnuson, B.A. Effects of commercial anthocyanin-rich extracts on colonic cancer and nontumorigenic colonic cell growth. J. Agric. Food Chem. 2004, 52, 6122–6128. [Google Scholar] [CrossRef] [PubMed]
- Aviram, M. Review of human studies on oxidative damage and antioxidant protection related to cardio- vascular diseases. Free Radic. Res. 2000, 33, S85–S97. [Google Scholar] [PubMed]
- Aviram, M.; Kaplan, M.; Rosenblat, M.; Fuhrman, B. Dietary antioxidants and paraoxonases against LDL oxidation and atherosclerosis development. Handb. Exp. Pharmacol. 2005, 170, 263–300. [Google Scholar]
- Thiraphatthanavong, P.; Wattanathorn, J.; Muchimapura, S.; Thukham-mee, W.; Wannanon, P.; Tong-un, T.; Suriharn, B.; Lertrat, K. Preventive effect of Zea mays L. (purple waxy corn) on experimental diabetic cataract. BioMed Res. Int. 2014, 1–8. [Google Scholar] [CrossRef] [PubMed]
- Lao, F.; Sigurdson, G.T.; Giusti, M.M. Health benefits of purple corn (Zea mays L.) phenolic compounds. Comp. Rev. Food Sci. Food Safety 2017, 16, 234–246. [Google Scholar] [CrossRef]
- Jansen, C. Breeding for Cob Traits in Maize. Ph.D. Thesis, Iowa State University, Ames, IA, USA, 2010. [Google Scholar]
- Beyene, Y.; Anna-Maria, B. Genetic diversity in traditional Ethiopian highland maize accessions assessed by AFLP markers and morphological traits. Biodivers. Conserv. 2005, 15, 2655–2671. [Google Scholar] [CrossRef]
- Jaradat, A.A.; Goldstein, W. Diversity of maize kernels from a breeding program for protein quality: I. Physical, biochemical, nutrient, and color traits. Crop Sci. 2013, 53, 956–976. [Google Scholar] [CrossRef]
- Mcguire, R.G. Reporting of objective color measurements. HortScience 1992, 27, 1254–1255. [Google Scholar]
- Hyman, J.R.; Gaus, J.; Foolad, M.R. A rapid and accurate method for estimating tomato lycopene content by measuring chromaticity values of fruit purée. J. Amer. Soc. Hort. Sci. 2004, 129, 717–723. [Google Scholar]
- Kljak, K.; Grbesa, D.; Karolyi, D. Reflectance colorimetry as a simple method for estimating carotenoid content in maize grain. J. Cereal Sci. 2014, 59, 109–111. [Google Scholar] [CrossRef]
- Jing, P.; Noriega, V.; Schwartz, S.J.; Giusti, M.M. Effects of growing conditions on purple corncob (Zea mays L.) anthocyanins. J. Agric. Food Chem. 2007, 55, 8625–8629. [Google Scholar] [CrossRef] [PubMed]
- Yang, Z.; Fan, G.; Gu, Z.; Han, Y.; Chen, Z. Optimization extraction of anthocyanins from purple corn (Zea mays L.) cob using tristimulus colorimetry. Eur. Food Res. Technol. 2008, 227, 409–415. [Google Scholar] [CrossRef]
- Lee, J.; Durst, R.W.; Wrolstad, R.E. Determination of total monomeric anthocyanin pigment content of fruit juices, beverages, natural colorants, and wines by the pH differential method: Collaborative study. J. AOAC Int. 2005, 88, 1269–1278. [Google Scholar] [PubMed]
- Hu, Q.P.; Xu, J.G. Profiles of carotenoids, anthocyanins, phenolics, and antioxidant activity of selected color waxy corn grains during maturation. J. Agric. Food Chem. 2011, 59, 2026–2033. [Google Scholar] [CrossRef] [PubMed]
- Gomez, K.A.; Gomez, A.A. Statistical Procedure for Agricultural Research; John Wiley and Sons: Singapore, 1984; p. 680. [Google Scholar]
- Santra, M.; Santra, D.K.; Rao, V.S.; Taware, S.P.; Tamhankar, S.A. Inheritance of b-carotene in durum wheat (Triticum turgidum L. ssp. durum). Euphytica 2005, 144, 215–221. [Google Scholar] [CrossRef]
- Chander, S.; Meng, Y.; Zhang, Y.; Yan, J.; Li, J. Comparison of nutritional traits variability in selected eighty-seven inbreds from chinese maize (Zea mays L.) germplasm. J. Agric. Food Chem. 2008, 56, 6506–6511. [Google Scholar] [CrossRef] [PubMed]
- Mahan, A.L.; Murray, S.C.; Rooney, L.W.; Crosby, K.M. Combining ability for total phenols and secondary traits in a diverse set of colored (red, blue, and purple) maize. Crop Sci. 2013, 53, 1248–1255. [Google Scholar] [CrossRef]
- Hwang, T.; Ndolo, V.U.; Katundu, M.; Nyirenda, B.; Bezner-Kerr, R.; Arntfield, S.; Beta, T. Provitamin A potential of landrace orange maize variety (Zea mays L.) grown in different geographical locations of central Malawi. Food Chem. 2016, 196, 1315–1324. [Google Scholar] [CrossRef] [PubMed]
- Halilu, A.D.; Ado, S.G.; Aba, D.A.; Usman, I.S. Genetics of carotenoids for provitamin A biofortification in tropical-adapted maize. Crop J. 2016, 4, 313–322. [Google Scholar] [CrossRef]
- Mafouasson, H.N.A.; Gracen, V.; Yeboah, M.; Ntsomboh-Ntsefong, G.; Tandzi, L.; Mutengwa, C. Genotype-by-Environment Interaction and Yield Stability of Maize Single Cross Hybrids Developed from Tropical Inbred Lines. Agronomy 2018, 8, 62. [Google Scholar] [CrossRef]
- Sserumaga, J.P.; Oikeh, S.O.; Mugo, S.; Asea, G.; Otim, M.; Beyene, Y.; Abalo, G.; Kikafunda, J. Genotype by environment interactions and agronomic performance of doubled haploids testcross maize (Zea mays L.) hybrids. Euphytica 2016, 207, 353–365. [Google Scholar] [CrossRef]
- De Pascual-Teresa, S.; Santos-Buelga, C.; Rivas-Gonzalo, J.C. LC–MS analysis of anthocyanins from purple corn cob. J. Sci. Food Agric. 2002, 82, 1003–1006. [Google Scholar] [CrossRef]
- Limsitthichaikoon, S.; Khampaenjiraroch, B.; Saodaeng, K.; Rimdusit, T.; Thapphasaraphong, S. Quality evaluation of purple waxy corn cobs for health use. JAASP 2012, 3, 326–332. [Google Scholar]
- Li, H.; Deng, Z.; Zhu, H.; Hu, C.; Liu, R.; Young, J.C.; Tsao, R. Highly pigmented vegetables: Anthocyanin compositions and their role in antioxidant activities. Food Res. Int. 2012, 46, 250–259. [Google Scholar] [CrossRef]
- Abdel-Aal, E.M.; Young, C.J.; Rabalsk, I. Anthocyanin composition in black, blue, pink, purple, and red cereal grains. J. Agric. Food Chem. 2006, 54, 4696–4704. [Google Scholar] [CrossRef] [PubMed]
- Cevallos-Casals, B.A.; Cisneros-Bevallos, L. Stoichiometric and kinetic studies of phenolic antioxidants from Andean purple corn and red-fleshed sweet potato. J. Agric. Food. Chem. 2003, 51, 3313–3319. [Google Scholar] [CrossRef] [PubMed]
- Kasarla, R.D. Assessment of phenolic profile of berries and their product. Master’s Thesis, Western Illinois University, Macomb, IL, USA, 2013. [Google Scholar]


| No. | Varieties | Kernel Color | Cob Color | Husk Color | Country |
|---|---|---|---|---|---|
| 1 | AB/PF1 | Red-white | Purple | Purple | Thailand |
| 2 | PF/AB1 | Red-white | Purple | Purple | Thailand |
| 3 | PF/AB2 | Black | Purple | Purple | Thailand |
| 4 | PF/AB3 | Black | Purple | Purple | Thailand |
| 5 | PF/AB4 | white | Purple | Purple | Thailand |
| 6 | TB/KND//PF1 | Black | Purple | Purple | Thailand |
| 7 | TB/KND//PF2 | Black | Purple | Purple | Thailand |
| 8 | TB/KND//PF3 | Black | Purple | Purple | Thailand |
| 9 | TB/KND//PF4 | Black | Purple | Purple | Thailand |
| 10 | TB/KND//PF5 | Black | Purple | Purple | Thailand |
| 11 | TB/KND//PF6 | Black | Purple | Purple | Thailand |
| 12 | TB/KND//PF7 | Black | Purple | Purple | Thailand |
| 13 | TB/KND//PF8 | Black | Purple | Purple | Thailand |
| 14 | TB/KND//PF9 | Black | Purple | Purple | Thailand |
| 15 | TB/KND//PF10 | Black | Purple | Purple | Thailand |
| 16 | TB/KND//PF11 | Black | Purple | Purple | Thailand |
| 17 | TB/KND//PF12 | Black | Purple | Purple | Thailand |
| 18 | TB/KND//PF13 | Black | Purple | Purple | Thailand |
| 19 | TB/KND//PF14 | Black | Purple | Purple | Thailand |
| 20 | TB/KND//PF15 | Black | Purple | Purple | Thailand |
| 21 | TB/KND//PF16 | Black | Purple | Purple | Thailand |
| 22 | TB/KND//PF17 | Black | Purple | Purple | Thailand |
| 23 | TL/PF//KND10-1 | Black | Purple | Purple | Thailand |
| 24 | TL/PF//KND10-2 | Black | Purple | Purple | Thailand |
| 25 | TL/PF//KND10-3 | Black | Purple | Purple | Thailand |
| 26 | TL/PF//KND10-4 | white | Purple | Purple | Thailand |
| 27 | TL/PF//KND10-5 | Black | Purple | Purple | Thailand |
| 28 | TL/PF//KND10-6 | Black | Purple | Purple | Thailand |
| 29 | TL/PF//KND10-7 | Black | Purple | Purple | Thailand |
| 30 | TL/PF//KND10-8 | Black | Purple | Purple | Thailand |
| 31 | TL/PF//KND10-9 | Black | Purple | Purple | Thailand |
| 32 | TL/PF//KND10-10 | Black | Purple | Purple | Thailand |
| 33 | TL/PF//KND10-11 | Red | Purple | Purple | Thailand |
| 34 | TL/PF//KND10-12 | Yellow | Purple | Purple | Thailand |
| 35 | TL/PF//KND10-13 | Red | Purple | Purple | Thailand |
| 36 | TL/PF//KND10-14 | Red | Purple | Purple | Thailand |
| 37 | TL/PF//KND10-15 | white | Purple | Purple | Thailand |
| 38 | TL/PF//KND10-16 | Red | Purple | Purple | Thailand |
| 39 | TL/PF//KND10-17 | Red | Purple | Purple | Thailand |
| 40 | WSTS/PF//KND1 | Red | Purple | Purple | Thailand |
| 41 | WSTS/PF//KND2 | Red | Purple | Purple | Thailand |
| 42 | WSTS/PF//KND3 | Red-white | Purple | Purple | Thailand |
| 43 | WSTS/PF//KND4 | Red-white | Purple | Purple | Thailand |
| 44 | WSTS/PF//KND5 | White | Purple | Purple | Thailand |
| 45 | WSTS/PF//KND6 | Red-white | Purple | Purple | Thailand |
| 46 | WSTS/PF//KND7 | white | Purple | Purple | Thailand |
| 47 | WSTS/PF//KND8 | Red-white | Purple | Purple | Thailand |
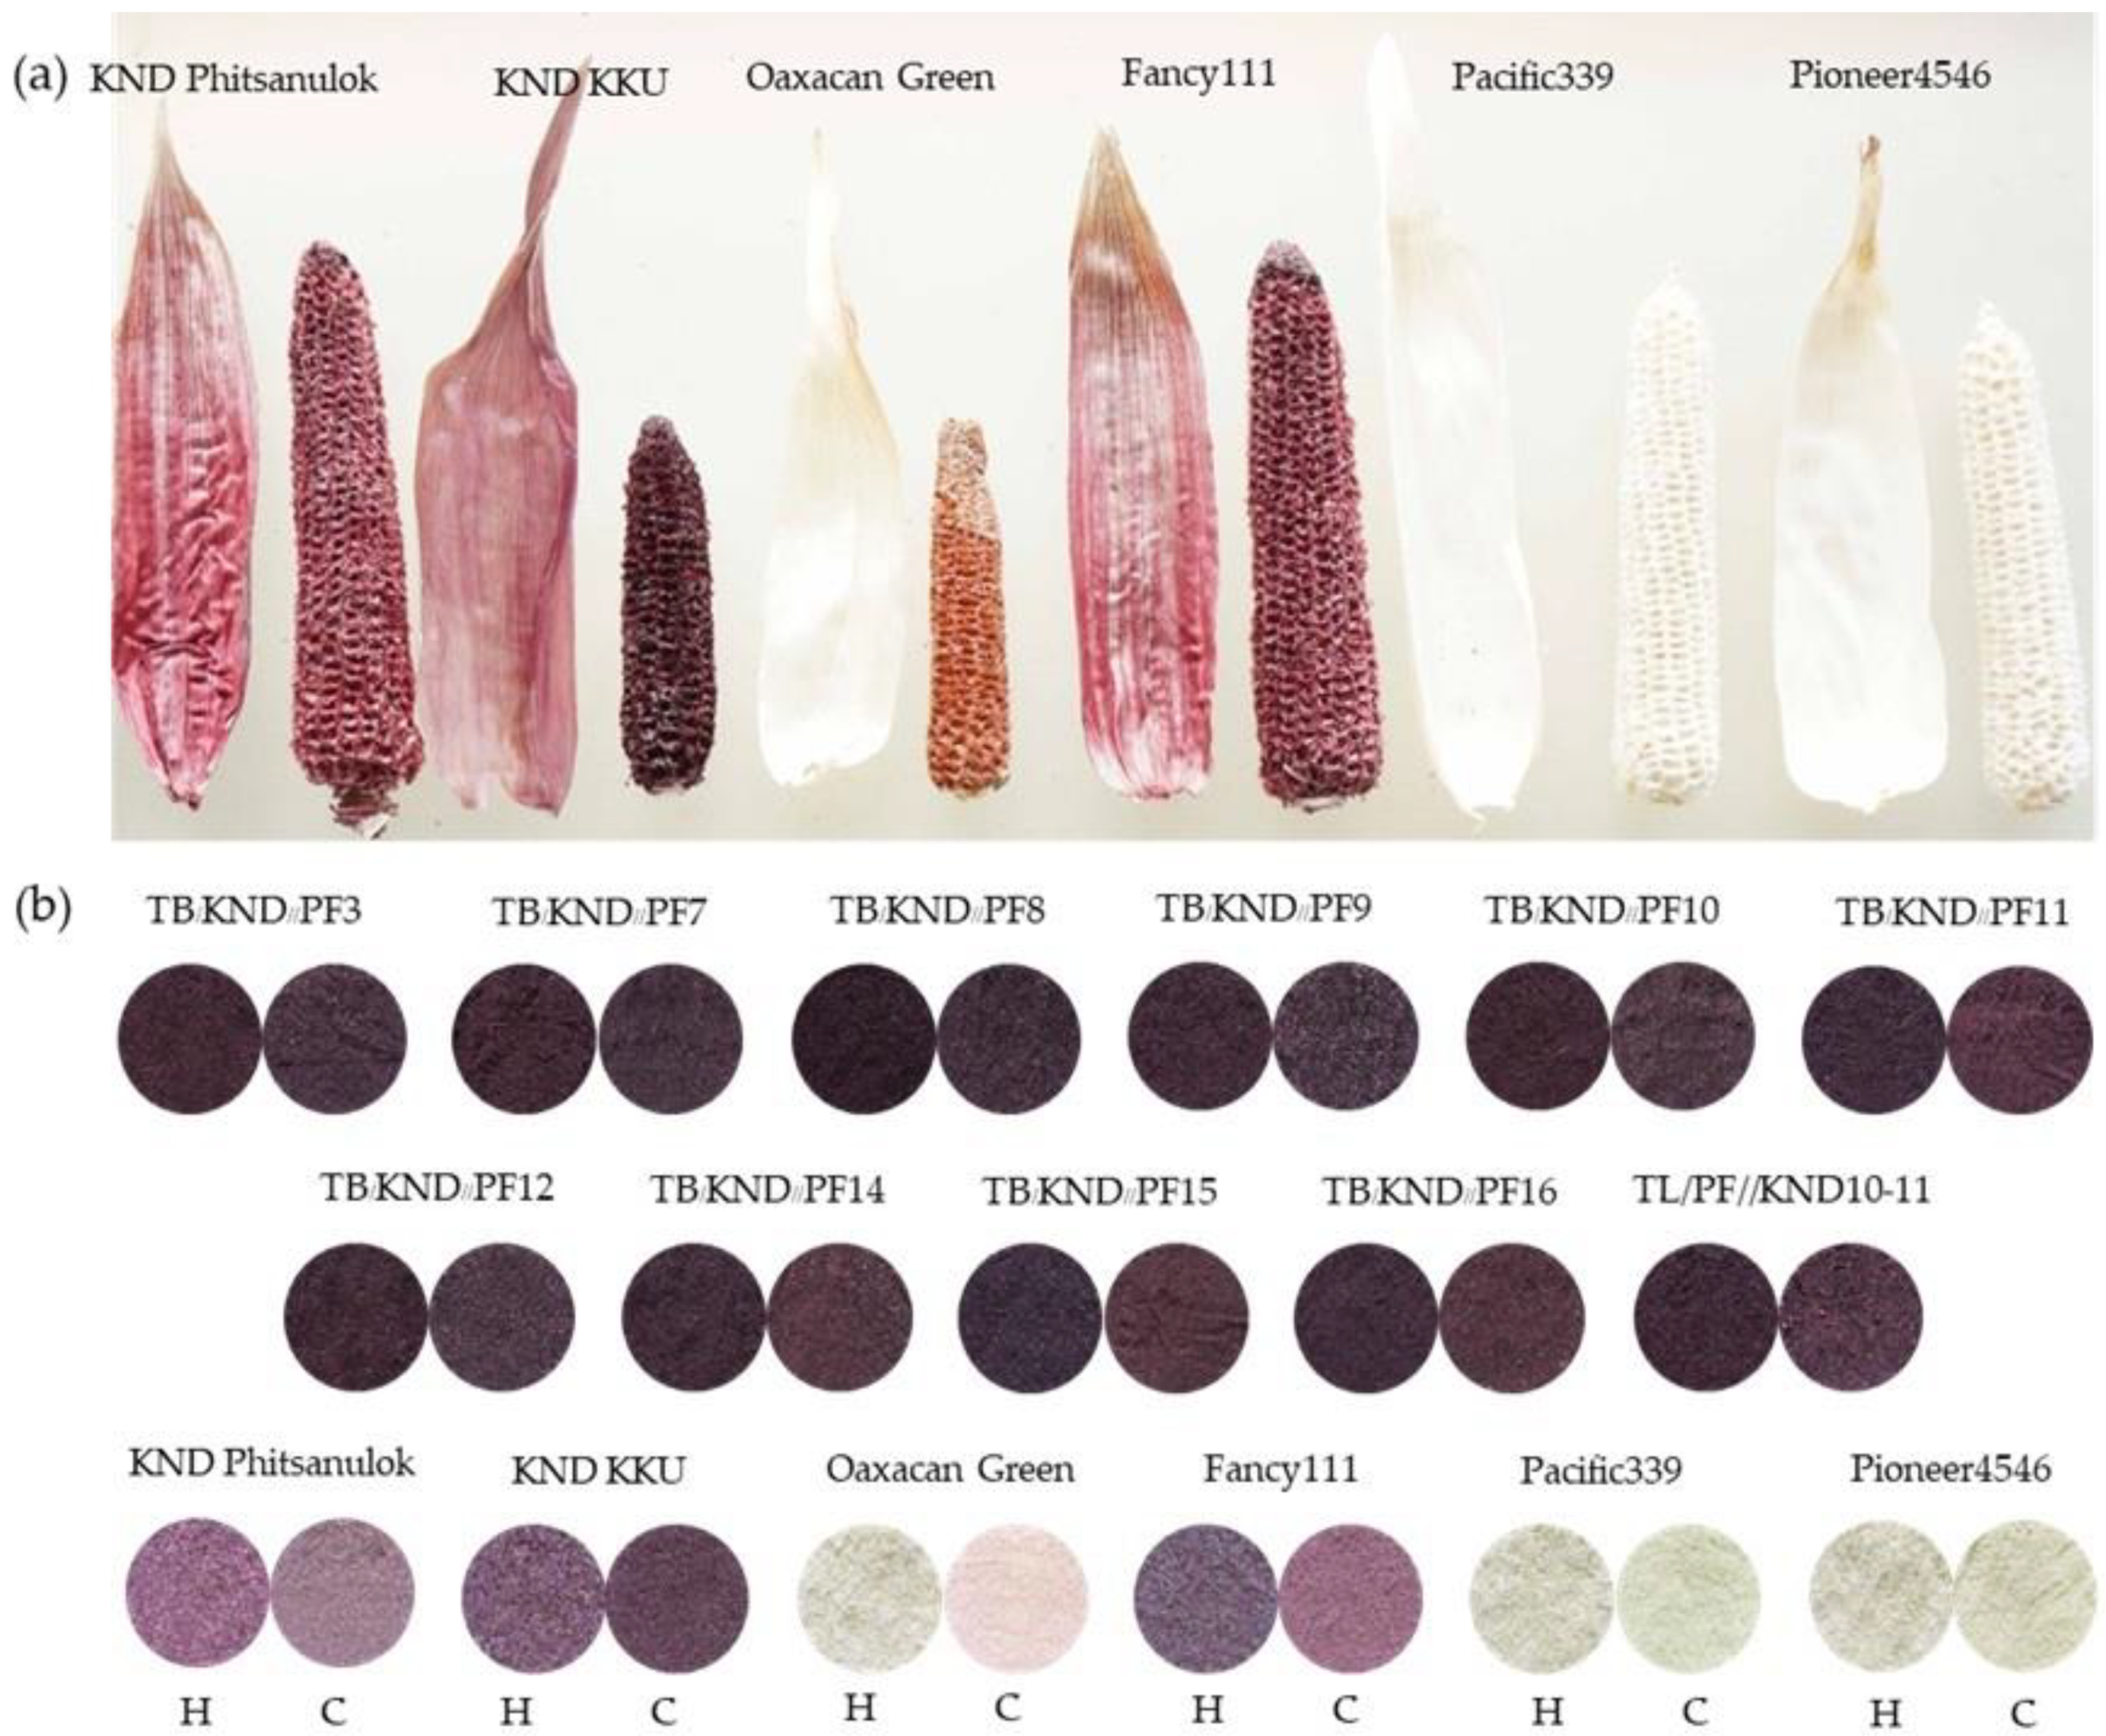
| 48 | KND Phitsanulok | Black | Purple | Purple-Green | Thailand |
| 49 | KND KKU | Black | Purple | Purple-Green | Thailand |
| 50 | Oaxacan Green | Green | Brown | Green | United States |
| 51 | Fancy111 | Black | Purple | Purple-Green | Thailand |
| 52 | Pacific339 | Orange | white | Green | Thailand |
| 53 | Pioneer4546 | Orange | white | Green | Thailand |
| SOV | df | Antioxidants | Antioxidant Capacity | Color Parameters | |||||
|---|---|---|---|---|---|---|---|---|---|
| MAC | MAC/e | TPC | TPC/e | DPPH | TEAC | C* | H° | ||
| Husk | |||||||||
| Location (L) | 1 | 17,000,000 ** | 76,570 ** | 17,490,000 ** | 789,000,000 ** | 22,050 ** | 519,400,000 ** | 190.2 ** | 2.5 ns |
| (15.8) a | (8.3) | (10.4) | (4.5) | (16.0) | (8.0) | (23.2) | (0.0) | ||
| Rep/L (a) | 4 | 794 | 15 | 13,765 | 690,826 | 26 | 76,101 | 0.3 | 740.0 |
| (0.0) | (0.0) | (0.0) | (0.0) | (0.1) | (0.0) | (0.1) | (1.4) | ||
| Genotype (G) | 46 | 1,557,246 ** | 14,450 ** | 2,624,889 ** | 297,200,000 ** | 1,990 ** | 89,800,000 ** | 8.7 ** | 2044.6 ** |
| (66.7) | (72.4) | (71.6) | (77.7) | (66.2) | (63.9) | (48.8) | (45.2) | ||
| L × G | 46 | 396,767 ** | 3794 ** | 606,800 ** | 64,770,000 ** | 478 ** | 39,180,000** | 3.3 ** | 2256.4 ** |
| (17.0) | (19.0) | (16.5) | (17.0) | (15.9) | (27.8) | (18.5) | (49.8) | ||
| Error (b) | 184 | 3174 | 16 | 13,618 | 745,447 | 14 | 116,634 | 0.4 | 40.8 |
| (0.5) | (0.3) | (1.5) | (0.8) | (1.8) | (0.3) | (9.4) | (3.6) | ||
| C.V. (a) (%) | 2.6 | 4.8 | 7.2 | 6.8 | 9.9 | 2.3 | 4.2 | 9.4 | |
| C.V. (b) (%) | 5.3 | 5.0 | 7.2 | 7.0 | 7.2 | 2.8 | 5.3 | 2.2 | |
| Cob | |||||||||
| Location (L) | 1 | 2,913,055 ** | 8091 ** | 3,619,754 ** | 46,040,000 ** | 1725 ** | 198,400,000 ** | 87.3 ** | 382.9 ** |
| (2.6) | (1.0) | (2.4) | (0.4) | (1.7) | (3.0) | (4.7) | (1.4) | ||
| Rep/L (a) | 4 | 1666 | 4.4 | 2758 | 127,264 | 5 | 257,194 | 0.4 | 1.4 |
| (0.0) | (0.0) | (0.0) | (0.0) | (0.0) | (0.0) | (0.1) | (0.0) | ||
| Genotype (G) | 46 | 2,003,180 ** | 14,920 ** | 2,855,735 ** | 244,100,000 ** | 1873 ** | 121,900,000 ** | 30.1 ** | 430.9 ** |
| (83.2) | (84.9) | (85.3) | (86.9) | (86.9) | (86.1) | (74.6) | (70.0) | ||
| L × G | 46 | 340,432 ** | 2449 ** | 385,483 ** | 33,370,000 ** | 231 ** | 14,540,000 ** | 6.2 ** | 134.4 ** |
| (14.1) | (13.9) | (11.5) | (11.9) | (10.7) | (10.3) | (15.5) | (21.9) | ||
| Error (b) | 184 | 597 | 9 | 6835 | 579,652 | 4 | 217,930 | 0.5 | 10.3 |
| (0.1) | (0.2) | (0.8) | (0.8) | (0.7) | (0.6) | (5.1) | (6.7) | ||
| C.V. (a) (%) | 4.1 | 2.8 | 3.8 | 3.3 | 5.5 | 5.4 | 6.5 | 0.4 | |
| C.V. (b) (%) | 2.5 | 4.0 | 6.0 | 7.1 | 5.0 | 5.0 | 7.0 | 1.1 | |
| Husk | ||||||
| Group A 1 | MAC | MAC/e | TPC | TPC/e | DPPH | TEAC |
| TB/KND//PF3 | 2093.6 | 203.9 | 2945.0 | 28,526.0 | 81.3 | 20,085.0 |
| TB/KND//PF7 | 1389.4 | 108.2 | 2137.3 | 16,080.0 | 72.8 | 15,182.0 |
| TB/KND//PF8 | 2225.8 | 180.6 | 2797.2 | 22,492.0 | 78.2 | 17,335.0 |
| TB/KND//PF9 | 1561.4 | 148.3 | 2308.1 | 22,042.0 | 69.5 | 14,307.0 |
| TB/KND//PF10 | 1387.1 | 139.6 | 2804.4 | 28,118.0 | 77.4 | 15,092.0 |
| TB/KND//PF11 | 1384.5 | 110.3 | 2326.4 | 18,860.0 | 75.5 | 14,349.0 |
| TB/KND//PF12 | 1483.6 | 112.0 | 2210.2 | 16,609.0 | 70.7 | 14,467.0 |
| TB/KND//PF14 | 1539.9 | 137.5 | 2398.1 | 21,256.0 | 70.3 | 15,328.0 |
| TB/KND//PF15 | 1566.3 | 96.1 | 2484.7 | 15,153.0 | 76.8 | 14,293.0 |
| TB/KND//PF16 | 1564.0 | 103.0 | 2132.5 | 14,128.0 | 66.0 | 15,147.0 |
| TL/PF//KND10-11 | 1361.8 | 42.7 | 2024.7 | 6323.0 | 63.2 | 17,064.0 |
| LSD | 64.0 | 4.6 | 132.9 | 983.5 | 4.2 | 389.0 |
| Check Varieties | ||||||
| KND Phitsanulok | 274.4 | 50.0 | 461.7 | 8403.0 | 17.6 | 6349.0 |
| KND KKU | 323.7 | 60.6 | 534.8 | 10,039 | 23.2 | 7619.0 |
| Oaxacan green | 3.3 | 0.4 | 67.3 | 847.0 | 6.8 | 1272.0 |
| Fancy 111 | 214.6 | 32.1 | 349.6 | 5227.0 | 15.6 | 3279.0 |
| Pacific339 | 1.1 | 0.3 | 167.5 | 4756.0 | 6.9 | 1453.0 |
| Pioneer4546 | 1.8 | 0.4 | 92.0 | 2224.0 | 6.7 | 1550.0 |
| Cob | ||||||
| Group A 1 | MAC | MAC/e | TPC | TPC/e | DPPH | TEAC |
| TB/KND//PF3 | 1455.4 | 129.0 | 2179.9 | 19,390.0 | 62.2 | 15,224.0 |
| TB/KND//PF7 | 1749.1 | 204.9 | 1955.2 | 22,852.0 | 57.9 | 12,821.0 |
| TB/KND//PF8 | 2022.1 | 140.4 | 2277.4 | 15,594.0 | 66.2 | 16,849.0 |
| TB/KND//PF9 | 1787.4 | 157.8 | 2334.5 | 20,807.0 | 61.8 | 14,647.0 |
| TB/KND//PF10 | 1176.5 | 118.4 | 2090.4 | 20,862.0 | 50.1 | 13,619.0 |
| TB/KND//PF11 | 1873.6 | 198.9 | 2002.1 | 21,383.0 | 56.6 | 9675.0 |
| TB/KND//PF12 | 1854.5 | 157.9 | 2663.7 | 23,108.0 | 64.9 | 16,897.0 |
| TB/KND//PF14 | 1733.3 | 136.4 | 2545.6 | 20,410.0 | 65.4 | 15,460.0 |
| TB/KND//PF15 | 1654.4 | 89.4 | 2211.5 | 12,288.0 | 55.8 | 12,613.0 |
| TB/KND//PF16 | 1677.8 | 64.9 | 2551.8 | 9897.0 | 64.1 | 14,571.0 |
| TL/PF//KND10-11 | 1842.3 | 86.3 | 2066.2 | 9831.0 | 46.0 | 12,496.0 |
| LSD | 27.8 | 3.4 | 94.2 | 867.2 | 2.2 | 531.8 |
| Check Varieties | ||||||
| KND Phitsanulok | 122.7 | 22.3 | 274.1 | 5041.0 | 5.4 | 2710.0 |
| KND KKU | 530.1 | 92.8 | 849.5 | 14,868 | 30.3 | 7696.0 |
| Oaxacan green | 7.4 | 1.1 | 96.9 | 1401.0 | 3.3 | 1536.0 |
| Fancy 111 | 158.4 | 29.2 | 209.0 | 3575.0 | 7.8 | 2960.0 |
| Pacific339 | 0.7 | 0.2 | 93.6 | 2610.0 | 2.9 | 1738.0 |
| Pioneer4546 | 0.9 | 0.2 | 78.6 | 1948.0 | 2.7 | 1606.0 |
| Color Parameters | ||||
|---|---|---|---|---|
| C* in Husk | C* in Cob | H° in Husk | H° in Cob | |
| MAC in husk | −0.54 ** | −0.42 ** | −0.12 * | −0.33 ** |
| MAC in cob | −0.02 ns | −0.69 ** | 0.10 ns | −0.55 ** |
| TPC in husk | −0.45 ** | −0.47 ** | −0.18** | −0.31 ** |
| TPC in cob | 0.00 ns | −0.73 ** | −0.05 ns | −0.60 ** |
| DPPH in husk | −0.45 ** | −0.51 ** | −0.14 * | −0.36 ** |
| DPPH in cob | 0.01 ns | −0.74 ** | −0.05 ns | −0.65 ** |
| TEAC in husk | −0.48 ** | −0.37 ** | −0.16 ** | −0.32 ** |
| TEAC in cob | 0.00 ns | −0.68 ** | −0.06 ns | −0.60 ** |
| MAC in husk/e | −0.39 ** | −0.39 ** | −0.17 ** | −0.30 ** |
| MAC in cob/e | 0.03 ns | −0.58 ** | −0.06 ns | −0.48 ** |
| TPC in husk/e | −0.31 ** | −0.40 ** | −0.19 ** | −0.28 ** |
| TPC in cob/e | 0.02 ns | −0.59 ** | −0.11 ns | −0.52 ** |
© 2018 by the authors. Licensee MDPI, Basel, Switzerland. This article is an open access article distributed under the terms and conditions of the Creative Commons Attribution (CC BY) license (http://creativecommons.org/licenses/by/4.0/).
Share and Cite
Khamphasan, P.; Lomthaisong, K.; Harakotr, B.; Ketthaisong, D.; Scott, M.P.; Lertrat, K.; Suriharn, B. Genotypic Variation in Anthocyanins, Phenolic Compounds, and Antioxidant Activity in Cob and Husk of Purple Field Corn. Agronomy 2018, 8, 271. https://doi.org/10.3390/agronomy8110271
Khamphasan P, Lomthaisong K, Harakotr B, Ketthaisong D, Scott MP, Lertrat K, Suriharn B. Genotypic Variation in Anthocyanins, Phenolic Compounds, and Antioxidant Activity in Cob and Husk of Purple Field Corn. Agronomy. 2018; 8(11):271. https://doi.org/10.3390/agronomy8110271
Chicago/Turabian StyleKhamphasan, Ponsawan, Khomsorn Lomthaisong, Bhornchai Harakotr, Danupol Ketthaisong, Marvin Paul Scott, Kamol Lertrat, and Bhalang Suriharn. 2018. "Genotypic Variation in Anthocyanins, Phenolic Compounds, and Antioxidant Activity in Cob and Husk of Purple Field Corn" Agronomy 8, no. 11: 271. https://doi.org/10.3390/agronomy8110271