Article

Eastern Gamagrass Responds Inconsistently to Nitrogen Application in Long-Established Stands and within Diverse Ecotypes

1
USDA, Agricultural Research Service, Grassland Soil and Water Research Laboratory, 808 E Blackland Rd., Temple, TX 76502, USA
2
Oak Ridge Institute for Science and Education, 808 East Blackland Rd., Temple, TX 76502, USA
3
Department of Environmental Horticulture & Landscape Architecture, College of Life Science & Biotechnology, Dankook University, Cheonan-si 31116, Republic of Korea
*
Author to whom correspondence should be addressed.
Agronomy 2024, 14(5), 907; https://doi.org/10.3390/agronomy14050907
Submission received: 15 March 2024 / Revised: 4 April 2024 / Accepted: 24 April 2024 / Published: 26 April 2024
(This article belongs to the Special Issue The Response of Grassland Ecosystem to Nutrient Additions)

Abstract

:
Eastern gamagrass (Tripsacum dactyloides) is a highly productive, highly palatable native grass tolerant to both drought and flooding. It has frequently shown great response to nitrogen (N) applications, but the responses of southern native ecotypes in upland and bottomland sites have yet to be reported. The objectives were to measure the responses of long-established eastern gamagrass with different N application rates in two bottomland hay pastures and two upland grazed sites, and to measure the N responses for six diverse ecotypes in a common garden. A randomized block design was used with ecotype as the main block and fertilizer rate as the subplot. In the long-established sites, 75 N peak yields were not statistically different to those of 0 N, while upland yields across the season were consistently higher for 150 N but varied for the bottomland. The common garden ecotypes had no significant difference in yield between treatments when averaged across years. Roaring Springs showed the most consistent and greatest benefit to additional N, more than doubling the dry weight of the control. All remaining ecotypes, however, had more modest responses. Eastern gamagrass responds inconsistently to applications of 75 N, whereas most applications of 150 N generally result in higher yield, though significant increases are not guaranteed.

1. Introduction

Fertilizer application is the primary means of increasing forage production once highly productive native perennial grasses are established in dryland situations. Increased forage production in response to the nitrogen fertilization of productive perennial grasses such as switchgrass (Panicum virgatum L.), prairie cordgrass (Spartina pectinata Link, PCG), and giant miscanthus (Miscanthus × giganteus) has been well documented [1,2,3]. The high cost of nitrogen fertilizers has, however, made estimates of plant nutrient responses especially important as producers consider the economic viability of such applications.
The highly productive, warm-season native grass eastern gamagrass (Tripsacum dactyloides) (hereafter referred to as EG) has also shown large responses to applied nitrogen (hereafter referred to as N). Brejda et al. [4] showcased that dry matter in a three-year-old and a six-year-old stand of PMK-24 (now known as ‘Pete’) EG more than doubled in response to fertilizer in two of the three years in northern Missouri. Douglas [5] and Brakie [6] also showed that the dry matter of four southern ecotypes of EG in eastern Texas more than doubled in response to fertilizer application. Heggenstaller et al. [7] demonstrated that the dry matter of ‘Pete’ EG increased by 51% and 107% when N fertilizer was applied at 220 kg/ha two years following planting in Iowa. In Kansas, Moyer and Sweeney [8] found that N fertilizer applications of up to 200 kg/ha to ‘Pete’ EG resulted in 48% to 131% yield increases relative to zero for plots 15 to 23 years old. ‘Pete’ EG dry matter production has also been shown to increase by an average of 25% relative to zero one to three years after seeding in Wisconsin, when Coblentz [9] applied N at 202 kg/ha. There has even been some evidence of nitrogen fixation with EG [10].
EG has an optimal N application rate of 32–181 kg N/acre/year depending on precipitation [11]. Its nutrient requirements and ability to thrive without added fertilizer is extremely desirable. EG also can be applied to plots with other grasses, especially in a stratified block, without a difference in forage production [12]. The high price of nitrogen (N) fertilizer has made improved grasses such as coastal bermudagrass (Cynodon dactylon Pers.) costly as they require considerable fertilizer inputs to remain productive.
EG is ideal for grazing and hay production in the eastern half of the United States. It is highly productive, but its high palatability has caused it to be overgrazed and it has disappeared over much of its range [13,14]. Although EG’s crude protein content varied throughout the year, it surpassed a sorghum × sudangrass hybrid (Sorghum bicolor × S. bicolor var. sudanense) and provided more animal days per hectare for heifers [15,16]. Its nutritional value peaks in May and, when managed with rotational grazing, it can produce 7973 to 17,618 kg of forage per ha [15]. Fertilized coastal bermudagrass is also more palatable than unfertilized grass and it loses palatability with age [17].
Thus, there were two objectives of this study. The first was to measure the responses of long-established eastern gamagrass with different application rates among two bottomland hay pasture sites and two upland grazed sites. The second objective was to look at the N responses for six diverse ecotypes of EG in plots of a common garden.

2. Materials and Methods

2.1. Long-Established Sites

Sites in this study were all long-established and named based on their growing location. The bottomland sites designated Frank (owned by J. Frank Monk) and Gordon (owned by Gordon Goebel) are located near Bellville, Texas (Table 1). These two sites are harvested for hay two to four times each year depending on precipitation, and occasionally flood (Figure 1). Gordon’s site is within the largest known natural stand of EG with records indicating it has been in existence since before the Civil War (personal communication). Frank’s site is within the same floodplain but has been established for over 10 years and planted from seeds from the local source. The upland sites designated Jim (owned by Jim Kiniry) and Ronnie (owned by Ronnie Scala) are located in central Texas near Moody and Oscar, respectively (Table 1). While these two sites were grazed prior to this experiment, electric fences were installed to keep livestock out of the plots for the duration of this study. Jim’s and Ronnie’s EG sites were planted from seed at least 10 years prior to this study with ‘Texas Sue’ EG.
Experiment plots were established in February 2019 using a randomized block study design with 3 replications. Each within-block treatment was 5 m × 5 m with 2.5 m gaps between treatments and replicated blocks. A synthetic dry fertilizer of 19N-5P-9K was applied throughout the study period. Nitrogen addition treatments included a control, or 0 N applied (here after referred to as 0 N), 75 N, and 150 N lbs/ac (0, 84, 168 kg/ha). All four sites were fertilized in the spring of 2019. Both Frank’s and Gordon’s bottomland sites were treated on 8 February 2019. In the uplands, fertilizer was applied on 6 February 2019 at Jim’s site, and on 26 February 2019 at Ronnie’s site. In 2020, fertilizer application and data collection were deferred due to the global pandemic. In 2021, Frank’s and Gordon’s fertilizer treatments were split into 3 applications: early season (1 April 2021), mid-season after the first cutting (27 July 2021), and late season after the second cutting (8 September 2021). Jim’s site had a single early-season fertilizer application, just as in 2019, on 7 April 2021. Ronnie’s site was not fertilized in 2021 due to some remaining COVID-19 complications, and therefore only has data for 2019.
Soil samples at the long-established sites were taken before fertilization treatments were applied and at the end of each season. The soil cores of the top 16 cm were from each replication of each treatment. This was sent in-house to Dr. Rick Haney’s lab at the Grassland, Soil, and Water Research Laboratory at USDA-ARS, and off to the Soil, Water, and Forage Testing Laboratory at Texas A&M University for analysis of CO2-C, water-extractable N, and water-extractable C to determine soil health [18]. The soil health method as outlined in Haney et al. [18] utilizes a Seal Analytic rapid flow analyzer to determine the nitrogen present. Plant biomass sampling occurred a minimum of three times in the growing season. Bottomland sites were harvested at the beginning of the season, just prior to each hay cutting, and at the end of the season. A 0.5 m × 0.5 m sample was harvested in each replication in each treatment for all the long-established sites. Plant material was then dried in a 60 °C forced-air oven for at least 48 h or until a uniform weight was achieved. Plant N concentrations were determined using the total Kjeldahl digestion procedure by the Soil, Water, and Forage Testing Laboratory at Texas A&M University.

2.2. Ecotypes Plot

The USDA-ARS Grassland, Soil and Research Laboratory in Temple, Texas, has a common garden of nearly 300 ecotypes of EG gathered from across the eastern US (Table 1) [19]. In 2019, the fertilized treatment ecotypes plot was established from transplants of 6 ecotypes (Table 2). Each ecotype had 3 replications and 2 treatments with 5 plants per replication 1 m apart. The 6 ecotypes were chosen based on morphological differences [19]. Two of the ecotypes have upright leaf structures and broad leaf widths (Bryan and Jackson), two have intermediate structures and widths (Bellville and Roaring Springs), and two have intermediate structures and narrow leaf widths (Stampede and WNWR). These 6 ecotypes also contain each type of ploidy measured in the large collection (Table 2) [19]. Heights also vary in these ecotypes, ranging from close to 100 cm (WNWR) to nearly the tallest canopy in the collection at 170 cm (Jackson).
Two fertilizer treatments were applied to these ecotypes: 0 N and 150 N. Dry 19N-5P-9K fertilizer was applied once, early in the season each year on 8 March 2019, 14 April 2021, and 28 March 2022. Soil samples were obtained from the ecotypes plot before treatments were applied on 8 March 2019 and before a weed barrier was laid down. No additional soil samples were taken due to the weed barrier. Soil data are, therefore, not shown.
Each fall from 2020 to 2022, one representative whole plant was harvested above ground from each replication in each treatment. Samples were dried in a 60 °C forced-air oven for at least 48 h or until a uniform weight was achieved, and then weighed. Soil was also sent off for N analysis as described above.

2.3. Statistical Analysis

Across both the long-established sites and the ecotypes plot, there were no outliers and no transformations were necessary. One-way ANOVA models were used to test the difference between N treatment, site, and year by total peak biomass for the long-established sites. EG dry weight and weed yield across time were also analyzed using a one-way ANOVA by N treatment and habitat type. Across ecotypes, we used a one-way ANOVA to determine any differences between N treatments. Means were separated using the Tukey HSD procedure and treatments were considered significant if p < 0.10. All analyses were performed in JMP (SAS 2024).

3. Results

3.1. Long-Established Sites

Among the four long-established sites, in 2019, the 150 N treatment resulted in an average increase of 49% in dry weight at peak harvest relative to 0 N (Table 3). The 75 N showed an inconsistent response relative to 0 N at peak harvest in 2019, with three of the four cases being less than the 0 N. Average peak biomass yield in 2019 for 75 N was 11% less than the 0 N treatment. Peak biomass harvest data for 2019 were from the second harvest for Frank and Gordon (bottomland), and the third harvest for Jim and Ronnie (upland). These dates had statistically significantly higher yields than the other harvest dates (p < 0.0001). In 2021, the 150 N treatment showed an average increase of 64% at peak harvest relative to the 0 N (Table 3). The 75 N treatment showed an average increase of 41% at peak harvest in 2021. Peak biomass harvest data for 2021 were from the second harvest for the bottomland and the final harvest from Jim.
The total growing season dry weight for each site increased with any addition of fertilizer from 11% to double the control, excluding the 75 N in 2019 at Gordon’s and Jim’s. The increases in yields averaged across the season at all long-established sites for 75 N and 150 N were 5% and 45% in 2019, and 35% and 55% in 2021, respectively.
The statistical analysis showed that the 150 N treatment resulted in significantly higher biomass when compared to the 75 N or 0 N treatments across all years (p = 0.0037; Figure 2). There were no differences between the 75 N and 0 N treatments. Peak biomass was also found to be somewhat higher in the upland than in the bottomland sites over all years. Specifically, only Frank’s was statistically shown to have lower biomass (p = 0.0023; Figure 3). There were no statistical differences in peak biomass between the years (p = 0.3143).

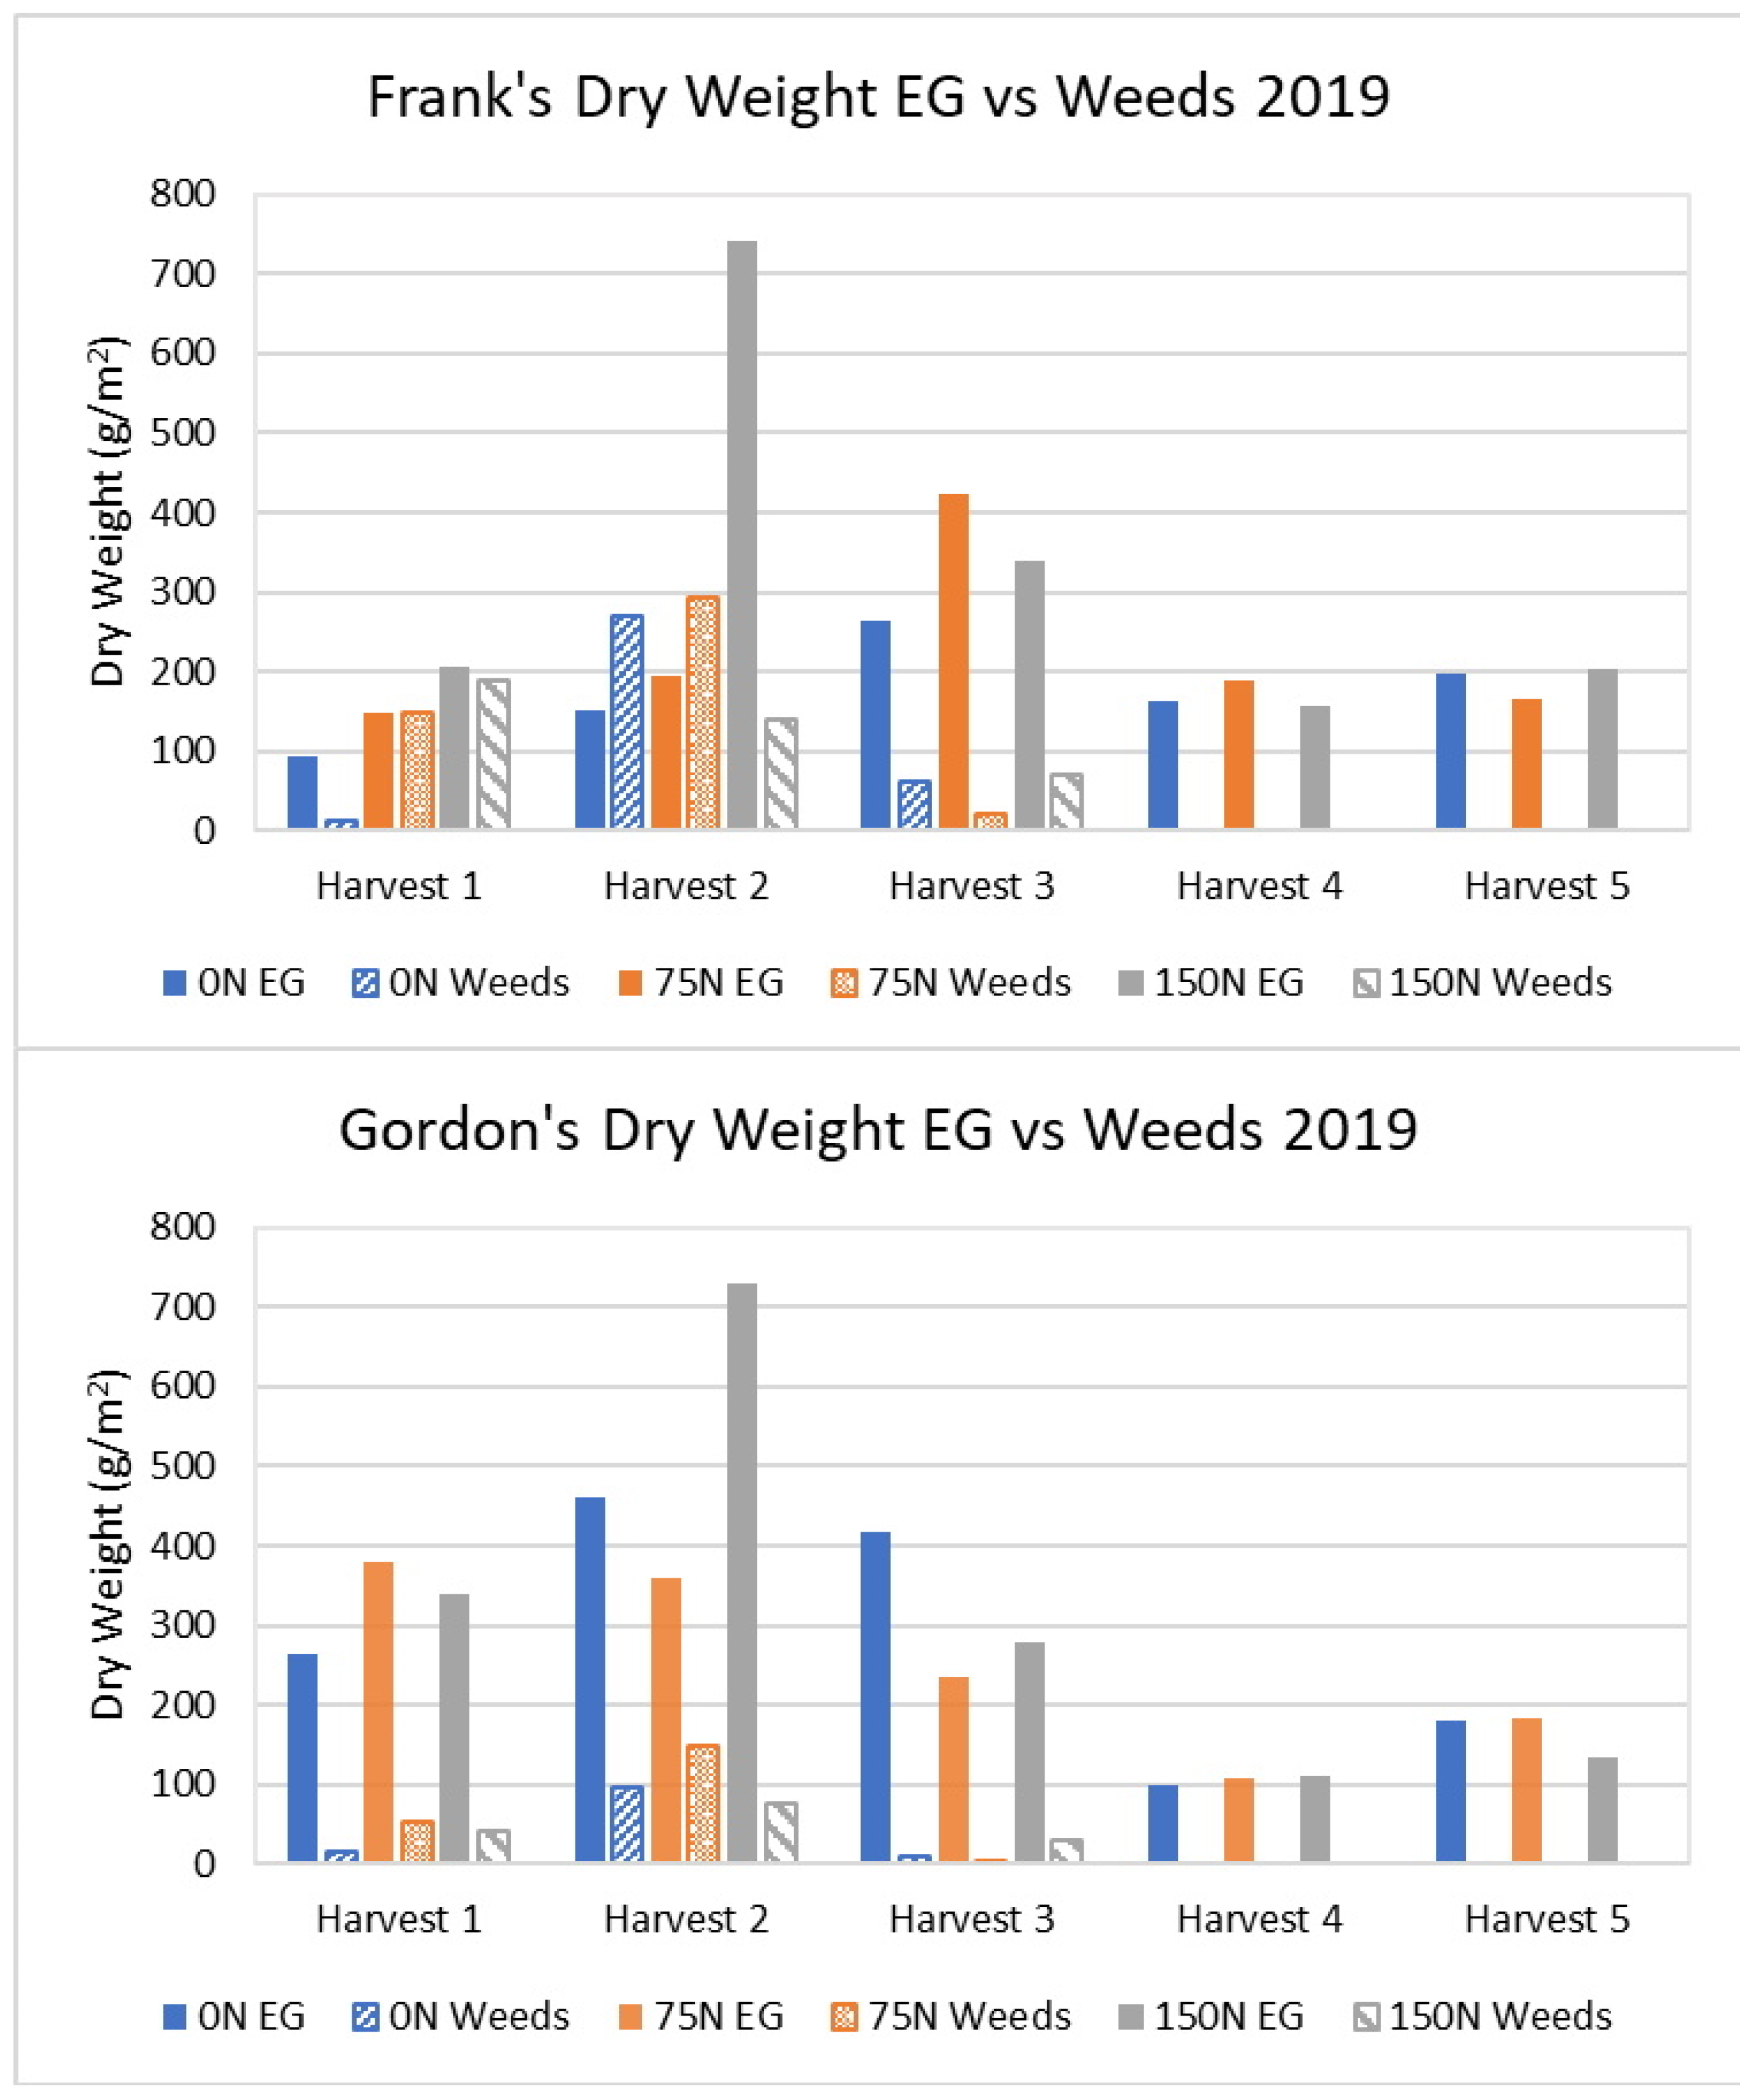
3.1.1. Long-Established Sites’ 2019 Results

The long-established sites behaved similarly in growth rates and fertilizer treatments. When combined by treatment and sites, the yields were statistically significantly different across time (p < 0.0001). The bottomland sites initially had a large increase in biomass from the 150 N application. After haying, they had a smaller response, and Gordon had lower yields in the treated plots. After the second hay cutting, the regrowth was even lower. By the fourth and fifth harvests, no treatment effects occurred (Figure 4).
The average for 0 N in the uncut upland EG sites showed over three times higher peak biomass than the average of the hayed bottomland sites. The growth curve was also more consistent as biomass increased over the entire season. The nitrogen treatments for the upland sites showed mixed results, but 150 N was always higher than 0 N (Figure 5).
The plant nitrogen content for the long-established bottomland sites initially responded 50% more to the nitrogen treatment with 150 N than the 0 N treatment. The season average for Frank’s 150 N treatment was 32% higher than the 0 N treatment. Just as the biomass showed little treatment effects at the end of the season, the same was true of plant nitrogen content (Figure 6). Gordon’s showed no treatment effects after the second harvest.
The plant nitrogen content in the long-established upland sites declined across the season. The percent N in plants was very similar among the treatments for both upland sites (Figure 7).
The spring of 2019 had a high influx of weeds, which seemed to be exacerbated by the addition of fertilizer. This non-significant effect indicated that when all sites and harvests were combined by treatment, weed yields were higher as N treatments increased (0 N = 88.3 g/m2; 75 N = 128.5 g/m2; 150 N = 146.5 g/m2; p > 0.10).
The average bottomland weed yields increased with the addition of N (0 N = 41.9 g/m2; 75 N = 66.4 g/m2; 150 N = 54.5 g/m2). By the end of the season, most of the weeds were gone after all treatments in the bottomland sites (Figure 8). Weed yield in the bottomland sites was statistically different across time (p < 0.0001). The effects of hay cutting and weed increase were factors that contributed to the decision to split fertilizer applications to after hay cutting in the 2021 bottomland sites.
Weeds in the long-established upland sites were present all season, but were only significantly different across time (p = 0.0132). At these sites that were not cut for hay, more fertilizer tended to produce more weeds on average (0 N = 149.6 g/m2; 75 N = 201.0 g/m2; 150 N = 261.4 g/m2) (Figure 9). The fertilized plots had a higher percentage of weeds present in all but the first two harvests at Ronnie’s. Those exceptions were very close to the percentages in the 150 N plots (84% vs. 83% of total biomass, and 51% vs. 40% of total biomass). However, the percentage of weeds in the total biomass of the uplands did decrease as the season progressed.

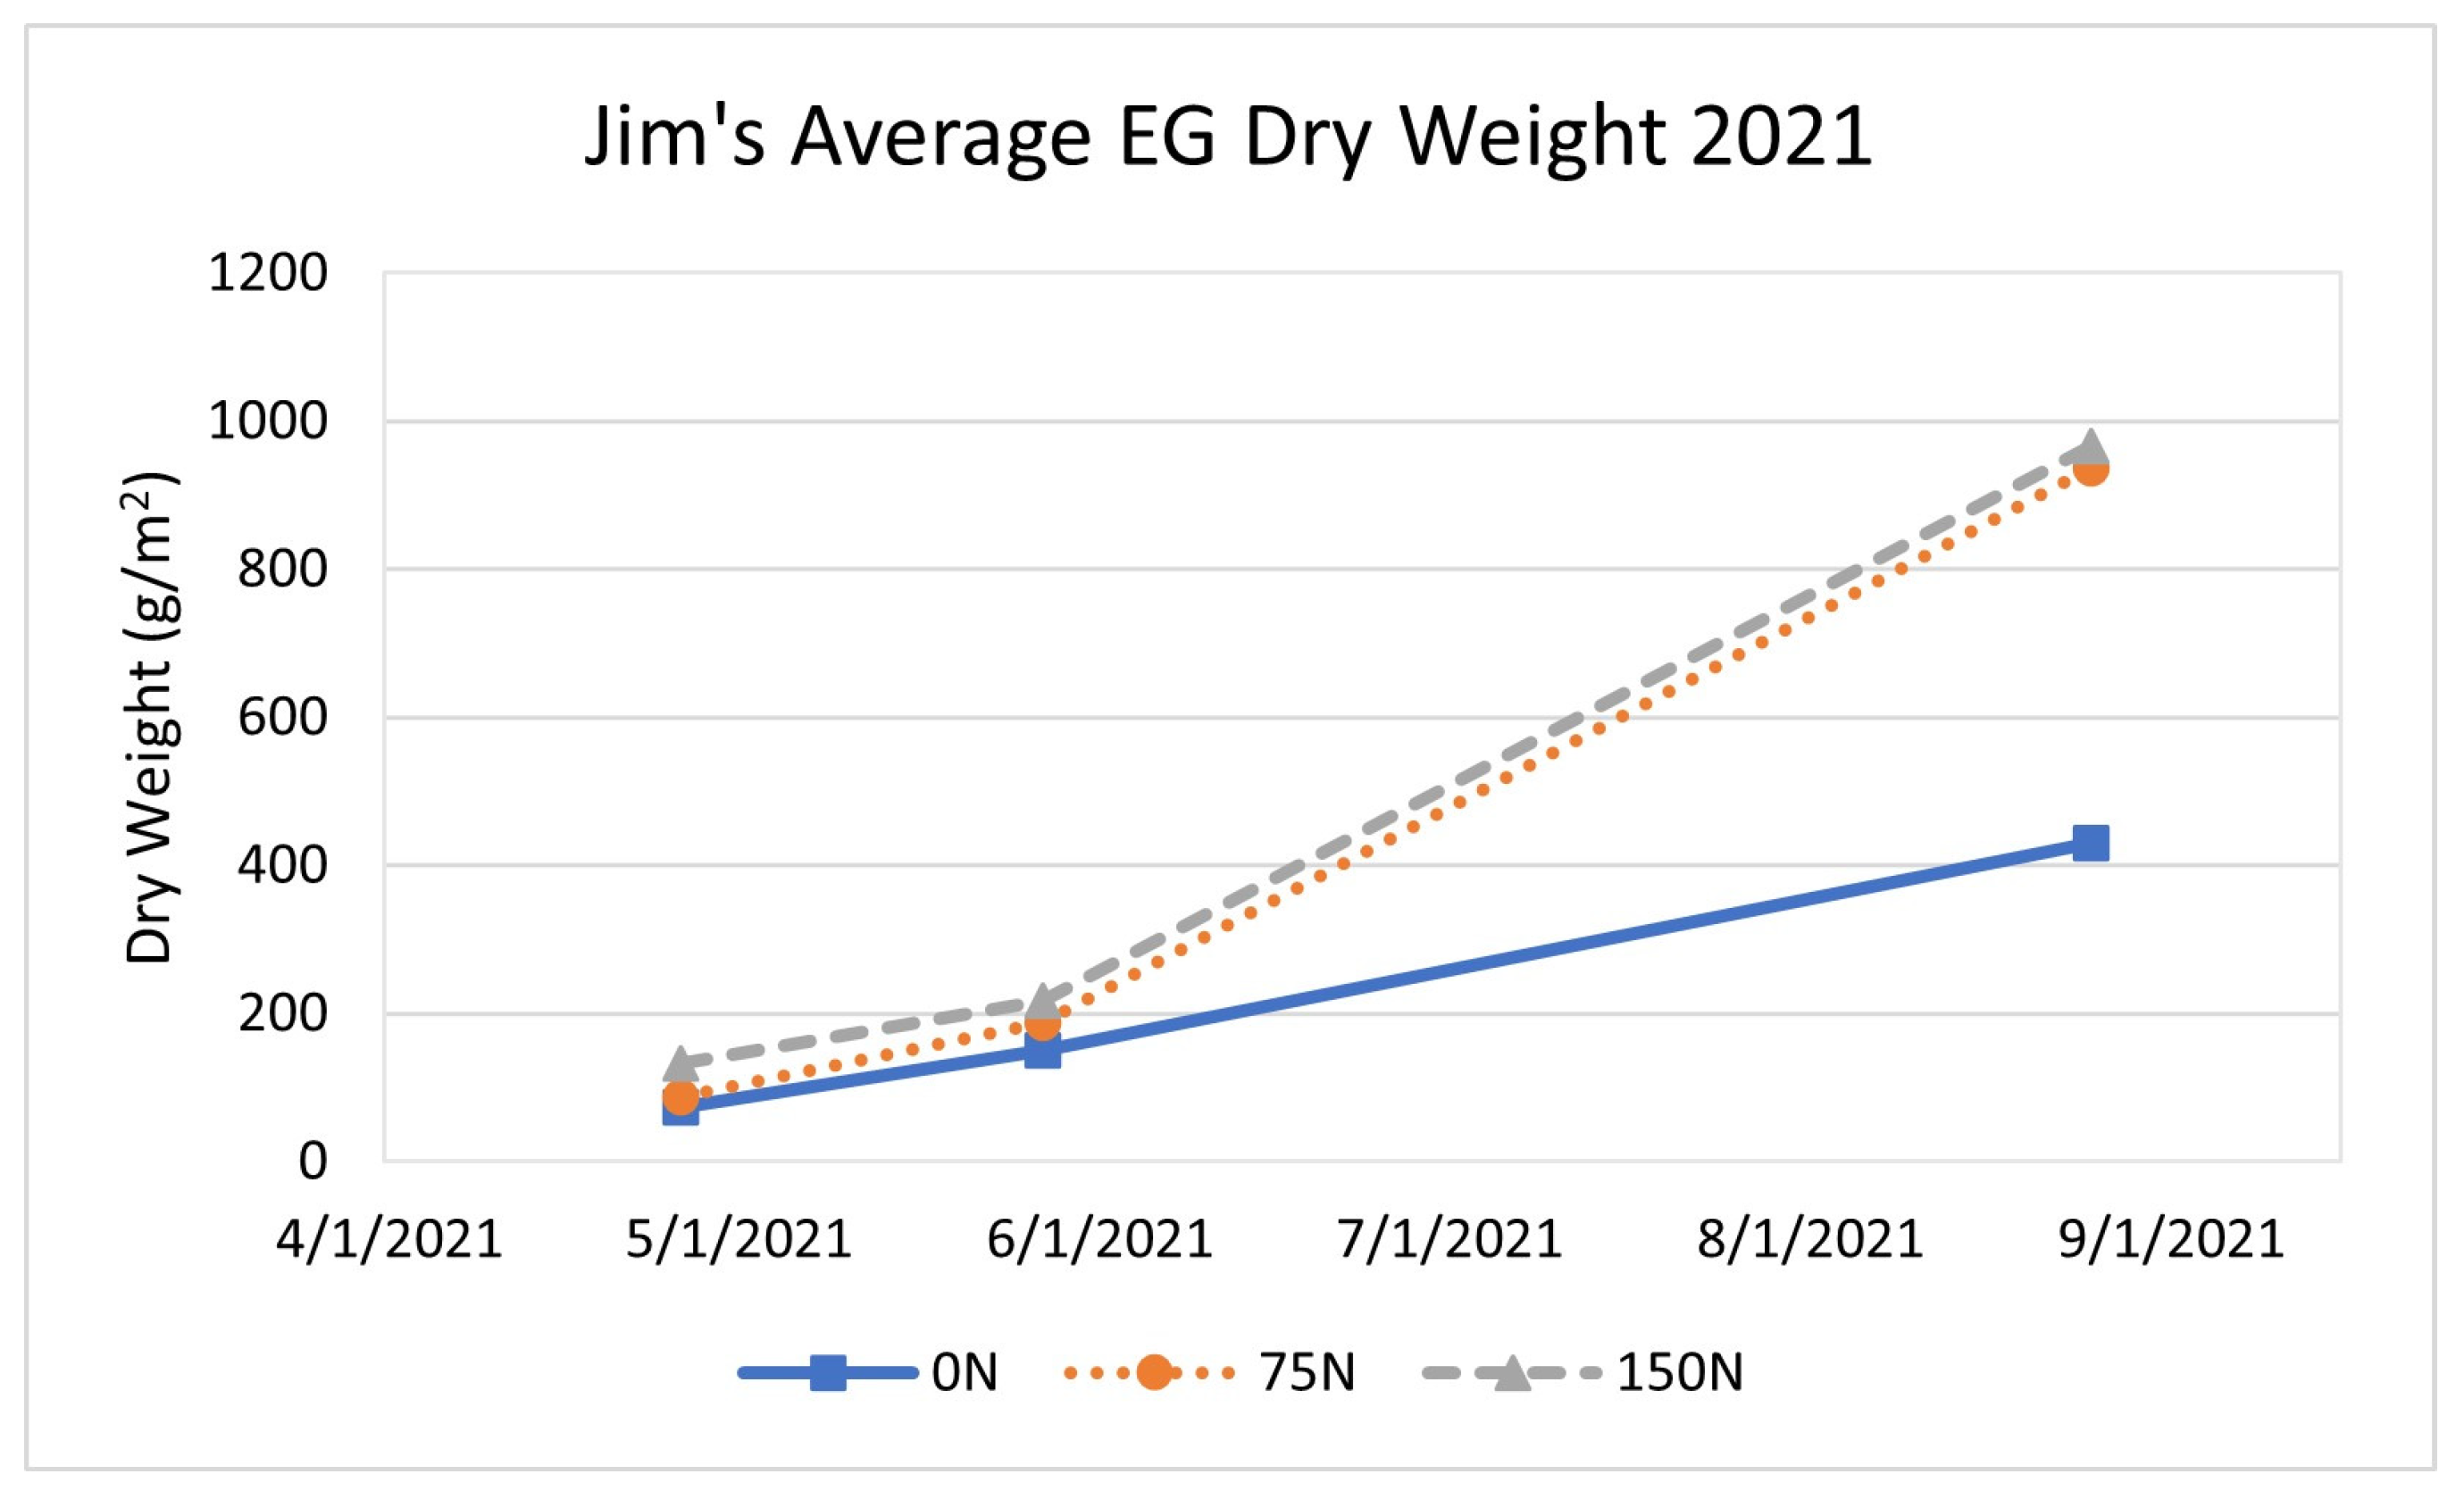
3.1.2. Long-Established Sites 2021 Results

In 2021 at Frank’s, the 150 N treatment was consistently higher than the 0 N treatment. An increase in growth for 75 N was observed after the second and third fertilizer applications at Frank’s. Gordon’s only had positive responses to both N treatments at the initial and final harvests, though some increase in growth occurred for all treatments after each of the two cuttings. For both bottomland sites, 75 N was still unpredictable with yields both above and below the control (Figure 10).
In 2021, Jim’s EG dry weights seemed to increase across the entire season with both fertilizer treatments yielding above the control (Figure 11).
The plant nitrogen concentration at Frank’s had no consistent increases in percent N due to the applied N (Figure 12). Gordon’s site had no consistent increase in plant nitrogen concentration due to the applied N until the last three harvests.
Jim’s EG N concentration steadily declined across the season (Figure 13). It also did not show consistent increased plant nitrogen concentration due to fertilizer treatment effects.
Weeds were not a factor in 2021 even though previously they had been prolific in 2019.
Soil nitrate was analyzed before and after each season and increased across the board from pretreatment, excluding Frank’s 150 N in the 2021 season (Table 4).

3.2. Ecotypes Plot

The EG ecotype responses to N additions were inconsistent throughout the three years of this study (Table 5). There were no statistical differences in peak biomass between N treatments (p > 0.10) or between years (p > 0.10). However, there were trends within ecotypes (p < 0.0001). Roaring Springs showed increases every year. Stampede showed increases in two of the three years. The other four ecotypes appeared to not benefit from added N, each with only 1 year with yield higher than the control. Averaging all years, three out of six ecotypes had increased yields with the addition of nitrogen.
Roaring Springs was the only ecotype where the yield after 150 N was higher than 0 N every year. One ecotype yielded higher with N application in 2 of the 3 years, while two ecotypes only had this effect in the first season, and two ecotypes only yielded higher with N application in the final season. Averaging dry weight across the three years, Roaring Springs’ yield was over two times greater with the application of fertilizer while the other ecotypes showed minor increases or yielded less than the control.
There were statistically significant differences in peak biomass by ecotypes (p < 0.0001; Figure 14). The broad-leaved Bryan (3x) and Jackson (4x) were significantly higher than the narrow-leaved Stampede (2x) and WNWR (2x). Bryan (3x) also had significantly higher peak biomass than Bellville (2x). Roaring Springs was not significantly different from any ecotype, possibly because it had intermediate morphology, and is polyploid like the large Bryan and Jackson.
Most ecotypes seemed to have had higher plant nitrogen concentrations in the 150 N than the 0 N treatment. In 2021, the 0 N dry weight for Jackson and WNWR was greater than the 150 N, but that trend did not carry over to the plant nitrogen concentration. Jackson’s and Bryan’s early-season 0 N was higher than 150 N, but the same was not true for the late season (Figure 15).

4. Discussion

For all four long-established sites, adding 75 N may not be worth the cost of application as this treatment was no different than the 0 N fertilizer control across years and sites, in yield, plant nitrogen content, and soil nitrate. These data show that 150 N produces significantly higher EG yields at the long-established sites when compared to the control or 75 N treatments. When comparing the long-established sites to the long-established site from Moyer and Sweeney [8], our total site average yields of 150 N peak biomass (49% in 2019 and 64% in 2021) fit within their reported findings for 200 N treatment (48% and 131%). However, a year-by-year, site-by-site, or total-season average comparison suggests that yield increases are more modest or can even decrease. It is interesting how the bottomland hayed sites lost all their weeds over time, but the upland uncut fields did not. There is not an obvious reason why our long-established sites did not see a consistent, significant increase in yield when N was applied. We speculate that 2019 increased the nutrient availability for weeds, thereby inducing increased competition with EG. However, when weeds were not a factor in 2021, and there was higher annual precipitation (Table 1), we also saw inconsistent yield increases after nitrogen applications. The 150 N application in 2019 in the bottomland showed an instant increase in yield compared to 0 N, which then declined over the season as N was used. The upland 2019 150 N application showed a slower increase across the season. In 2021, Frank’s and Jim’s 150 N treatment was consistently higher than the control, while Gordon’s was not. Also, 75 N was not significantly different than the control in 2019 or 2021. Therefore, in these long-established sites, if one is to apply fertilizer, use 150 N, though a significant yield increase is not guaranteed.
Increased yield, however, may not be substantial in all situations, and may also increase the weed amount in the yield, as we have shown in Figure 8 and Figure 9. For a good stand of EG only, no fertilizer is necessary. This is especially true in the upland where the addition of fertilizer increased the percentage of weeds. In the bottomland where EG is cut for hay several times a year, the first cutting would be less useful to sell if marketing this as a bale of pure EG. In all long-established sites, the time of year most beneficial to harvest when using 0 N would be at the end of summer (third or fourth sampling above). This is when the biomass was the greatest, and the percentage of weeds was less than 15% at the control across all four sites. In the bottomland sites, Frank’s had the highest 150 N yield benefits when combining haying with three fertilizer treatments, while Gordon’s only had yield benefits in the first two harvests regardless of whether fertilizer was applied once or split into three applications. In the upland sites, 150 N did produce an increase in yield compared with 0 N. Plant nitrogen concentrations did not benefit from the addition of fertilizer in the upland, excluding initial application, and appeared to decline over the season. In the bottomland, hay cutting increased plant percent nitrogen. Frank’s saw a fertilizer effect on plant nitrogen for most of 2019 but not in 2021 until the end of the season. Gordon’s saw a fertilizer effect on plant nitrogen in the early season of 2019, but then not again until late in the season of 2021. Soil nitrates increased after the growing season, and in general with fertilizer application.
In the EG ecotypes plot, only half of the ecotypes had a three-year average with an increase in yield relative to the control. There were no statistically significant differences in peak biomass yield between treatments. Roaring Springs showed the most consistent and greatest benefit from additional N inputs, more than doubling the dry weight of the control. However, all remaining ecotypes had more modest responses, ranging from an increase of 23% (Stampede) to a decrease of 25% (Jackson) relative to 0 N. This is less than previous papers’ reported yields for 1–6-year plots, with applications of 200 N increasing yields by 25% to more than double that of 0 N [4,5,6,7,9]. Plant nitrogen concentrations for the EG ecotypes declined over the season. The 150 N treatment resulted in the highest plant nitrogen compared with the 0 N, excluding the early-season samples from Bryan and Jackson. Again, 150 N may be applied to increase yields, but for the ecotypes tested here, this is typically not worth the growers’ expenses as there was not a significant increase in yield. Roaring Springs did see a large consistent increase, thus would benefit from N application paired with an end-of-season harvest. Every ecotype is suited for a different purpose; while some may be larger than others, note the variability in yields between the ecotypes shown in Figure 15; these morphological traits, the different leaf widths, or ploidy levels may be adaptations for the plants to better survive in their regions. More research is needed.

5. Conclusions

Excluding the one large harvest from Frank’s in 2019 (see Table 3), the average EG peak yield response to the 150 N treatment was 37% greater than that to 0 N overall; the long-established sites increased by 57%, with the bottomlands increasing by 45%, the uplands by 69%, and the ecotypes plot increasing by 17%. However, the ecotypes did not all perform well, with three of the six averaging 150 N yields below those of the control, one of the six ecotypes decreasing yield in 1 of the 3 sample years, and four ecotypes underperforming in 2 of the 3 sample years. Application of 150 N was not statistically different than 0 N for the ecotypes. The long-established sites did not consistently yield higher throughout the season, so timing harvest for peak yield and decreased weeds is important. The 75 N treatment averaged only a 15% increase with three of four long-established sites below the dry weight of the control for year 1, and only Jim’s upland site greater than the control in the final year. Overall, fertilizing with 75 N is not advised as it is not statistically different than 0 N; while 150 N may produce increased yield, the reasons for the variations in results are still unknown. Now, growers of eastern gamagrass can consider these factors when making decisions regarding the use of fertilizer, as it may not provide the desired results in all situations.

Author Contributions

Conceptualization, J.R.K.; formal analysis, A.S.W., S.K. and M.C.S.; data curation, A.S.W., J.J. and S.K.; writing—original draft preparation, J.R.K.; writing—review and editing, A.S.W., J.J., J.R.K. and M.C.S.; project administration, J.R.K. All authors have read and agreed to the published version of the manuscript.

Funding

This work was supported in part by an appointment to the Agricultural Research Service administrated by Oak Ridge Institute for Science and Education through interagency agreement between the U.S. Department of Energy and U.S. Department of Agriculture, Agricultural Research Service Agreement #60-3098-5-002.

Data Availability Statement

The original contributions presented in the study are included in the article.

Acknowledgments

The authors would like to thank the efforts of Rick Greeson, Tyson Marwitz, and Louise Reisner for assisting with collecting plants, the establishment of the field experiments, and collecting data. Special thanks to the landowners, Gordon Goebel, Jim R. Kiniry, J. Frank Monk, and Ronnie Scala, for allowing access and insight about their stands of EG. This work was supported in part by the U.S. Department of Agriculture, Agricultural Research Service. Mention of trade names or commercial products in this publication is solely for the purpose of providing specific information and does not imply recommendation or endorsement by the U.S. Department of Agriculture. USDA is an equal opportunity provider and employer.

Conflicts of Interest

The authors declare no conflicts of interest.

References

  1. Cooney, D.R.; Namoi, N.; Zumpf, C.; Lim, S.-H.; Villamil, M.; Mitchell, R.; Lee, D.K. Biomass Production and Nutrient Removal by Perennial Energy Grasses Produced on a Wet Marginal Land. BioEnergy Res. 2023, 16, 886–897. [Google Scholar] [CrossRef]
  2. Sainju, U.M.; Allen, B.L. Carbon footprint of perennial bioenergy crop production receiving various nitrogen fertilization rates. Sci. Total Environ. 2023, 861, 160663. [Google Scholar] [CrossRef] [PubMed]
  3. Waramit, N.; Moore, K.J.; Heggenstaller, A.H. Composition of Native Warm-Season Grasses for Bioenergy Production in Response to Nitrogen Fertilization Rate and Harvest Date. Agron. J. 2011, 103, 655–662. [Google Scholar] [CrossRef]
  4. Brejda, J.J.; Brown, J.R.; Lorenz, T.E.; Henry, J.; Reid, J.L.; Lowry, S.R. Eastern Gamagrass Responses to Different Harvest Intervals and Nitrogen Rates in Northern Missouri. J. Prod. Agric. 1996, 9, 130–135. [Google Scholar] [CrossRef]
  5. Douglas, J.L. Effects of Clipping Frequency and N Rates on Yield and Quality of Eastern Gamagrass; Stephen, F., Ed.; Austin State University: Nacogdoches, TX, USA, 1993. [Google Scholar]
  6. Brakie, M. Yield and Quality of Eastern Gamagrass Selections as Affected by Clipping Interval and Nitrogen Rates; Stephen, F., Ed.; Austin State University ProQuest Dissertations Publishing: Nacogdoches, TX, USA, 1998. [Google Scholar]
  7. Heggenstaller, A.H.; Moore, K.J.; Liebman, M.; Anex, R.P. Nitrogen Influences Biomass and Nutrient Partitioning by Perennial, Warm-Season Grasses. Agron. J. 2009, 101, 1363–1371. [Google Scholar] [CrossRef]
  8. Moyer, J.L.; Sweeney, D.W. Responses of eastern gamagrass [Tripsacum dactyloides (L.) L.] forage quality to nitrogen application and harvest system. J. Plant Nutr. 2014, 39, 17–26. [Google Scholar] [CrossRef]
  9. Coblentz, W.K. Post-Harvest Physiology. In Forages: The Science of Grassland Agriculture; John Wiley & Sons, Inc.: Hoboken, NJ, USA, 2020; pp. 721–747. [Google Scholar]
  10. Brejda, J.J.; Kremer, R.J.; Brown, J.R. Indications of associative nitrogen fixation in eastern gamagrass. Rangel. Ecol. Manag. J. Range Manag. Arch. 1994, 47, 192–195. [Google Scholar] [CrossRef]
  11. Gillen, R. Production and grazing management for eastern gamagrass. In Proceedings of the 56th Southern Pasture and Forage Crop Improvement Conference, Springdale, AR, USA, 21–22 April 2001. [Google Scholar]
  12. Swinson, P.J. Establishment of Eastern Gamagrass into a Cool Season Grazing System in Texas Blackland Prairie Soils. In Ag Science and Natural Resources; Texas A&M University-Commerce: Commerce, TX, USA, 2021. [Google Scholar]
  13. Ahring, R.M.; Frank, H. Establishment of eastern gamagrass from seed and vegetative propagation. J. Range Manag. 1968, 21, 27. [Google Scholar] [CrossRef]
  14. Springer, T.L.; Dewald, C.L. Eastern gamagrass and other Tripsacum species. In Warm-Season (C4) Grasses; Moser, L.E., Burson, B.L., Sollenberger, L.E., Eds.; American Society of Agronomy, Inc.: Madison, WI, USA; Crop Science Society of America, Inc.: Madison, WI, USA; Soil Science Society of America, Inc.: Madison, WI, USA, 2004. [Google Scholar]
  15. Gillen, R.L.; Berg, W.A.; Dewald, C.L.; Sims, P.L. Sequence grazing systems on the southern plains. J. Range Manag. 1999, 52, 583. [Google Scholar] [CrossRef]
  16. Keyser, P.D.; Lituma, C.M.; Bates, G.E.; Holcomb, E.D.; Waller, J.C.; Griffith, A.P. Evaluation of eastern gamagrass and a sorghum × sudangrass for summer pasture. Agron. J. 2020, 112, 1702–1712. [Google Scholar] [CrossRef]
  17. Burton, G.W.; Southwell, B.L.; Johnson, J.C., Jr. The Palatability of Coastal Bermudagrass (Cynodon dactylon (L.) Pers.) as Influenced by Nitrogen Level and Age. Agron. J. 1956, 48, 360–362. [Google Scholar] [CrossRef]
  18. Haney, R.L.; Haney, E.B.; Smith, D.R.; Harmel, R.D.; White, M.J. The soil health tool—Theory and initial broad-scale application. Appl. Soil Ecol. 2018, 125, 162–168. [Google Scholar] [CrossRef]
  19. Kiniry, J.R.; Williams, A.S.; Jacot, J.; Shadow, A.; Brakie, M.; Burson, B.; Jessup, R.; Cordsiemon, R.; Kim, S.; Avila, A.; et al. Diverse eastern gamagrass ecotypes: General characteristics, ploidy levels, and biogeography. Crop. Sci. 2023, 63, 3545–3556. [Google Scholar] [CrossRef]
Figure 1. Treatment plots at Gordon’s site within the largest known natural stand of EG; 11 September 2019; Bellville, TX.
Agronomy 14 00907 g001
Figure 2. Mean comparisons of peak biomass (g/m2) by nitrogen treatments at long-established sites (n = 63). Letters indicate statistically significant differences.
Agronomy 14 00907 g002
Figure 3. Mean comparisons of peak biomass (g/m2) by long-established sites (n = 63). Letters indicate statistically significant differences.
Agronomy 14 00907 g003
Figure 4. EG dry weights from long-established bottomland sites with hay cutting in 2019.
Agronomy 14 00907 g004
Figure 5. EG dry weights from long-established upland sites that were not cut for hay in 2019.
Agronomy 14 00907 g005
Figure 6. Plant nitrogen content from long-established bottomland sites with hay cutting in 2019.
Agronomy 14 00907 g006
Figure 7. Plant nitrogen content from long-established upland sites that were not cut for hay in 2019.
Agronomy 14 00907 g007
Figure 8. EG and weed dry weights at the long-established bottomland sites in 2019.
Agronomy 14 00907 g008
Figure 9. EG and weed dry weights at the long-established upland sites in 2019.
Agronomy 14 00907 g009
Figure 10. EG dry weights from long-established bottomland sites with hay cutting in 2021. One fertilizer treatment was applied before the season; the other two shown in the season were in conjunction with haying. Hay cutting immediately preceded the fertilization dates.
Agronomy 14 00907 g010
Figure 11. EG dry weights from long-established upland sites that were not cut for hay in 2021.
Agronomy 14 00907 g011
Figure 12. Plant nitrogen content from long-established bottomland sites with hay cutting in 2021. Hay cutting immediately preceded the fertilization dates.
Agronomy 14 00907 g012
Figure 13. Plant nitrogen content from long-established upland sites that were not cut for hay in 2021.
Agronomy 14 00907 g013
Figure 14. Mean comparisons of peak biomass (g/m2) by ecotype (n = 94). Letters indicate statistically significant differences.
Agronomy 14 00907 g014
Figure 15. EG ecotypes plant nitrogen concentrations in early and late seasons in 2021.
Agronomy 14 00907 g015
Table 1. EG site descriptions where N treatments were applied. Precipitation is in mm.
SiteLatitude, LongitudeSoil NameSoil DescriptionAnnual Precipitation
201920202021
Frank29.905733, −96.252083Trinity clayVery-fine, smectitic, thermic Typic Hapluderts8078651144
Gordon29.898967, −96.236583
Jim31.239535, −97.371378Heiden clayFine, smectitic, thermic Udic Haplusterts612796707
Ronnie31.027004, −97.245005Heiden–Ferris complex
Temple31.045327, −97.345555Houston Black clay
Table 2. Description of EG ecotypes from the Temple, Texas, collection.
EcotypeOrigin CoordinatesClosest CityCountyStatePloidy
Bellville29.910744, −96.250814BellvilleAustinTX2x
Bryan30.743083, −96.497133BryanRobertsonTX3x
Jackson28.90000, −96.53000EdnaJacksonTX4x
Roaring Springs33.85768, −100.85152Roaring SpringsMotleyTX4x
Stampede31.28295, −97.44733StampedeBellTX2x
WNWR34.74290, −98.62850MeersComancheOK2x
Table 3. Long-established sites’ EG peak harvest date dry weights relative to 0 N.
0 N75 N150 N
2019g/m2g/m2% of 0 Ng/m2% of 0 N
Frank151194128742490
Gordon46036078730159
Jim41327767604146
Ronnie57248084819143
Average 89 149 *
2021
Frank20019698279142
Gordon188188100250133
Jim431937224966218
Average 141 164
* The 2019 average of 150 N relative to 0 N did not include the 490% value.
Table 4. Soil nitrate (NO3-N) for long-established locations in kg/ha.
2019201920212022First Year
Initial SoilEnd of SeasonPretreatmentSpringNO3-N Increase
Frank
0 N0.424.072.035.293.65
75 N2.547.184.64-4.63
150 N1.544.242.771.462.70
Average1.505.163.143.383.66
Gordon
0 N4.3812.280.821.117.90
75 N7.9213.471.26-5.56
150 N2.9116.231.571.1213.31
Average5.0713.991.221.118.92
Jim
0 N2.306.941.71-4.63
75 N1.147.082.22-5.94
150 N0.756.472.15-5.72
Average1.406.832.03-5.43
Ronnie
0 N0.793.17--2.38
75 N0.472.07--1.60
150 N0.723.78--3.06
Average0.663.01--2.35
All Sites
0 N1.986.621.523.204.64
75 N3.027.452.70-4.43
150 N1.487.682.161.296.20
Average2.167.252.132.245.09
Table 5. EG ecotype average yearly dry weight (g/m2) by nitrogen treatment.
202020212022Average
Dry Wt150 N/0 NDry Wt150 N/0 NDry Wt150 N/0 NDry Wt150 N/0 N
Bellville 0 N 11161.019970.9119000.5812850.83
Bellville 150 N 1124 912 1104 1042
Bryan 0 N 16591.3126200.4818340.9418180.91
Bryan 150 N 2174 1257 1668 2251
Jackson 0 N 16050.3918780.7019541.1718120.75
Jackson 150 N629 1307 520 819
Roaring Springs 0 N 4923.1212711.4111812.279812.27
Roaring Springs 150 N1536 1797 1667
Stampede 0 N 4211.604121.146370.944901.23
Stampede 150 N676 470 598 581
WNWR 0 N7360.9411400.364671.827811.04
WNWR 150 N689 407 851 649
Disclaimer/Publisher’s Note: The statements, opinions and data contained in all publications are solely those of the individual author(s) and contributor(s) and not of MDPI and/or the editor(s). MDPI and/or the editor(s) disclaim responsibility for any injury to people or property resulting from any ideas, methods, instructions or products referred to in the content.

