Article

Effects of Dark Treatment on Lignin and Cellulose Synthesis in Celery

1
Institute of Horticulture, Guizhou Academy of Agricultural Sciences/Horticultural Engineering Technology Research Center of Guizhou, Guiyang 550006, China
2
Key Laboratory of Crop Gene Resources and Germplasm Innovation in Karst Mountain Area of Agriculture and Rural Ministry, Guizhou Academy of Agricultural Science, Guiyang 550006, China
3
College of Agricultural, Guizhou University, Guiyang 550025, China
4
State Key Laboratory of Crop Genetics & Germplasm Enhancement and Utilization, Ministry of Agriculture and Rural Affairs Key Laboratory of Biology and Germplasm Enhancement of Horticultural Crops in East China, College of Horticulture, Nanjing Agricultural University, Nanjing 210095, China
5
College of Horticulture, Sichuan Agricultural University, Chengdu 611130, China
*
Authors to whom correspondence should be addressed.
These authors contributed equally to this work.
Agronomy 2024, 14(5), 896; https://doi.org/10.3390/agronomy14050896
Submission received: 23 February 2024 / Revised: 22 April 2024 / Accepted: 22 April 2024 / Published: 25 April 2024
(This article belongs to the Section Horticultural and Floricultural Crops)

Abstract

:
To clarify the impact of continuous dark stress on lignin and cellulose synthesis in celery, shade-tolerant celery varieties were screened. Yellow celery variety ‘Qianhuang No.1’ and green celery variety ‘Qianlv No.1’ were separately grown in vegetable greenhouses. Dark treatments were applied using PVC shading sleeves for 4, 8, 12, and 16 d after celery had grown 10–13 true leaf blades. This study aimed to investigate the impact of varying periods of dark treatment on the morphological characteristics, lignin accumulation, and cellulose accumulation in celery. The results showed that dark treatment led to celery yellowing, a reduced stem thickness, and an increased plant height. Analysis of lignin and cellulose contents, as well as the expression of related genes, showed that dark treatment caused down-regulation of AgLAC, AgC3′H, AgCCR, AgPOD and AgCAD genes, leading to changes in lignin accumulation. Dark treatment inhibited the expression of the AgCesA6 gene, thus affecting cellulose synthesis. Under dark conditions, the expression of AgF5H and AgHCT genes had little effect on lignin content in celery, and the expression of the AgCslD3 gene had little effect on cellulose content. Analysis of morphological characteristics, lignin accumulation and cellulose accumulation after different lengths of dark treatment demonstrated that ‘Qianlv No.1’ is a shade-tolerant variety in contrast to ‘Qianhuang No.1’.

1. Introduction

Celery (Apium graveolens L.) is a perennial herbaceous plant of the Apiaceae family. It is native to the Mediterranean region and is now widely cultivated in Europe, East Asia, Sweden and other swampy regions [1]. Celery is a highly nutritious vegetable, rich in fiber, minerals and bioactive compounds such as lignin, cellulose, potassium, calcium and magnesium, as well as apigenin, phenols, coumarins and volatile oils [2]. It has numerous health benefits, including lowering blood pressure [3], reducing inflammation [4], improving digestive function and promoting cardiovascular health [5].
Lignin and cellulose are important components of dietary fiber and are naturally present in fruits and vegetables [6,7,8]. During plant growth and development, lignin deposition in the cell walls of the xylem increases their thickness and enhances the hardness and toughness of stems, providing internal mechanical support for plants to withstand abiotic and biotic stress [9,10]. Lignification is the most direct indicator of plant senescence and significantly affects the taste and quality of vegetables. Studies have shown a strong negative correlation between lignin content and edible quality, such as lignification causing peas to become hard, rough and fibrous, affecting their taste [11]. Cellulose, as an important component of insoluble dietary fiber (IDF), affects the quality and taste of vegetables depending on its content [12].
Lignin is a complex aromatic polymer and an important part of plant cell walls. It is derived from phenylalanine and its biosynthesis process can be divided into three stages: phenylalanine metabolism, monolignol synthesis, and lignin polymerization [13]. Firstly, phenylalanine is deaminated by phenylalanine ammonialyase (PAL), and then it is catalyzed by cinnamic acid 4-hydroxylase (C4H) and 4-hydroxycinnamate CoA ligase (4CL) to form coumaroyl-CoA [14]. Subsequently, coumaroyl-CoA is catalyzed by cinnamoyl CoA reductase (CCR), cinnamyl alcohol dehydrogenase (CAD), hydroxycinnamoyl-CoA:shikimate hydroxycinnamoyl transferase (HCT), coumaroyl shikimate 3′-hydroxylase (C3′H), caffeoyl CoA 3-O-methyltransferase (CCoAOMT), ferulic acid/coniferaldehyde 5-hydroxylase (F5H), caffeic acid/5-hydroxyconiferaldehyde 3/5-O-methyltransferase (COMT), laccase (LAC) and peroxidase (POD) to form three major lignin polymers: guaiacyl (G), syringyl (S) and phydroxyphenyl (H) units [14,15]. The biosynthesis of cellulose is a complex process involving the coordinated action of multiple enzymes, mainly cellulose synthase (CesA) and cellulose synthase-like (Csl) gene-encoding glycosyltransferase 2 (GT-2) enzymes, which synthesize cellulose and most hemicelluloses, respectively [16]. The Arabidopsis CesA protein family consists of 10 members, with CesA1, CesA3 and CesA6 being components of the primary cell wall cellulose synthase complex, while CesA4, CesA7 and CesA8 are involved in secondary cell wall cellulose synthesis [17]. CESA and CSLD proteins have a high sequence identity, especially in the central domain, and the catalytic domain sequence of CSLD3 can be substituted for the catalytic domain sequence of CESA6 in the primary cell wall CESA protein [18,19].
Blanching culture is a special cultivation technique to make some vegetables grow under dark or weak light conditions and form soft and yellowing organs. It is a facility cultivation method to promote chlorophyll degradation. Blanching culture affects the accumulation of nutrients and active substance biosynthesis in vegetables, thus changing the appearance of crops and improving the flavor of crops. The types of softening planting mainly include chive (Allium tuberosum Rottler ex Spreng.), water dropwort (Oenanthe javanica (Blume) DC.), garlic (Allium sativum L.), shallot (Allium cepa L.) and celery (A. graveolens L.) [20,21,22,23,24]. However, the molecular effect of blanching culture under dark conditions on lignin synthesis in celery has not been fully studied. Guizhou Province of China has a subtropical humid monsoon climate with more precipitation, an obvious rainy season, more cloudy days and less sunshine. Therefore, studying the effect of softening culture on lignin biosynthesis in celery can not only guide the application of celery etiolation cultivation, but also screen shade-tolerant celery varieties suitable for planting in Guizhou.
In this research, to investigate the metabolism of lignin and cellulose in celery during dark treatment, 12 genes involved in lignin metabolism pathways identified from the celery transcriptome database, as well as 2 genes, AgCslD3 and AgCesA6, involved in cellulose metabolism pathways, were analyzed [25]. The lignin distribution in the petiole was qualitatively assessed using histochemical methods. The lignin and cellulose contents and the expression profiles of related genes were analyzed during the dark treatment period. The results of this study will contribute to elucidating the changes in lignin and cellulose during celery cultivation and identifying shade-tolerant celery varieties.

2. Materials and Methods

2.1. Celery Material

The celery varieties ‘Qianlv No.1’ and ‘Qianhuang No.1’ were used to study the effects of dark treatment on lignin and cellulose. ‘Qianlv No.1’ and ‘Qianhuang No.1’ were planted in a plastic vegetable greenhouse at the Institute of Horticulture, Guizhou Academy of Agricultural Sciences (106.67° E, 26.51° N). The seeds were sown in plastic basins and then the seedlings were transplanted into pots containing stroma of organic soil and vermiculite (2:1; v/v) in December 2022. The experiment used celery plants with 10~13 true leaf blades as the test material. The celery seedlings with 10~13 true leaf blades were covered with an opaque, black PVC sleeve for dark treatment, and conventional cultivation in natural light served as the control treatment. The plants were subjected to the dark treatment and control treatment for 0, 4, 8, 12, and 16 d, respectively. The petioles and leaf blades of dark and control treatments in ‘Qianlv No.1’ and ‘Qianhuang No.1’ were frozen with liquid nitrogen and stored at −80 °C for subsequent experiments. Meanwhile, petioles from the dark and control treatments were fixed in a 70% FAA (formalin–glacial acetic acid with 70% ethanol; 1:1:18; v/v) fixative solution and stored at 4 °C for paraffin sectioning and fluorescence micrographs. Three biological replicates were performed for each experimental treatment material.

2.2. Determination of Lignin and Cellulose Content

The lignin and cellulose contents of celery samples were determined by using lignin and cellulose content assay kits and ultraviolet spectrophotometry (Beijing Solarbio Science & Technology Co., Ltd., Beijing, China). Lignin and cellulose were extracted and detected by the method described in the kit’s instructions. The phenolic hydroxyl groups in lignin have a characteristic absorption peak at 280 nm after acetylation, and the light absorption value at 280 nm is positively correlated with the lignin content. The content of cellulose was determined using an anthrone chromogenic agent under strong acidic conditions.
Therefore, wavelengths of 280 nm and 620 nm were, respectively, used for the lignin and cellulose content measurements via T-UV1810S spectrophotometry (Shanghai Yoke Instruments Meters Co., Ltd., Shanghai, China). Glacial acetic acid and distilled water were, respectively, used as blank controls to detect the absorbance to determine the content of lignin and cellulose.

2.3. Preparation and Histochemical Staining of Paraffin Sections

The transverse sections of the stem were used for safranin o-fast green staining and microscopy experiments. The petioles from the dark and control treatments were fixed with FAA fixative solution for 24 h and dehydrated with different ethanol gradients. The petioles were processed for paraffin embedding and sectioning. The samples were cut into 4 µm × 4 µm slices using a paraffin microtome. Paraffin slides were successively put into two portions of environmentally friendly dewaxing transparent liquid for 20 min, two portions of pure ethanol for 5 min, and 75% ethanol for 5 min, and the slides were then kept in tap water. The sections were stained with safranin O staining solution for 2 h, then rinsed with tap water to remove excess dye. The slices were placed into 50%, 70%, 80% gradient alcohol for decolorization for 3~8 s each. The slices were stained with the plant solid green dye solution for 6~20 s and dehydrated with anhydrous ethanol in three times. Finally, the sections placed put into three cylinders of xylene for 5 min before they were observed under a microscope; images were taken and then analyzed. The cytoderm which had lignified appeared red and the color of cellulose cell wall was green.

2.4. Total RNA Isolation and Real-Time Fluorescence Quantitative PCR Analysis

The relative expression of related genes was detected via qRT-PCR. Total RNA was extracted from petioles and leaf blades with Trizol reagent and treated with DNase I (Vazyme Biotech Co., Ltd., Nanjing, China). RNA quality was detected using agarose gel electrophoresis. RNA quality and purity were assessed using the OD260/280 ratio which was determined via a Nanodrop 2000 spectrophotometer (Implen GmbH, München, German). cDNA was synthesized using the HiScript III RT SuperMix for qPCR (+gDNA wiper) (Vazyme Biotech Co., Ltd., Nanjing, China).
According to the metabolic pathways of lignin and cellulose syntheses, 12 lignin-related (AgPAL, AgC4H, Ag4CL, AgHCT, AgC3′H, AgCCoAOMT, AgCCR, AgCAD, AgF5H, AgCOMT, AgLAC and AgPOD) and 2 cellulose-related (AgCesA6 and AgCslD3) genes were obtained from the celery transcriptome database (Supplementary Materials). Primers were designed using Premier 6.0 software (Table 1). qRT-PCR was performed with Premix Ex Taq (TaKaRa, Dalian, China) using the Bio-Rad IQ5 real-time PCR system (Bio-Rad, Hercules, CA, USA). The AgActin gene was used as an internal standard. All qRT-PCR reactions were subjected to three biological repeats and three technical repeats. The relative expression level was calculated by using the 2−ΔΔCt analysis method.

2.5. Statistical Analysis

SPSS software (IBM SPSS Statistics for Windows, version 26.0) was used to conduct one-way ANOVAs at the 0.05 level for all data with significant differences.

3. Results

3.1. Morphological Characteristics of Celery during Dark Treatment and Conventional Cultivation

The petioles and leaf blades of celery, compared with those from conventional cultivation, had different characteristics after different dark treatment (Figure 1). Before dark treatment, celery grew well; the leaf blades and petioles of ‘Qianhuang No.1’ were light yellow, and the leaf blades and petioles of ‘Qianlv No.1’ were dark green (Figure 1(A1–A4)). After 4 d of dark treatment, the apparent change of plants was not obvious; the yellow color of old and new leaf blades of ‘Qianhuang No.1’ slightly deepened, and the petiole growth of ‘Qianlv No.1’ accelerated (Figure 1(B1–B4)). After 8 d of dark treatment, the yellow color of ‘Qianhuang No.1’ plants had obviously deepened, and the change in new leaf blades was the most obvious (Figure 1(C1,C2)). The ‘Qianlv No.1’ plant grew faster and began to turn yellow (Figure 1(C3,C4)). After 12 d of dark treatment, the merchantability of the plants gradually deteriorated; the new petioles of the ‘Qianhuang No.1’ plant had extended, the new leaf blades curled into deep yellow, and the plants were obviously overgrown (Figure 1(D1,D2)). The new leaf blades of the ‘Qianlv No.1’ plant clearly turned yellow (Figure 1(D3,D4)). After 16 d of dark treatment, the commercial properties of the plants were completely lost; the old leaf blades of ‘Qianhuang No.1’ were obviously yellow, the new petioles had turned white, and the plants were weak (Figure 1(E1,E2)). The new petioles of ‘Qianlv No.1’ plants were white, the leaf blades were curled and drooping, and the plants were obviously overgrown and weak (Figure 1(E3,E4)).

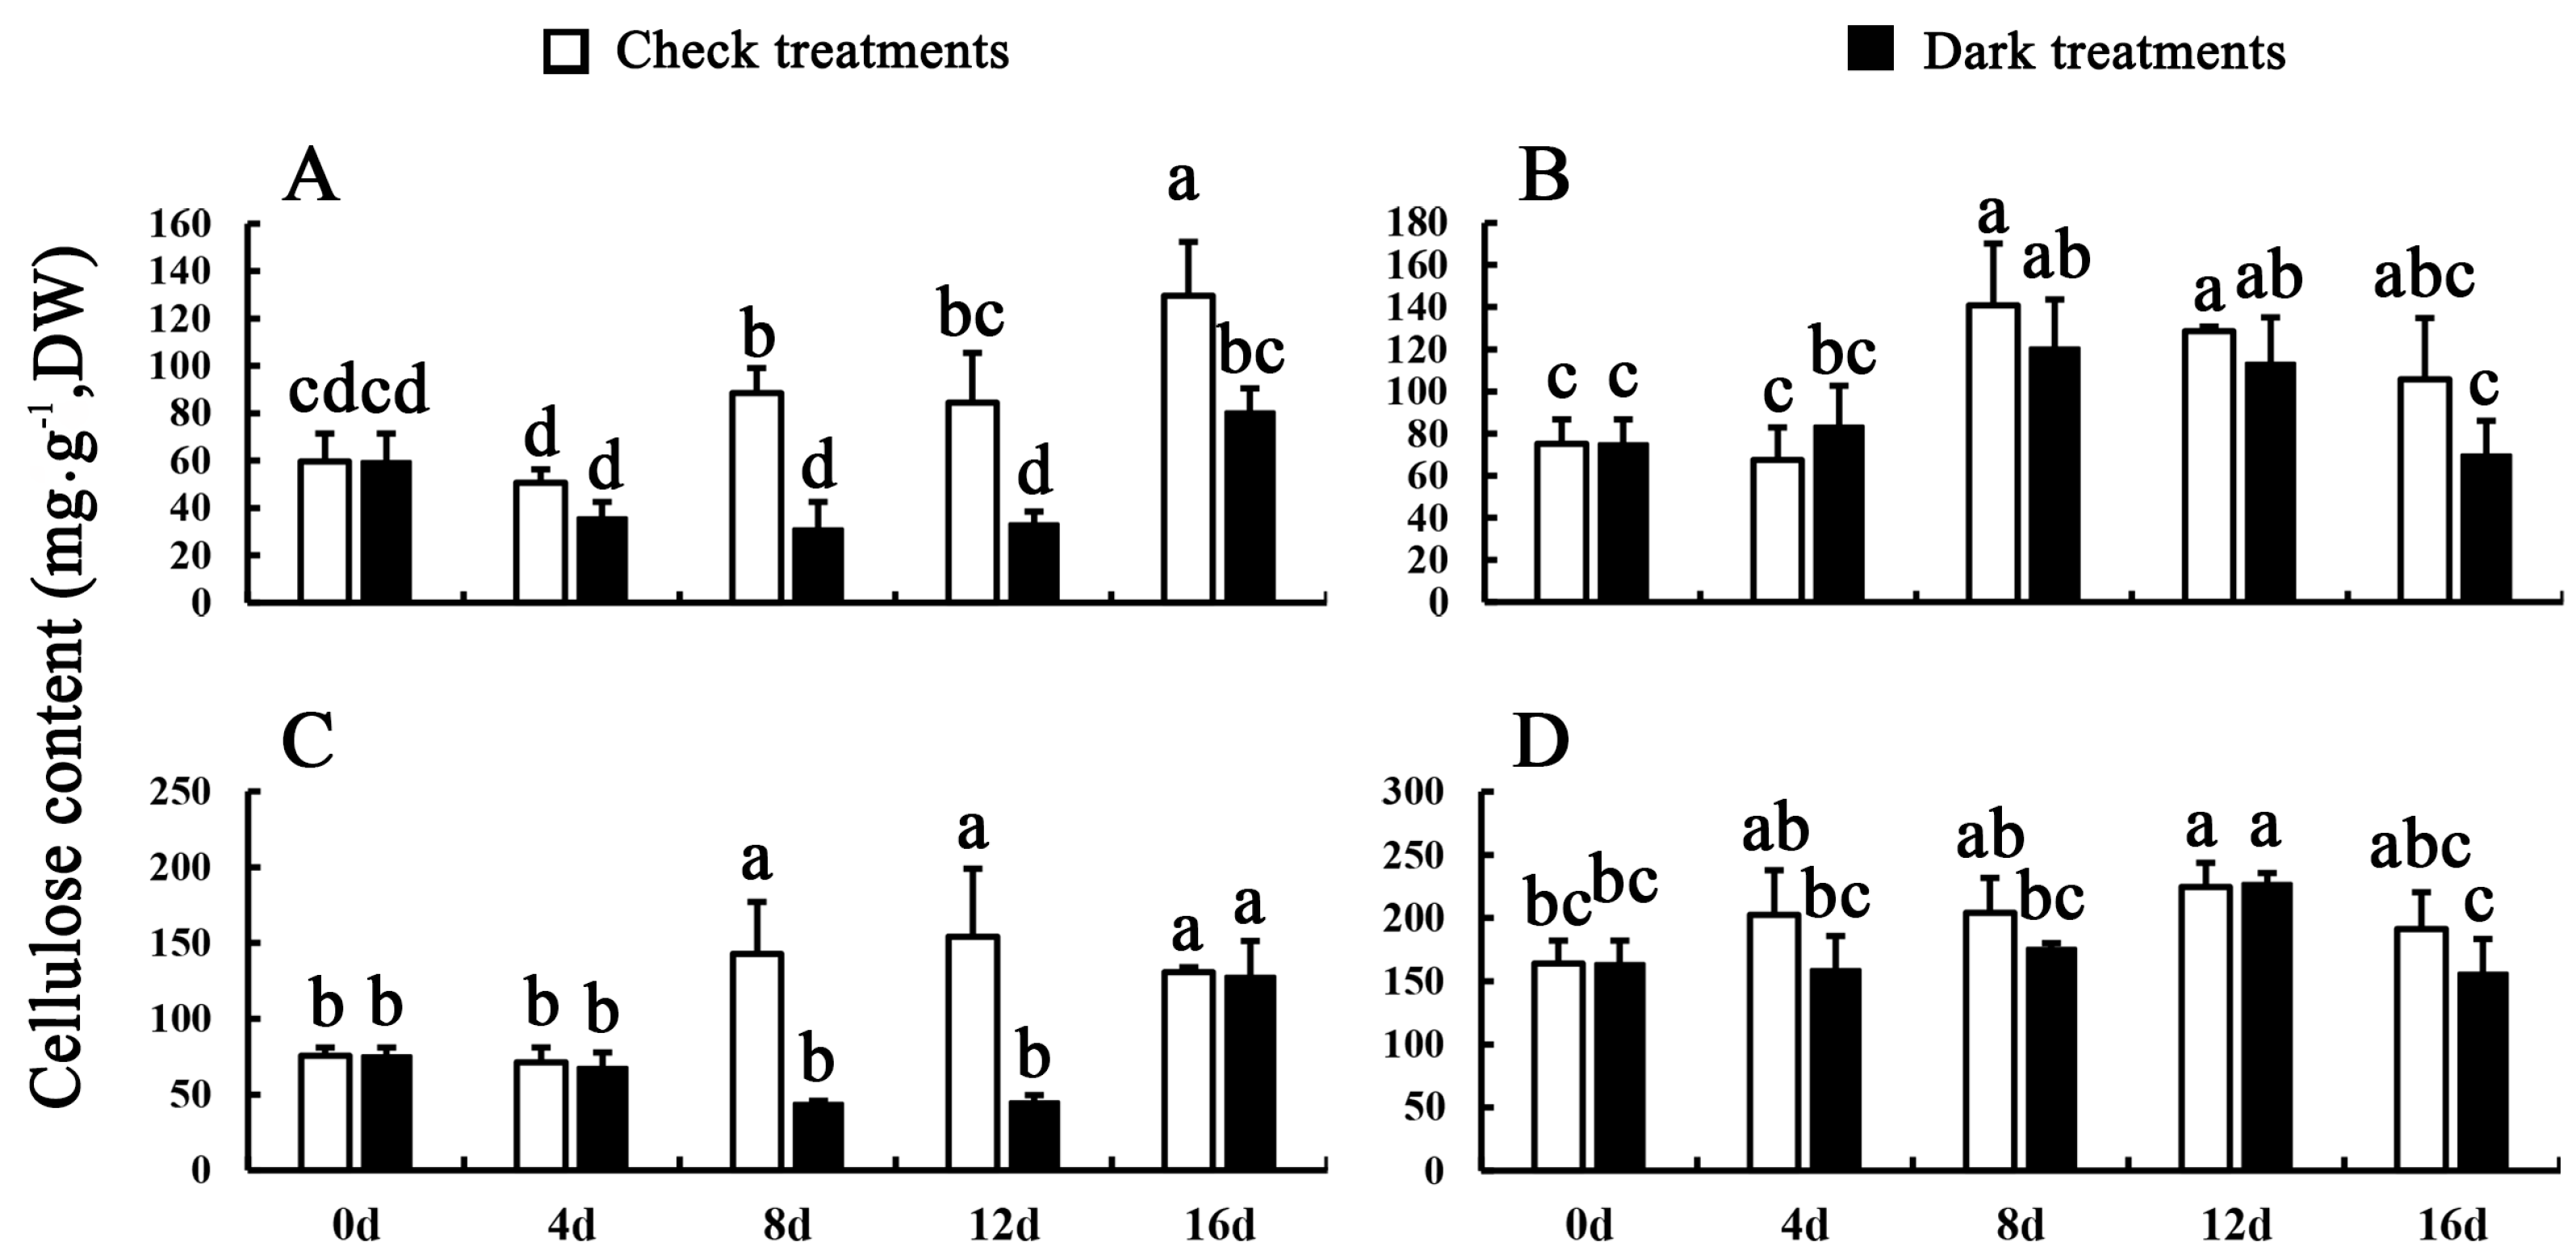
3.2. Lignin and Cellulose Contents of Celery during Dark Treatments and Control Conditions

The effects of different stages of dark treatments on lignin contents were compared. During the control period, the lignin content in the leaf blades of ‘Qianhuang No.1’ showed a significant increase followed by a decrease, reaching the highest level after 8 d. The lignin content in the leaf blades of ‘Qianlv No.1’ did not decrease significantly. During the dark treatment period, the lignin content in the leaf blades of ‘Qianhuang No.1’ slightly increased at first and then gradually decreased, while the lignin content in the leaf blades of ‘Qianlv No.1’ did not decrease significantly. During the treatment, the lignin content in the petioles of ‘Qianhuang No.1’ in the experimental group and the control group showed a trend of increasing significantly first and then decreasing sharply. The lignin content in the petioles of ‘Qianlv No.1’ in the control group increased significantly at first, then decreased and increased again, while the lignin content in the dark treatment group decreased significantly after 4 d and then remained relatively stable. Overall, the lignin content in the dark treatment group was lower than that in the control group, and the lignin content in the leaf blades during the dark treatment stage did not decrease significantly but was maintained at a relatively constant level (Figure 2).
The cellulose content of control and dark treatment plants at different periods were compared. During the control period, the cellulose content in the leaf blades of ‘Qianhuang No.1’ gradually increased significantly, while the cellulose content in the leaf blades of ‘Qianlv No.1’ first increased significantly and then slowly decreased. During the dark treatment period, the cellulose content in the leaf blades of ‘Qianhuang No.1’ decreased steadily after a stable period and then increased significantly, while the cellulose content in the leaf blades of ‘Qianlv No.1’ increased first and then decreased. Under dark treatment, the cellulose content in the petiole of ‘Qianhuang No.1’ decreased first and then increased significantly. The cellulose content in the petioles of ‘Qianlv No.1’ showed a non-significant increase first and then decrease, while the cellulose content in the dark treatment group increased significantly after 8 d and then decreased significantly. Overall, after 4 d of treatment, the cellulose content in the dark treatment group was lower than that in the control group, and the dark treatment of ‘Qianhuang No.1’ showed a significantly lower cellulose content than the control group (Figure 3).

3.3. Histochemical Analysis of Lignin Distribution in Celery Petioles

The present study utilized safranin staining solution to identify the distribution of lignin in celery petioles. The results showed that lignin was mainly distributed in the xylem, and the color of cell walls changed over the treatment time in both the treatment and control groups (Figure 4). The color of the cell walls in the treatment group changed from purple-aubergine to light red to no red, while the color in the control group remained purple-aubergine and gradually became lighter red. In addition, the number of xylem cells increased and their arrangement became tighter during the treatment process. After 8 d of treatment, the depth of red color in cell walls was different between the treatment and control groups (Figure 4(A-III–D-III)), and after 16 d, the cell wall of the celery petioles in the control group was light red, while there was no red color in the cell walls of the treatment group (Figure 4(A-V–D-V)). These results suggest that the lignin in celery petioles was mainly concentrated in xylem, and the treatment time has a certain impact on the distribution of lignin.

3.4. Expression Profiles of Lignin and Cellulose Metabolism-Related Genes in Celery during Dark Treatment and Control Conditions

To further validate the relationship between the expression of genes involved in lignin and cellulose synthesis after dark treatment, we identified the lignin synthesis genes AgF5H, AgC4H, AgHCT, Ag4CL, AgCCR, AgPAL, AgPOD, AgCAD, AgCCoAOMT, AgC3′H, AgCOMT and AgLAC, as well as the cellulose synthesis genes AgCesA6 and AgCslD3 from the celery database.
For the leaf blades of celery variety ‘Qianhuang No.1’, the expression of the lignin synthesis genes AgPAL, AgC4H, Ag4CL, AgCCoAOMT, AgCAD and AgF5H showed an initial increase followed by a decrease, while the expression of AgHCT and AgCCR gradually increased. The expression of AgPOD and AgCOMT decreased gradually. The expression of the AgLAC gene showed no significant change under dark treatment, but increased gradually under control conditions. The expression of the AgC3′H gene increased gradually under dark treatment, while it initially increased and then decreased under control conditions. Compared to the control, the expression levels of AgC3′H and AgCOMT genes were significantly lower under dark treatment, while AgF5H and AgHCT expression was significantly higher than the control. The expression of the cellulose synthesis genes AgCesA6 and AgCslD3 increased gradually, with AgCslD3 showing a more pronounced trend. The expression levels of AgC4H, Ag4CL, AgPAL, AgCAD, AgCCoAOMT and AgCOMT genes were highest after 12 d of treatment (Figure 5).
For the leaf blades of celery variety ‘Qianlv No.1’, the expression of the lignin synthesis genes AgPAL, AgC4H, Ag4CL, AgHCT, AgCCR and AgF5H showed an initial increase followed by a decrease, while the expression of AgCAD, AgCCoAOMT and AgCCR gradually increased, and AgPOD expression gradually decreased. The expression of the AgC3′H gene showed no significant change under dark treatment, while it initially increased and then decreased under control conditions. The expression of the AgLAC gene showed no significant change before 12 d of dark treatment, but significantly decreased after 16 d, while it increased dramatically under control conditions. The expression of the cellulose synthesis gene AgCesA6 decreased gradually, while AgCslD3 initially increased and then decreased. The expression levels of AgF5H, AgC4H, AgHCT, Ag4CL, AgCCR and AgPAL genes were highest at 8 d of treatment (Figure 6).
For the stems of celery variety ‘Qianhuang No.1’, the expression of the lignin synthesis genes AgPAL, AgF5H, AgHCT and AgC3’H gradually increased, while AgC4H, Ag4CL, AgCCR, AgCAD and AgCCoAOMT showed a slight decrease followed by an increase, and AgLAC and AgCOMT decreased gradually. The expression of the AgPOD gene changed the most after 12 d of dark treatment, with no significant changes in other stages. The expression of the cellulose synthesis gene AgCslD3 showed a trend of first decreasing and then increasing, while AgCesA6 gradually decreased and showed higher expression compared to the control under dark treatment. The expression levels of the genes AgF5H, AgC4H, AgHCT, Ag4CL, AgCCR, AgPAL, AgCAD, AgCCoAOMT, AgCOMT and AgCslD3 were highest at 12 d of dark treatment, with AgF5H and AgHCT showing significantly higher expression levels than the control (Figure 7).
For the stems of celery variety ‘Qianlv No.1’, the expression of genes AgF5H, AgPAL, AgC4H, Ag4CL, AgHCT, AgCAD, AgCCoAOMT, AgC3′H and AgCOMT showed an initial increase followed by a decrease, while AgPOD and AgLAC showed an increasing trend, and AgCCR showed a decreasing trend. The expression of the cellulose synthesis gene AgCslD3 decreased dramatically, while AgCesA6 showed an initial increase followed by a decrease. The expression levels of the genes AgC4H, AgHCT, Ag4CL, AgPAL, AgCAD, AgCCoAOMT, AgCOMT and AgC3′H were highest after 8 d of dark treatment (Figure 8).
According to the expression analysis results of lignin-synthesis-related genes and cellulose synthesis genes in the leaf blades of ‘Qianhuang No.1’ and ‘Qianlv No.1’ and the petioles of ‘Qianhuang No.1’ and ‘Qianlv No.1’, we can summarize the expression trend of lignin-synthesis-related genes as follows: the genes AgPAL, AgC4H, Ag4CL, AgCAD, AgCCoAOMT, and AgF5H first increase and then decrease; the expression of AgHCT and AgCCR gradually increases; the expression of AgPOD and AgCOMT gradually decreases; the expression of AgLAC shows no obvious change under dark treatment; and the expression of AgC3′H gradually increases. The expression trend of cellulose synthesis genes is as follows: the expression of AgCesA6 and AgCslD3 gradually increases, with AgCslD3 showing a more dramatic increase. Overall, the lignin and cellulose contents during the dark treatment stage were lower than those in the control group, and the lignin content in the leaf blades during the dark treatment stage remained relatively stable, while the cellulose content fluctuated within a certain period of time. The dark treatment had a more significant effect on the leaf blades of ‘Qianhuang No.1’ than on ‘Qianlv No.1’.

4. Discussion

Huang et al.’s study showed that light plays a broad role in regulating a plant’s growth, morphology, and physiological metabolism [26]. When plants exhibit a shade avoidance response, their stems elongate and their diameter decreases. Studies have shown that shading increases internode elongation in rice, which increases the risk of lodging [27,28]. In this study, the color of celery leaf blades and petioles gradually became lighter and turned yellow to white as the duration of the dark treatment increased. After 8 d of dark treatment, the commercial quality of celery gradually deteriorated, with new leaf blades curling and lightening in color and new petioles significantly reducing in diameter and elongating. This is consistent with previous studies that showed a decrease in the red light and far-red light (R/FR) ratio, inhibiting soybean stem lateral growth, promoting internode elongation at the base of the stem, and resulting in a reduced stem thickness and an increased plant height [29,30]. Previous studies have shown that light can regulate gibberellin (GA) biosynthesis and metabolism, and GA plays an important role in leaf yellowing and stem elongation. Rice and wheat mutants with GA synthesis genes exhibit a dwarf phenotype [31,32,33]. Light and GA have an antagonistic effect on cell elongation, where light can appropriately inhibit growth, while GA promotes yellowing and growth [34]. Based on this, we speculate that the color change in celery is primarily influenced by photosynthesis. Dark treatment impedes photosynthesis, preventing the normal synthesis of pigments. Celery can appropriately inhibit plant growth under normal light, while dark treatment may induce changes in GA synthesis, resulting in yellowing, a decreased stem thickness, and an increased plant height. This further confirms the impact of light and light quality on plant morphogenesis.
Dietary fiber is an important factor that affects the quality, texture and flavor of vegetables, and celery leaf blades and petioles are rich in dietary fiber. Lignin and cellulose are important components of dietary fiber and play a crucial role in plant support and disease resistance. Research has shown that light intensity and quality can affect the activity of lignin synthesis, thereby significantly influencing the biosynthesis and metabolism of lignin [34], e.g., lignin accumulation in soybeans is significantly inhibited under shady conditions [35]. Darkness also has a certain effect on cellulose deposition [36].
In this study, compared to the control group, the lignin content in celery leaf blades and petioles decreased in the dark treatment. Moreover, the ‘Qianhuang No.1’ variety showed a significant reduction in the lignin content in leaves after 4, 8 and 16 d of treatment, as well as a significant reduction in petiole lignin content after 12 and 16 d. However, the ‘Qianlv No.1’ variety only showed a significant reduction in petiole lignin content after 4 d of treatment. The changes in petiole lignin content were consistent with its distribution in the xylem, which is in line with previous findings that lignin content decreases in rice [37], tobacco [38], and tea plants [39] under low light conditions. This indicates that dark treatment leads to changes in celery’s lignin content, and the ‘Qianhuang No.1’ variety is more sensitive to changes in light intensity compared to the ‘Qianlv No.1’ variety. There were some differences in the response to slight shading stress between two soybean cultivars, with “Nandou 12” performing better overall than “E93”, which is related to the differences in shade tolerance between the two cultivars [40]. Specifically, there were some differences between the two celery cultivars, with ‘Qianlv No.1’ showing better performance under dark conditions, which is related to its characteristics as a shade-tolerant cultivar in contrast to ‘Qianhuang No.1’. Changes in lignin content are achieved by regulating the expression of lignin biosynthesis genes, thereby altering the activity of relevant enzymes [41,42]. In this study, the lignin-biosynthesis-related genes AgF5H, AgHCT, AgLAC, AgC3′H, AgCCR, AgPOD and AgCAD were all affected by dark treatment. Specifically, the expression of AgF5H and AgHCT genes was significantly up-regulated, while the expression of the AgLAC gene was down-regulated in leaf blades. In petioles of ‘Qianhuang No.1’, the expression of AgC3′H, AgCCR and AgPOD genes was up-regulated, and the expression of the AgCAD gene was down-regulated. Conversely, in petioles of ‘Qianlv No.1’, the expression patterns of AgC3′H, AgCCR, AgPOD and AgCAD genes were the opposite. Many studies have shown that lignin biosynthesis is inhibited under shading stress. Shading leads to down-regulation of OsPAL, OsCOMT, OsCCoAOMT, OsCCR and OsCAD2 genes’ expression in rice stems, resulting in a decreased lignin content [37]. Tang et al. revealed the inhibition of CCoAOMT, POD and CCR genes’ expression in herbaceous peony stems under shading, leading to a decrease in lignin content [43]. Shading stress hinders the expression of TaPAL, TaCOMT, TaCCR and TaCAD genes in wheat, reducing lignin accumulation and altering the distribution ratio of lignin S, G and H monomers [44]. Recent research has shown that down-regulation of CCR, POD, and CCoAOMT genes’ expression leads to a decrease in the lignin content in asparagus under shady conditions, while PAL, C4H and 4CL genes have little effect on the lignin content [45]. Therefore, we speculate that the decrease in lignin content in celery leaf blades under dark treatment is closely related to the down-regulation of AgLAC, AgC3′H, AgCCR, AgPOD and AgCAD gene expressions. The decrease in lignin content in the petioles of ‘Qianhuang No.1’ is closely related to the down-regulation of AgLAC and AgCAD gene expressions, while the decrease in lignin content in the petioles of ‘Qianlv No.1’ is closely related to the down-regulation of AgLAC, AgC3′H, AgCCR and AgPOD gene expressions. PAL, 4CL, CCoAOMT, C4H and CCR are mainly involved in the process of lignin biosynthesis to affect lignin content changes, while CAD, HCT, C3′H, F5H, and COMT are mainly involved in lignin monomer modification to alter the S/G ratio of lignin. LAC and POD are involved in the formation of different structures of lignin through the polymerization of lignin monomers [46]. Finally, we conclude that the AgF5H and AgHCT genes in this study have little effect on celery’s lignin content under dark conditions, suggesting that they mainly affect the proportion of lignin monomers.
Cellulose synthase (CesA) and cellulose synthase-like (Csl) genes are involved in the synthesis of cellulose and hemicellulose enzymes. In our research, after 4 d of dark treatment, the accumulation of cellulose was significantly reduced compared to the control without shading in the ‘Qianhuang No.1’ variety. In the ‘Qianlv No.1’ variety, dark treatment led to a slight decrease in cellulose accumulation but this was not significantly different. The expression of the AgCesA6 gene in celery was down-regulated under shading treatment compared to the control. Under dark treatment, the expression of the AgCslD3 gene in celery was up-regulated in the ‘Qianhuang No.1’ variety but down-regulated in the ‘Qianlv No.1’ variety. Shading affects the activity of key enzymes involved in cotton fiber cellulose synthesis, hindering cellulose production [47]. This study also showed that inhibiting the catalytic activity of CesA6 reduces the efficiency of cellulose synthase complex (CSC) transportation to the plasma membrane, thereby inhibiting cellulose synthesis in plants [48]. In conclusion, we speculate that the down-regulation of AgCesA6 gene expression under dark conditions inhibits the activity of the CesA6 enzyme, thereby affecting cellulose synthesis. However, the expression of the AgCslD3 gene has little cumulative effect on cellulose content in celery under dark conditions, indicating it may primarily impact hemicellulose synthesis. However, the regulation of the monomer conversion of celery lignin by AgF5H and AgHCT, and the potential regulation of the synthesis of other substances during dark treatment of celery via AgCslD3 still need to be further studied.

5. Conclusions

Dark treatment resulted in celery yellowing, a reduced stem thickness, an increased plant height and decreased lignin and cellulose contents. Additionally, ‘Qianhuang No.1’ showed a more intense response to dark stress compared to ‘Qianlv No.1’. The inhibition of the expression of AgLAC, AgC3′H, AgCCR, AgPOD and AgCAD genes affected the accumulation of lignin in celery. The down-regulation of AgCesA6 gene expression in celery inhibited cellulose synthesis. Analysis of morphological characteristics, lignin accumulation and cellulose accumulation at different periods of dark treatment demonstrated that ‘Qianlv No.1’ is a shade-tolerant variety, in contrast to ‘Qianhuang No.1’. The ‘Qianlv No.1’ celery variety is more suitable for planting in places with less sunshine such as Guizhou, China.

Supplementary Materials

The following supporting information can be downloaded at: https://www.mdpi.com/article/10.3390/agronomy14050896/s1, Figure S1: Nucleotide sequences and deduced amino acid sequences of F5H from celery. Figure S2: Nucleotide sequences and deduced amino acid sequences of C4H from celery. Figure S3: Nucleotide sequences and deduced amino acid sequences of HCT from celery. Figure S4: Nucleotide sequences and deduced amino acid sequences of 4CL from celery. Figure S5: Nucleotide sequences and deduced amino acid sequences of CCR from celery. Figure S6: Nucleotide sequences and deduced amino acid sequences of PAL from celery. Figure S7: Nucleotide sequences and deduced amino acid sequences of POD from celery. Figure S8: Nucleotide sequences and deduced amino acid sequences of CAD from celery. Figure S9: Nucleotide sequences and deduced amino acid sequences of CCoAOMT from celery. Figure S10: Nucleotide sequences and deduced amino acid sequences of C3’H from celery. Figure S11: Nucleotide sequences and deduced amino acid sequences of COMT from celery. Figure S12: Nucleotide sequences and deduced amino acid sequences of LAC from celery. Figure S13: Nucleotide sequences and deduced amino acid sequences of CSLD3 from celery. Figure S14: Nucleotide sequences and deduced amino acid sequences of CESA6 from celery.

Author Contributions

Conceptualization, S.Z., X.Z. (Xiulai Zhong) and G.T.; methodology, S.Z., X.Z. (Xiulai Zhong) and X.Z. (Xinqi Zhang); software, S.Z. and A.X.; validation, S.Z. and G.T.; formal analysis, X.Z. (Xiulai Zhong), X.Z. (Xinqi Zhang), Q.L. and K.W.; writing—original draft preparation, S.Z. and G.T.; writing—review and editing, M.L.; visualization, S.Z.; supervision, G.T.; project administration, S.Z., M.L. and G.T. All authors have read and agreed to the published version of the manuscript.

Funding

This research was funded by the Guizhou Academy of Agricultural Sciences (Science and Technology Innovation of Qiannongkeyuan No. [2022]07; Qian Nongkeyuan Youth Science and Technology Fund No. (2021)04); Project of Guizhou Provincial Department of Science and Technology (Qiankehe Foundation-ZK [2024] General 543; Qiankehe Service Enterprise [2022]005; Qianke Hezhong Land Diversion [2023]033); Key Research and Development Program of Jiangsu (BE2022386); Vegetable System Project of Guizhou (GZCYTX2024-0101).

Data Availability Statement

Data are contained within the article and Supplementary Materials.

Conflicts of Interest

The authors declare no conflicts of interest.

References

  1. Li, M.Y.; Li, J.; Xie, F.J.; Zhou, J.; Sun, Y.; Luo, Y.; Zhang, Y.; Chen, Q.; Wang, Y.; Lin, Y.X.; et al. Combined evaluation of agronomic and quality traits to explore heat germplasm in celery (Apium graveolens L.). Sci. Hortic. 2023, 317, 112039. [Google Scholar] [CrossRef]
  2. Li, M.Y.; Hou, X.L.; Wang, F.; Tan, G.F.; Xu, Z.S.; Xiong, A.S. Advances in the research of celery, an important Apiaceae vegetable crop. Crit. Rev. Biotechnol. 2018, 38, 172–183. [Google Scholar] [CrossRef] [PubMed]
  3. Sowbhagya, H.B. Chemistry, technology, and nutraceutical functions of celery (Apium graveolens L.): An overview. Crit. Rev. Food Sci. Nutr. 2014, 54, 389–398. [Google Scholar] [CrossRef]
  4. Patil, R.H.; Babu, R.L.; Naveen Kumar, M.; Kiran Kumar, K.M.; Hegde, S.M.; Ramesh, G.T.; Chidananda Sharma, S. Apigenin inhibits PMA-induced expression of pro-inflammatory cytokines and AP-1 factors in A549 cells. Mol. Cell Biochem. 2015, 403, 95–106. [Google Scholar] [CrossRef] [PubMed]
  5. Khairullah, A.R.; Solikhah, T.I.; Ansori, A.N.; Hidayatullah, A.R.; Hartadi, E.B.; Ramandinianto, S.C.; Fadholly, A. Review on the Pharmacological and Health Aspects of Apium Graveolens or Celery: An Update. Syst. Rev. Pharm. 2021, 12, 606–612. [Google Scholar]
  6. Soliman, G.A. Dietary Fiber, Atherosclerosis, and Cardiovascular Disease. Nutrients 2019, 11, 1155. [Google Scholar] [CrossRef]
  7. Ioniță-Mîndrican, C.B.; Ziani, K.; Mititelu, M.; Oprea, E.; Neacșu, S.M.; Moroșan, E.; Dumitrescu, D.E.; Roșca, A.C.; Drăgănescu, D.; Negrei, C. Therapeutic Benefits and Dietary Restrictions of Fiber Intake: A State of the Art Review. Nutrients 2022, 14, 2641. [Google Scholar] [CrossRef]
  8. Larson, R.T.; McFarlane, H.E. Small but Mighty: An Update on Small Molecule Plant Cellulose Biosynthesis Inhibitors. Plant Cell Physiol. 2021, 62, 1828–1838. [Google Scholar] [CrossRef] [PubMed]
  9. Peter, G.; Neale, D. Molecular basis for the evolution of xylem lignification. Curr. Opin. Plant Biol. 2004, 7, 737–742. [Google Scholar] [CrossRef]
  10. Zhu, N.; Zhao, C.; Wei, Y.; Sun, C.; Wu, D.; Chen, K.S. Biosynthetic labeling with 3-O-propargylcaffeyl alcohol reveals in vivo cell-specific patterned lignification in loquat fruits during development and postharvest storage. Hortic. Res. 2021, 8, e61. [Google Scholar] [CrossRef]
  11. Mélida, H.; Largo-Gosens, A.; Novo-Uzal, E.; Santiago, R.; Pomar, F.; García, P.; García-Angulo, P.; Acebes, J.L.; Álvarez, J.; Encina, A. Ectopic lignification in primary cellulose-deficient cell walls of maize cell suspension cultures. J. Integr. Plant Biol. 2015, 57, 357–372. [Google Scholar] [CrossRef] [PubMed]
  12. Zhang, Y.; Zhang, J.; Zou, S.; Liu, Z.; Huang, H.; Feng, C. Genome-wide analysis of the cellulose toolbox of Primulina eburnea, a calcium-rich vegetable. BMC Plant Biol. 2023, 23, e259. [Google Scholar] [CrossRef] [PubMed]
  13. Vanholme, R.; Demedts, B.; Morreel, K.; Ralph, J.; Boerjan, W. Lignin biosynthesis and structure. Plant Physiol. 2010, 153, 895–905. [Google Scholar] [CrossRef] [PubMed]
  14. Vogt, T. Phenylpropanoid biosynthesis. Mol. Plant 2010, 3, 2–20. [Google Scholar] [CrossRef] [PubMed]
  15. Dixon, R.A.; Barros, J. Lignin biosynthesis: Old roads revisited and new roads explored. Open Biol. 2019, 9, e190215. [Google Scholar] [CrossRef]
  16. Cosgrove, D.J. Growth of the plant cell wall. Nat. Rev. Mol. Cell Biol. 2005, 6, 850–861. [Google Scholar] [CrossRef] [PubMed]
  17. Daras, G.; Templalexis, D.; Avgeri, F.; Tsitsekian, D.; Karamanou, K.; Rigas, S. Updating Insights into the Catalytic Domain Properties of Plant Cellulose synthase (CesA) and Cellulose synthase-like (Csl) Proteins. Molecules 2021, 26, 4335. [Google Scholar] [CrossRef] [PubMed]
  18. Schwerdt, J.G.; MacKenzie, K.; Wright, F.; Oehme, D.; Wagner, J.M.; Harvey, A.J.; Shirley, N.J.; Burton, R.A.; Schreiber, M.; Halpin, C.; et al. Evolutionary dynamics of the cellulose synthase gene superfamily in grasses. Plant Physiol. 2015, 168, 968–983. [Google Scholar] [CrossRef] [PubMed]
  19. Yang, J.; Bak, G.; Burgin, T.; Barnes, W.J.; Mayes, H.B.; Peña, M.J.; Urbanowicz, B.R.; Nielsen, E. Biochemical and Genetic Analysis Identify CSLD3 as a beta-1,4-Glucan Synthase That Functions during Plant Cell Wall Synthesis. Plant Cell 2020, 32, 1749–1767. [Google Scholar] [CrossRef]
  20. Zhang, X.Y.; Li, T.; Tan, G.F.; Huang, Y.; Wang, F.; Xiong, A.S. Efects of dark treatment and regular light recovery on the growth characteristics and regulation of chlorophyll in water dropwort. Plant Growth Regul. 2018, 85, 293–303. [Google Scholar] [CrossRef]
  21. Barry, C.S. The stay-green revolution: Recent progress in deciphering the mechanisms of chlorophyll degradation in higher plants. Plant Sci. 2009, 176, 325–333. [Google Scholar] [CrossRef]
  22. Sun, X.; Zhu, S.; Li, N.; Cheng, Y.; Zhao, J.; Qiao, X.; Lu, L.; Liu, S.; Wang, Y.; Liu, C.; et al. A Chromosome-Level Genome Assembly of Garlic (Allium sativum) Provides Insights into Genome Evolution and Allicin Biosynthesis. Mol. Plant. 2020, 13, 1328–1339. [Google Scholar] [CrossRef] [PubMed]
  23. Zhang, Y.; Wang, G.; Kong, Y.; Xu, H.; Xiao, B.; Liu, Y.; Zhou, H. A comparative analysis of the essential oils from two species of garlic seedlings cultivated in China: Chemical profile and anticoagulant potential. Food Funct. 2020, 11, 6020–6027. [Google Scholar] [CrossRef] [PubMed]
  24. Ai, P.; Xue, J.; Zhu, Y.; Tan, W.; Wu, Y.; Wang, Y.; Li, Z.; Shi, Z.; Kang, D.; Zhang, H.; et al. Comparative analysis of two kinds of garlic seedings: Qualities and transcriptional landscape. BMC Genom. 2023, 24, 87. [Google Scholar] [CrossRef]
  25. Jia, X.L.; Wang, G.L.; Xiong, F.; Yu, X.R.; Xu, Z.S.; Wang, F.; Xiong, A.S. De novo assembly, transcriptome characterization, lignin accumulation, and anatomic characteristics: Novel insights into lignin biosynthesis during celery leaf development. Sci. Rep. 2015, 5, e8259. [Google Scholar] [CrossRef] [PubMed]
  26. Huang, L.; Zhang, H.; Zhang, H.; Deng, X.W.; Wei, N. HY5 regulates nitrite reductase 1 (NIR1) and ammonium transporter1; 2 (AMT1; 2) in Arabidopsis seedlings. Plant Sci. 2015, 238, 330–339. [Google Scholar] [CrossRef] [PubMed]
  27. Xu, J.; Guo, Z.; Jiang, X.; Ahammed, G.J.; Zhou, Y. Light regulation of horticultural crop nutrient uptake and utilization. Hortic. Plant J. 2021, 7, 367–379. [Google Scholar] [CrossRef]
  28. Liu, H.; Yang, C.; Li, L. Shade-induced stem elongation in rice seedlings: Implication of tissue-specific phytohormone regulation. J. Integr. Plant Biol. 2016, 58, 614–617. [Google Scholar] [CrossRef] [PubMed]
  29. Cheng, Y.J.; Chen, J.X.; Wang, Z.L.; Fan, Y.F.; Chen, S.Y.; Li, Z.L.; Liu, Q.L.; Li, Z.C.; Yang, F.; Yang, W.Y. Effects of light intensity and light quality on morphological and photosynthetic characteristics of soybean seedlings. Sci. Agric. Sin. 2018, 51, 2655–2663. [Google Scholar]
  30. Liu, W.G.; Ren, M.L.; Liu, T.; Du, Y.L.; Zhou, T.; Liu, X.M.; Liu, J.; Hussain, S.; Yang, W.Y. Effect of shade stress on lignin biosynthesis in soybean stems. J. Integr. Agric. 2018, 17, 1594–1604. [Google Scholar] [CrossRef]
  31. Liu, Y.; Jafari, F.; Wang, H.Y. Integration of light and hormone signaling pathways in the regulation of plant shade avoidance syndrome. aBIOTECH 2021, 2, 131–145. [Google Scholar] [CrossRef] [PubMed]
  32. Huang, S.C.; Wang, B.; Xie, G.Q.; Liu, Z.L.; Zhang, M.J.; Zhang, S.Q.; Cheng, X.G. Enrichment profile of GA4 is an important regulatory factor triggering rice dwarf. Sci. Agric. Sin. 2019, 52, 786–800. [Google Scholar]
  33. Tang, T.; Botwright Acuña, T.; Spielmeyer, W.; Richards, R.A. Effect of gibberellin-sensitive Rht18 and gibberellin-insensitive Rht-D1b dwarfing genes on vegetative and reproductive growth in bread wheat. J. Exp. Bot. 2021, 72, 445–458. [Google Scholar] [CrossRef] [PubMed]
  34. Li, C.H.; Luo, Y.L.; Jin, M.; Sun, S.F.; Wang, Z.L.; Li, Y. Response of Lignin Metabolism to Light Quality in Wheat Population. Front. Plant Sci. 2021, 12, e729647. [Google Scholar] [CrossRef] [PubMed]
  35. Su, G.X.; An, Z.F.; Zhang, W.H.; Liu, Y.L. Light promotes the synthesis of lignin through the production of H2O2 mediated by diamine oxidases in soybean hypocotyls. J. Plant Physiol. 2005, 162, 1297–1303. [Google Scholar] [CrossRef] [PubMed]
  36. Boex-Fontvieille, E.; Davanture, M.; Jossier, M.; Zivy, M.; Hodges, M.; Tcherkez, G. Photosynthetic activity influences cellulose biosynthesis and phosphorylation of proteins involved therein in Arabidopsis leaves blades. J. Exp. Bot. 2014, 65, 4997–5010. [Google Scholar] [CrossRef] [PubMed]
  37. Wu, L.M.; Zhang, W.J.; Ding, Y.F.; Zhang, J.W.; Cambula, E.D.; Weng, F.; Liu, Z.H.; Ding, C.Q.; Tang, S.; Chen, L.; et al. Shading Contributes to the Reduction of Stem Mechanical Strength by Decreasing Cell Wall Synthesis in Japonica Rice (Oryza sativa L.). Front. Plant Sci. 2017, 8, e881. [Google Scholar] [CrossRef] [PubMed]
  38. Falcioni, R.; Moriwaki, T.; Oliveira, D.M.; Andreotti, G.C.; De Souza, L.A.; Dos Santos, W.D.; Bonato, C.M.; Antunes, W.C. Increased Gibberellins and Light Levels Promotes Cell Wall Thickness and Enhance Lignin Deposition in Xylem Fibers. Front. Plant Sci. 2018, 9, e1391. [Google Scholar] [CrossRef]
  39. Teng, R.M.; Wang, Y.X.; Li, H.; Lin, S.J.; Liu, H.; Zhuang, J. Effects of shading on lignin biosynthesis in the leaf of tea plant (Camellia sinensis (L.) O. Kuntze). Mol. Genet. Genom. 2021, 296, 165–177. [Google Scholar] [CrossRef]
  40. Wen, B.; Zhang, Y.; Hussain, S.; Wang, S.; Zhang, X.; Yang, J.; Xu, M.; Qin, S.; Yang, W.; Liu, W. Slight Shading Stress at Seedling Stage Does not Reduce Lignin Biosynthesis or Affect Lodging Resistance of Soybean Stems. Agronomy 2020, 10, 544. [Google Scholar] [CrossRef]
  41. Li, X.; Weng, J.K.; Chapple, C. Improvement of biomass through lignin modification. Plant J. 2008, 54, 569–581. [Google Scholar] [CrossRef] [PubMed]
  42. Yu, M.Z.; Wang, M.; Gyalpo, T.; Basang, Y. Stem lodging resistance in hulless barley: Transcriptome and metabolome analysis of lignin biosynthesis pathways in contrasting genotypes. Genomics 2021, 113 Pt 2, 935–943. [Google Scholar] [CrossRef] [PubMed]
  43. Tang, Y.H.; Shi, W.B.; Xia, X.; Zhao, D.Q.; Wu, Y.Q.; Tao, J. Morphological, microstructural and lignin-related responses of herbaceous peony stem to shading. Sci. Hortic. 2022, 293, e110734. [Google Scholar] [CrossRef]
  44. Luo, Y.; Chang, Y.; Li, C.; Wang, Y.; Cui, H.; Jin, M.; Wang, Z.; Li, Y. Shading decreases lodging resistance of wheat under different planting densities by altering lignin monomer composition of stems. Front. Plant Sci. 2022, 13, e1056193. [Google Scholar] [CrossRef] [PubMed]
  45. Ma, J.; Li, X.; He, M.; Li, Y.; Lu, W.; Li, M.; Sun, B.; Zheng, Y. A Joint Transcriptomic and Metabolomic Analysis Reveals the Regulation of Shading on Lignin Biosynthesis in Asparagus. Int. J. Mol. Sci. 2023, 24, 1539. [Google Scholar] [CrossRef]
  46. Liu, Q.; Luo, L.; Zheng, L. Lignins: Biosynthesis and Biological Functions in Plants. Int. J. Mol. Sci. 2018, 19, 335. [Google Scholar] [CrossRef] [PubMed]
  47. Chen, J.; Lv, F.; Liu, J.; Ma, Y.; Wang, Y.; Chen, B.; Meng, Y.; Zhou, Z.; Oosterhuis, D.M. Effect of late planting and shading on cellulose synthesis during cotton fiber secondary wall development. PLoS ONE 2014, 9, e105088. [Google Scholar] [CrossRef]
  48. Huang, L.; Li, X.; Zhang, W.; Ung, N.; Liu, N.; Yin, X.; Li, Y.; Mcewan, R.E.; Dilkes, B.; Dai, M.; et al. Endosidin20 Targets the Cellulose Synthase Catalytic Domain to Inhibit Cellulose Biosynthesis. Plant Cell 2020, 32, 2141–2157. [Google Scholar] [CrossRef]
Figure 1. The morphological changes of celery leaf blades and petioles during the treatment. (I): control treatments, (II): dark treatment. (A1,A2): ‘Qianhuang No.1’ after 0 d of treatment, (B1,B2): ‘Qianhuang No.1’ after 4 d of treatment, (C1,C2): ‘Qianhuang No.1’ after 8 d of treatment, (D1,D2): ‘Qianhuang No.1’ after 12 d of treatment, (E1,E2): ‘Qianhuang No.1’ after 16 d of treatment, (A3,A4): ‘Qianlv No.1’ after 0 d of treatment, (B3,B4): ‘Qianlv No.1’ after 4 d of treatment, (C3,C4): ‘Qianlv No.1’ after 8 d of treatment, (D3,D4): ‘Qianlv No.1’ after 12 d of treatment, (E3,E4): ‘Qianlv No.1’ after 16 d of treatment. The rulers in the image represent an actual length of 5 cm.
Agronomy 14 00896 g001
Figure 2. The content of lignin during the treatments of celery. (A): Lignin content of ‘Qianhuang No.1’ leaf blades; (B): lignin content of ‘Qianlv No.1’ leaf blades; (C): lignin content of ‘Qianhuang No.1’ petioles; (D): lignin content of ‘Qianlv No.1’ petioles. Different lowercase letters indicate significant differences at a 0.05 level.
Agronomy 14 00896 g002
Figure 3. The content of cellulose during the treatments of celery. (A): Cellulose content of ‘Qianhuang No.1’ leaf blades; (B): cellulose content of ‘Qianlv No.1’ leaf blades; (C): cellulose content of ‘Qianhuang No.1’ petioles; (D): cellulose content of ‘Qianlv No.1’ petioles. Different lowercase letters indicate significant differences at a 0.05 level.
Agronomy 14 00896 g003
Figure 4. The structure of xylem cells in the petioles during celery treatments. (A,C): Check treatments, (B,D): dark treatments; (A-I,B-I): xylem cell structure after 0 d treatment with ‘Qianhuang No.1’, (A-II,B-II): xylem cell structure after 4 d treatment with ‘Qianhuang No.1’, (A-III,B-III): xylem cell structure after 8 d treatment with ‘Qianhuang No.1’, (A-IV,B-IV): xylem cell structure after 12 d treatment with ‘Qianhuang No.1’, (A-V,B-V): xylem cell structure after 16 d treatment with ‘Qianhuang No.1’, (C-I,D-I): xylem cell structure after 0 d treatment with ‘Qianlv No.1’, (C-II,D-II): xylem cell structure after 4 d treatment with ‘Qianlv No.1’, (C-III,D-III): xylem cell structure after 8 d treatment with ‘Qianlv No.1’, (C-IV,D-IV): xylem cell structure after 12 d treatment with ‘Qianlv No.1’, (C-V,D-V): xylem cell structure after 16 d treatment with ‘Qianlv No.1’. The figure labels include the vascular bundle (v), epidermis (Ep), phloem (p), collenchyma (c) and xylem (X and x).
Agronomy 14 00896 g004
Figure 5. The relative expression levels of the genes related to lignin and cellulose synthesis were determined during the treatments of ‘Qianhuang No.1’ leaf blades. (A): AgF5H; (B): AgC4H; (C): AgHCT; (D): Ag4CL; (E): AgCCR; (F): AgPAL; (G): AgPOD; (H): AgCAD; (I): AgCCoAOMT; (J): AgC3′H; (K): AgCOMT; (L): AgLAC; (M): AgCslD3; (N): AgCesA6. Different lowercase letters in a column indicate significant differences among control and dark treatments (p < 0.05).
Agronomy 14 00896 g005
Figure 6. The relative expression levels of the genes related to lignin and cellulose synthesis were determined during the treatments of ‘Qianlv No.1’ leaf blades. (A): AgF5H; (B): AgC4H; (C): AgHCT; (D): Ag4CL; (E): AgCCR; (F): AgPAL; (G): AgPOD; (H): AgCAD; (I): AgCCoAOMT; (J): AgC3′H; (K): AgCOMT; (L): AgLAC; (M): AgCslD3; (N): AgCesA6. Different lowercase letters in a column indicate significant differences among control and dark treatments (p < 0.05).
Agronomy 14 00896 g006
Figure 7. The relative expression levels of the genes related to lignin and cellulose synthesis were determined during the treatments of ‘Qianhuang No.1’ petioles. (A): AgF5H; (B): AgC4H; (C): AgHCT; (D): Ag4CL; (E): AgCCR; (F): AgPAL; (G): AgPOD; (H): AgCAD; (I): AgCCoAOMT; (J): AgC3′H; (K): AgCOMT; (L): AgLAC; (M): AgCslD3; (N): AgCesA6. Different lowercase letters in a column indicate significant differences among control and dark treatments (p < 0.05).
Agronomy 14 00896 g007
Figure 8. The relative expression levels of the genes related to lignin and cellulose synthesis were determined during the treatments of ‘Qianlv No.1’ petioles. (A): AgF5H; (B): AgC4H; (C): AgHCT; (D): Ag4CL; (E): AgCCR; (F): AgPAL; (G): AgPOD; (H): AgCAD; (I): AgCCoAOMT; (J): AgC3′H; (K): AgCOMT; (L): AgLAC; (M): AgCslD3; (N): AgCesA6. Different lowercase letters in a column indicate significant differences among control and dark treatments (p < 0.05).
Agronomy 14 00896 g008
Table 1. Primers for RT-qPCR related to lignin and cellulose synthesis.
GeneForward Primer (5′→3′)Forward Primer (5′→3′)Substance
AgActinCTTCCTGCCATATATGATTGGGCCAGCACCTCGATCTTCATGActin
AgPALGGTGGTGAAGTTGGGAGGAGAATGTTGCCGAGTGTGGTAATGTGLignin
AgC4HTGGTTGTTGTGTCCTCTCCTGATGATTCTCCTCATCTTCCTCCAATGCLignin
Ag4CLGGGAGATTGTGTAGCACCAGCAGCCTGTTGAATGCCGAGTTTATLignin
AgCCRCAAGAGCAAAGCCGCTGAAGTTGTGCAAAGCAGATCTTCAGGLignin
AgCADTGGGGGTTATCAACACTCCTTTCGTCGTTTTTCTCCAACCTCTCLignin
AgHCTTCTATCCGATGGCTGGGAGGTTATGGTCAGGTCAAGTCCCCGAGLignin
AgC3′HCTCTACAACTTCTATCAACGGCTGTCAAATCACTCCCACCTCTACTLignin
AgF5HGCCAACCGTCCTGCTACCATTTCACCATGTCATCAACCTCTTCACLignin
AgCCOAOMTCAAACATTCAGAAGTTGGGCACGGCAAGGAGAGAATAACCAGTGTALignin
AgCOMTCTTGACCTTCTTGAGTCCATAGCGCATCTTGTTGCTGCTGGGTAGLignin
AgPODGGAAGTGCTAGAACATTTGACCCCTTATCTCTCCAGAAGACCCTLignin
AgLACGCTCTCCTTCAAGCACATTACTTTTTGTTCCAGTTGTGGTCCCTLignin
AgCesA6CCTCGCTGTAGATTATCCTGTGGAGATAGTCAACCTTTTCGGCAcellulose
AgCslD3ACTTCAACTCCCACCTCCATCTATAGCATTTCCGTAGCCATAGGcellulose
Disclaimer/Publisher’s Note: The statements, opinions and data contained in all publications are solely those of the individual author(s) and contributor(s) and not of MDPI and/or the editor(s). MDPI and/or the editor(s) disclaim responsibility for any injury to people or property resulting from any ideas, methods, instructions or products referred to in the content.

