Article

Assessing Changes in Climatic Suitability for Sesame Cultivation in China (1978–2019) Based on Fuzzy Mathematics

1
College of Agriculture, Henan University of Science and Technology, Luoyang 471003, China
2
Institute of Agricultural Economics and Information, Henan Academy of Agricultural Sciences, Zhengzhou 450008, China
3
Key Laboratory of Huang-Huai-Hai Smart Agricultural Technology, Ministry of Agriculture and Rural Affairs, Zhengzhou 450008, China
4
Henan Sesame Research Center, Henan Academy of Agricultural Sciences, Zhengzhou 450008, China
*
Authors to whom correspondence should be addressed.
Agronomy 2024, 14(3), 631; https://doi.org/10.3390/agronomy14030631
Submission received: 27 February 2024 / Revised: 16 March 2024 / Accepted: 19 March 2024 / Published: 20 March 2024

Abstract

:
Sesame is one of the important oil seed crops grown for the high-quality oil. Its growth, development, and yield are significantly affected by the changing climate conditions. Evaluating the sesame climatic suitability is crucial to optimize sesame cultivation patterns and planting distribution, and to aid strategic decision making for future agricultural adaptation. Based on agricultural climatic suitability theory and the fuzzy mathematics method, in this study, we established the temperature, precipitation, sunshine, and comprehensive suitability model. Then, we assessed the spatial distribution and chronological changes in climatic suitability under two periods, 1978–1998 (earlier 21 years) and 1999–2019 (latter 21 years). The results showed that compared with the meteorological data in the earlier 21 years, the mean temperature during the sesame-growing season in the latter 21 years increased from 24.48 °C to 25.05 °C, and the cumulative precipitation increased from 744.38 mm to 754.81 mm; however, the sunshine hours decreased from 6.05 h to 5.55 h. Temperature, precipitation, sunshine, and comprehensive suitability during the sesame-growing season in the main sesame-producing areas of China all had a downward trend. The distribution of temperature and comprehensive suitability in the north is higher than that in the south, while the precipitation and sunshine suitability had an uneven distribution. The area of high-temperature suitability and high-precipitation suitability increased from 43.45 × 10⁶ ha to 46.34 × 10⁶ ha and from 3.20 × 10⁶ ha to 7.97 × 10⁶ ha, respectively, whereas the area of high-sunshine suitability decreased from 4.04 × 10⁶ ha to 2.09 × 10⁶ ha. The climate change was more beneficial to sesame cultivation in northeast Anhui where the area of high climatic suitability clearly expanded, and in eastern Jiangxi where the area of the general climatic suitability increased. In contrast, it is worth noting that the area of high climatic suitability in northern Henan decreased and the area of low climatic suitability in Hubei increased. Our results have important implications for improving agricultural production to cope with ongoing climate change.

1. Introduction

Sesame is one of the important traditional oil crops in the world [1], and is widely grown in tropical and subtropical regions. Due to its high economic and nutritional value, it provides part of the daily allowance for essential fatty acids for almost half of the world’s population [2]. Meanwhile, sesame is grown in semi-arid tropical, subtropical, and temperate climates [3]. China ranks fourth in the world for sesame cultivation, accounting for approximately 10% of global cultivation [4]. According to the China Rural Statistical Yearbook, sesame cultivation is concentrated in the Huang-Huai Plain, the Jiang-Huai Plain, and the Jiang-Han Plain, where the planting area is 283,000 hectares (2019), accounting for more than 70% of the total planting area in China [5].
Climate change and variability have far-reaching consequences for natural resources, human communities, and biodiversity [6]. The sixth assessment report of the United Nations IPCC shows that the global mean temperature will soon rise by 1.5 °C, and the continued warming will lead to multiple hazards and irreversible changes in the ecosystem, as well as upgrading of long-term adverse effects [7]. Predictions of future climate indicate that previous climate trends will strengthen [8,9], and extreme weather events such as heatwaves, droughts, and floods will occur frequently [10,11]. An increase in temperature will accelerate the rate of reproductive development [12], shorten the crop growth period, and reduce yield. The frequent occurrence of extreme precipitation events will cause more frequent droughts and severe flooding [13,14,15]. Global solar radiation has exhibited complicated changes with significant temporal and regional variations, which can affect crop light utilization efficiency.
As the global climate continues to change, traditional agricultural practices have struggled to cope with the resulting challenges, such as extreme weather events, water scarcity, and soil degradation. As a result, new technologies and innovative approaches have become key to enhancing the resilience and sustainability of agriculture. Precision farming technology can monitor soil, climate, and crop-growth conditions in real time, utilizing advanced remote sensing and geographic information systems (GIS), and thereby providing farmers with accurate management decision support. Meanwhile, drought-resistant crop varieties developed through gene editing and traditional breeding techniques can maintain high productivity in the face of water scarcity [16], mitigating the adverse effects of climate change on crop production. Furthermore, climate-smart irrigation systems can monitor soil moisture and crop demand, enabling precise irrigation and avoiding wasted water. Erickson et al. [17] described the role of precision agriculture in food production, showing that precision agriculture has the potential to increase productivity, improve resource allocation of inputs such as pesticides, fertilizers, water, feed, and labor, and provide more stable production. Kim et al. [18] analyzed the effects of climate change and drought tolerance on maize growth and showed that there is an urgent need to develop maize varieties that are resistant to drought and high temperatures or can adapt to climate change. Xin et al. [19] assessed and developed climate-smart agricultural systems in the North China Plain to address the challenges of climate change.
In addition to the methods mentioned above, climate suitability modeling is essential for future climate change. These modeling methods can provide more accurate and reliable estimates of crop–climate relationships using machine learning algorithms and ensemble modeling approaches. Ozsahin et al. [20] analyzed suitable lands for rice cultivation in Edirne plain using geographical information systems (GIS). Akpoti et al. [21] assessed the land suitability for irrigated rice cultivation using Random Forest (RF), Maximum Entropy (MaxEnt) and ensemble modeling. Nadiezhda et al. [22] analyzed the areas of suitability for maize production under climate change using a mechanistic species distribution model (CLIMEX). In addition, a climatic suitability model is a functional model based on the agricultural climatic suitability theory and fuzzy mathematics methods, including temperature, precipitation, and the sunshine suitability index [23]. These indicators can comprehensively reflect the suitability of meteorological conditions for crop growth and development [24]. Since the 1980s, researchers have used the crop climatic suitability model to evaluate the climatic suitability of crops in specific regions, which can improve their ability to adapt to current and future climate change. Tang et al. [25,26] analyzed the impact of current and future climate scenarios on the suitability of summer maize and winter wheat in the North China Plain. Wei et al. [27] established a peanut climatic suitability model to optimize peanut planting structure. Zhao et al. [28] constructed a climatic suitability model to analyze the climatic suitability and changes in potato-planting zoning in North China. However, most of the previous studies focused on food and fruit crops [29,30,31,32,33,34]. Therefore, a comprehensive suitability model for sesame should be built to evaluate the climatic suitability of sesame in China by considering the temperature, precipitation, and sunshine suitability.
The aim of this study, therefore, was to assess the climate suitability of sesame cultivation in China using a fuzzy mathematics method during two time periods. The specific objectives of this study were to (1) analyze the distribution changes in meteorological resources in the sesame-growing seasons from 1978 to 1998 and from 1999 to 2019; (2) construct the temperature, precipitation, sunshine, and comprehensive climatic suitability model using fuzzy mathematical methods; and (3) quantitatively evaluate the spatial distribution of temperature, precipitation, sunshine, and comprehensive climatic suitability for sesame in the main sesame-producing areas of China.

2. Data and Methods

2.1. Study Area

The study area is located in east-central China (24°29′–36°22′ north latitude and 108°21′–119°37′ east longitude), including Henan, Anhui, Hubei, and Jiangxi provinces. This study area is classified to the monsoon climate zone and is abundant in light, heat, and water resources. The cumulative temperature from June to September ranges from 2500 °C to 3000 °C. The sunshine hours total approximately 800 h and the photosynthetically active radiation is 96 kilojoules per square centimeter. The rainfall is mainly concentrated in the period from June to September, which accounts for 75% of the annual rainfall. The boundaries of the study area, geographic location of meteorological stations, and related Digital Elevation Model data are shown in Figure 1.

2.2. Data Source

The climate data from 63 meteorological stations in 1978–2019 were obtained from the China Meteorological Science Data Sharing Service Network (http://data.cma.cn/, accessed on 20 April 2023). Daily climate data include daily maximum temperature (°C), daily minimum temperature (°C), mean daily temperature (°C), daily precipitation (mm), and daily sunshine hours (h). The DEM data of the study area were downloaded from the Resource and Environmental Science and Data Center of the Chinese Academy of Sciences (http://www.resdc.cn/, accessed on 25 April 2023). Administrative boundaries data were provided by the Resource and Environmental Science and Data Center (http://www.resdc.cn/, accessed on 26 April 2023). Sesame yield data were collected from the National Bureau of Statistics of China (https://data.stats.gov.cn/, accessed on 10 May 2023).

2.3. Development of Climatic Suitability Model

According to the theory of agricultural climatic suitability and fuzzy mathematics, the temperature, precipitation, sunshine, and comprehensive suitability models were established. The suitability of climate resources for crop growth and development ranges from 0 to 1; 0 indicates that the climate is completely unsuitable for crop growth and development, while 1 indicates that the climate is the most suitable for crop growth and development. In this study, the growth period of sesame was subdivided into four stages: sowing to emergence, emergence to budding, budding to blooming, and blooming to maturity. Different weights were assigned to different growth periods of sesame based on yield.

2.3.1. Temperature Suitability Model

Sesame grows in warmer climates. The optimal temperature range of 20–31 °C is suitable for sesame growth. The range of 24–32 °C is suitable for the period of sowing to emergence, 20–24 °C for emergence to budding, 27–31 °C for budding to blooming, and 20–24 °C for blooming to maturity [35,36]. The upper-limit temperature, lower-limit temperature, and optimal temperature for crop growth were considered in the temperature suitability index. Crop growth would be inhibited when the mean daily temperature increased above the upper-limit temperature or decreased below the lower-limit temperature. Crop growth is beneficial when the mean daily temperature is close to the optimal temperature.
The temperature suitability function of sesame is as follows:
S t = t t l t h t ( t h t 0 ) t 0 t l t 0 t l t h t 0 ( t h t 0 ) t 0 t l
S T i = 1 n i = 1 n S t
where S(t) is the daily temperature suitability; and t is the mean daily temperature; tl, th, and t0 are the lower-limit temperature, upper-limit temperature, and optimal temperatures for sesame, respectively. These values were collected from the literature [35,36], as shown in Table 1. S(Ti) is the temperature suitability at the i − th growth stage of sesame, and n is the number of this growth stage.

2.3.2. Precipitation Suitability Model

Sesame is a drought-tolerant and waterlogging-sensitive crop [37,38]. Drought and waterlogging severely limit sesame growth and significantly decrease sesame yield [39,40]. Based on the precipitation and sesame water demand, the precipitation suitability model was established as follows:
S R i = R i E T c               R i < E T c E T c R i               R i E T c
E T c = K c × E T 0
where S(Ri) represents the precipitation suitability in the i − th growth period of sesame; Ri is the cumulative precipitation (mm) in the i − th growth period of sesame; ETc is the water demand (mm) in the i − th growth period of sesame; and Kc is the crop coefficient of sesame. According to the literature [35], and combined with sesame cultivation experience, the initial growth stages of sesame are May and June, with Kc taken as 0.35; the rapid growth stages of sesame are July and August, with Kc taken as 1.10; and the last growth stage of sesame is September, with Kc taken as 0.25. ET0 is the crop reference evapotranspiration, calculated using the Penman–Monteith formula recommended by the FAO (as shown in Table 2).

2.3.3. Sunshine Suitability Model

Sesame is a typical short-day plant, and its flowering is largely influenced by the photoperiod [41]. The sesame sunshine suitability model was established as follows:
S S = e S S 0 b 2         S < S 0 1                         S S 0
S S i = 1 n i = 1 n S S
where S(S) is the daily sunshine suitability of sesame; S is the actual sunshine hours (h); S0 is the critical value (h) of the daily average sunshine demand during the growth period of sesame, which was calculated as 70% of the total sunshine hours; and b is a constant related to the dimension and date of the calculation location. The values of S0 and b were taken from the literature [42], as shown in Table 1. S(Si) is the sunshine suitability in the i − th growth period of sesame.

2.3.4. Comprehensive Climatic Suitability Model

Sesame has different demands for meteorological factors, such as temperature, precipitation, and sunshine hours at different growth stages. Climate factors significantly impact interannual yield changes. Therefore, this article combined sesame yield data from various ecological sites to calculate the proportion of meteorological elements for each growth period. Firstly, Equation (7) was used to process the sesame yield data:
Y c = Y c Y c 1 Y c 1 × 100 %
where c represents the c − th year; c − 1 represents the c − 1th year; ∆Yc is the increase or decrease rate of the sesame yield in the c − th year relative to the c − 1th year, which is the meteorological impact index of the crop yield; and Yc and Yc−1 represent the sesame yield per unit area of each province in the study area in the c − th and c − 1th years, respectively. The analysis of the correlation between the suitability of temperature, precipitation, and sunshine for each growth period and the rate of sesame yield was used to calculate the correlation coefficient for each growth period. These resulting values serve as the weight coefficients for evaluating the suitability of temperature, precipitation, and sunshine for each growth period. Equations (8) and (9) were used to calculate the climatic suitability of each single element during the sesame-growing season, as follows:
b t i = a t i i = 1 n a t i b r i = a r i i = 1 n a r i b s i = a s i i = 1 n a s i
  F T = i = 1 n [ b t i S T i ]   F R = i = 1 n [ b r i S R i ] F S = i = 1 n [ b s i S S i ]
where bti, bri, and bsi are the weight coefficients of temperature, precipitation, and sunshine suitability for the i − th growth period, respectively; ati, ari, and asi are the correlation coefficients between the suitability of temperature, precipitation, and sunshine in the i − th growth period and the meteorological impact index of the sesame yield; F(T), F(S), and F(R) represent the temperature, precipitation, and sunshine suitability during the sesame growth period, respectively. The weight coefficients of temperature, precipitation, and sunshine suitability for each growth period are shown in Table 3.
Based on the results of single factor climatic suitability index, a comprehensive climatic suitability model was established using the geometric average method as follows:
F C = F T × F R × F S 3
where F(T), F(R), F(S), and F(C) represent the temperature, precipitation, sunshine suitability, and comprehensive climatic suitability during the growth period. This study divided climatic suitability into four levels, as shown in Table 4.

2.4. Data Processing

The research period was divided into two periods: 1978–1998 (earlier 21 years) and 1999–2019 (latter 21 years). The suitability models were developed using the R language. The spatial data of temperature, precipitation, and sunshine hours were interpolated into 1 km resolution using ANUSPLIN. The Digital Elevation Model data were considered as a covariate in the ANUSPLIN to improve the interpolation accuracy. The Digital Elevation Model data were from the 90 m SRTM (SRTM3 V4.1) images (http://srtm.csi.cgiar.org/, accessed on 10 June 2023) and were resampled to 1 km for this study. The spatial distribution maps of climatic suitability were created using ArcGIS desktop 10.8 software. According to the sesame phenology data, we summarized the date of the sesame growth stage at four ecological sites (as shown in Table 5).

3. Results and Analysis

3.1. Distribution Characteristics of Meteorological Factors during the Sesame-Growing Season

Figure 2 shows that the distribution of the mean temperature had a similar trend in 1978–1998 and 1999–2019, that is, higher in the south of the study area than in the north and higher in the east than in the west. The high mean temperature (25–30 °C) areas were mainly concentrated in eastern Henan, eastern Hubei, and most parts of Anhui and Jiangxi, while the low mean temperature (8–15 °C) areas were found in western Henan and western Hubei. The mean temperature increased from 24.48 °C in 1978–1998 to 25.05 °C in 1999–2019. The total high mean temperature area increased from 26.53 × 10⁶ ha to 42.62 × 10⁶ ha, while the total low mean temperature area decreased from 0.28 × 10⁶ ha to 0.17 × 10⁶ ha.
Figure 3 shows that the distribution of the cumulative precipitation had the same trend in 1978–1998 and 1999–2019, that is, higher in the south of the study area than in the north. The high cumulative precipitation (1000–1700 mm) areas were widely distributed in southwest Hubei, southern Anhui, and most parts of Jiangxi. However, the low cumulative precipitation (300–500 mm) areas were mainly concentrated in northern Henan. The cumulative precipitation increased from 744.38 mm in 1978–1998 to 754.81 mm in 1999–2019. The total high cumulative precipitation area increased from 10.79 × 10⁶ ha to 11.02 × 10⁶ ha. In contrast, the total low cumulative precipitation area declined from 6.77 × 10⁶ ha to 4.77 × 10⁶ ha.
Figure 4 shows that the spatial distribution of sunshine hours was irregular in 1978–1998 and 1999–2019. The high sunshine hours (6–8 h) areas were mainly concentrated in northern Henan, eastern Hubei, and northern Anhui, whereas the low sunshine hours (2–4 h) areas were mainly concentrated in western Hubei in 1978–1998. In 1999–2019, the high sunshine hours (6–8 h) areas were mainly concentrated in eastern Hubei and northern Jiangxi, whereas the low sunshine hours (2–4 h) areas were mainly concentrated in western Hubei and southern Jiangxi. The sunshine hours decreased from 6.05 h in 1978–1998 to 5.55 h in 1999–2019. The total high sunshine hours area decreased from 50.10 × 10⁶ ha to 9.18 × 10⁶ ha. On the contrary, the total low sunshine hours area increased from 1.19 × 10⁶ ha to 2.05 × 10⁶ ha.

3.2. Distribution Characteristics of Climatic Suitability during the Sesame-Growing Season

3.2.1. Distribution Characteristics of Temperature Suitability

Figure 5 shows that the distribution of the temperature suitability was higher in the north of the study area than in the south over the past 42 years. In 1978–1998, areas with temperature suitability above 0.90 accounted for 48.33% of the study area. The highest suitability was that of Mengjin (0.950) in Henan, followed by Xuchang (0.949) and Baofeng (0.948) in Henan. In 1999–2019, areas with temperature suitability above 0.90 accounted for 51.54%. The highest suitability was that of Sanmenxia (0.961) in Henan, followed by Baofeng (0.958), Xuchang (0.956), and Mengjin (0.955) in Henan. Areas with temperature suitability below 0.70 accounted for 0.71% and 6.53%, respectively. The areas in both time periods were mainly distributed in eastern Jiangxi.
The temperature suitability decreased from 0.863 in 1978–1998 to 0.859 in 1999–2019. The area of temperature suitability above 0.90 increased from 43.45 × 10⁶ ha to 46.34 × 10⁶ ha, mainly in central Hubei. Furthermore, the area of temperature suitability ranging from 0.64 to 0.70 increased from 0.64 × 10⁶ ha to 5.89 × 10⁶ ha, mainly in eastern Jiangxi.

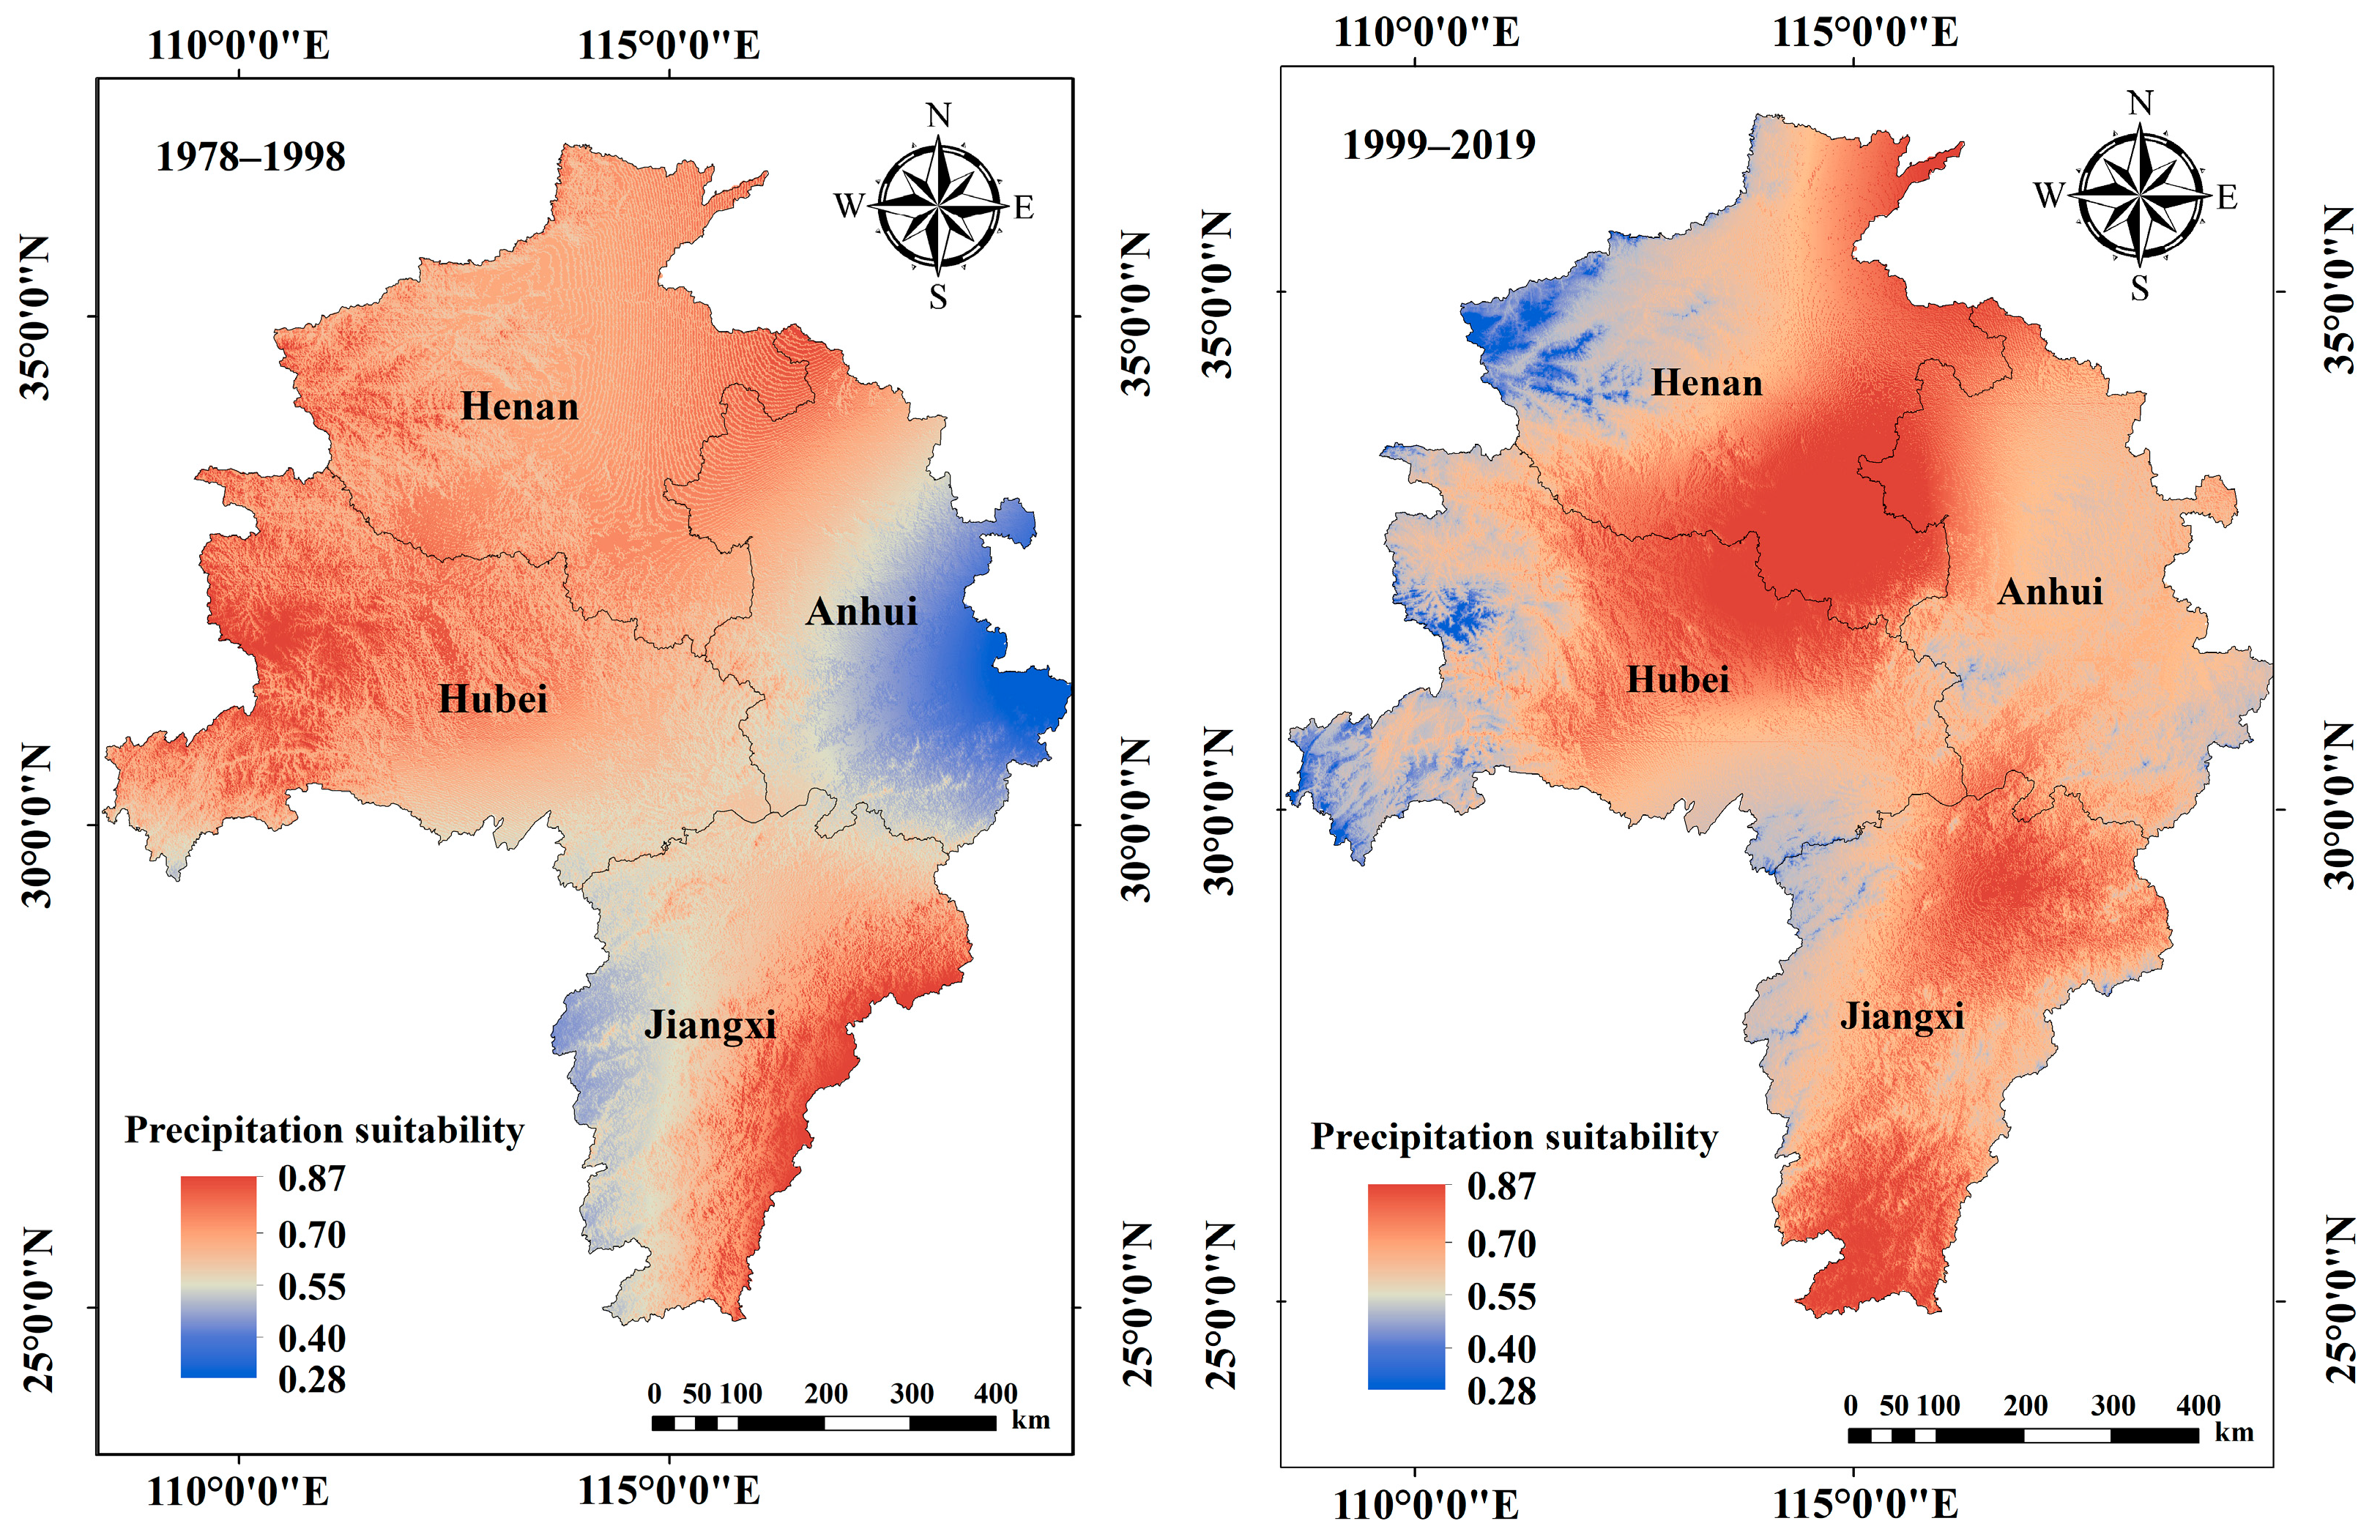
3.2.2. Distribution Characteristics of Precipitation Suitability

Figure 6 shows that the spatial distribution of the precipitation suitability was irregular in the study area over the past 42 years. In 1978–1998, areas with precipitation suitability above 0.70 accounted for 3.56% of the study area, and were mainly concentrated in northwest Hubei. Areas with suitability below 0.40 accounted for 4.67%, and were mainly concentrated in eastern Anhui and western Jiangxi. In 1999–2019, areas with precipitation suitability above 0.70 accounted for 8.86%, and were mainly concentrated in southern Henan and northeast Hubei. The highest suitability was that of Fangxian (0.824) in Hubei, followed by Badong (0.794) and Yunxi (0.759) of Hubei. Areas with precipitation suitability below 0.40 accounted for 1.65%, and were mainly concentrated in western Henan and Hubei.
The precipitation suitability declined from 0.556 to 0.593. The area of precipitation suitability above 0.70 increased from 3.20 × 10⁶ ha to 7.97 × 10⁶ ha, mainly in southern Henan. However, the area of precipitation suitability ranging from 0.28 to 0.40 decreased from 4.20 × 10⁶ ha to 1.48 × 10⁶ ha, mainly in eastern Anhui and western Jiangxi. In conclusion, from 1978 to 2019, the areas with high precipitation suitability have shifted from northwest Hubei to southern Henan.

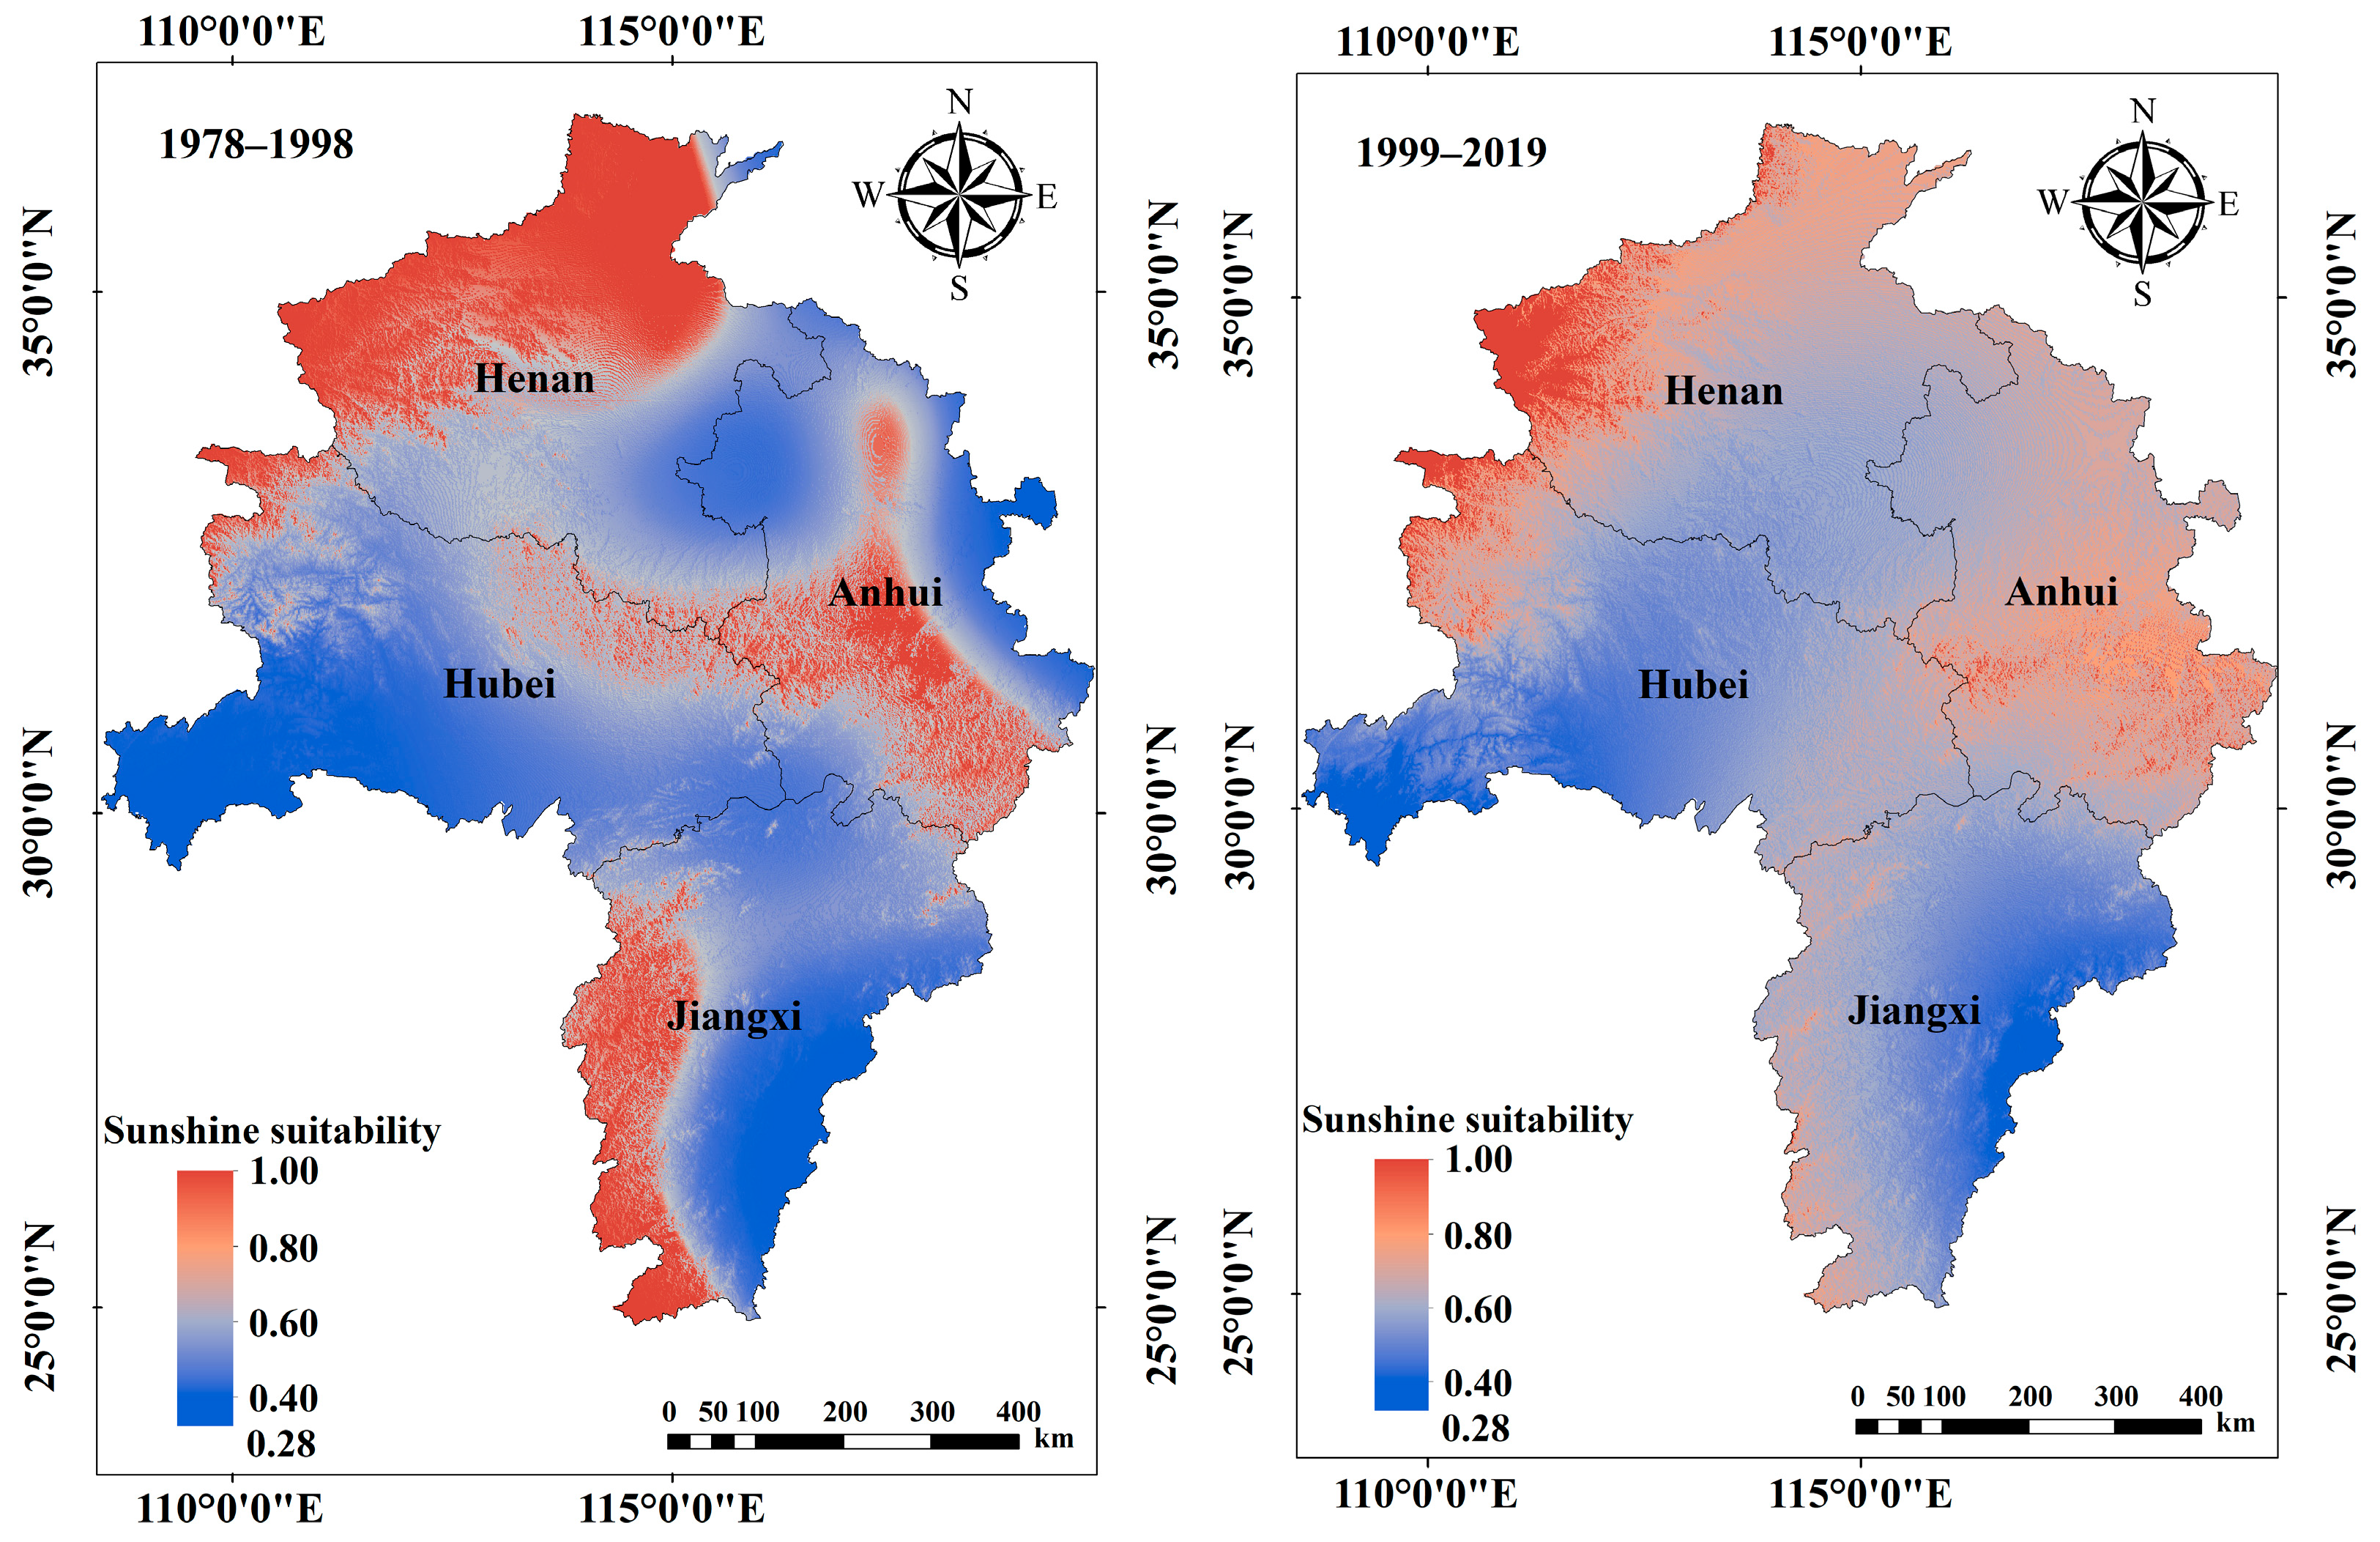
3.2.3. Distribution Characteristics of Sunshine Suitability

Figure 7 shows that the spatial distribution of the sunshine suitability was irregular in the study area over the past 42 years. Areas with sunshine suitability above 0.80 in 1978–1998 accounted for 4.50% of the study area, and were mainly concentrated in northern Henan, central Anhui, and western Jiangxi. The highest suitability was that of Xinxiang (0.809) in Henan, followed by Kaifeng (0.807) and Sanmenxia (0.806) of Henan. In contrast, areas with sunshine suitability above 0.80 in 1999–2019 accounted for 2.33%, and were mainly distributed in western Henan and eastern Anhui. The highest suitability was that of Tongcheng (0.814) in Anhui, followed by Bengbu (0.813) in Anhui. Areas with sunshine suitability below 0.40 accounted for 1.50% and 0.34%, respectively. The areas in both time periods were mainly concentrated in southern Hubei and eastern Jiangxi.
The sunshine suitability declined from 0.655 to 0.612. The area of sunshine suitability above 0.80 decreased from 4.04 × 10⁶ ha to 2.09 × 10⁶ ha, mainly in northern Henan and western Jiangxi. In addition, the area of sunshine suitability ranging from 0.28 to 0.40 decreased from 1.35 × 10⁶ ha to 0.31 × 10⁶ ha, mainly in southern Hubei. In short, from 1978 to 2019, the areas of high sunshine suitability in Henan, Anhui, and Jiangxi all decreased.

3.3. Distribution Characteristics of Comprehensive Suitability during the Sesame-Growing Season

Figure 8 shows that the distribution of comprehensive suitability was higher in the north of the study area than in the south. In 1978–1998, the areas with high climatic suitability for sesame accounted for 31.72% of the study area, and were mainly concentrated in most parts of Henan and northern Anhui. The highest suitability was that of Mengjin (0.792) in Henan, followed by Kaifeng (0.765) in Henan, and Tongcheng (0.780) and Huoshan (0.762) in Anhui. Areas of middle climatic suitability were widely distributed in central Hubei. The highest suitability was that of Yunxi (0.670) in Hubei, followed by Laifeng (0.690), Jiayu (0.683), and Wuhan (0.680). In 1999–2019, the high climatic suitability areas for sesame accounted for 35.06%, and were mainly concentrated in southern Henan; these are the major sesame production areas in the main sesame-producing areas of China. The areas in northern Anhui were also highly suitable. The middle climatic suitability areas accounted for 49.28%, and were mainly concentrated in northern Henan and central Hubei. The highest suitability was that of Xuchang (0.694) in Henan, followed by Baofeng (0.677) and Sanmenxia (0.664). Areas of general climatic suitability were found in eastern Jiangxi, accounting for 9.84% and 14.76% in both time periods, respectively. The low climatically suitable areas were found in southeast Anhui in 1978–1998, accounting for 0.13%, while areas of low climatic suitability clearly expanded and accounted for 0.90% of the study area in 1999–2019. The improved areas were primarily located in southwest Hubei.
Over the past 42 years, climatically suitable regions for sesame have undergone clear spatial shifts. In general, climatic suitability for sesame in China increased from 1978 to 2019 due to an expansion in the areas with high climatic suitability in Northern Anhui. Highly suitable areas have shifted markedly southward in Henan. The area of high climatic suitability was 28.52 × 10⁶ ha in 1978–1998, and it increased by 10.54% in 1999–2019. However, the middle climatically suitable areas decreased from 52.41 × 10⁶ ha to 44.31 × 10⁶ ha. The area of the general climatic suitability expanded, increasing by 50.10% in 1999–2019 compared with 1978–1998. The area of low climatic suitability increased from 11.71 × 10⁶ ha to 79.91 × 10⁶ ha.

3.4. Change Trend of Sesame Climatic Resources and Climatic Suitability in the Main Sesame-Producing Areas of China from 1978 to 2019

Figure 9 and Figure 10 show that the interannual change in meteorological resources and suitability of sesame in the whole growth period from 1978 to 2019 in the study area. The mean temperature and cumulative precipitation during the sesame-growing season had an upward trend, while the sunshine hours had a downward trend. The suitability of temperature, precipitation, and sunshine, and the comprehensive suitability, had a linear downward trend, indicating that the suitability of sesame in the main sesame-producing areas of China decreased with climate change.

4. Discussion

Climate change had a profound impact on agriculture in the study area. In this study, in the earlier 21 years (1978–1998) and the latter 21 years (1999–2019), most parts of the main sesame-producing areas of China had a mean temperature of 25–30 °C, cumulative precipitation of 600–800 mm, and sunshine hours of 5–7 h. Compared with 1978–1998, the mean temperature in the main sesame-producing areas of China increased from 24.48 °C to 25.05 °C, the cumulative precipitation increased from 744.38 mm to 754.81 mm, and the sunshine hours decreased from 6.05 h to 5.55 h in 1999–2019. Changes in temperature and precipitation patterns increase the frequency and intensity of extreme weather events such as droughts and floods. Sesame is a water-sensitive crop, and drought and flooding disasters can affect the growth of sesame [39], ultimately leading to a decrease in yield and quality. Rising temperatures advance the flowering of sesame. However, high soil moisture delays the maturity stage. Drought during the emergence stage decreases the seedling emergence rate, and high temperatures and waterlogging during the bloom and irrigation stages reduce dry matter accumulation and yield. In addition, changes in sunshine hours may affect sesame growth and development [41].
Interannual variations in meteorological conditions can affect the climatic suitability of sesame. The climatic suitability accounted for the effects of temperature, precipitation, and sunshine on the growth and development of the sesame. Over the past 42 years, areas of high temperature suitability (>0.9) accounted for 48.33–51.54% of the study area, areas of high precipitation suitability (>0.7) accounted for 3.56–8.86%, and areas of high sunshine suitability (>0.8) accounted for 2.33–4.50%. Compared with 1978–1998, areas of high temperature suitability (>0.9) increased by 6.65%, areas of high precipitation suitability (>0.7) increased by 1.49 times, and areas of high sunshine suitability (>0.8) decreased by 48.08% in 1999–2019. In short, over the past 42 years, the temperature suitability was relatively high in most parts of the main sesame-producing areas of China, while the overall suitability for precipitation and sunshine was relatively low.
In the context of climate change, we need to optimize the suitable planting region of sesame and then reasonably adjust the sesame planting distribution in the main sesame-producing areas of China. Over the past 42 years, areas of high precipitation suitability have shifted from northwest Hubei to southern Henan because of reduced precipitation in northwest Hubei, and the high precipitation suitability area in Jiangxi moved westward. Areas of high sunshine suitability in Henan and Jiangxi all decreased. As the climate changed, the comprehensive suitability for sesame shifted. In this study, we found areas of high climatic suitability, general climatic suitability, and low climatic suitability increased by 10.54%, 50.10%, and 5.8 times, respectively, while areas of middle climatic suitability decreased by 15.48% in 1999–2019. Furthermore, the high climatic suitability areas shifted from northern Henan to southern Henan, mainly because of increased precipitation in southern Henan. Meanwhile, areas of high climatic suitability in northern Anhui expanded, mainly because of sufficient temperature, precipitation, and sunshine hours for sesame growth in southern Anhui. However, excessive precipitation and reduced sunshine hours caused by climate warming in southwest Hubei and western Jiangxi had negative effects on the distribution for sesame planting. Meanwhile, high temperatures and excessive precipitation in Jiangxi are the main factors limiting sesame growth. Wang et al. [43] found that the sesame planting area in 2015 was concentrated in southern Henan and northwestern Anhui. Our results indicate that the areas of high climatic suitability for sesame are consistent with the results of previous studies.
Adaptive planning in climate change conditions is a significant challenge for the effective management of water resources and agricultural systems [44]. According to the shift in sesame climatic suitability over the past 42 years, we should increase sesame planting areas in southern Henan, northern Anhui, central Hubei, and eastern Jiangxi, where sesame climatic suitability is increasing. Hence, designating new climate-resilient strategies and farming systems is necessary to ensure regional food security and economic stability [45,46]; for example, selecting waterlogging-tolerant varieties, decreasing the frequency of irrigation, and adjusting the sowing date are necessary with increasing rainfall under the same light and heat conditions.

5. Conclusions

We constructed a relationship between sesame distribution and climatic factors using the fuzzy mathematics, and then systematically investigated the spatial distribution and shifts in sesame climatically suitable areas. We then assessed the consistency between climatic suitability and actual production across China. In the past 42 years, the mean temperature was between 25 and 30 °C, cumulative precipitation was between 600 and 800 mm, and total sunshine hours was between 5 and 7 h in the main sesame-producing areas of China. Compared with the meteorological data in 1978–1998, the mean temperature increased from 24.48 °C to 25.05 °C and cumulative precipitation increased from 744.38 mm to 754.81 mm in 1999–2019. However, sunshine hours decreased from 6.05 h to 5.55 h in 1999–2019. In the earlier 21 years, areas with high climatic suitability were mainly concentrated in northern Henan and comprised 31.53 × 10⁶ ha (35.07%) of the entire main sesame-producing areas of China. During 1978–2019, areas with high climatic suitability expanded from 28.52 × 10⁶ ha to 31.53× 10⁶ ha, migrating from northern Henan to southern Henan and northern Anhui, and the total highly suitable area increased by 10.54% compared with the earlier 21 years. Furthermore, areas with low climatic suitability shifted from southern Anhui to southeast Anhui and southwest Hubei, expanding from 11.71 × 10⁶ ha to 79.91 × 10⁶ ha. These results provide valuable guidance for optimizing the planting layout of sesame and increasing sesame production in China.

Author Contributions

X.W. Formal analysis, Visualization, Writing—original draft; J.Z. (Jiantao Zhang) Visualization; J.Z. (Jie Zhang) Data curation; H.Z. Conceptualization; F.H. Formal analysis; T.G. Funding acquisition; M.H. Investigation; Y.L. Supervision; G.L. Conceptualization, Writing—review and editing. All authors have read and agreed to the published version of the manuscript.

Funding

This study was financially supported by the Technology Innovation Team Project from Henan Academy of Agricultural Sciences (Contract Number: 2024TD07), the Science and Technology Innovation Leading Talent Cultivation Program of the Institute of Agricultural Economics and Information, Henan Academy of Agricultural Sciences (Contract Number: 2021KJCX02), and the Key Science and Technology Projects of Henan Province (No. 222102110117 and No. 232102110295).

Data Availability Statement

The data are not publicly available because we have no right to publish meteorological data.

Acknowledgments

We fully appreciate the editors and all anonymous reviewers for their constructive comments on this manuscript.

Conflicts of Interest

The authors declare no conflicts of interest.

References

  1. Li, H.; Tahir Ul Qamar, M.; Yang, L.; Liang, J.; You, J.; Wang, L. Current Progress, Applications and Challenges of Multi-Omics Approaches in Sesame Genetic Improvement. Int. J. Mol. Sci. 2023, 24, 3105. [Google Scholar] [CrossRef] [PubMed]
  2. Wei, X.; Wang, L.H.; Zhang, Y.X.; Qi, X.Q.; Wang, X.L.; Ding, X.; Zhang, J.; Zhang, X.R. Development of Simple Sequence Repeat (SSR) markers of sesame (Sesamum indicum) from a genome survey. Molecules 2014, 19, 5150–5162. [Google Scholar] [CrossRef] [PubMed]
  3. Jasmine, R.S.; Renukadevi, A.; Guhan, T.; Arthanari, P.M. Bio Efficacy of Botanicals against Major Insect Pests of Sesame. Int. J. Plant Soil Sci. 2023, 35, 358–362. [Google Scholar] [CrossRef]
  4. Zhang, Y.P.; Wang, Q.; Zhou, K.J.; Xia, L.J.; Zhang, Y.; Zhao, L.; Lin, Y.X.; Zhang, F.G. Development and revitalization of sesame industry mechanization. Mod. Agric. Sci. Technol. 2023, 832, 117–122+126. (In Chinese) [Google Scholar]
  5. Cui, Y.Q.; Xu, J.; Guo, Y.Z.; Guo, Z.B.; Jian, J.L.; Xu, G.Z. Comprehensive analysis and trend of sesame breeding based on the regional test in norhtern China. Chin. J. Oil Crop Sci. 2020, 42, 401–410. (In Chinese) [Google Scholar]
  6. Kiani Ghalehsard, S.; Shahraki, J.; Akbari, A.; Sardar Shahraki, A. Assessment of the impacts of climate change and variability on water resources and use, food security, and economic welfare in Iran. Environ. Dev. Sustain. 2021, 23, 14666–14682. [Google Scholar] [CrossRef]
  7. Gao, Q.H.; Qin, Y.Y.; Liang, M.C.; Gao, X. Interpretation of the main conclusions and suggestions of IPCC AR6 synthesis report. Environ. Prot. 2023, 51, 82–84. (In Chinese) [Google Scholar]
  8. Van Leeuwen, C.; Destrac-Irvine, A.; Dubernet, M.; Duchêne, E.; Gowdy, M.; Marguerit, E.; Pieri, P.; Parker, A.; De Resseguier, L.; Ollat, N. An Update on the Impact of Climate Change in Viticulture and Potential Adaptations. Agronomy 2019, 9, 514. [Google Scholar] [CrossRef]
  9. Martins, J.; Fraga, H.; Fonseca, A.; Santos, J.A. Climate Projections for Precipitation and Temperature Indicators in the Douro Wine Region: The Importance of Bias Correction. Agronomy 2021, 11, 990. [Google Scholar] [CrossRef]
  10. Arias, P.; Bellouin, N.; Coppola, E.; Jones, C.; Krinner, G.; Marotzke, J.; Naik, V.; Plattner, G.-K.; Rojas, M.; Sillmann, J.; et al. Climate Change 2021: The Physical Science Basis; Contribution of Working Group I to the Sixth Assessment Report of the Intergovernmental Panel on Climate Change; Technical Summary; IPCC: Geneva, Switzerland, 2021. [Google Scholar]
  11. Fraga, H.; Molitor, D.; Leolini, L.; Santos, J.A. What Is the Impact of Heatwaves on European Viticulture? A Modelling Assessment. Appl. Sci. 2020, 10, 3030. [Google Scholar] [CrossRef]
  12. Lohani, N.; Singh, M.B.; Bhalla, P.L. High temperature susceptibility of sexual reproduction in crop plants. J. Exp. Bot. 2020, 71, 555–568. [Google Scholar] [CrossRef] [PubMed]
  13. Min, S.-K.; Zhang, X.; Zwiers, F.W.; Hegerl, G.C. Human contribution to more-intense precipitation extremes. Nature 2011, 470, 378–381. [Google Scholar] [CrossRef] [PubMed]
  14. Pall, P.; Aina, T.; Stone, D.A.; Stott, P.A.; Nozawa, T.; Hilberts, A.G.J.; Lohmann, D.; Allen, M.R. Anthropogenic greenhouse gas contribution to flood risk in England and Wales in autumn 2000. Nature 2011, 470, 382–385. [Google Scholar] [CrossRef] [PubMed]
  15. Tabari, H. Climate change impact on flood and extreme precipitation increases with water availability. Sci. Rep. 2020, 10, 13768. [Google Scholar] [CrossRef] [PubMed]
  16. Rosero, A.; Granda, L.; Berdugo-Cely, J.A.; Šamajová, O.; Šamaj, J.; Cerkal, R. A Dual Strategy of Breeding for Drought Tolerance and Introducing Drought-Tolerant, Underutilized Crops into Production Systems to Enhance Their Resilience to Water Deficiency. Plants 2020, 9, 1263. [Google Scholar] [CrossRef] [PubMed]
  17. Erickson, B.; Fausti, S.W. The role of precision agriculture in food security. Agron. J. 2021, 113, 4455–4462. [Google Scholar] [CrossRef]
  18. Kim, K.-H.; Lee, B.-M. Effects of Climate Change and Drought Tolerance on Maize Growth. Plants 2023, 12, 3548. [Google Scholar] [CrossRef] [PubMed]
  19. Xin, Y.; Tao, F.L. Developing climate-smart agricultural systems in the North China Plain. Agric. Ecosyst. Environ. 2020, 291, 107482. [Google Scholar] [CrossRef]
  20. Ozsahin, E.; Sari, H.; Ozdes, M.; Eroglu, I.; Yuksel, O. Determination of suitable lands for rice cultivation in Edirne plain: GIS supported FAO limitation method. Paddy Water Environ. 2020, 20, 325–338. [Google Scholar] [CrossRef]
  21. Akpoti, K.; Dossou-Yovo, E.R.; Zwart, S.J.; Kiepe, P. The potential for expansion of irrigated rice under alternate wetting and drying in Burkina Faso. Agric. Water Manag. 2021, 247, 106758. [Google Scholar] [CrossRef]
  22. Ramirez-Cabral, N.Y.; Kumar, L.; Shabani, F. Global alterations in areas of suitability for maize production from climate change and using a mechanistic species distribution model (CLIMEX). Sci. Rep. 2017, 7, 5910. [Google Scholar] [CrossRef] [PubMed]
  23. Hou, Y.Y.; Wang, L.Y.; Mao, L.X.; Lü, H.Q.; Wang, J.L. Simulation model of spring maize developmental stages in Northeast China based on climatic suitability. Chin. J. Ecol. 2012, 31, 2431–2436. (In Chinese) [Google Scholar]
  24. Wei, R.J.; Song, Y.B.; Wang, X. Method for dynamic forecast of corn yield based on climatic suitability. J. Appl. Met Eorol. Sci. 2009, 20, 622–627. (In Chinese) [Google Scholar]
  25. Tang, X.P.; Liu, H.J. Climate suitability for summer maize on the North China Plain under current and future climate scenarios. Int. J. Climatol. 2021, 41, E2644–E2661. [Google Scholar] [CrossRef]
  26. Tang, X.P.; Liu, H.J. Spatial-temporal distribution of climate suitability of winter wheat in North China Plain for current and future climate scenarios. Theor. Appl. Climatol. 2021, 143, 915–930. [Google Scholar] [CrossRef]
  27. Wei, S.C.; Li, K.W.; Yang, Y.T.; Wang, C.Y.; Liu, C.; Zhang, J.Q. Comprehensive climatic suitability evaluation of peanut in Huang-Huai-Hai region under the background of climate change. Sci. Rep. 2022, 12, 11350. [Google Scholar] [CrossRef] [PubMed]
  28. Zhao, J.F.; Zhan, X.; Jiang, Y.Q.; Xu, J.W. Variations in climatic suitability and planting regionalization for potato in northern China under climate change. PLoS ONE 2018, 13, e0203538. [Google Scholar] [CrossRef]
  29. Zhao, J.F.; Guo, J.P.; Xu, Y.H.; Mu, J. Effects of climate change on cultivation patterns of spring maize and its climatic suitability in Northeast China. Agric. Ecosyst. Environ. 2015, 202, 178–187. [Google Scholar] [CrossRef]
  30. Zhao, J.Y.; Guo, J.P.; Mu, J.; Xu, Y.H. Exploring the dynamics of agricultural climatic resource utilization of spring maize over the past 50 years in Northeast China. Phys. Chem. Earth Parts A/B/C 2015, 87, 19–27. [Google Scholar] [CrossRef]
  31. Yang, X.J.; Sun, J.Y.; Gao, J.L.; Qiao, S.S.; Zhang, B.L.; Bao, H.Z.; Feng, X.W.; Wang, S.Y. Effects of climate change on cultivation patterns and climate suitability of spring maize in Inner Mongolia. Sustainability 2021, 13, 8072. [Google Scholar] [CrossRef]
  32. Giliba, R.A.; Yengoh, G.T. Predicting suitable habitats of the african cherry (Prunus africana) under climate change in Tanzania. Atmosphere 2020, 11, 988. [Google Scholar] [CrossRef]
  33. Teslić, N.; Vujadinović, M.; Ruml, M.; Ricci, A.; Vuković, A.; Parpinello, G.P.; Versari, A. Future climatic suitability of the Emilia-Romagna (Italy) region for grape production. Reg. Environ. Chang. 2019, 19, 599–614. [Google Scholar] [CrossRef]
  34. Chen, Y.X.; Ren, L.X.; Lou, Y.S.; Tang, L.L.; Yang, J.Z.; Su, L. Effects of climate change on climate suitability of green orange planting in Hainan island, China. Agriculture 2022, 12, 349. [Google Scholar] [CrossRef]
  35. Wang, X.L.; Tu, Y.; Gu, Z.Q. Comparative study of temperature illumination and water conditions in growing period of autumn sesame and summer in Jianghan Plain. Chin. J. Oil Crop Sci. 2002, 24, 55–58. (In Chinese) [Google Scholar]
  36. Zhao, Y.Y.; Sun, J.; Liang, J.C.; Wang, Z.Q.; Yan, T.X.; Yan, X.W.; Wei, W.L.; Le, M.W. Effects of low temperature on seedling growth at sesame early seedling period and screening of low-temperature tolerant materials. Acta Agric. Zhejiangensis 2023, 35, 752–768. (In Chinese) [Google Scholar]
  37. Harfi, M.E.; Hanine, H.; Rizki, H.; Latrache, H.; Nabloussi, A. Effect of drought and salt stresses on germination and early seedling growth of different color-seeds of sesame (Sesamum indicum). Int. J. Agric. Biol. 2016, 18, 1088–1094. [Google Scholar] [CrossRef]
  38. Dossa, K.; Li, D.; Wang, L.; Zheng, X.; Yu, J.; Wei, X.; Fonceka, D.; Diouf, D.; Liao, B.; Cisse, N.; et al. Dynamic transcriptome landscape of sesame (Sesamum indicum L.) under progressive drought and after rewatering. Genom. Data 2017, 11, 122–124. [Google Scholar] [CrossRef]
  39. Habibullah, M.; Sarkar, S.; Islam, M.M.; Ahmed, K.U.; Rahman, M.Z.; Awad, M.F.; ElSayed, A.I.; Mansour, E.; Hossain, M.S. Assessing the response of diverse sesame genotypes to waterlogging durations at different plant growth stages. Plants 2021, 10, 2294. [Google Scholar] [CrossRef]
  40. Wang, L.H.; Li, D.H.; Zhang, Y.X.; Gao, Y.; Yu, J.Y.; Wei, X.; Zhang, X.R. Tolerant and susceptible sesame genotypes reveal waterlogging stress response patterns. PLoS ONE 2016, 11, e0149912. [Google Scholar] [CrossRef]
  41. Zhou, R.; Liu, P.; Li, D.H.; Zhang, X.R.; Wei, X. Photoperiod response-related gene SiCOL1 contributes to flowering in sesame. BMC Plant Biol. 2018, 18, 343. [Google Scholar] [CrossRef]
  42. Huang, H. A study on the climatic ecology adaptability of the crop production in thered and yellow soils region of China. J. Nat. Resour. 1996, 11, 340–346. (In Chinese) [Google Scholar]
  43. Wang, J.; Fu, M.Q.; Sun, Y.; Liu, B.; Wang, X.H.; Chen, F. Spatio-temporal evolution of sesame production in county-level areas of China during 1985–2015. J. China Agric. Univ. 2020, 25, 203–213. (In Chinese) [Google Scholar]
  44. Abbasi, H.; Delavar, M.; Bigdeli Nalbandan, R.; Shahdany, M.H. Robust strategies for climate change adaptation in the agricultural sector under deep climate uncertainty. Stoch. Environ. Res. Risk Assess. 2020, 34, 755–774. [Google Scholar] [CrossRef]
  45. Rahman, S.; Anik, A.R. Productivity and efficiency impact of climate change and agroecology on Bangladesh agriculture. Land Use Policy 2020, 94, 104507. [Google Scholar] [CrossRef]
  46. Debray, V.; Wezel, A.; Lambert-Derkimba, A.; Roesch, K.; Lieblein, G.; Francis, C.A. Agroecological practices for climate change adaptation in semiarid and subhumid Africa. Agroecol. Sustain. Food Syst. 2019, 43, 429–456. [Google Scholar] [CrossRef]
Figure 1. The location of the study area.
Agronomy 14 00631 g001
Figure 2. Comparison of mean temperature distribution during the sesame-growing season between 1978–1998 and 1999–2019.
Agronomy 14 00631 g002
Figure 3. Comparison of cumulative precipitation distribution during the sesame-growing season between 1978–1998 and 1999–2019.
Agronomy 14 00631 g003
Figure 4. Comparison of sunshine hours distribution during the sesame-growing season between 1978–1998 and 1999–2019.
Agronomy 14 00631 g004
Figure 5. The distribution of temperature suitability during the sesame-growing season between 1978–1998 and 1999–2019.
Agronomy 14 00631 g005
Figure 6. The distribution of precipitation suitability during the sesame-growing season between 1978–1998 and 1999–2019.
Agronomy 14 00631 g006
Figure 7. The distribution of sunshine suitability during the sesame-growing season between 1978–1998 and 1999–2019.
Agronomy 14 00631 g007
Figure 8. The distribution of comprehensive suitability during the sesame-growing season between 1978–1998 and 1999–2019.
Agronomy 14 00631 g008
Figure 9. Changes in mean temperature, cumulative precipitation, and sunshine hours in the main sesame-producing areas of China since 1978. (Solid line represents meteorological data, dashed line represents fitted line.)
Agronomy 14 00631 g009
Figure 10. Changes in temperature suitability, precipitation suitability, sunshine suitability, and comprehensive suitability in the main sesame-producing areas of China since 1978. (Solid line represents climatic suitability, dashed line represents fitted line).
Agronomy 14 00631 g010aAgronomy 14 00631 g010b
Table 1. Parameters of sesame climatic suitability model.
ParametersSowing to EmergenceEmergence to BuddingBudding to BloomingBlooming to Maturity
tl (°C)12151515
th (°C)40404040
t0 (°C)28222922
S0 (h)8.859.429.599.71
b4.775.085.175.24
Kc0.351.101.100.25
Table 2. Parameters (ET0) of sesame suitability model.
Growth PeriodEcological Sites
HenanHubeiAnhuiJiangxi
Sowing to emergence29.626.625.124.3
Emergence to budding121.082.1128.5161.1
Budding to blooming184.3217.5176.7198.0
Blooming to maturity64.738.239.819.8
Table 3. Three weight coefficients of sesame at different growth stages in the study area.
Ecological Sites
Growth PeriodHenanHubeiAnhuiJiangxi
b t i b s i b r i b t i b s i b r i b t i b s i b r i b t i b s i b r i
Sowing to emergence0.230.130.450.490.170.770.000.210.770.110.060.29
Emergence to budding0.030.140.100.200.360.070.540.380.070.300.460.59
Budding to blooming0.350.340.270.100.450.030.200.190.030.220.360.09
Blooming to maturity0.390.390.190.210.010.130.260.220.130.370.120.03
Note: Values less than 0.01 are denoted as 0.00.
Table 4. Climatic regionalization of sesame in the main producing areas of China.
C ValueComprehensive Suitability
0.77–1.00High suitability
0.67–0.77Middle suitability
0.57–0.67General suitability
0.00–0.57Low suitability
Table 5. Phenological periods of sesame in four ecological sites.
Growth StagesEcological Sites
HenanHubeiAnhuiJiangxi
Sowing to emergence10 June–15 June5 June–10 June15 June–20 June20 June–25 June
Emergence to budding16 June–10 July11 June–10 July21 June–20 July26 June–31 July
Budding to blooming11 July–20 August11 July–31 August21 July–31 August1 August–5 September
Blooming to maturity21 August–5 September1 September–10 September1 September–10 September6 September–20 September
Disclaimer/Publisher’s Note: The statements, opinions and data contained in all publications are solely those of the individual author(s) and contributor(s) and not of MDPI and/or the editor(s). MDPI and/or the editor(s) disclaim responsibility for any injury to people or property resulting from any ideas, methods, instructions or products referred to in the content.

