Article

Temporal Synchronization of Nitrogen and Sulfur Fertilization: Impacts on Nutrient Uptake, Use Efficiency, Productivity, and Relationships with Other Micronutrients in Soybean

1
ICAR-Indian Institute of Soybean Research (IISR), Khandwa Road, Indore 452 001, India
2
Department of Agronomy, Agriculture Faculty, Sayed Jamaluddin Afghani University (SJAU), Asadabad 2801, Afghanistan
3
Biology Department, Faculty of Science, King Khalid University, P.O. Box 9004, Abha 61413, Saudi Arabia
4
Research Center for Advanced Materials Science (RCAMS), King Khalid University, P.O. Box 9004, Abha 61413, Saudi Arabia
*
Author to whom correspondence should be addressed.
Agronomy 2024, 14(3), 570; https://doi.org/10.3390/agronomy14030570
Submission received: 3 February 2024 / Revised: 9 March 2024 / Accepted: 10 March 2024 / Published: 12 March 2024

Abstract

:
Nitrogen (N) and sulfur (S) are essential nutrient elements, and their deficiency affects crop growth, productivity, and nutrient uptake due to their multifaceted role in plant metabolism, which has been well documented. Therefore, agricultural management strategies that can overcome these deficiencies are the need of the hour. In this context, a study was undertaken with the objective to assess the impacts of N and S applications, either basally or through split application (12.5, 25 and 50 kg ha−1), on the nutrient uptake, productivity, use efficiency, and micronutrient content status in soybean seeds, and also the change in soil nutrient zinc (Zn) and iron (Fe) content at different critical stages of soybean crop growth. The field trial was conducted utilizing a randomized complete-block design, and comprised fourteen treatments with varying N and S quantities. N and S were applied through basal and split applications in different combinations. The salient findings indicated that the highest seed, straw yield, N, and S uptake were obtained with the application of N25+25, S25+25, and did not significantly vary with N25+25, S12.5+12.5, N50, and N25+S50. The highest N use efficiency was recorded with the application of N25+S50, and S use efficiency with the application of N25+25, S25+25. The split application of N and S as N25+25, S25+25 significantly increased soil Zn and Fe content at R2 and R5 stages of soybean crop growth, as well as seed Zn and Fe uptake. It can be concluded that the basal and split application of N and S at the rate of 25 kg ha−1 can improve soybean productivity through increased mobilization and assimilation by plants. The findings indicated that applying N and S separately, with 25 kg ha−1 each basally and at the R2 stage resulted in the highest nutrient uptake, and seed and straw yields. The nutrient use efficiencies, along with Zn and Fe uptake by seeds, exhibited noticeable improvements with this split application approach compared to the control. Furthermore, the soil Zn and Fe contents also experienced enhancements due to the split application of both Nand S fertilizers. These results underscore the potential benefits of temporally adopting optimized fertilizer application strategies to maximize agricultural productivity while ensuring efficient nutrient utilization and soil health maintenance. Further research and field trials could provide deeper insights into the long-term impacts and scalability of this approach across different crop varieties and environmental conditions.

1. Introduction

Soybean (Glycine max L.) stands as the primary legume crop globally, contributing to 56% of total global oilseed production [1]. Essential for food security, soybean serves as a vital protein source for human and animal consumption, along with being a key oil supplier for cooking and biofuel [2]. N and S are crucial macronutrients, vital for soybean’s development, yield, and protein biosynthesis. A deficiency of S can significantly impact N metabolism, resulting in a reduced uptake from fertilizers. Both N and S fertilization has been proven to enhance soybean growth and yield, emphasizing their significance in the proper development, yield, and protein biosynthesis of soybean [3,4]. Numerous reports confirm that N fertilizer enhances protein content, while S fertilizer influences protein composition [5,6]. Soybeans, with their substantial nutrient demand, require especially high amounts of N due to the protein content in seeds, which averages around 40% based on the dry weight of seeds [7]. This elevated N requirement is crucial for achieving high seed yields, particularly in legumes, given their significant seed protein content [7,8,9]. A global challenge is the widespread deficiency of N in soil, presenting a major limitation. Meeting crop N requirements is complex, demanding the temporal synchronization between seasonal indigenous N sources and crop N demand [10]. N use efficiency is crucial, reflecting the effectiveness of crops in converting available N into seed yield. Its main components include the relation between N absorption and N applied (recovery efficiency), and the relation between biomass and N assimilation (internal efficiency) [11]. The decrease in N use efficiency with increasing N fertilizer rates is well-documented due to factors like nutrient availability and higher N losses [8,12]. Over a 40-year span, data from various sites revealed a linear increase in biological N uptake of 0.07 kg per kg increase in soybean seed yield [13]. The availability of sulfate in soil (as Sexists in soil as adsorbed or in its organically complex form) emerges as a limiting factor for plant growth since cysteine, a crucial product of Smetabolism, is essential for protein synthesis [6,14]. S-containing amino acids, crucial for human health, highlight the significance of S in nutrition [15]. S fertilization enhances the impact of N, improving soil processes and N use efficiency [11,16]. In poor-fertility environments with N and S deficiencies and moderate organic matter levels, S addition enhances N recovery and agronomic efficiency [17]. Soybeans, which have a high N requirement during the seed-filling period, may encounter limitations in meeting their needs through biological N fixation. The demand for N peaks during the late growth stages (R3–R6), and the daily observed uptake amounts range from 3.6 to 4.3 kg ha−1 N at the R4–R5 soybean growth stages [18]. However, studies suggest that in high-yielding crops like soybeans, biological N fixation during later reproductive stages may contribute to fulfilling N requirements, potentially reducing the need for additional N supplementation [13]. Likewise, [19] emphasizes the pivotal role of Zn absorption and accumulation by crops, underscoring the importance of targeted focus in biofortification initiatives. The presence of a high amount of N in wheat seed layers suggests that protein-rich seeds accumulate more Zn and Fe levels [20]. High N and Zn supply significantly enhances the Zn contents in seeds, surpassing the current breeding targets [21,22]. Hence, top-dressing N during early reproductive stages proves beneficial for improving nutrient uptake and use efficiency. The synergistic effects of N and S are essential, as evidenced by extensive research examining soybean responses to N–-Fe, S–phosphorus, and S–boron interactions [23,24,25]. Despite this, there remains a notable gap in research regarding the influence of N and S fertilization, particularly in terms of administering basal doses alongside split application at the R2 stage of soybean growth. Understanding this dynamic is crucial for assessing the nutrient uptake, yield, efficiency, and their correlation with micronutrients such as Zn and Fe in soybean seeds. Building upon this, our study implemented a novel approach, utilizing both N and S at initial doses, supplemented by top-dressing at the R2 stage. This strategic intervention aimed to enhance the nutrient absorption, crop productivity, use efficiency, and intricate relationship with other essential micronutrients such as Zn and Fe within soybean cultivation.

2. Materials and Methods

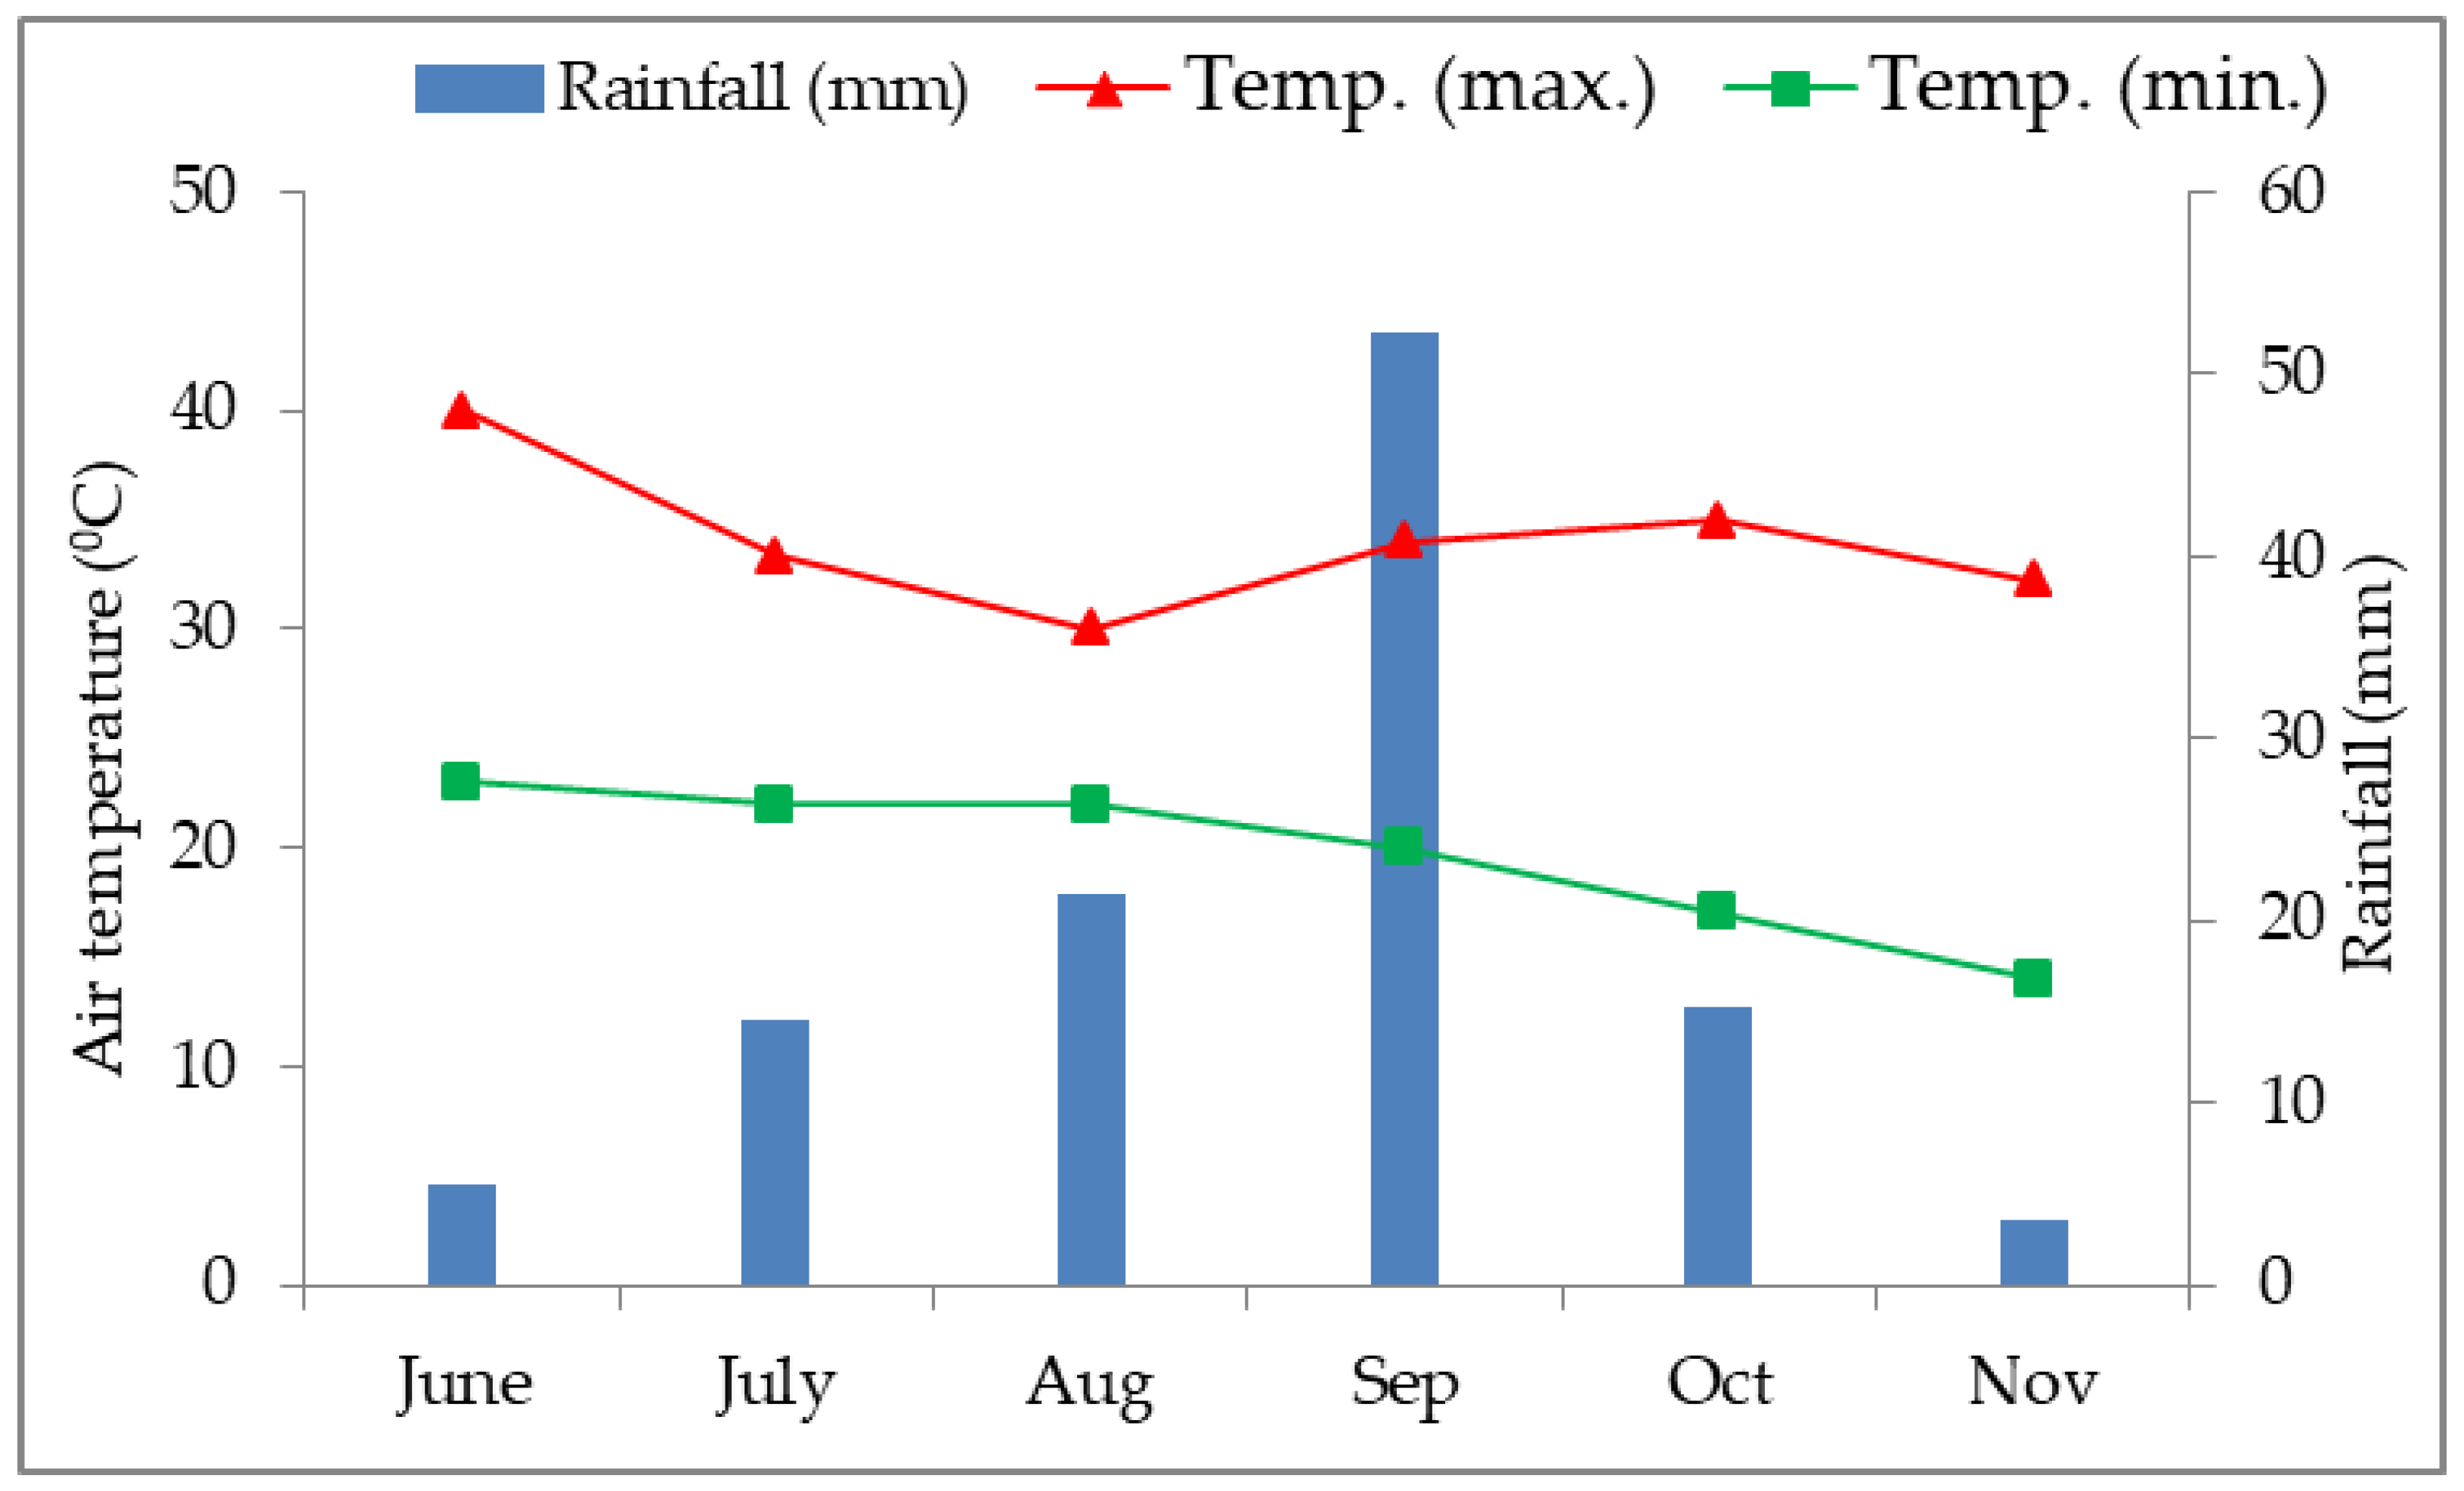
2.1. Location Description, Experimental Design, and Crop Husbandry

A field experiment was conducted during the kharif season of 2018 under rainfed conditions to evaluate the changes in N and S mobilization and other pertinent nutrients such as Zn and Fe, the nutrient uptake and efficiency, and productivity of soybean, as influenced by the mode of N and S application. The experimental soil belongs to Sarol series (iso-hyperthermic, montmorollinitic, typic haplusterts) at the ICAR-Indian Institute of Soybean Research, Indore, India. The pertinent characteristics of the soil initially were as follows: pH, 8.20; OC, 4.6 g kg−1; EC, 0.10 dsm−1; clay content, 56.2%; CaCO3, 7.0%; and available N, P, K, S exchangeable calcium, magnesium, DTPA-extractable Zn, and Fe at 145 ppm, 6.2 ppm, 258 ppm, 6.58 ppm, 32.9 cmol (P+) kg−1, 27.2 cmol (P+) kg−1, 0.80 ppm, 2.32 ppm, and 5.9 ppm, respectively. The objective was to evaluate the effects of basal and split N and S applications on soybean’s nutrient uptake, use efficiency, and productivity. The experimental soil, classified as Vertisols, mainly supported a soybean–wheat cropping system. The trial was conducted using a randomized complete-block design with three replications and fourteen treatments involving different quantities of N and S (12.5, 25, and 50 kg ha−1), applied through basal and split applications at the R2 stage in various combinations. Urea and Di ammonium phosphate (DAP) were used for N, while bentonite Swas used for S application (Table 1). Di ammonium phosphate (DAP) was used for the basal application of N for 25 kg ha−1, and for 50 kg ha−1 N, half was applied through DAP and the rest through urea. Urea was utilized for the split application of N. For potassium, the muriate of potassium at a rate of 67 kg ha−1 K was applied as a basal dose for all the treatments. The crop geometry was maintained at 40 cm × 10 cm row-to-row and plant-to-plant distances, respectively. The seeds were coated with rhizobia, and each experimental plot measured 3.6 m in width and 6 m in length. The monthly average temperature and rainfall data for the growing season were obtained from the institute’s meteorological records and are presented in Figure 1. All recommended agronomic practices were followed to ensure alignment with the established norms and procedures.

2.2. Chemical Analysis of Plant and Soil Samples

The plant samples from the various treatments were dried in a hot-air oven at 65 °C for 3 days or until attaining constant weight to evaluate the macronutrients (N, S) and micronutrients (Zn, Fe) in the plant samples. To determine the contents of S, Zn, and Fe, the finely powdered samples were digested using a di-acid mixture consisting of nitric acid and perchloric acid at a ratio of 5:4 v/v (volume/volume). The plant samples were kept for pre-digestion overnight and were digested for 1 h at a temperature of 320 °C until they were colorless. The Scontent in seeds was estimated using the turbidimetric method, while N was determined after acid digestion and thereafter steam distillation by Kjeldahl’s method. The digested content was directly introduced into the atomic absorption spectrophotometer to determine the content of Zn and Fe. The results were then expressed in milligrams per kilogram (mg kg−1) for the plant materials. The diethylene triamine penta-acetic acid (DTPA) extraction technique, developed by [26], at a pH of 7.3, was carried out to determine the soil micronutrients, such as Zn and Fe. The extracted micronutrients were quantified in the DTPA solution using an atomic absorption spectrophotometer [27]. The analysis was carried out at the Soil-Science Chemistry/Fertility/Microbiology Laboratory of the IISR. The nutrient uptake and use efficiency were calculated using the following equations:
Nutrient uptake (kg ha−1) by seeds = seeds N or S (kg) × yield of seeds t ha−1
Nutrient uptake (kg ha−1) by straw = straw N or S (kg) × yield of straw t ha−1
Total uptake (kg ha−1) = seeds uptake of nutrient + Straw uptake of nutrient
Agronomic efficiency (AE) is defined as the incremental economic yield (kg) per (kg−1) of the applied nutrient.
AE = GY F GY C   F     kg   ha 1
Physiological efficiency (PE) is characterized by the seed yield (kg) per (kg−1) of nutrient uptake.
PE = GY F GY C   GNU F GNU C
Apparent nutrient recovery efficiency (ANR) is employed to indicate a plant’s capability to assimilate the applied nutrients from the soil.
ANR   % =   SNU F SNU C   F     kg   ha 1   ×   100
where
GYF: Signifies the grain yield with N or S application.
GYC: Represents the grain yield for the control group.
F: Denotes the amount of applied fertilizers, whether N or S.
GNUF: Stands for the grain nutrient uptake with N or S application.
GNUC: Indicates the grain nutrient uptake for the control group.

2.3. Statistical Analysis

The data were analyzed using SAS statistical software (ver.9.2; SAS Institute., Cary, NC). The one-way ANOVA was performed using the ANOVA procedure in SAS Enterprise, and the least-significant differences (LSD) test at p = 0.05 was utilized to differentiate between the treatment means. For multivariate analysis and to establish robust Pearson correlations among various features, Biplot and correlation plots were generated using Origin Pro 2023b software.

3. Results

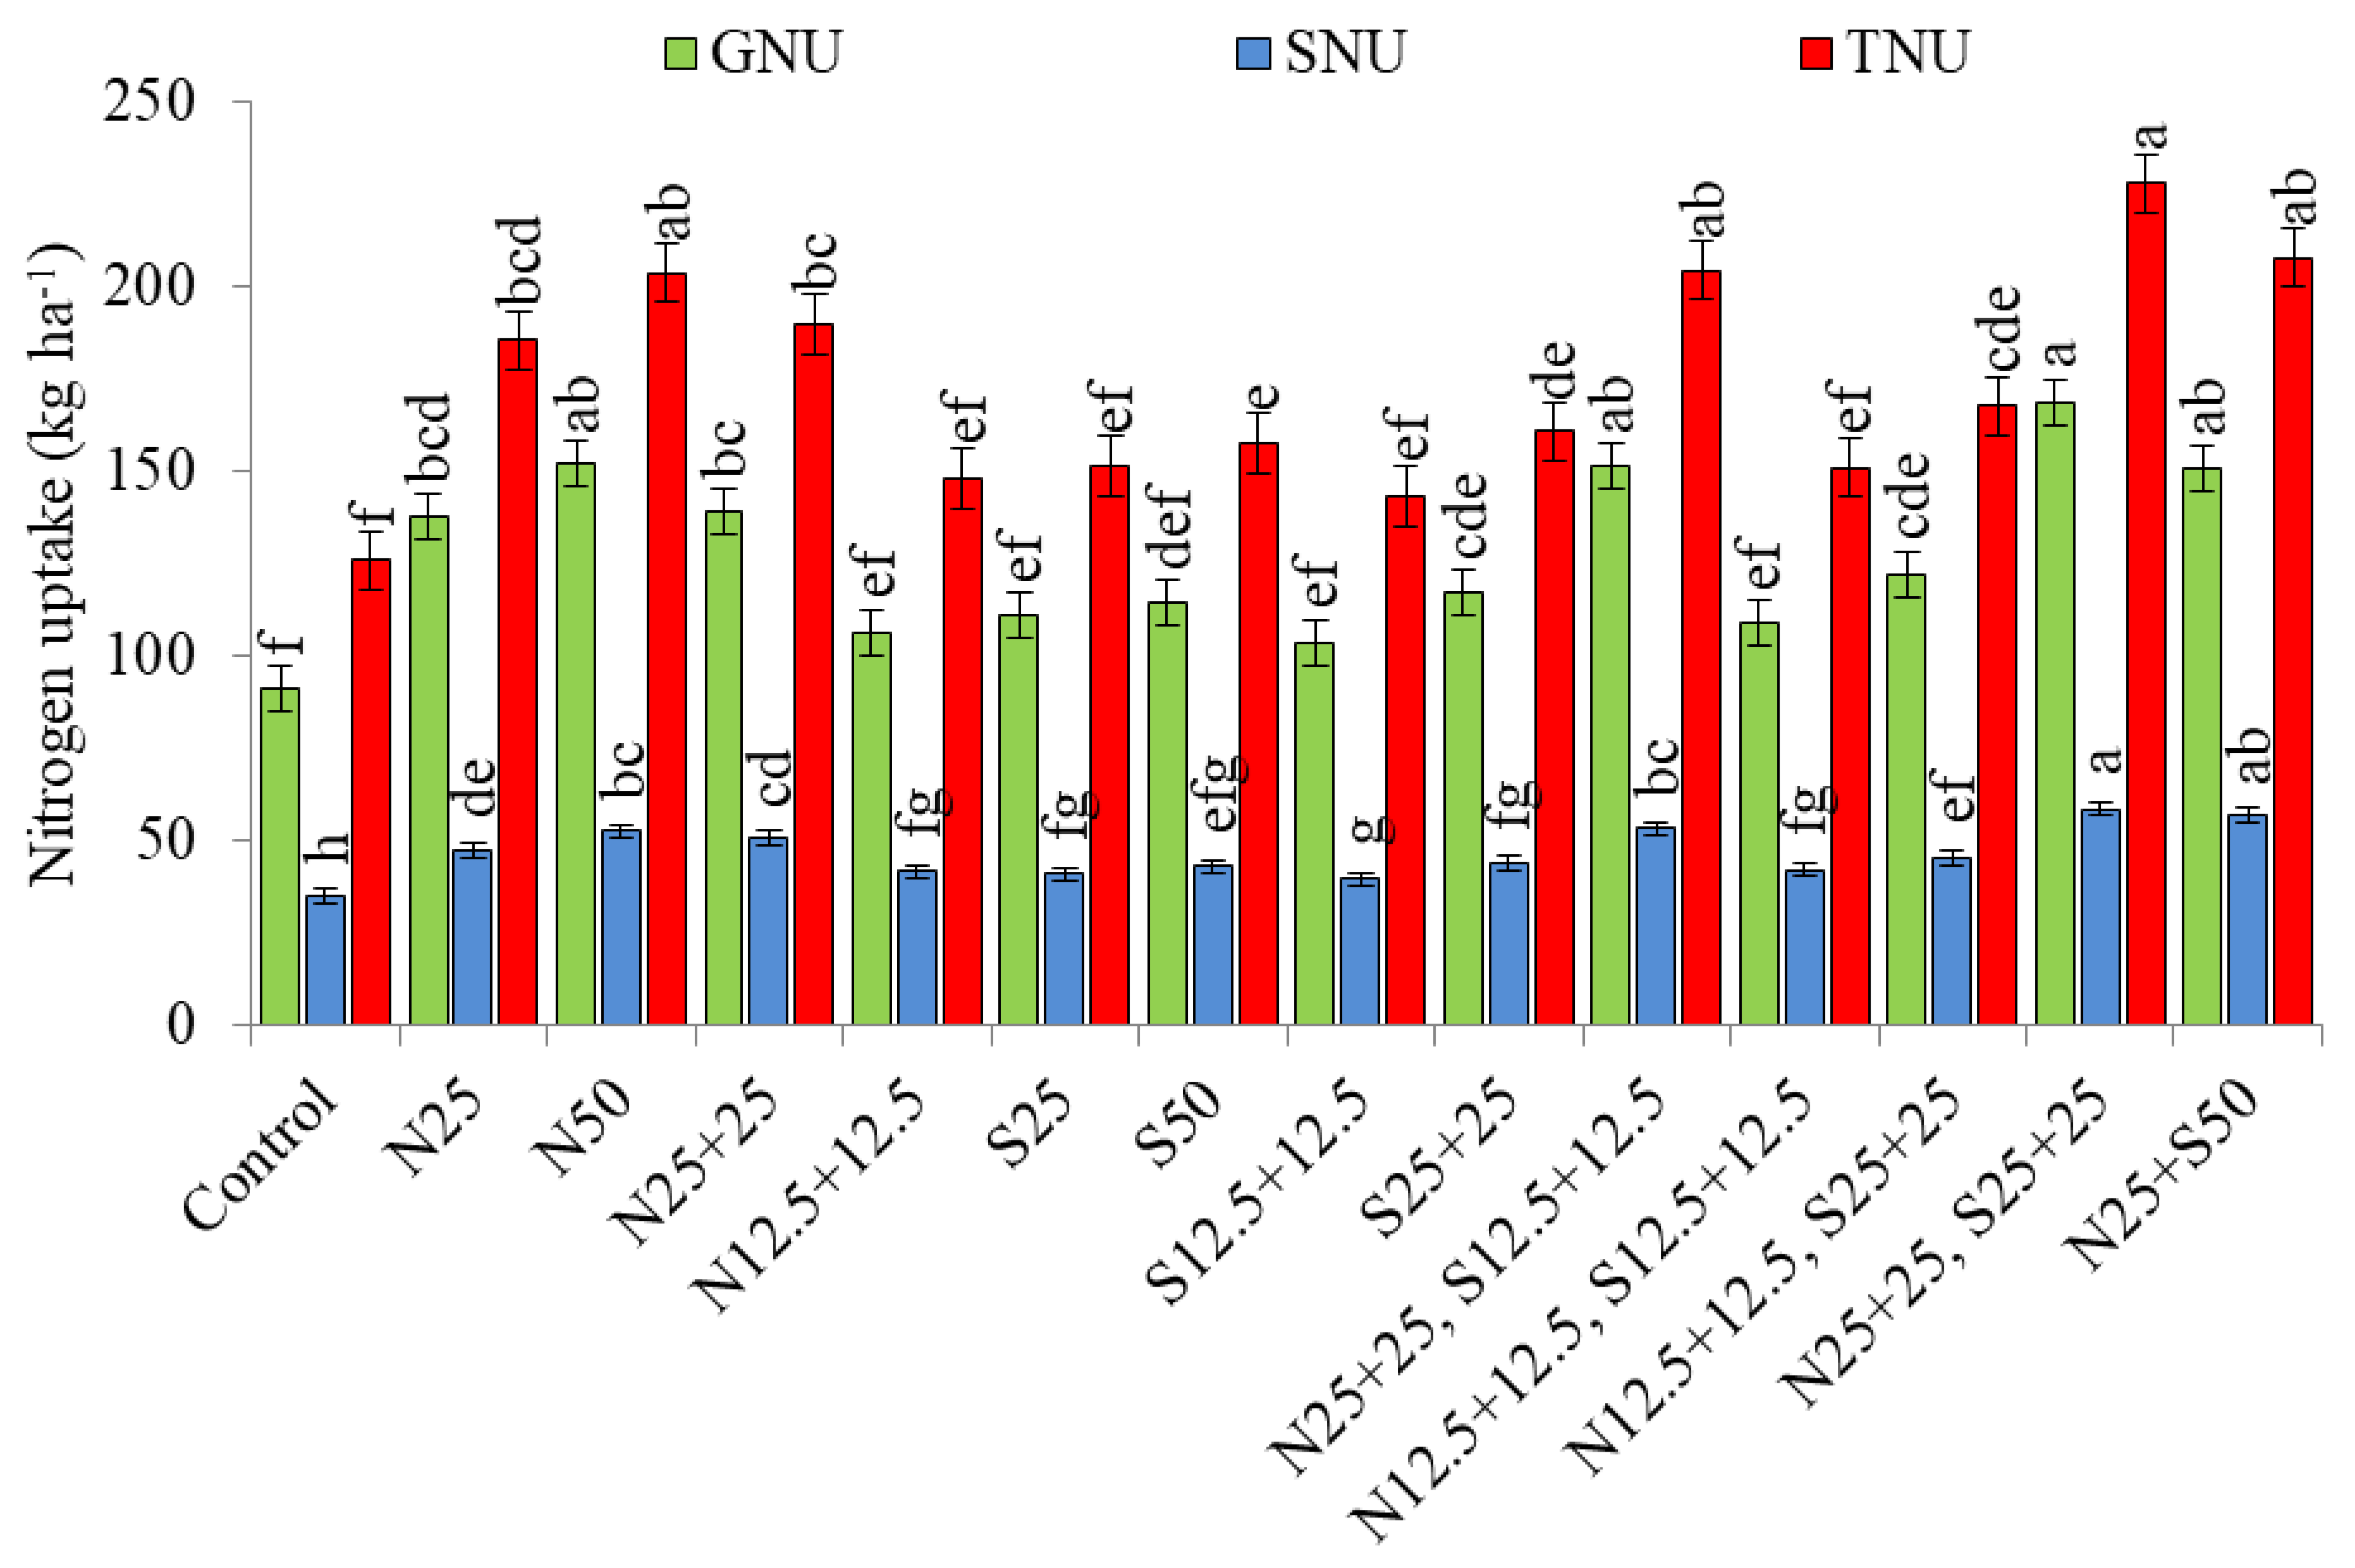
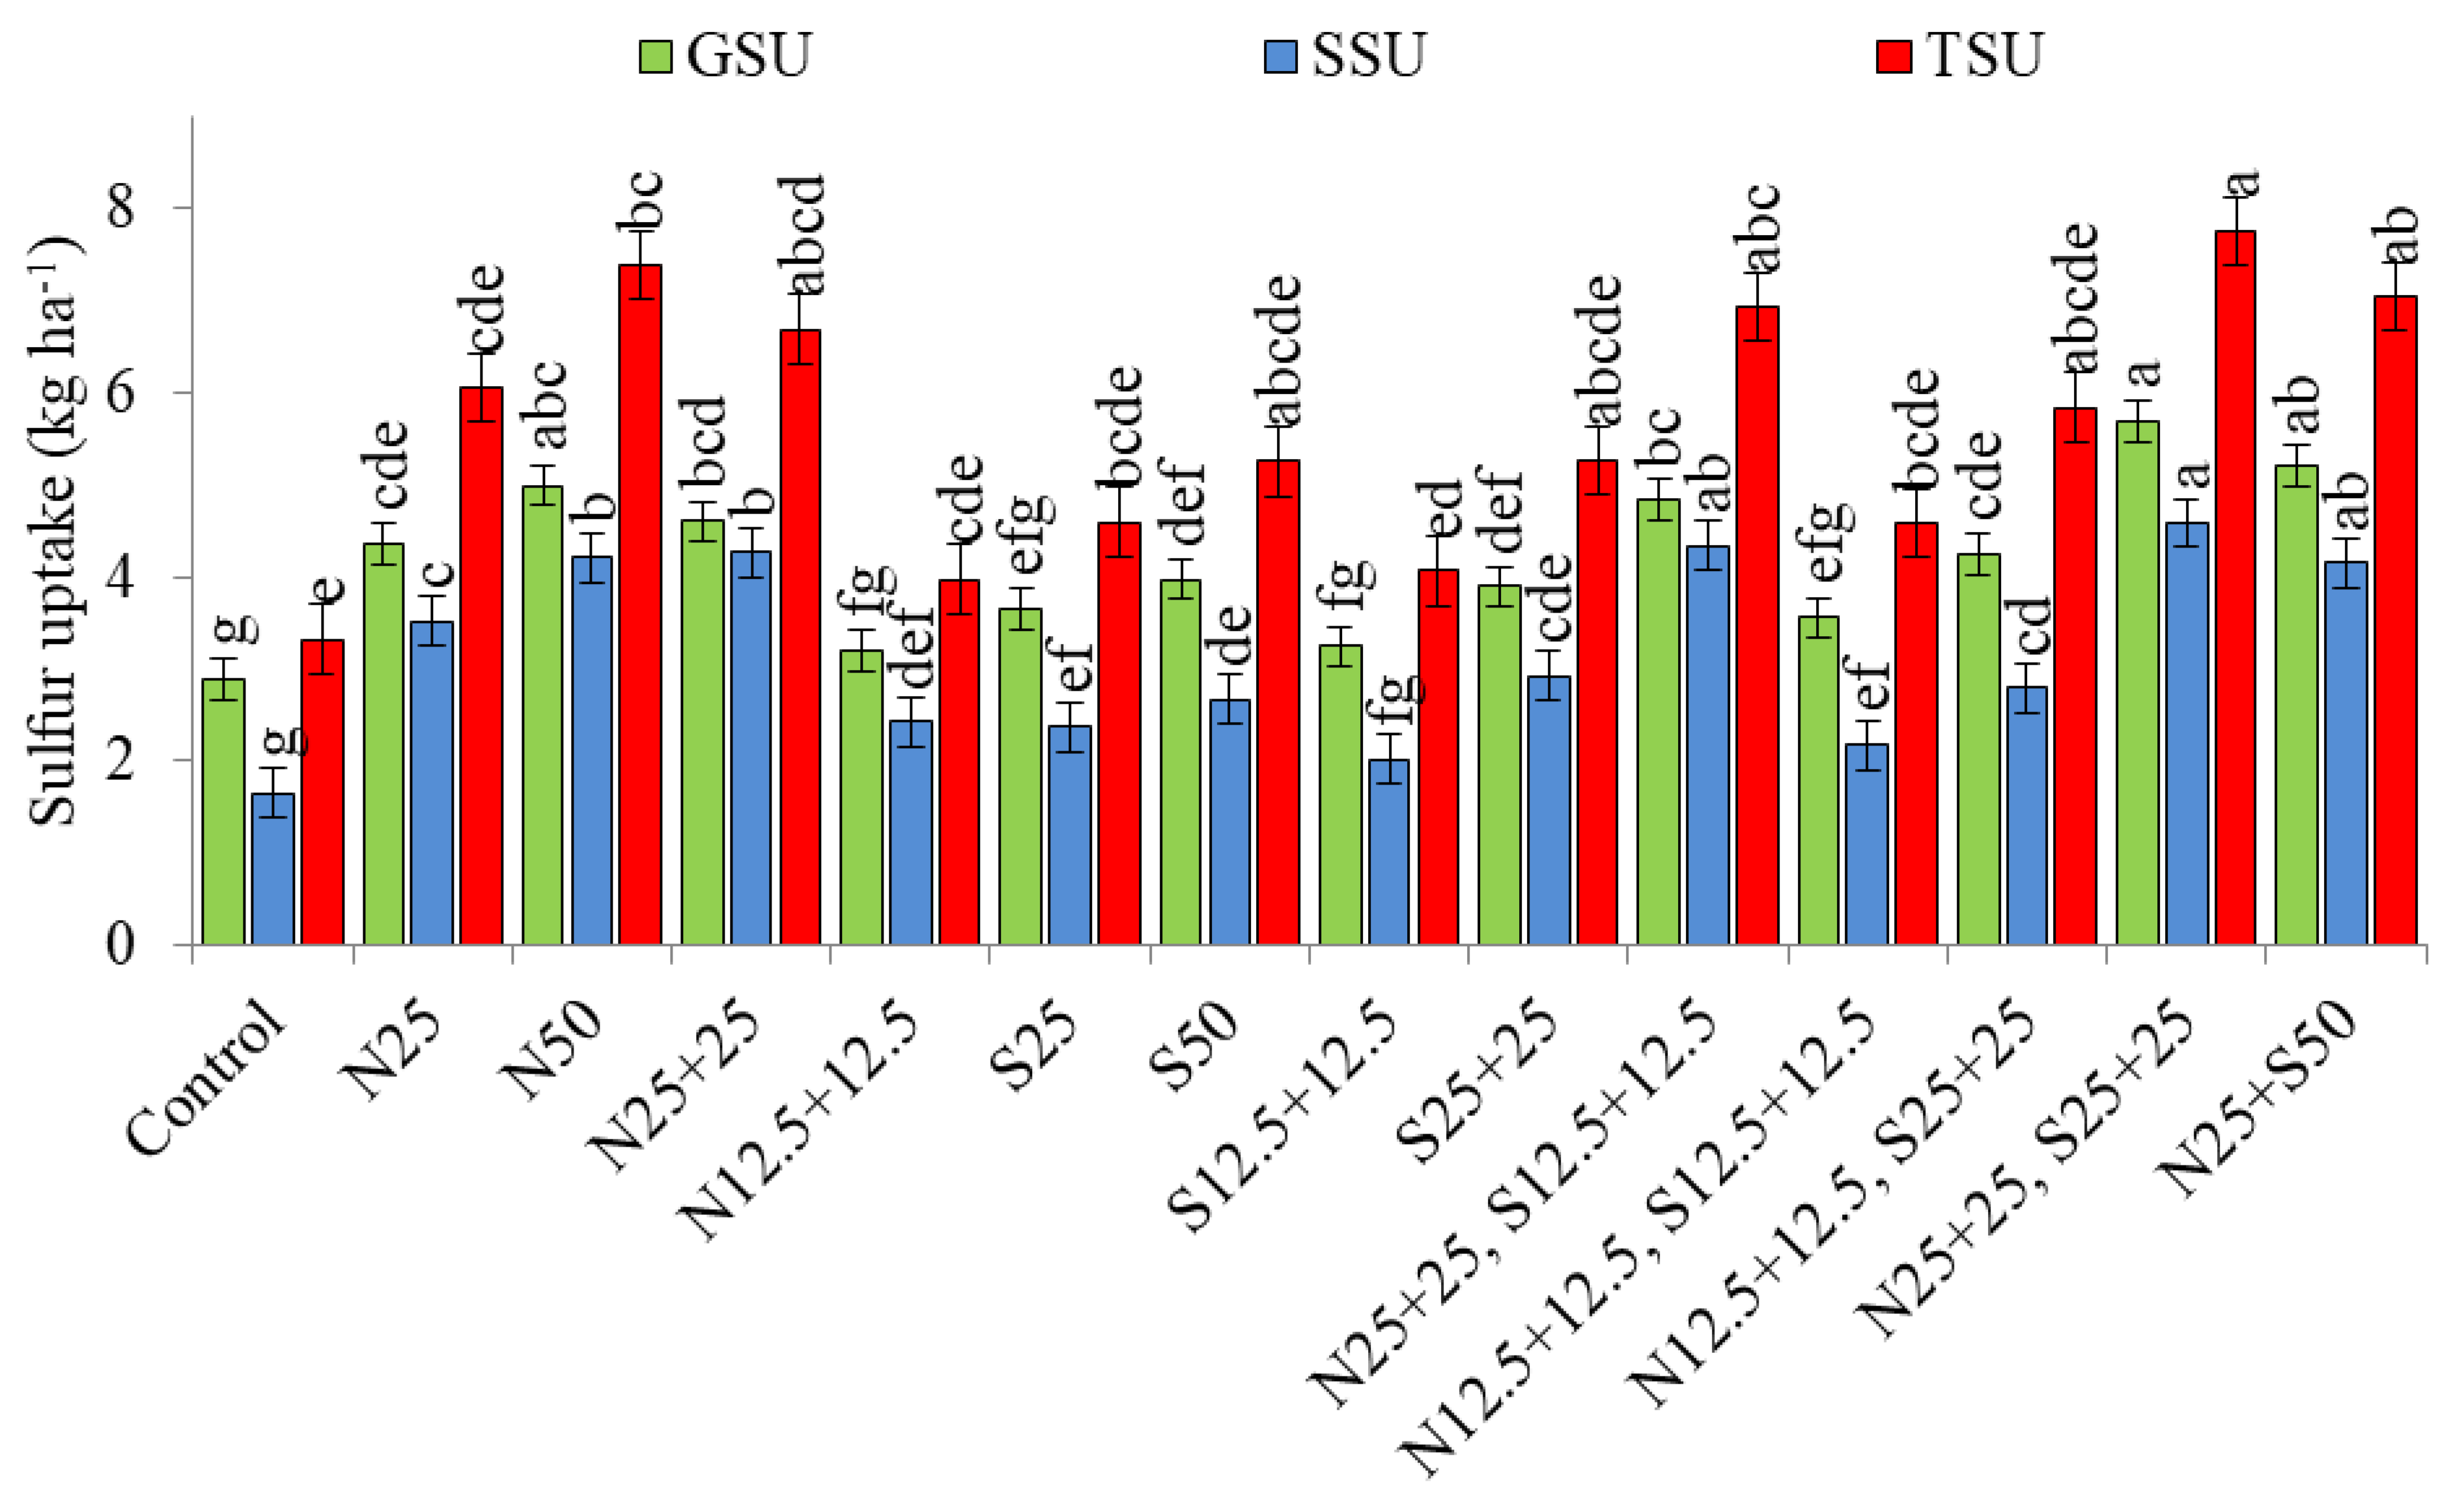
3.1. Nutrient Uptake (kg ha−1)

Seed, straw, and total N and S uptake by soybean markedly increased with various basal doses and split N and S synchronizations (Figure 2 and Figure 3). The results revealed that the highest seed, straw, and total N assimilation by soybeans were achieved when N and S were each applied in two splits at 25 kg ha−1 as a basal dose and 25 kg ha−1 split application at the R2 stage of soybean growth. This did not statistically differ from treatments with 50 kg ha−1 N application as the basal dose; 25 kg ha−1 N as basal and split application at the R2 stage with 12.5 kg ha−1 S as the basal dose and split application at the R2 stage, or 25 kg ha−1 N plus 50 kg ha−1 S as the basal doses. However, these results significantly differed from those obtained with the other treatment combinations in this study, including the control. The lowest seed, straw, and total N and S absorption were observed with no N and S applications (control). The study observed substantial increases in N uptake across various components of the soybean plant. Specifically, there was an 85.0% increase in N uptake by seeds, a 67.3% increase in N uptake by straw, and an overall 81.0% increase in total N uptake compared to the control. Similarly, the results also indicated that S uptake by seeds, straw, and total absorption significantly varied with various basal and split applications of N and S. The highest seed, straw, and total uptake of S was observed with the application of N and S in two splits at 25 kg ha−1 as the basal dose and 25 kg ha−1 split application at the R2 stage. This did not significantly vary with the application of 25 kg ha−1 N plus 50 kg ha−1 S as the basal doses; or 12.5 kg ha−1 N plus 12.5 kg ha−1 N, 25 kg S ha−1 plus 25 kg S ha−1 as the basal and split at the R2 stage. The lowest seed, straw, and total uptake of S was observed in the control plots. Compared to the control, there was a significant enhancement in S uptake across various components of the soybean plant. Specifically, S uptake by seeds increased by 96.5%, while uptake by straws substantially rose to 177.5%. Overall, total S absorption exhibited a significant increase of 133.4% compared to the control.

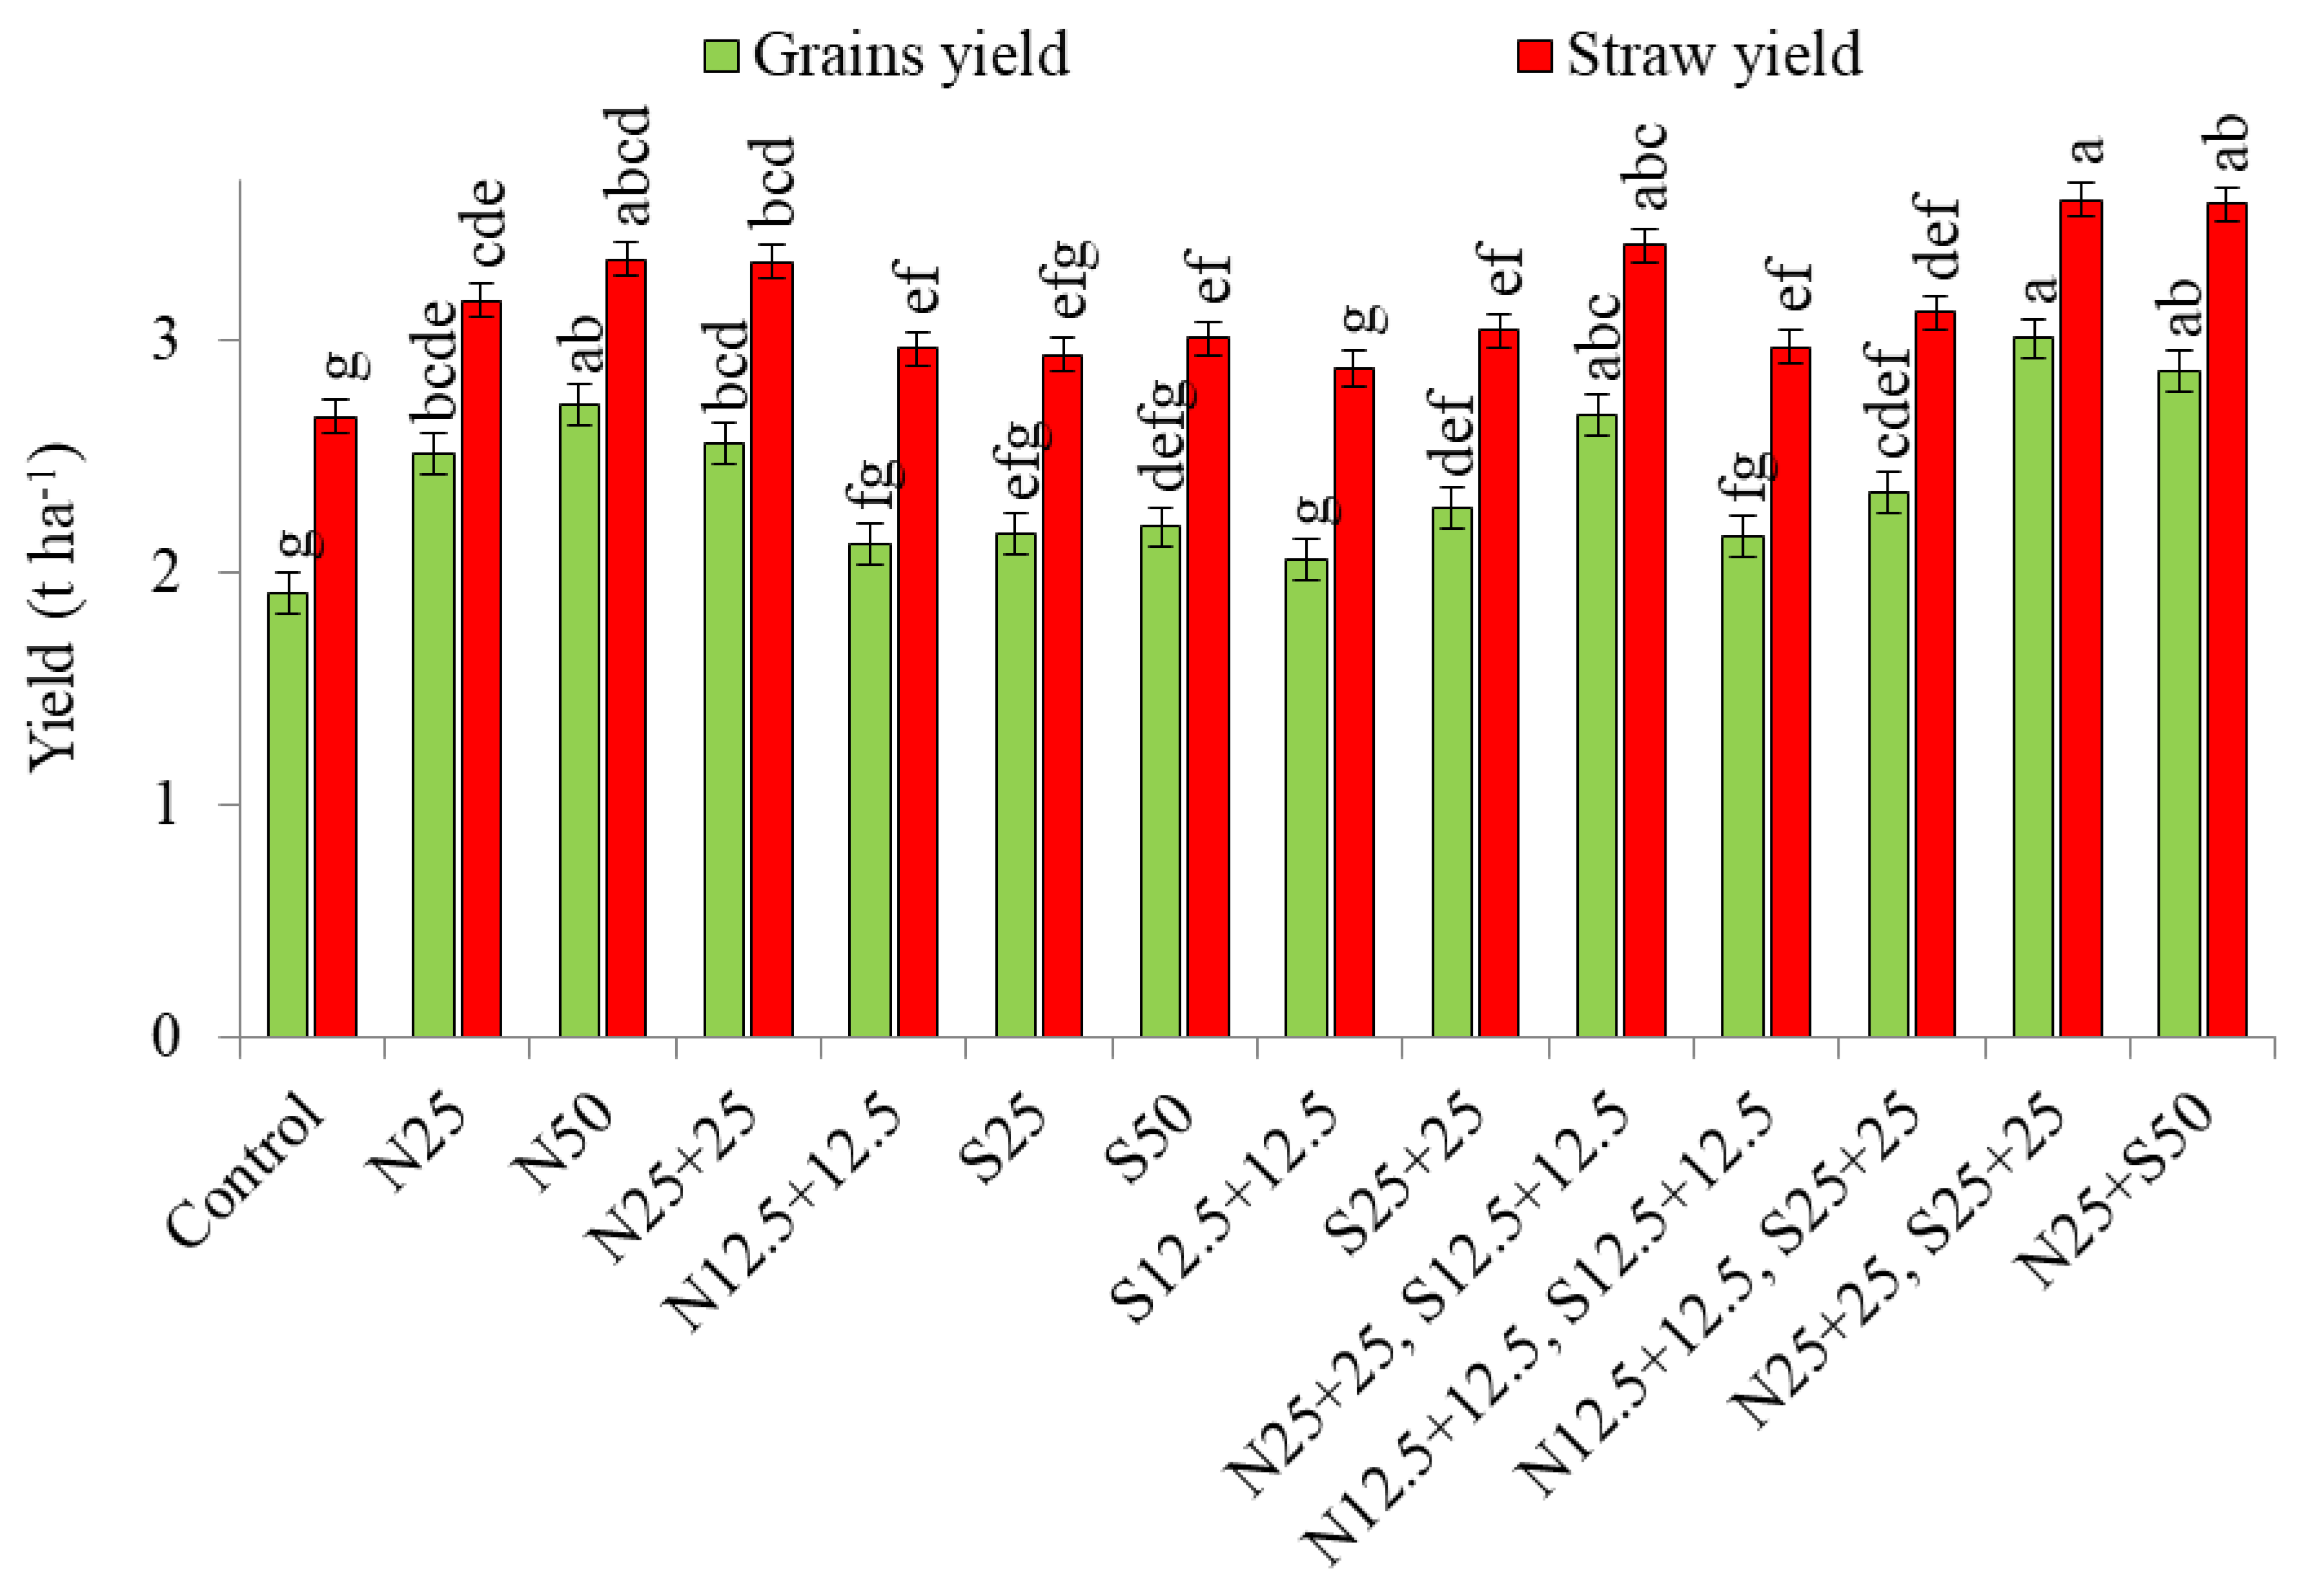
3.2. Seed and Straw Yield (mg ha−1)

The data indicated that both seed and straw yields of soybeans were significantly affected by basal and split N and S applications alone, as well as by combined application treatments (Figure 4). The application of N and S at 25 kg ha−1 each in two splits as the basal doses and split applications at the R2 stage produced the highest seed yield, which was statistically similar to treatments with 25 kg ha−1 N as the basal dose and split application at the R2 stage with 12.5 kg S as the basal dose and split at the R2 stage; 25 kg ha−1 N plus 50 kg ha−1 S as the basal doses; and 50 kg ha−1 N as the basal dose alone. However, it significantly differed from other basal and split N and S applications, as well as from treatments with no N and S applications. The control plots produced the lowest seed yield. Similarly, the lowest straw yield of soybeans was obtained from the control treatment, where no N and S fertilizers were applied (Figure 4). N and S fertilization significantly increased the straw yield of soybean. The most beneficial effects were observed in the treatments where N and S were applied at the rate of 25 kg ha−1 each in two splits as the basal doses and split applications at the R2 stage, which was statistically similar to treatments with 25 kg ha−1 N plus 50 kg ha−1 S as the basal doses; and 50 kg ha−1 N as the basal dose alone. However, it significantly varied from other treatment combinations. The findings indicated a considerable improvement in both the seed and straw yield of soybean with the application of N and S. Specifically, there was a notable increase of 56.9% in seed yield and a significant rise of 34.8% in straw yield compared to the control group.

3.3. Zn and Fe Content of Seeds and Soil (mg kg−1)

The seed and soil Zn and Fe content were significantly enhanced with different basal and split applications of N and S (Table 2). The results indicate that the split application of N and S (N25+25, S25+25) significantly increased soil Zn and Fe content at the R2 and R5 stages of soybean crop growth. This was statistically similar to N and S fertilization with (N25+25, S12.5+12.5) and (N12.5+12.5, S25+25) as the basal dose and split application at the R2 stage. However, the lowest soil Zn and Fe contents were estimated from the control. Likewise, the split N and S application (N25+25, S25+25) as the basal doses and split applications at the R2 stage significantly increased the seed Zn and Fe content. The lowest seed Zn and Fe contents were found in the control group. Moreover, significant improvements were observed in the Zn and Fe content of soybean seeds with the application of N and S compared to the control group. Specifically, there was a notable increase of 41.0% in the seed Zn content and a substantial rise of 68.8% in the seed Fe content of soybeans.

3.4. Nutrient Use Efficiency

The basal and split N and S applications significantly influenced the efficiency indexes during the study year (Table 3). The highest agronomic use efficiency was recorded with the treatment of 25 kg ha−1 N plus 50 kg ha−1 S as the basal dose (N25+S50) at the time of sowing, while the highest use efficiency for S was recorded with 25 kg ha−1 N along with 12.5 kg ha−1 S (N25+25,S12.5+12.5) as the basal dose and split at the R2 stage. The maximum apparent N recovery was noted with the application of 25 kg ha−1 N plus 50 kg ha−1 S (N25+S50) as the basal doses, followed by 25 kg ha−1 N (N25) as the basal dose alone. Similarly, for S, the highest recovery was observed with 25 kg ha−1 N along with 12.5 kg ha−1 S (N25+25,S12.5+12.5) each in two splits as the basal doses and split at the R2 stage, followed by treatments where 25 kg ha−1 N and S were individually applied in two splits as the basal doses and split applications at the R2 stage; and 25 kg ha−1 N plus 50 kg ha−1 S as the basal doses. A parallel trend was observed regarding physiological use efficiencies. The highest physiological efficiency for both N and S was calculated with 25 kg ha−1 N plus 50 kg ha−1 S (N25+S50) as the basal doses. The results obtained for crop productivity, uptake, and use efficiencies can be attributed to the synergistic effect of N and S fertilizer applications.

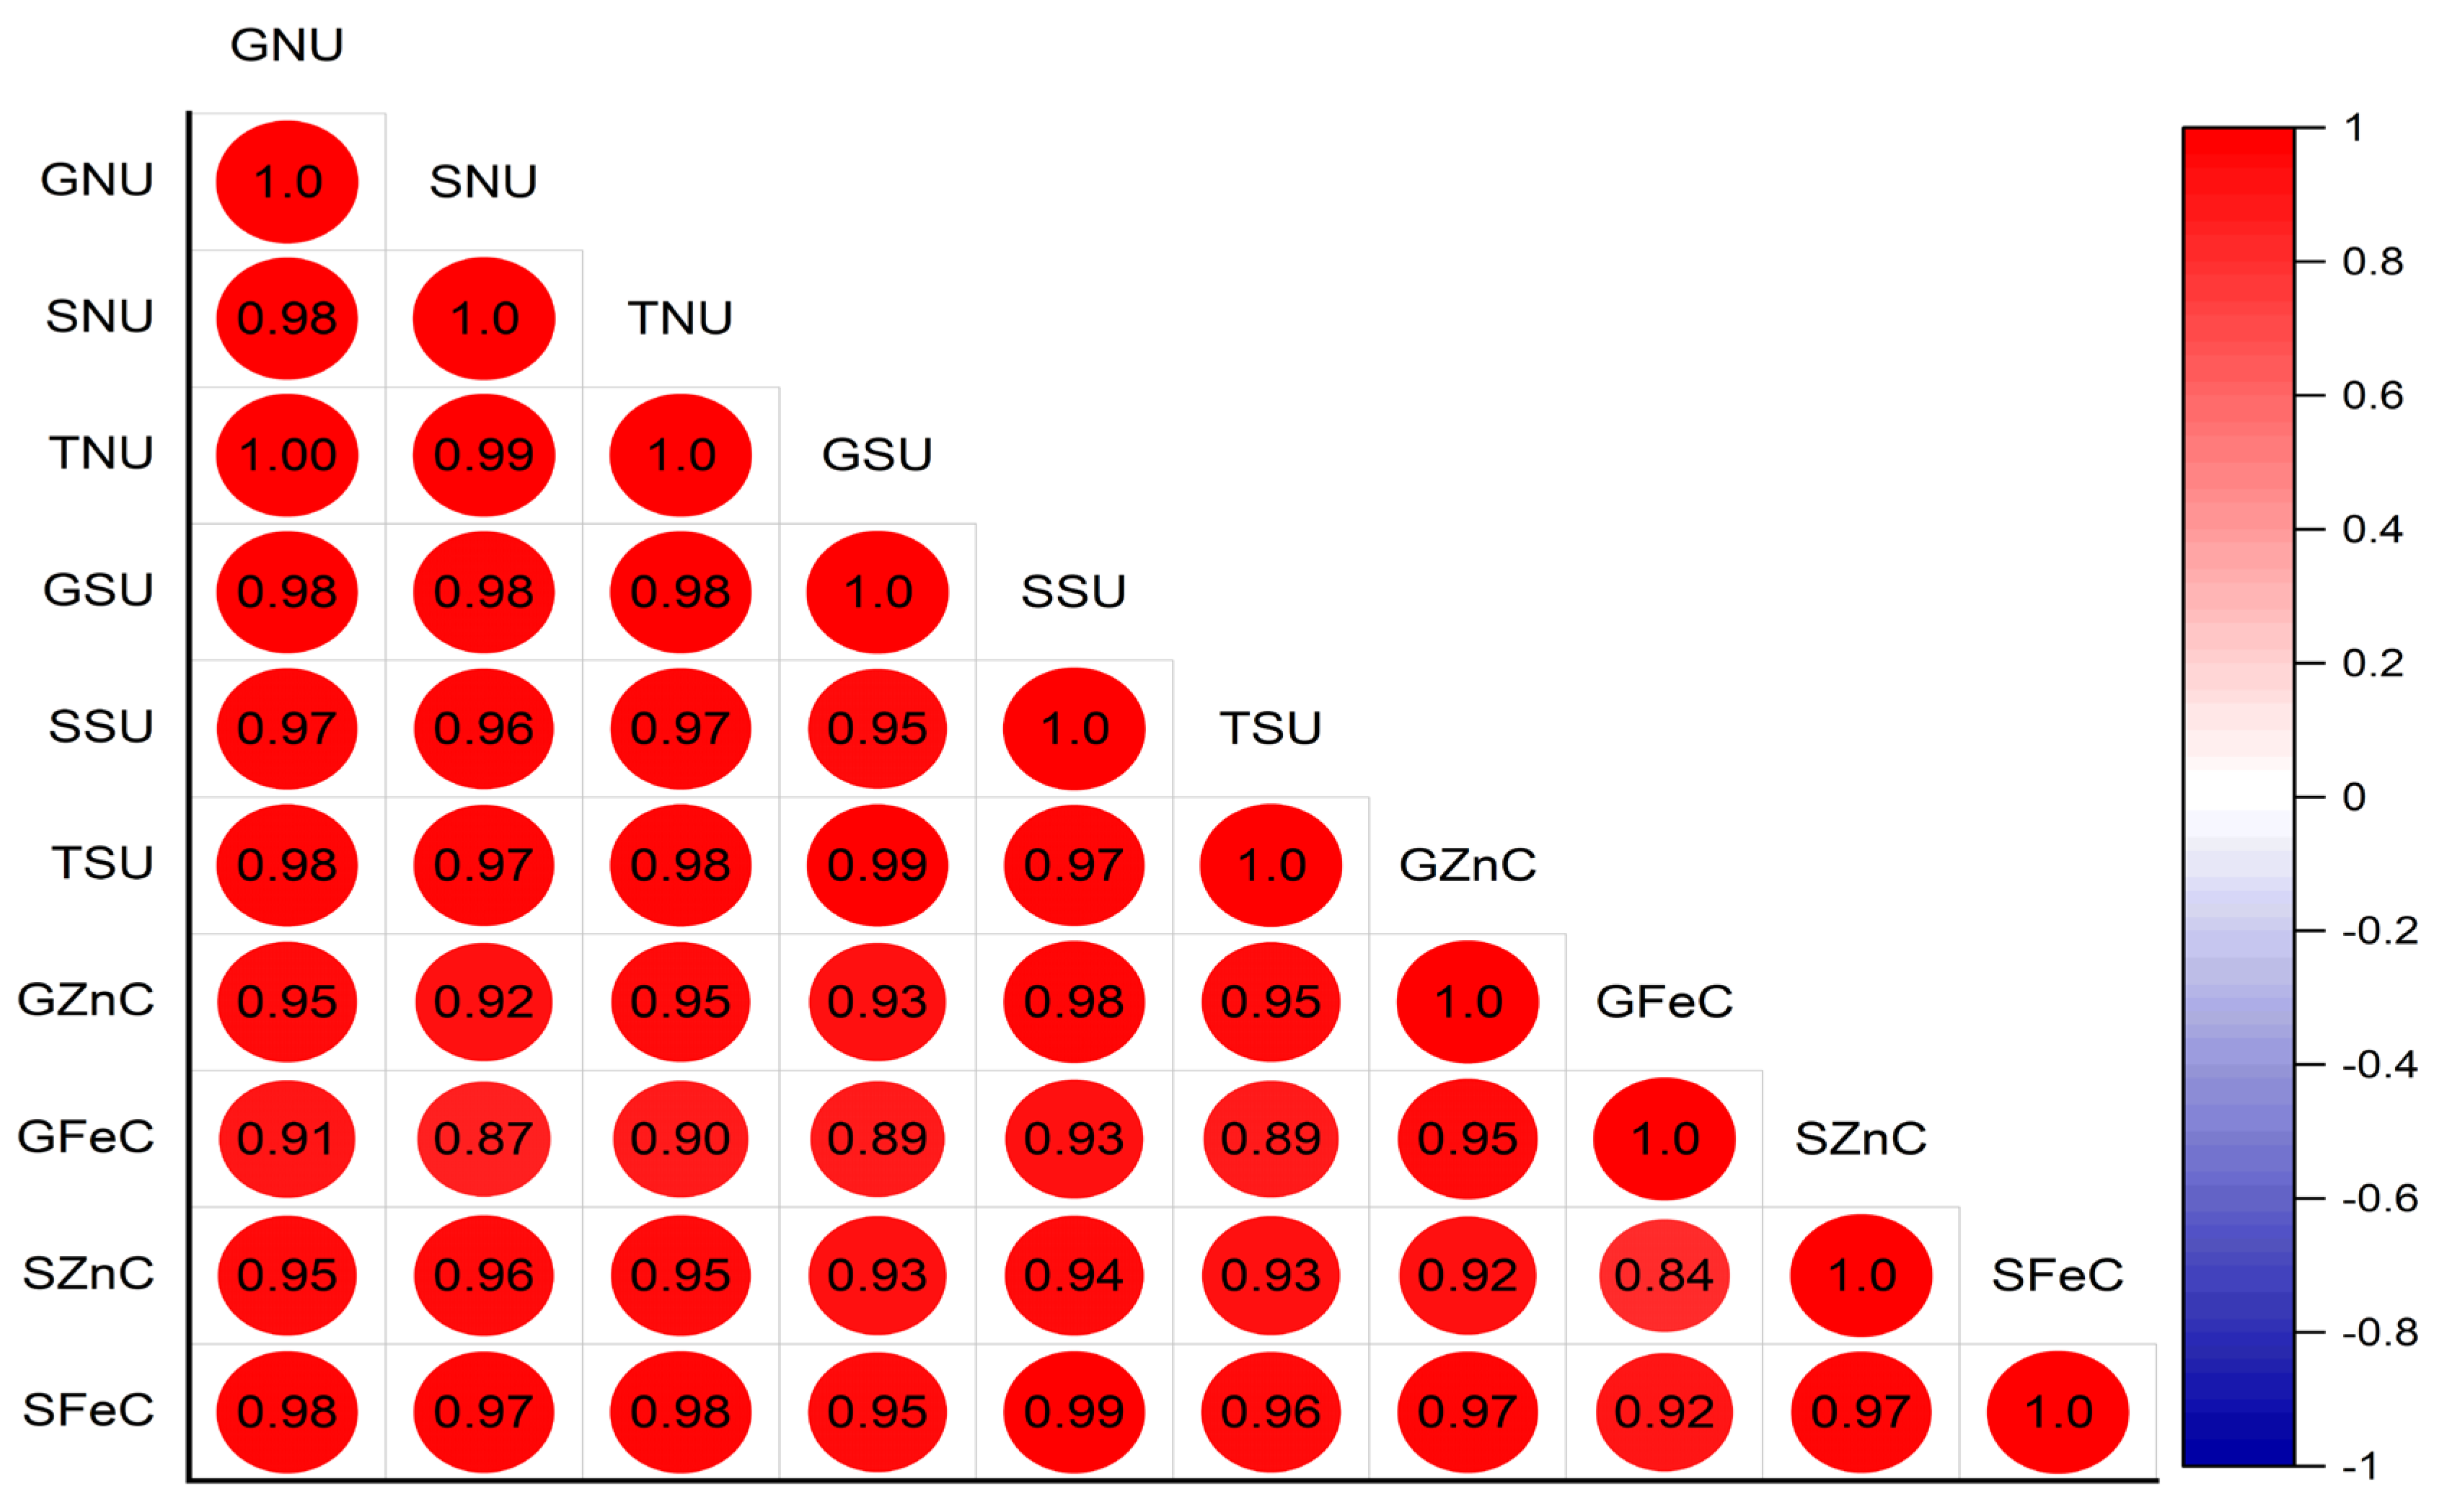
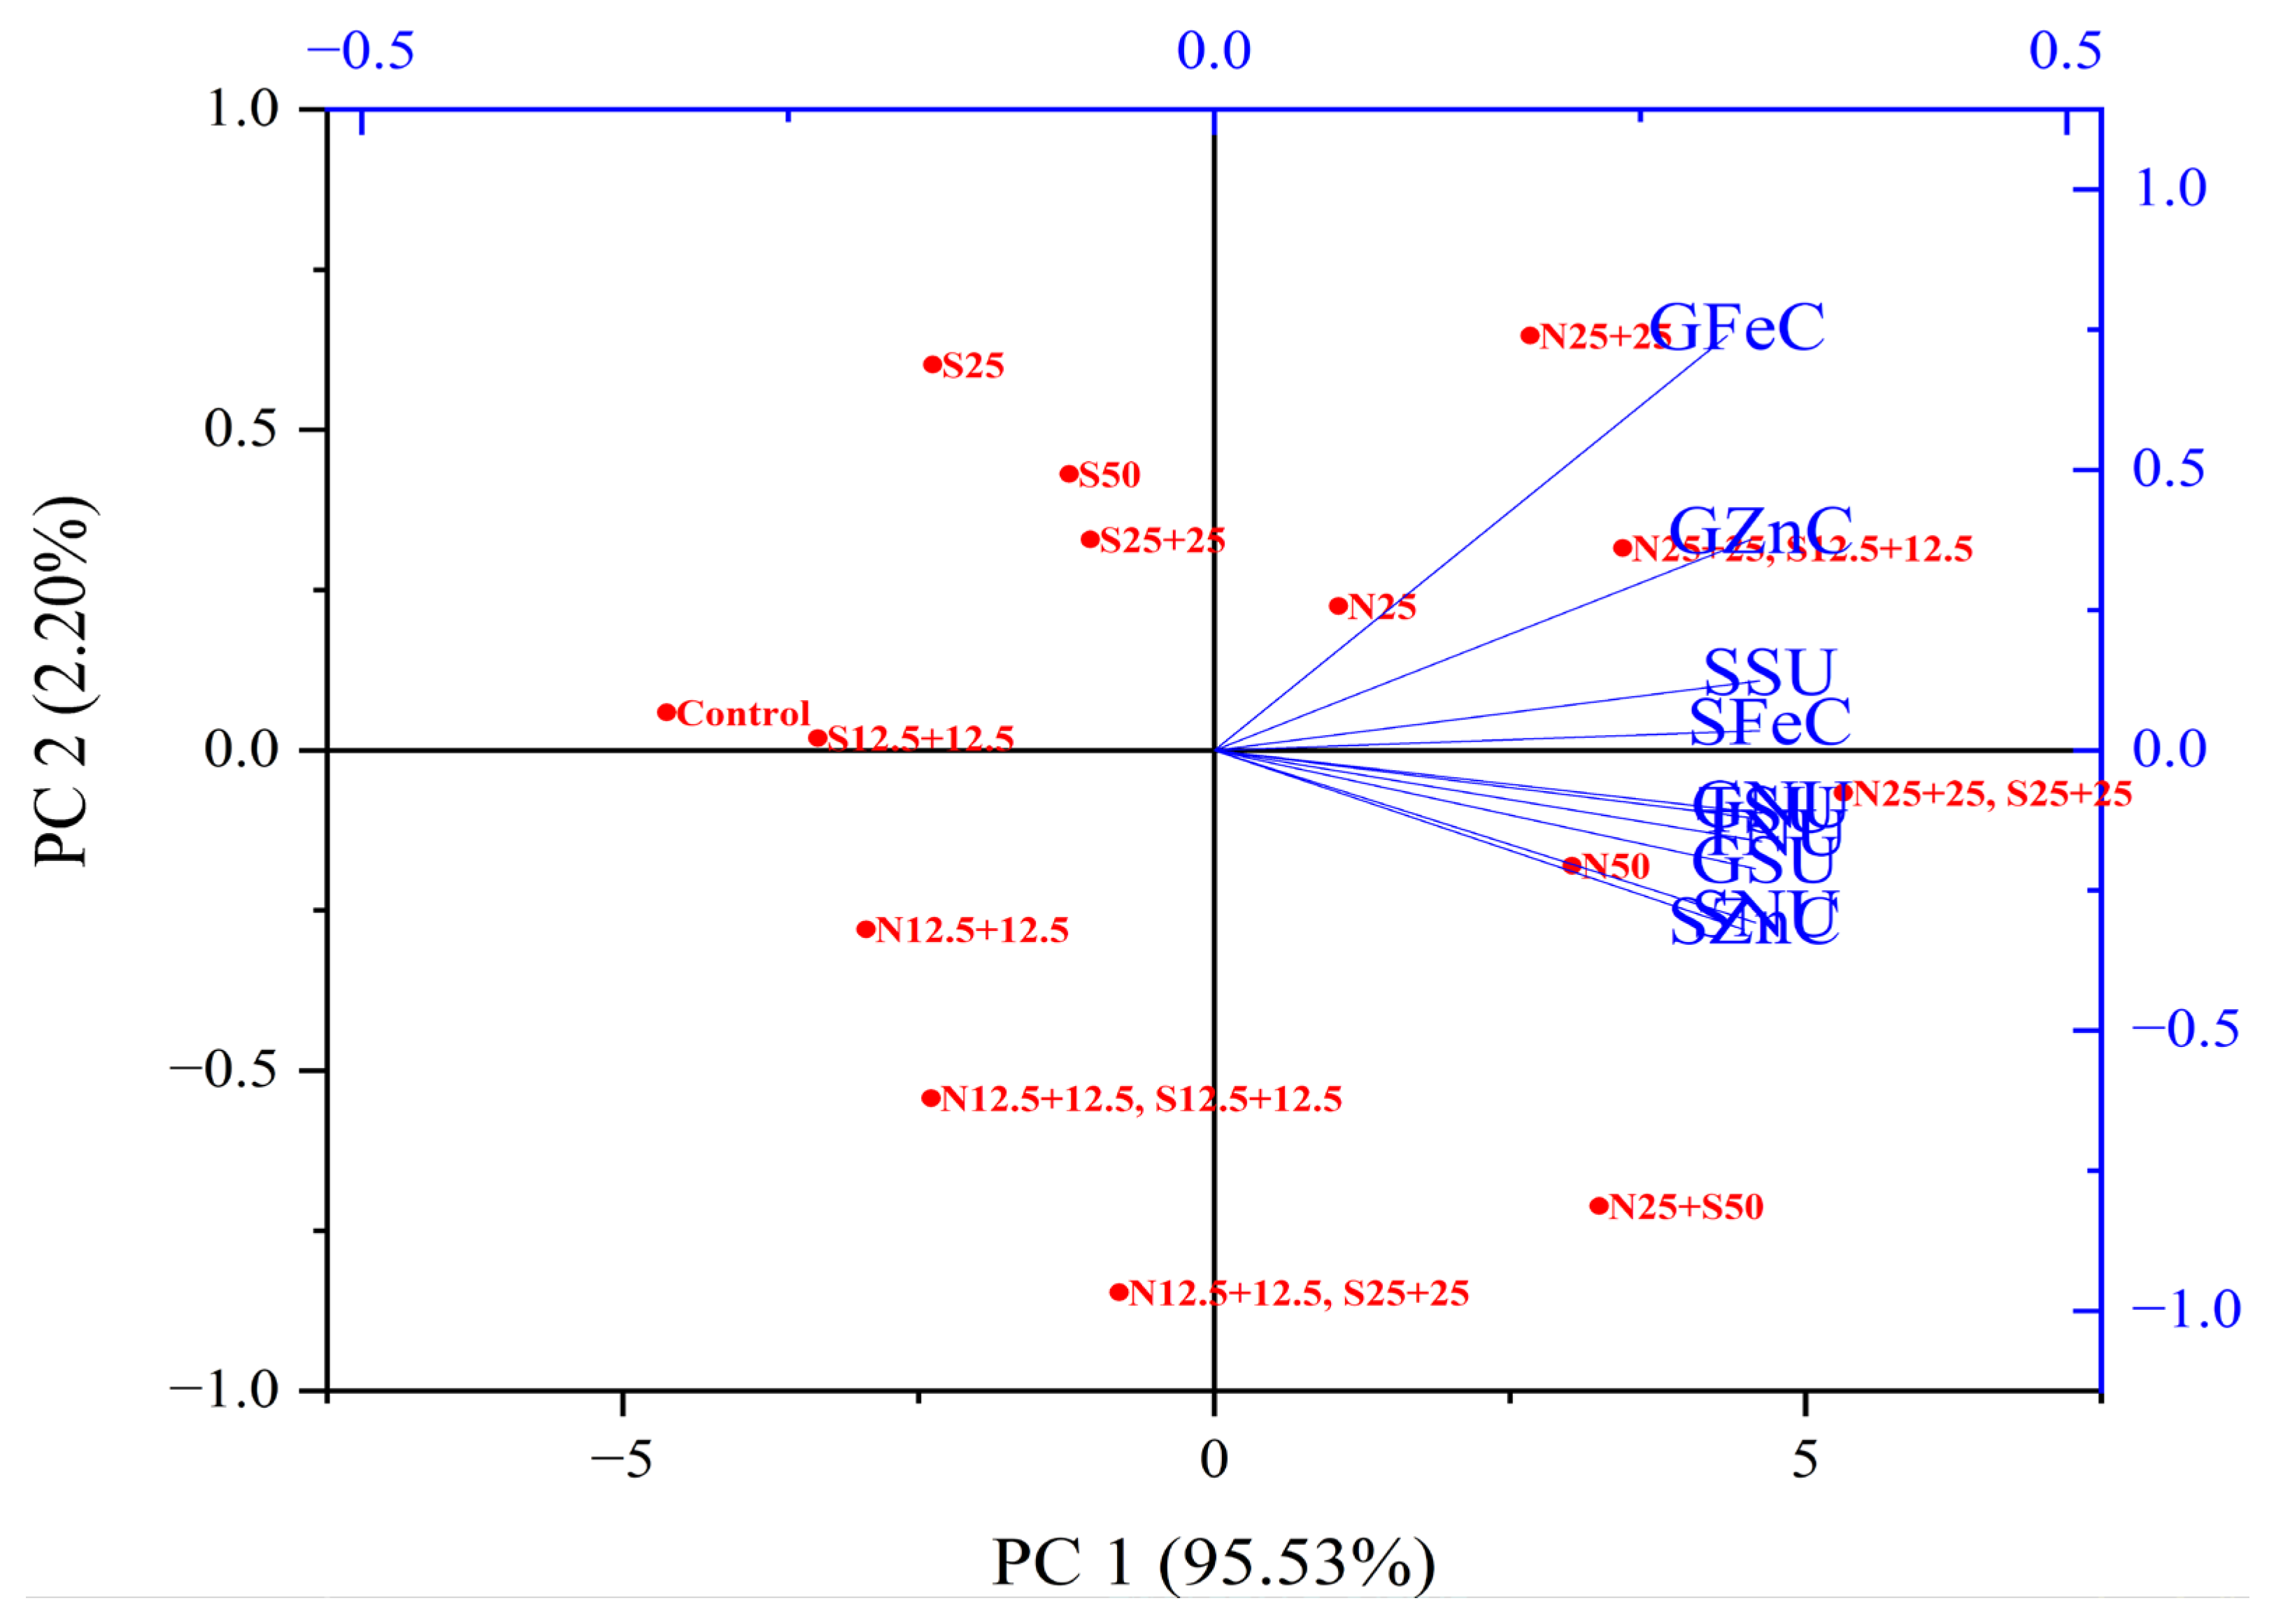
3.5. Pearson Correlation and Principal Component Analysis (PCA)

The correlation analysis results revealed a significant strong positive correlation between numerous N, S, Zn, and Fe uptakes through the seeds and straws of soybean, as well as Zn and Fe contents in the soil (Figure 5). Notably, strong positive correlations were observed between seed N uptake, and both straw N uptake (0.98) and total N uptake (0.99), indicating a high degree of association between these variables. Similarly, substantial positive correlations were found within S- and Zn-related variables. For instance, seed S uptake shows a notable positive correlation with straw S uptake (0.95) and total S uptake (0.98). Furthermore, the strong positive correlation among the seed Zn content and soil Zn content (0.94) reflects the interconnectedness of plant and soil Zn levels. These correlation coefficients provide valuable insights into the interdependencies among different nutrient content and uptake parameters. Principal component analysis (PCA) for the studied traits revealed that a strong association exists among nutrient uptake by both plant and soil (Figure 6). In this case, PC1 is primarily influenced by positive contributions from seed N uptake, straw N uptake, total N uptake, seed S uptake, straw S uptake, total S uptake, seed Zn content, soil Zn content, and straw Fe content. Among these, the highest positive coefficients are associated with seed N uptake, total N uptake, and seed S uptake. These variables contribute positively to the overall variability captured by PC1. On the other hand, PC2 is characterized by negative contributions from most variables, with notable positive contributions from the seed Fe content and seed Zn content. Specifically, the seed Fe content has the highest positive coefficient, indicating its strong influence on the second principal component. PC2 captures additional variability in the dataset, orthogonal to PC1, and is dominated by the contrasting effects of the seed Fe content and seed Zn content. In summary, the PCA results suggest that PC1 is influenced by a broad range of variables, while PC2 is particularly sensitive to the contrasting effects of the seed Fe content and seed Zn content. These principal components provide a more concise representation of the original variables, capturing the essential patterns and relationships within the data.

4. Discussion

The experiment was based on the hypothesis that the basal and split applications of N and S increase nutrient uptake through seeds, straws, and total uptake, productivity, use efficiencies, and micronutrient uptake in soybeans. Soybeans, owing to their high protein and oil content, require substantial amounts of N and S. While soybean can partially meet its N requirement through atmospheric N fixation, supplementation with both N and S is crucial for optimal growth. The findings showed that the split applications of N and S fertilizers significantly enhanced the seed, straw, and total absorption of N and S in soybeans (Figure 2 and Figure 3). The positive results of the split application at a later crop stage indicate improved nutrient content and uptake. The reported findings align with those of [28,29], who observed an increased total uptake of N and S in soybeans with the applications of N and S. The maximum daily N uptake rates during the R4 to R5 growth stages were observed by [18], while [19] measured a higher daily N uptake rate (4.6 kg ha−1) at the R4 growth stage. According to [30], in soybeans, only up to 52% of total N uptake originates from symbiotic N fixation, with the remaining N requirement coming from nitrates taken up from the soil. The plants remobilize N from leaves to seeds, reducing photosynthesis and limiting yield potential if total N supply does not meet soybean needs [31]. Numerous researchers, including [3,32,33,34,35], found that basal and split N and S applications increased soybean seed yield, a result confirmed by the current study (Figure 4). Our findings agreed with [29], who reported significantly higher soybean seed yield with N application. Split N and S applications enhanced seed yield compared to the control group, attributed to increased root system activity, photosynthesis rate, and maximum leaf area index [4,36,37,38]. Soybeans exhibit a high N demand, particularly during the seed-filling stage. Supplying N from existing resources supplements this demand, preventing premature aging of plants during this stage, and as a result, enhanced seed yield [24,39]. The experiment also indicated that split N and S application also significantly improved the soil Zn and Fe content at the R2 and R5 stages of soybean growth (Table 2). Similarly, a significant increase in DTPA extractable Zn in the soil was recorded with doses and sources of S compared to the control [40]. The seed and straw Zn and Fe contents were enhanced with the split application of N and S compared to no N and S applications (Table 2). N fertilization is recognized to increase the grain yield of wheat and facilitate a greater uptake of Fe and Zn by grains [20,41]. Similarly, [19] emphasized the critical role of N in the absorption and uptake of Zn in crops, highlighting its importance in biofortification, particularly with Zn, in food crops. During the anthesis stage, when Zn supply is withheld, the process of Zn remobilization from sources existing prior to anthesis becomes highly reliant on N supply, contributing significantly to the Zn content in nearly all seeds [20]. The embryo and aleurone layers of wheat seeds, indicating that the highest grain protein content stored higher amounts of Zn and Fe, were identified in grains [23]. Augmenting the availability of Zn and N exhibited a substantial effect on the accrual of Zn within the endosperm, achieving concentrations that exceeded the current benchmarks established in breeding objectives [21,23]. This suggests that N and S application can contribute to the biofortification of soybean seeds. Agronomic biofortification, recognized as a potent strategy for addressing micronutrient deficiency in plants [22], underscores the significance of N supply as a crucial element in augmenting the levels of Zn and Fe in crops [42]. Nfertilization is known to not only increase wheat grain yield, but also to facilitate the uptake of Fe and Zn by wheat grain [41,43]. The uptake and transport of Fe and Zn to grain is probably facilitated by metal-chelating compounds [44], such as 2-deoxymugineic acid (DMA), primarily for the translocation of Fe and Zn from the flag leaves to grain in wheat [45]. Kutman et al. [46] reported that N nutrition is critical for both the uptake and translocation of Zn and Fe to wheat grain, and they showed that at a high N rate, nearly 80% and 60% of total shoot Zn and Fe, respectively, were harvested with grain. Improving the N status of plants from low to sufficient resulted in a threefold increase in the shoot Fe content of wheat plants [47]. Similarly, Erenoglu et al. [20] demonstrated that N is a critical player in the uptake and accumulation of Zn in plants and thus deserves special attention in the biofortification of food crops with Zn. The highest agronomic use efficiency, apparent N recovery, and physiological efficiency were also found with the split application of N and S in this study (Table 3). N use efficiency, which involves the transformation of available N into seed yield, showed decreasing efficiency with increasing N fertilizer rates [8,12,48], likely because limiting factors like the presence of additional nutrients or increased N fertilizer losses can influence the agricultural system. S fertilization not only amplifies the impact of N, but also plays a role in soil processes, enhancing the crop’s N use efficiency. This enhancement is credited to a higher N recovery rate without alterations in internal efficiency [11,16]. The apparent interconnectedness of N and S underscores the rationale for a comprehensive examination of the combined effects of these essential nutrients. The addition of S improved the N recovery efficiency and agronomic efficiency of available N in poor-fertility environments characterized by a deficiency of N and S [17]. While our findings suggest promising outcomes, the one-year duration of this study, particularly when dealing with large-scale quantitative measurements, presents a significant limitation. Further research is necessary to comprehensively validate these results, especially concerning the assessment of their long-term impact. Additionally, it is crucial to conduct studies across varied environments to evaluate factors such as crop productivity, soil health, and economic feasibility. These insights will be instrumental in informing sustainable agricultural practices moving forward.

5. Conclusions

The study findings indicate that the application of Nand Sas basal doses, combined with split application during the R2 growth stage of soybean, led to significant improvements in nutrient uptake, yield, agronomic use efficiency, and seed Zn and Fe content. This combined approach emerged as the most effective in achieving favorable outcomes. Based on the study findings, it is suggested to implement a combined N and S application strategy for soybean cultivation. Specifically, applying 25 kg ha−1 of each N and S in two splits as the basal doses, along with a split application at the R2 growth stage, can maximize total N and S uptake, leading to higher seed and straw yields. This approach also enhances agronomic use efficiency, particularly with the application of 25 kg ha−1 N plus 50 kg ha−1 S as the basal doses. Additionally, split N and S applications contribute to increased soil Znand Fe content during key growth stages, potentially biofortifying soybean seeds and addressing micronutrient deficiencies. Overall, implementing this nutrient management strategy can enhance crop productivity, nutrient uptake, use efficiency, and seed nutritional content in soybean cultivation. Further research is needed to validate these findings across different environments and assess long-term impacts on crop productivity, soil health, and economic feasibility.

Author Contributions

A.K. (Azizullah Khalili) conducted the research study, compiled the data, and completed the write-up. A.K. (Ahlam Khalofah) collected reviews of the literature and secured funding. A.R. and M.P.S. helped in the analysis of data and supervised the research work. All authors have read and agreed to the published version of the manuscript.

Funding

The authors extend their appreciation to the Deanship of Scientific Research at King Khalid University for publication funding this work through the large-group research project under grant number RGP2/280/44.

Data Availability Statement

The data presented in this study are available upon request from the corresponding authors.

Conflicts of Interest

The authors declare no conflicts of interest.

References

  1. Wilson, R.F. Soybean: Market Driven Research Needs. In Genetics and Genomics of Soybean; Springer: New York, NY, USA, 2008; pp. 3–15. [Google Scholar]
  2. Mahmoud, A.A.; Natarajan, S.S.; Bennett, J.O.; Mawhinney, T.P.; Wiebold, W.J.; Krishnan, H.B. Effect of Six Decades of Selective Breeding on Soybean Protein Composition and Quality: A Biochemical and Molecular Analysis. J. Agric. Food Chem. 2006, 54, 3916–3922. [Google Scholar] [CrossRef]
  3. Khalili, A.; Dhar, S.; Mohammadi, M.; Rasooli, M. Effect of nitrogen on yield and yield attributes of soybean in Kunar, Afghanistan. E-Planet 2021, 19, 46–49. [Google Scholar]
  4. Khalili, A.; Ramesh, A.; Sharma, M.P. Effect of nitrogen and sulfur applications on growth, chlorophyll content and yield of soybean (Glycine max L.) Merrill. E-Planet 2023, 21, 29–34. [Google Scholar]
  5. Luo, C.; Branlard, G.; Griffin, W.B.; McNeil, D.L. The effect of nitrogen and sulphur fertilisation and their interaction with genotype on wheat glutenins and quality parameters. J. Cereal Sci. 2000, 31, 185–194. [Google Scholar] [CrossRef]
  6. Yu, Z.; Juhasz, A.; Islam, S.; Diepeveen, D.; Zhang, J.; Wang, P.; Ma, W. Impact of mid-season sulphur deficiency on wheat nitrogen metabolism and biosynthesis of grain protein. Sci. Rep. 2018, 8, 2499. [Google Scholar] [CrossRef]
  7. Bellaloui, N.; Bruns, H.A.; Abbas, H.K.; Mengistu, A.; Fisher, D.K.; Reddy, K.N. Agricultural practices altered soybean seed protein, oil, fatty acids, sugars, and minerals in the Midsouth USA. Front. Plant Sci. 2015, 6, 1–14. [Google Scholar] [CrossRef]
  8. Sinclair, T.R.; de Wit, C.T. Analysis of the Carbon and Nitrogen Limitations to Soybean Yield. Agron. J. 1976, 68, 319–324. [Google Scholar] [CrossRef]
  9. Giller, K.E.; Cadisch, G. Future Benefits from Biological Nitrogen Fixation: An Ecological Approach to Agriculture. In Management of Biological Nitrogen Fixation for the Development of More Productive and Sustainable Agricultural Systems, Extended versions of papers presented at the Symposium on Biological Nitrogen Fixation for Sustainable Agriculture at the 15th Congress of Soil Science, Acapulco, Mexico, 1994; Springer: Berlin/Heidelberg, Germany, 1995; pp. 255–277. [Google Scholar]
  10. Cassman, K.G.; Dobermann, A.; Walters, D.T. Agroecosystems, nitrogen-use efficiency, and nitrogen management. Ambio. A J. Hum. Environ. 2002, 31, 132–140. [Google Scholar] [CrossRef]
  11. Salvagiotti, F.; Castellarín, J.M.; Miralles, D.J.; Pedrol, H.M. Sulfur fertilization improves nitrogen use efficiency in wheat by increasing nitrogen uptake. Field Crop. Res. 2009, 113, 170–177. [Google Scholar] [CrossRef]
  12. Timsina, J.; Connor, D. Productivity and management of rice–wheat cropping systems: Issues and challenges. Field Crop. Res. 2001, 69, 93–132. [Google Scholar] [CrossRef]
  13. Salvagiotti, F.; Cassman, K.; Specht, J.; Walters, D.; Weiss, A.; Dobermann, A. Nitrogen uptake, fixation and response to fertilizer N in soybeans: A review. Field Crop. Res. 2008, 108, 1–13. [Google Scholar] [CrossRef]
  14. Scheerer, U.; Haensch, R.; Mendel, R.R.; Kopriva, S.; Rennenberg, H.; Herschbach, C. Sulphur flux through the sulphate assimilation pathway is differently controlled by adenosine 5′-phosphosulphate reductase under stress and in transgenic poplar plants overexpressing γ-ECS, SO, or APR. J. Exp. Bot. 2009, 61, 609–622. [Google Scholar] [CrossRef]
  15. Ingenbleek, Y.; Kimura, H. Nutritional essentiality of sulfur in health and disease. Nutr. Rev. 2013, 71, 413–432. [Google Scholar] [CrossRef]
  16. Salvagiotti, F.; Miralles, D.J. Radiation interception, biomass production and grain yield as affected by the interaction of nitrogen and sulfur fertilization in wheat. Eur. J. Agron. 2008, 28, 282–290. [Google Scholar] [CrossRef]
  17. Arata, A.F.; Lerner, S.E.; Tranquilli, G.E.; Arrigoni, A.C.; Rondanini, D.P. Nitrogen× sulfur interaction on fertiliser-use efficiency in bread wheat genotypes from the Argentine Pampas. Crop Pasture Sci. 2017, 68, 202–212. [Google Scholar] [CrossRef]
  18. Gaspar, A.P.; Laboski, C.A.; Naeve, S.L.; Conley, S.P. Dry Matter and Nitrogen Uptake, Partitioning, and Removal across a Wide Range of Soybean Seed Yield Levels. Crop. Sci. 2017, 57, 2170–2182. [Google Scholar] [CrossRef]
  19. Bender, R.R.; Haegele, J.W.; Below, F.E. Nutrient Uptake, Partitioning, and Remobilization in Modern Soybean Varieties. Agron. J. 2015, 107, 563–573. [Google Scholar] [CrossRef]
  20. Erenoglu, E.B.; Kutman, U.B.; Ceylan, Y.; Yildiz, B.; Cakmak, I. Improved nitrogen nutrition enhances root uptake, root-to-shoot translocation and remobilization of zinc (65Zn) in wheat. New Phytol. 2011, 189, 438–448. [Google Scholar] [CrossRef]
  21. Kutman, U.B.; Kutman, B.Y.; Ceylan, Y.; Ova, E.A.; Cakmak, I. Contributions of root uptake and remobilization to grain zinc accumulation in wheat depending on post-anthesis zinc availability and nitrogen nutrition. Plant Soil. 2012, 361, 177–187. [Google Scholar] [CrossRef]
  22. Khalili, A.; Qayyum, A.; Khan, S.U.; Ullah, I.; Khalofah, A. Role of Temporal Zn Fertilization along with Zn Solubilizing Bacteria in Enhancing Zinc Content, Uptake, and Zinc Use Efficiency in Wheat Genotypes and Its Implications for Agronomic Biofortification. Agronomy 2023, 13, 2677. [Google Scholar] [CrossRef]
  23. Persson, D.P.; de Bang, T.C.; Pedas, P.R.; Kutman, U.B.; Cakmak, I.; Andersen, B.; Finnie, C.; Schjoerring, J.K.; Husted, S. Molecular speciation and tissue compartmentation of zinc in durum wheat grains with contrasting nutritional status. New Phytol. 2016, 211, 1255–1265. [Google Scholar] [CrossRef]
  24. Sohrabi, Y.; Habibi, A.; Mohammadi, K.; Sohrabi, M.; Heidari, G.; Khalesro, S.; Khalvandi, M. Effect of nitrogen (N) fertilizer foliar-applied iron (Fe) fertilizer at various reproductive stages on yield yield component chemical composition of soybean (Glycine max L. Merr.) seed. Afr. J. Biotechnol. 2012, 11, 9599–9605. [Google Scholar]
  25. Kumar, S.; Wani, J.A.; Lone, B.A.; Fayaz, A.; Singh, P.; Qayoom, S.; Dar, Z.A.; Ahmed, N. Effect of Phosphorus and Sulphur on Nutrient and Amino Acids Content of Soybean (Glycine max L. Merrill) under ‘Alfisols’. J. Exp. Agric. Int. 2017, 16, 1–7. [Google Scholar]
  26. Sharma, A.; Sharma, S. Effect of nitrogen and sulphur nutrition on yield parameters and protein composition in soybean [Glycine max (L.) Merrill]. J. Appl. Nat. Sci. 2014, 6, 402–408. [Google Scholar] [CrossRef]
  27. Lindsay, W.L.; Norvell, W.A. Development of a DTPA soil test for zinc, iron, manganese, and copper. Soil Sci. Soc. Am. J. 1978, 42, 421–428. [Google Scholar] [CrossRef]
  28. Miller, J.D. The measurement of civic scientific literacy. Public Underst. Sci. 1998, 7, 203–223. [Google Scholar] [CrossRef]
  29. Burkitbayev, M.; Bachilova, N.; Kurmanbayeva, M.; Tolenova, K.; Yerezhepova, N.; Zhumagul, M.; Mamurova, A.; Turysbek, B.; Demeu, G. Effect of sulfur-containing agrochemicals on growth, yield, and protein content of soybeans (Glycine max (L.) Merr.). Saudi. J. Biol. Sci. 2021, 28, 891–900. [Google Scholar] [CrossRef]
  30. Głowacka, A.; Jariene, E.; Flis-Olszewska, E.; Kiełtyka-Dadasiewicz, A. The Effect of nitrogen and sulphur application on soybean productivity traits in temperate climates conditions. Agronomy 2023, 13, 780. [Google Scholar] [CrossRef]
  31. Schweiger, P.; Hofer, M.; Hartl, W.; Wanek, W.; Vollmann, J. N2 fixation by organically grown soybean in Central Europe: Method of quantification and agronomic effects. Eur. J. Agron. 2012, 41, 11–17. [Google Scholar] [CrossRef]
  32. Jarecki, W.; Bobrecka-Jamro, D. Effect of fertilization with nitrogen and seed inoculation with nitragina on seed quality of soya bean (Glycine max (L.) Merrill). Acta Sci. Polonorum. Agric. 2015, 14, 51–59. [Google Scholar]
  33. Lorenc-Kozik, A.M.; Pisulewska, E. Wplyw zroznicowanego nawozenia azotem i mikroelementami na plonowanie wybranych odmian soi. Rośliny Oleiste-Oilseed Crops 2003, 24, 131–142. [Google Scholar]
  34. Bobrecka-Jamro, D.; Jarecki, W.; Buczek, J. Response of soya bean to different nitrogen fertilization levels. J. Elem. 2018, 23, 559–568. [Google Scholar]
  35. Lošák, T.; Ševčík, M.; Plchová, R.; Von Bennewitz, E.; Hlušek, J.; Elbl, J.; Buňka, F.; Polášek, Z.; Antonkiewicz, J.; Varga, L. Nitrogen and sulphur fertilisation affecting soybean seed spermidine content. J. Elem. 2018, 23, 581–588. [Google Scholar]
  36. Namvar, A.; Sharifi, R.S. Phenological and morphological response of chickpea (Cicer arietinum L.) to symbiotic and mineral nitrogen fertilization. Zemdirbysté-Agric. 2011, 98, 121–130. [Google Scholar]
  37. Gai, Z.; Zhang, J.; Li, C. Effects of starter nitrogen fertilizer on soybean root activity, leaf photosynthesis and grain yield. PLoS ONE 2017, 12, e0174841. [Google Scholar] [CrossRef]
  38. Van Kessel, C.; Hartley, C. Agricultural management of grain legumes: Has it led to an increase in nitrogen fixation? Field Crops Res. 2000, 65, 165–181. [Google Scholar] [CrossRef]
  39. Khalili, A.; Dhar, S.; Rasrat, N.A.; Faiz, M.A.; Dass, A.; Varghese, E. Effect of nitrogen management on yield and economics of maize (Zea mays L.) in Kandahar region of Afghanistan. Ann. Agric. Res. 2016, 37, 236–342. [Google Scholar]
  40. Sharma, O.P.; Tiwari, S.C.; Raghuwanshi, R.K. Effect of doses and sources of sulphur on nodulation, yield, oil and protein content of soybean and soil properties. Soybean Res. 2004, 2, 35–40. [Google Scholar]
  41. Shi, R.; Zhang, Y.; Chen, X.; Sun, Q.; Zhang, F.; Römheld, V.; Zou, C. Influence of long-term nitrogen fertilization on micronutrient density in grain of winter wheat (Triticum aestivum L.). J. Cereal Sci. 2010, 51, 165–170. [Google Scholar] [CrossRef]
  42. Cakmak, I.; Kutman, U.B. Agronomic biofortification of cereals with zinc: A review. Eur. J. Soil Sci. 2018, 69, 172–180. [Google Scholar] [CrossRef]
  43. Cakmak, I.; Kalayci, M.; Kaya, Y.; Torun, A.A.; Aydin, N.; Wang, Y.; Arisoy, Z.; Erdem, H.A.M.İ.D.E.; Yazici, A.; Gokmen, O. Biofortification and localization of zinc in wheat grain. J. Agric. Food Chem. 2010, 58, 9092–9102. [Google Scholar] [CrossRef]
  44. Kutman, U.B.; Yildiz, B.; Cakmak, I. Improved nitrogen status enhances zinc and iron concentrations both in the whole grain and the endosperm fraction of wheat. J. Cereal Sci. 2011, 53, 118–125. [Google Scholar] [CrossRef]
  45. Barunawati, N.; Giehl, R.F.H.; Bauer, B.; Wirén, N.V. The influence of inorganic nitrogen fertilizer forms on micronutrient retranslocation and accumulation in grains of winter wheat. Front. Plant Sci. 2013, 4, 320. [Google Scholar] [CrossRef] [PubMed]
  46. Kutman, U.B.; Yildiz, B.; Cakmak, I. Effect of nitrogen on uptake, remobilization and partitioning of zinc and iron throughout the development of durum wheat. Plant Soil 2011, 342, 149–164. [Google Scholar] [CrossRef]
  47. Aciksoz, B.S.; Yazicici, A.; Ozturk, L.; Cakmak, I. Biofortification of wheat with iron through soil and foliar application of nitrogen and iron fertilizers. Plant Soil 2011, 349, 215–225. [Google Scholar] [CrossRef]
  48. Khalili, A.; Dhar, S.; Dass, A.; Ahmad Faiz, M.; Varghese, E. Agronomic indices of nitrogen use efficiency and maize yield response to various rates, time of application and their interaction effect in Kandahar region of Afghanistan. Agronomic indices of nitrogen use efficiency and maize yield response. Ann. Agric. Res. 2018, 39, 347–353. [Google Scholar]
Figure 1. Agro-meteorological conditions throughout the seasons in 2018.
Agronomy 14 00570 g001
Figure 2. Effect of Nand Sfertilization on the grain, straw, and total N uptake by soybean. The presented data represent the mean values with standard error bars, and distinctions between the means are indicated by dissimilar letters at p = 0.05, as established by the least-significant difference (LSD) test. The abbreviations used in the figure are as follows: GNU, grain N uptake; SNU, straw N uptake; and TNU, total N uptake.
Agronomy 14 00570 g002
Figure 3. Effect of Nand Sfertilization on the grain, straw, and total S uptake by soybean. The presented data depict the mean values with standard error bars, and distinctions between the means are indicated by distinct letters at p = 0.05, as determined by the least-significant difference (LSD) test. The abbreviations used in the figure are as follows: GSU, grain S uptake; SSU, straw S uptake; and TSU, total S uptake.
Agronomy 14 00570 g003
Figure 4. Effect of Nand Sfertilization on the grain and straw yield of soybean. The presented data depict the mean values with standard error bars, and distinctions between the means are indicated by distinct letters at p = 0.05, as determined by the least-significant difference (LSD) test.
Agronomy 14 00570 g004
Figure 5. Pearson correlations analysis among different nutrient uptake variables of soybean; significance level for correlation is set at p = 0.05. The abbreviations used in the figure are as follows: GNU, seed N uptake; SNU, straw N uptake; TNU, total N uptake; GSU, seed S uptake; SSU, straw S uptake; TSU, total S uptake; GZnC, seed Zn content; GFeC, seed Fe content; SZnC, soil Zn content; and SFeC, soil Fe content.
Agronomy 14 00570 g005
Figure 6. Principal component analysis (PCA) showing the relationships among the nutrient uptake variables of soybean. The abbreviations used in the figure are as follows: GNU, seed N uptake; SNU, straw N uptake; TNU, total N uptake; GSU, seed S uptake; SSU, straw S uptake; TSU, total S uptake; GZnC, seed Zn content; GFeC, seed Fe content; SZnC, soil Zn content; and SFeC, soil Fe content.
Agronomy 14 00570 g006
Table 1. Experimental treatment combinations.
Treatment CodingTreatment Details
NS
N0S00 kg ha−1 nitrogen0 kg ha−1 sulfur
N(25)Basal dose at a rate of 25 kg ha−1 nitrogen-
N(50)Basal dose at a rate of 50 kg ha−1 nitrogen-
N(25+25)Basal dose at a rate of 25 kg ha−1 nitrogen + Split application of 25 kg ha−1 nitrogen at the R2 stage-
N(12.5+12.5)Basal dose at a rate of 12.5 kg ha−1 nitrogen + Split application of 12.5 kg ha−1 nitrogen at the R2 stage-
S(25)-Basal dose at a rate of 25 kg ha−1 sulfur
S(50)-Basal dose at a rate of 50 kg ha−1 sulfur
S(12.5+12.5)-Basal dose at a rate of 12.5 kg ha−1 sulfur + Split application of 12.5 kg ha−1 sulfur at the R2 stage
S(25+25)-Basal dose at a rate of 25 kg ha−1 sulfur + Split application of 25 kg ha−1 sulfur at the R2 stage
N(25+25), S(12.5+12.5)Basal dose at a rate of 25 kg ha−1 nitrogen + Split application of 25 kg ha−1 nitrogen at the R2 stagebasal dose at a rate of 12.5 kg ha−1 sulfur + Split application of 12.5 kg ha−1 sulfur at the R2 stage
N(12.5+12.5), S(12.5+12.5)Basal dose at a rate of 12.5 kg ha−1 nitrogen + Split application of 12.5 kg ha−1 nitrogen at the R2 stageBasal dose at a rate of 12.5 kg ha−1 sulfur + Split application of 12.5 kg ha−1 sulfur at the R2 stage
N(12.5+12.5), S(25+25)Basal dose at a rate of 12.5 kg ha−1 nitrogen + Split application of 12.5 kg ha−1 nitrogen at the R2 stageBasal dose at a rate of 25 kg ha−1 sulfur + Split application of 25 kg ha−1 sulfur at the R2 stage
N(25+25), S(25+25)Basal dose at a rate of 25 kg ha−1 nitrogen + Split application of 25 kg ha−1 nitrogen at the R2 stageBasal dose at a rate of 25 kg ha−1 sulfur + Split application of 25 kg ha−1 sulfur at the R2 stage
N(25), S(50)Basal dose at a rate of 25 kg ha−1 nitrogenBasal dose at a rate of 50 kg ha−1 sulfur
Table 2. The impact of various basal and split N and S applications on soil Zn and Fe contents at the R2 and R5 growth stages, as well as seed Zn and Fe contents.
TreatmentSoil Zn
Content
(mg kg−1)
Soil Fe
Content
(mg kg−1)
Soil Zn
Content
(mg kg−1)
Soil Fe
Content
(mg kg−1)
Seed Zn
Content
(mg kg−1)
Seed Fe
Content
(mg kg−1)
R2R5
Control0.68 ± 0.04 g3.58 ± 0.04 g0.76 ± 0.02 g3.80 ± 0.02 i34.8 ± 1.7 h78.9 ± 2.4 f
N(25)0.79 ± 0.03 cd3.80 ± 0.05 c0.84 ± 0.03 c4.09 ± 0.03 d42.5 ± 1.3 cd112.1 ± 3.9 c
N(50)0.85 ± 0.02 b3.91 ± 0.04 b0.88 ± 0.02 b4.14 ± 0.06 cd46.3 ± 1.5 b113.9 ± 5.6 c
N(25+25)0.81 ± 0.02 c3.76 ± 0.03 cd0.89 ± 0.06 b4.19 ± 0.03 bc46.4 ± 1.2 b125.3 ± 7.1 b
N(12.5+12.5)0.72 ± 0.02 f3.69 ± 0.04 ef0.77 ± 0.02 efg3.91 ± 0.03 fgh36.4 ± 1.0 fgh81.0 ± 2.9 ef
S(25)0.73 ± 0.04 ef3.71 ± 0.06 de0.74 ± 0.02 g3.88 ± 0.05 gh37.1 ± 1.2 fg102.4 ± 2.5 d
S(50)0.76 ± 0.01 de3.73 ± 0.02 de0.79 ± 0.01 cdef3.94 ± 0.04 efg39.7 ± 1.3 e104.8 ± 1.4 d
S(12.5+12.5)0.71 ± 0.02 fg3.64 ± 0.02 f0.75 ± 0.04 g3.88 ± 0.03 ef35.3 ± 0.6 gh86.8 ± 3.4 e
S(25+25)0.76 ± 0.02 de3.79 ± 0.04 c0.79 ± 0.03 def3.95 ± 0.04 ab40.8 ± 1.3 de100.5 ± 4.7 d
N(25+25), S(12.5+12.5)0.88 ± 0.04 ab3.87 ± 0.05 b0.91 ± 0.03 ab4.21 ± 0.07 ab46.6 ± 0.7 b126.9 ± 2.7 ab
N(12.5+12.5), S(12.5+12.5)0.78 ± 0.05 cd3.73 ± 0.03 de0.81 ± 0.03 cde3.91 ± 0.04 fgh36.8 ± 0.9 fg84.08 ± 7.7 ef
N(12.5+12.5), S(25+25)0.77 ± 0.03 d3.79 ± 0.04 c0.82 ± 0.05 cd3.98 ± 0.03 e37.7 ± 0.8 f88.2 ± 6.0 e
N(25+25), S(25+25)0.90 ± 0.05 a3.99 ± 0.07 a0.94 ± 0.04 a4.27 ± 0.04 a49.1 ± 0.9 a133.2 ± 2.8 a
N(25), S(50)0.87 ± 0.03 b3.91 ± 0.05 b0.91 ± 0.04 ab4.16 ± 0.05 ab43.6 ± 1.51 c115.2 ± 2.0 c
LSD (p = 0.05)0.040.060.040.061.97.2
The data provided represent the mean values obtained from three replicate samples, and the standard deviation (SD) is specified. In the same column, distinctions between the means are indicated by distinct letters at a significance level of p = 0.05, as determined by Fisher’s least-significant difference (LSD) test.
Table 3. The influence of different basal and split N and S applications on agronomic, recovery, and physiological use efficiency in soybean crop.
TreatmentN Agronomic
Efficiency kg kg−1
N Physiological Efficiency kg kg−1N Recovery Efficiency %S Agronomic
Efficiency kg kg−1
S Physiological Efficiency kg kg−1S Recovery Efficiency
N(25)23.9610.07238---
N(50)16.1210.36156---
N(25+25)16.1210.00129---
N(12.5+12.5)8.369.4189---
S(25)---10.00196.855.1
S(50)---5.62145.603.9
S(12.5+12.5)---5.52186.493.0
S(25+25)---7.20185.573.9
N(25+25), S(12.5+12.5)15.329.7715730.64210.4414.4
N(12.5+12.5), S(12.5+12.5)9.529.481019.52146.915.0
N(12.5+12.5), S(25+25)17.1610.291678.58170.245.0
N(25+25), S(25+25)21.8610.7320421.86246.738.9
N(25), S(50)38.2811.6833319.14257.267.4
Disclaimer/Publisher’s Note: The statements, opinions and data contained in all publications are solely those of the individual author(s) and contributor(s) and not of MDPI and/or the editor(s). MDPI and/or the editor(s) disclaim responsibility for any injury to people or property resulting from any ideas, methods, instructions or products referred to in the content.

