Article

Effect of Alternate Wetting and Drying on the Emission of Greenhouse Gases from Rice Fields on the Northern Coast of Peru

by
Ida Echegaray-Cabrera
1,
Lena Cruz-Villacorta
2,
Lia Ramos-Fernández
3,*,
Mirko Bonilla-Cordova
1,
Elizabeth Heros-Aguilar
4 and
Lisveth Flores del Pino
5
1
Science Faculty, Universidad Nacional Agraria La Molina, Lima 15024, Peru
2
Department of Territorial Planning and Doctoral Program in Engineering and Environmental Sciences, Universidad Nacional Agraria La Molina, Lima 15024, Peru
3
Department of Water Resources, Universidad Nacional Agraria La Molina, Lima 15024, Peru
4
Agronomy Faculty, Universidad Nacional Agraria La Molina, Lima 15024, Peru
5
Center for Research in Environmental Chemistry, Toxicology and Biotechnology, Universidad Nacional Agraria La Molina, Lima 15024, Peru
*
Author to whom correspondence should be addressed.
Agronomy 2024, 14(2), 248; https://doi.org/10.3390/agronomy14020248
Submission received: 15 December 2023 / Revised: 17 January 2024 / Accepted: 22 January 2024 / Published: 24 January 2024
(This article belongs to the Special Issue Water Saving in Irrigated Agriculture)

Abstract

:
The cultivation of rice is one of the main sources of greenhouse gas (GHG) emissions due to continuously flooded irrigation (CF), which demands large volumes of water. As an alternative solution, alternate wetting and drying (AWD) irrigation has been developed as a water-saving strategy. This study was conducted at the Experimental Agricultural Station (EEA) in Vista, Florida, in the Lambayeque region located on the northern coast of Peru. Thus, it was analyzed the effect of AWD irrigation at different depths (5, 10, and less than 20 cm below the surface) compared to CF control on methane (CH4) and nitrous oxide (N2O) emissions and rice grain yield. AWD treatments reduced CH4 emissions by 84% to 99% but increased N2O emissions by 66% to 273%. In terms of Global Warming Potential (GWP), the AWD10 treatment demonstrated a 77% reduction and a Water Use Efficiency (WUE) of 0.96, affecting only a 2% decrease in rice grain yield, which ranged between 11.85 and 14.01 t   ha 1 . Likewise, this study provides sufficient evidence for the adoption of AWD irrigation as a strategy for the efficient use of water resources and the mitigation of GHG emissions in rice cultivation in the study area, compared to continuous flooded irrigation.

1. Introduction

Rice is a fundamental food source for over 60% of the global population [1]. Currently, it is cultivated on approximately 153 Mha , which is equivalent to 11% of the world’s arable land [2]. With the increasing global population, the demand for rice is estimated to rise by 56% by the year 2050 compared to the production level of 25.1 million tons recorded in 2001 [3]. Therefore, there is a need to increase rice production to meet this demand.
Rice cultivation is one of the major sources of greenhouse gas (GHG) emissions, such as methane (CH4) and nitrous oxide (N2O) [2]. These GHGs exert a significant influence on global warming, as they have warming potentials 28 and 273 times higher than that of carbon dioxide (CO2), respectively [4].
The irrigation system used in rice fields, the choice of varieties, and fertilizer management have a significant impact on these emissions from rice fields [5]. Traditional irrigation methods, such as continuous flooding (CF), not only lead to the loss of water and nitrogen resources but also turn rice fields into a significant source of CH4 [6]. On the other hand, good agricultural management practices and genetically improved rice varieties can reduce GHG emissions in fields by 20% to 50% [7].
Climate change will affect water availability in agriculture due to extreme events such as floods and damage to irrigation infrastructure [8]. This threatens food security in rice-producing countries, and adaptation strategies are required to maintain sustainable production [9].
In recent years, non-continuous flooding irrigation methods have been developed as a solution, reducing water use by up to 38% without affecting yield [10]. The Alternate Wetting and Drying (AWD) irrigation regimen stands out as one of the most studied and globally employed methods [5]. It involves cycles of wetting and drying the soil, leading to changes in soil moisture and redox conditions [5,6,11]. It has been proven that this irrigation regimen can reduce GHG emissions by up to 40%, as it decreases CH4 emissions by enhancing aerobic processes in the soil during the drying period [10,11].
However, this reduction is offset by an increase in N2O emissions in terms of GWP [11,12]. For example, Islam et al. [5] reported a 46% increase in cumulative seasonal N2O emissions. Additionally, some studies claim that alternating between aerobic and anaerobic periods increases N2O emissions through nitrification and denitrification processes, respectively [12,13,14,15].
Differences in soil textures, climate, and field management practices create controversy regarding this new irrigation regimen and its effects on GHG emissions [14,16]. For instance, Ariani et al. [14] compared GHG emissions under AWD between coarse (loamy sand) and fine (silty clay) soil textures. Meanwhile, Sha et al. [16] conducted their studies under the AWD regimen in a temperate monsoonal continental climate with an average annual temperature of 8 °C and average precipitation of 716 mm over a 3-year period. Another influencing factor is the drying depth threshold, as rice crop roots need to extract water for optimal yield and to avoid plant stress [12]. Therefore, it is important to generate information on greenhouse gas emissions in rice cultivation in different agroecological zones and irrigation management practices.
Field-level measurements will also help develop baseline data for studies in other rice fields with similar agroecological characteristics, soil types, and management practices. This will enable farmers, researchers, and policymakers to develop mitigation strategies and planning for climate-smart agriculture [17].
Therefore, this study focused on investigating CH4 and N2O emissions at three different AWD irrigation levels (5, 10, and greater than 20 cm depth) and their influence on grain yield compared to the conventional CF regimen. The specific objectives of the study were to (i) quantify CH4 and N2O emission flows, (ii) calculate the Global Warming Potential (GWP) and its relationship with the crop yield (YGWP), and (iii) determine the emission factors (EF) for CH4 and N2O.

2. Materials and Methods

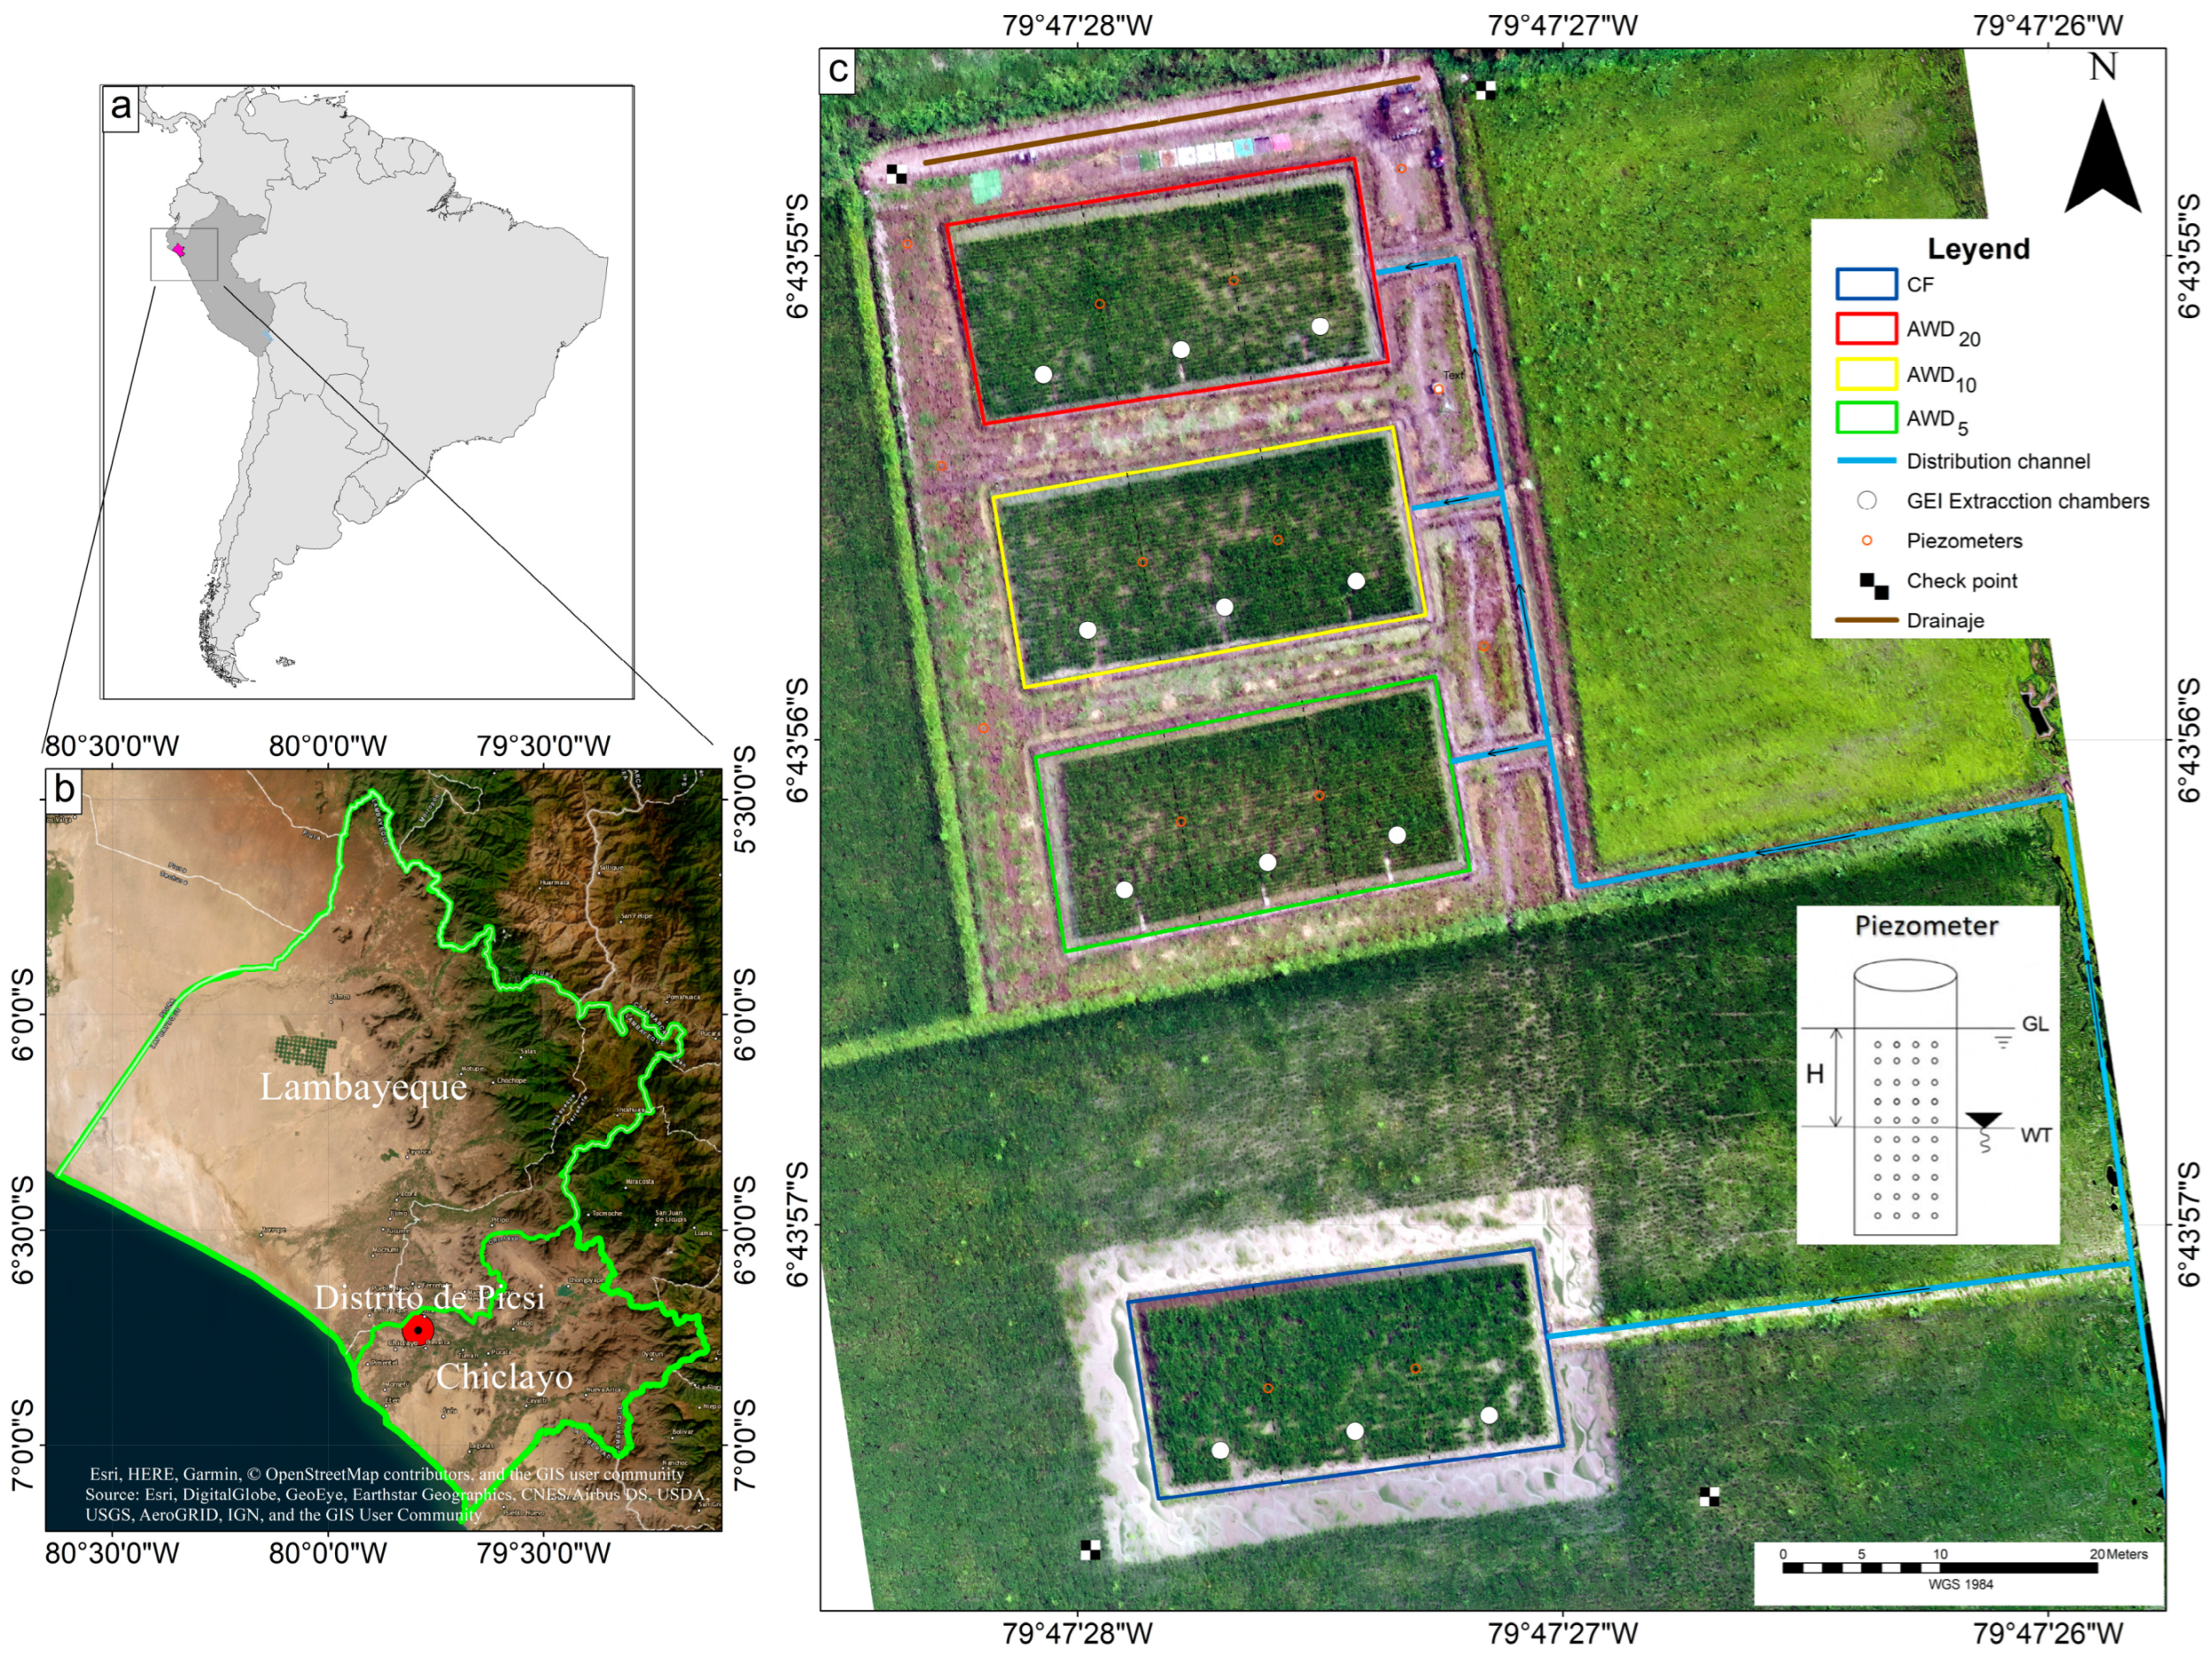
2.1. Location and Experimental Design

The experiment was conducted from January to June 2023 at the Agricultural Experimental Station (EEA) Vista, Florida, of the National Institute of Agricultural Innovation (INIA) (06°43′34″ S, 79°46′44″ W, and an altitude of 35 m above sea level), at the tropical coastal agroecological zone located at km 8 on the Chiclayo to Ferreñafe road in the district of Picsi, province of Chiclayo, Lambayeque region. According to Köppen and Geiger, the climate is classified as arid and warm (BWh). It is important to highlight that despite the majority of the population in the study area being engaged in rice production and commercialization, the Lambayeque region is characterized by frequent droughts [18].
The experiment covered a total area of 1100 m 2 , divided into four plots measuring 24 m in length and 11 m in width, with each plot further divided into three subplots (Figure 1). Different irrigation regimens were established in each plot, with the control plot using continuously flooded irrigation (CF) with a constant water depth of 5 cm until two weeks before harvest. The other plots used AWD5, AWD10, and AWD20 irrigation, corresponding to depths (H) of −5, −10, and ≤−20 cm , respectively. The reference point was the ground level relative to the soil surface based on the decline in water level. PVC perforated piezometers were installed 50 cm below the soil surface to control the flooding depth of the plots [6,19]. Irrigation water was sourced from the Tinajones reservoir and distributed through the main channel to the channels feeding the plots. An observational design with repeated measures was considered.

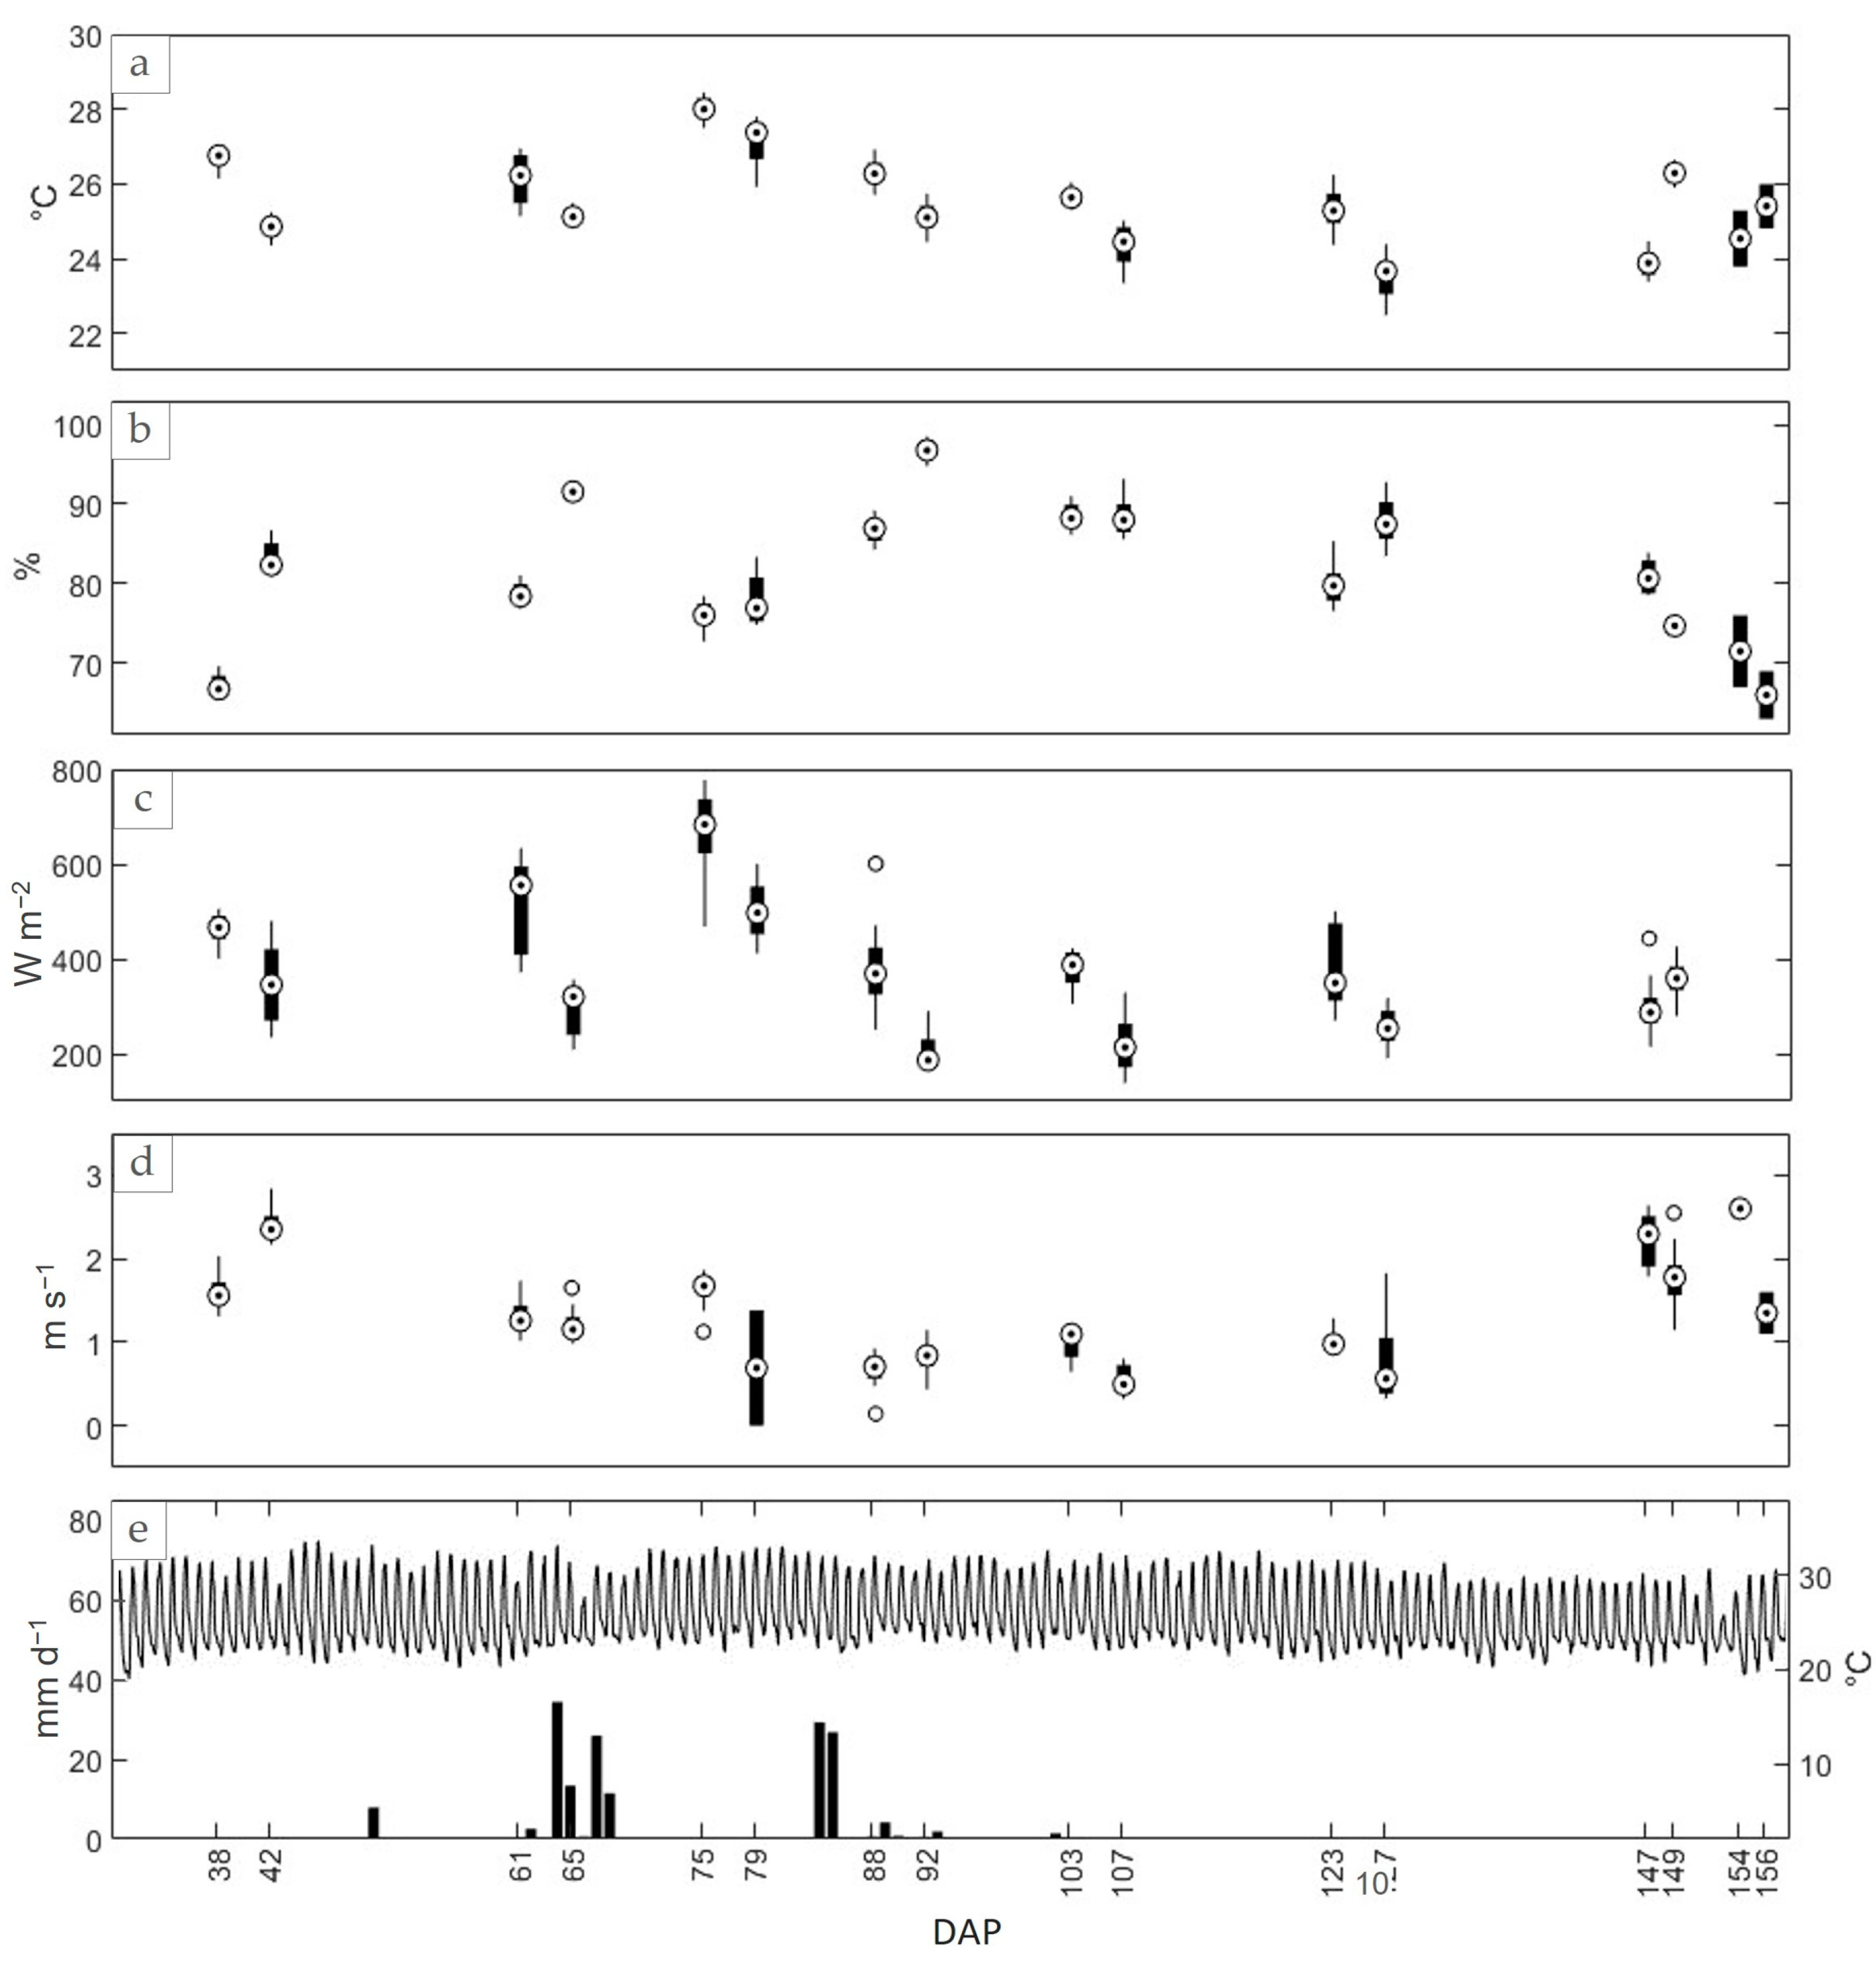
2.2. Meteorological Characterization

Meteorological data from the study area encompassed a series of key variables, including air temperature (Ta), relative humidity (HR), solar radiation (Rs), and wind speed (Vv). These data were recorded every minute using a portable automatic station (ATMOS 41, METER, Pullman, WA, USA) during the greenhouse gas (GHG) monitoring hour. Daily precipitation data (Pa) were recorded at the Vista Florida automatic weather station (SENAMHI) throughout the crop development (Figure 2).

2.3. Soil and Irrigation Water Characterization

The soil has a loamy sand texture (26% sand, 39% silt, 35% clay), electrical conductivity (EC) of 0.42 dS   m 1 ) , pH of 7.64, cation exchange capacity (CEC) of 220 meq   kg 1 , organic matter (OM) of 1.22%, total nitrogen (N) of 0.11% (N-NO of 14.01 ppm , N-NH3 of 29.40 ppm ), organic carbon of 0.71%, available sulfur of 3.76 ppm , bulk density (da) of 1.41 g   cm 3 real density (dr) of 2.67 g   cm 3 , porosity of 47.2%, field capacity (FC) of 29.76 cm 3   cm 3 , wilting point (WP) of 16.27 cm 3   cm 3 , CaCO3 of 4.02%, P of 12 ppm , K of 376 ppm , exchangeable cations (Ca2+ de 180.5, Mg2+ de 28.1, Na+ de 2.5, K+ de 9.7) meq   kg 1 , soluble B of 0.42 ppm , soluble gypsum of 0.01%, exchangeable sodium percentage (ESP) of 1.14, sodium adsorption ratio (SAR) of 0.08 meq   L 1 , Pb of 14.82 ppm and Cr of 13.50 ppm .
The irrigation water has a pH of 7.34, EC of 0.31 dS   m 1 , cations (Ca2+ of 1.91; Mg2+ of 0.43; Na+ of 0.59; K+ of 0.10) meq   L 1 , anions (Cl−1 of 1.00; HCO32− of 1.89; SO42− of 0.29) meq   L 1 . The irrigation water classification is C2-S1, indicating low sodium and salinity content, with a SAR of 0.55. All analyses were performed at the Soil, Plant, Water, and Fertilizer Analysis Laboratory of the Faculty of Agronomy—UNALM.
The water usage was measured using the volumetric method. To enhance precision, a water balance that included an account for cumulative precipitation, percolation, and crop evapotranspiration was used using the AquaCrop model [20]. The Penman-Monteith equation was employed, considering all parameters related to energy exchange and latent heat flux [21]. As shown in Table 1:

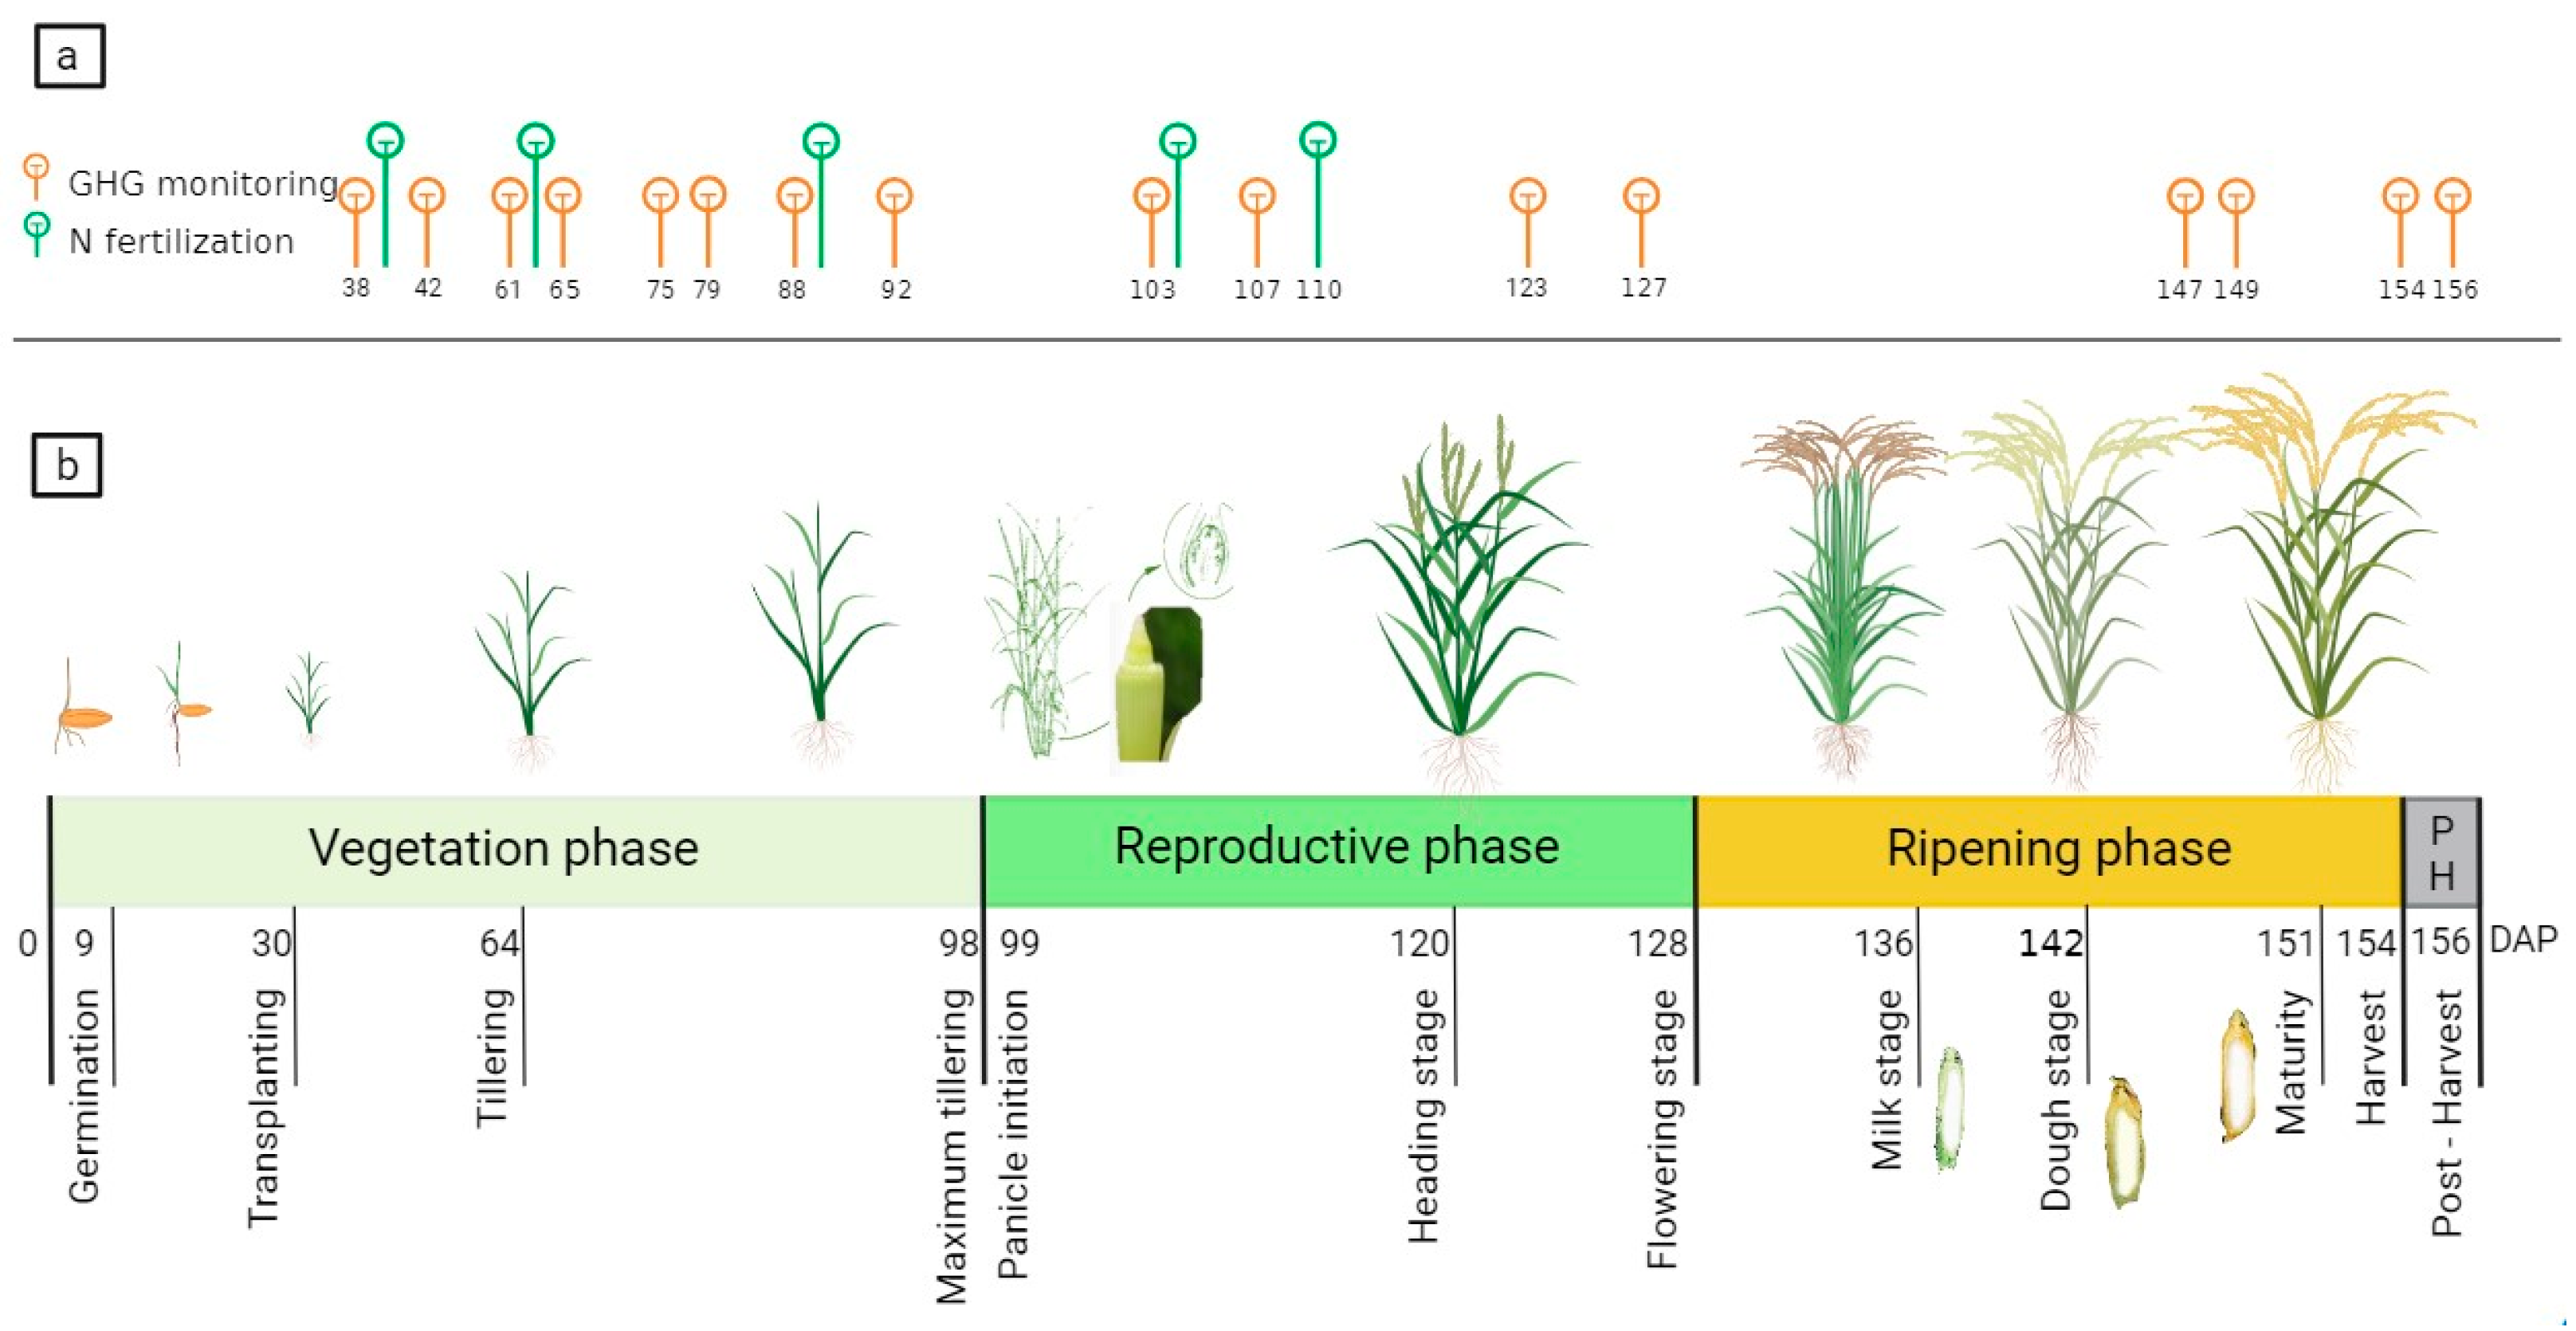
2.4. Crop Management

The planting of the INIA 515—Capoteña variety was conducted in seedbeds on 2 January 2023. Thirty days after planting (DAP), two seedlings were transplanted per hill with a spacing of 0.25 × 0.25 cm . The cropping system at the experimental site was dominated by a seasonal rotation of rice and wheat; however, in the last season before the experiment, a rice seed harvest was conducted. After this harvest, the residues were burned and incorporated into the land preparation before transplanting. The fertilization dose was 250-120-50 in the form of urea, diammonium phosphate, and potassium sulfate, respectively (Figure 3). One hundred percent of P and K and 36% of N were applied at transplanting, while the remaining nitrogen fertilizer was distributed equally in the budding, tillering, and cotton setting stages [22].

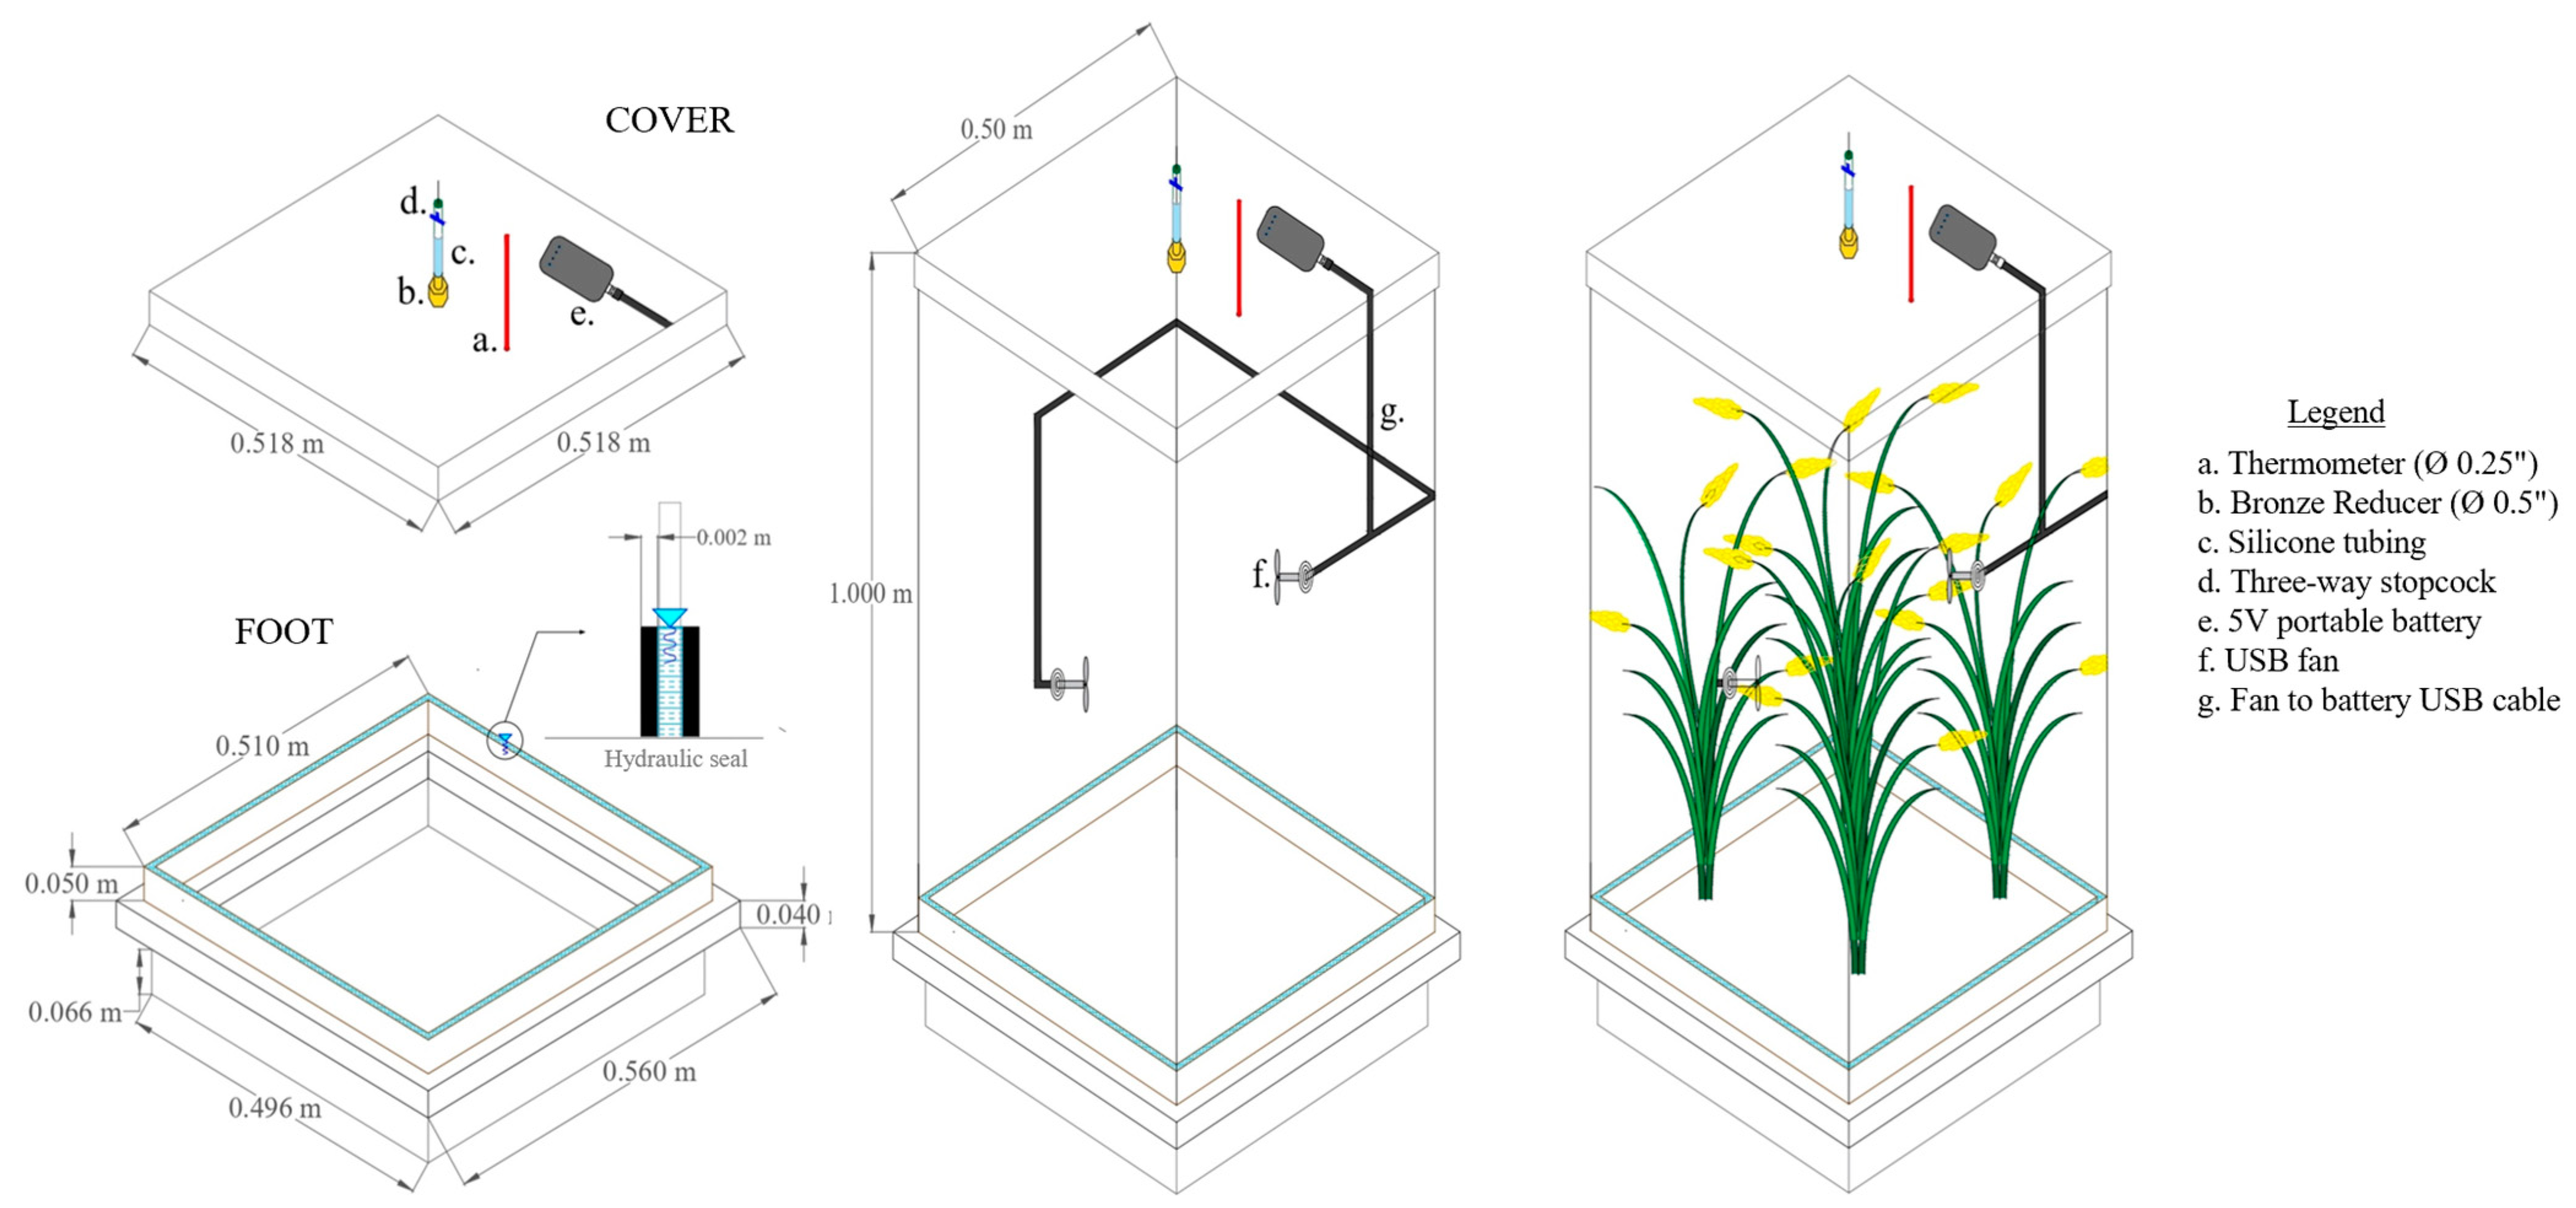
2.5. Sampling and Analysis of GHG

Gas samples were collected using the closed static chamber method to monitor CH4 and N2O emissions. The opaque polyethylene chamber consisted of a 30 cm tall base with a diameter of 43 cm , equipped with 5 cm diameter holes spaced at 22 cm intervals allowing water entry and exit. The base was hermetically sealed to the drum, which was 84 cm tall and 50 cm in diameter, through a hydraulic seal (Figure 4). A gas sampling connection was incorporated into one side of the drum, consisting of a silicone hose attached to a three-way valve connected to a 60 mL syringe for gas sample extraction. Additionally, a thermometer was installed at the top to measure the chamber’s internal temperature [23]. To ensure homogeneous gas distribution during sample collection, a fan powered by a portable battery was installed inside [7,24,25,26].
Monitoring took place on the same day as nitrogen fertilization application, three days after it, and then every 15 days to assess changes in phenology and irrigation management. The sampling was carried out in the morning between 8:00 and 11:00 a.m., under clear skies. For each sampling date, samples were taken at 0, 20, 40, and 60 min [6]. Samples collected throughout the crop growth period were immediately transferred to empty 15 mL glass vials sealed with a rubber protector (EXETAINER, Labco Limited, Lampeter, UK) for later laboratory measurement.
GHG concentrations were measured using a gas chromatograph (GC-2014, Shimadzu, Kyoto, Japan) equipped with flame ionization detectors (FID) for CH4 and electron capture detectors (ECD) for N2O at the Greenhouse Gas Laboratory (CIAT, Cali, Colombia) [23].

2.6. Correlation of Transparent and Opaque Chambers

Blocking light under opaque chambers during greenhouse gas (GHG) sampling can impact GHG production, transport, or emission processes [27]. Additionally, the absence of sunlight reduces plant photosynthetic capacity by causing complete or partial closure of stomata, thus limiting external CO2 absorption by leaves [28]. As this effect has the potential to reduce GHG emission rates through plants, comparative measurements between transparent and opaque chambers were conducted. The aim was to establish a correction relationship through the correlation between GHG emissions measured in both chambers.
The transparent chamber consisted of a square metal base (area 0.26 m 2 , height 0.15 m ) permanently installed in the soil at a depth of 10 cm in each subplot (Figure 5. The 1 m tall chamber body was placed on the flange at the top of the base with a hydraulic seal [14]. The chamber was covered by a lid containing the connection for gas sample collection and the thermometer, like the opaque chamber. Inside, two fans connected to a portable battery were installed for air mixing [1,29].
A set of paired measurements with transparent and opaque chambers was carried out in three 2.5 m × 4.0 m plots installed in the Irrigation Experimental Area (AER), located within the campus of the National Agrarian University La Molina (12°00′05″ S, 76°57′06.5″ W, altitude 233 m above sea level) between November 2022 and May 2023 (Figure 6).
The data gathered from both chambers was performed for the statistical analysis of normality and distribution. It was concluded that the distribution was non-parametric. Consequently, Box-Cox transformations were used to assess the necessary adjustments.
Pearson’s R, for the relationship between chambers, for CH4 and N2O flux, was 0.823 and 0.693, respectively. Resulting in Equations (1) and (2):
L n ( ƒ C H 4 , o ) = 1.3796   L n ( ƒ C H 4 , t ) + 1.1293
where ƒ C H 4 , o is the CH4; emission flux from the opaque chamber, and ƒ C H 4 , t is the CH4 emission flux from the transparent chamber, both expressed in mg   m 2   h 1 .
L n ( ƒ N 2 O , o ) = 0.7723   L n ( ƒ N 2 O , t ) 0.9227
where ƒ N 2 O , o is the N2O emission flux from the opaque chamber, and ƒ N 2 O , t is the N2O emission flux from the transparent chamber, both expressed in mg   m 2   h 1 .

2.7. Calculation of GHG Emissions

Emission fluxes were determined from the slope through linear regression, the concentration of CH4 or N2O against chamber closure time [13,30]. Then, the slope was converted to mass per unit area per unit time ( mg   m 2   h 1 ) through Equation (3) [3,29]:
E m i s s i o n   r a t e   o f   C H 4   a n d   N 2 O = s l o p e   ( p p m   m i n 1 ) ×   P   ×   V c   ×   M W   ×   60 R   ×   T k   ×   A c
where P is pressure under normal conditions, Vc is the gas chamber volume in m3, MW is the molecular weight of the respective gas, 60, min   h 1 , R is the ideal gas constant 0.082057 in atm   m 3   kmol 1 K 1 , Tk is the temperature inside the chamber expressed in Kelvin, and Ac is the chamber area in m 2 .
Considering the results obtained in the correlation between the transparent and opaque chambers, the correction equation was applied to the calculated emission rate, using Equation (1) for CH4 flux and Equation (2) for N2O flux.
The GWP of CH4 and N2O was calculated with Equation (4):
G W P   ( k g   C O 2   e q u i v a l e n t   h a 1 ) = ( T C H 4 × 28 + T N 2 O × 273 )
where TCH4 is the total accumulated CH4 emissions ( kg   ha 1 ), TN2O is the total accumulated N2O emissions ( kg   ha 1 ), and 28 and 273 are the GWP values for CH4 and N2O, respectively, relative to CO2 over a 100-year horizon [4].
The yield-scaled global warming potential was calculated with the following Equation (5) [11]:
Y G W P = P C G Y i e l d
where YGWP is the total GHG emissions per unit of grain yield ( kg CO2 eq kg 1 grain yield).
The scale factor for AWD was estimated by dividing cumulative AWD emissions by cumulative CF emissions [5].
The emission factor (EF) was estimated by dividing cumulative AWD emissions by the GHG measurement period.

2.8. Data Analysis

The normality of distribution and homogeneity of variances for each treatment were assessed using the Shapiro-Wilk test and the Bartlett test, respectively. The results indicated a non-normal distribution; therefore, an observational design with repeated measures using the non-parametric Kruskal-Wallis test was employed. Cumulative emissions, grain yield, GWP, YGWP, and EF of each treatment were compared with the control group (CF) using the Dunn test [31]. For the statistical calculations, R Studio software (v2023.06.1) was used. A significance level of α = 5% was considered.

3. Results

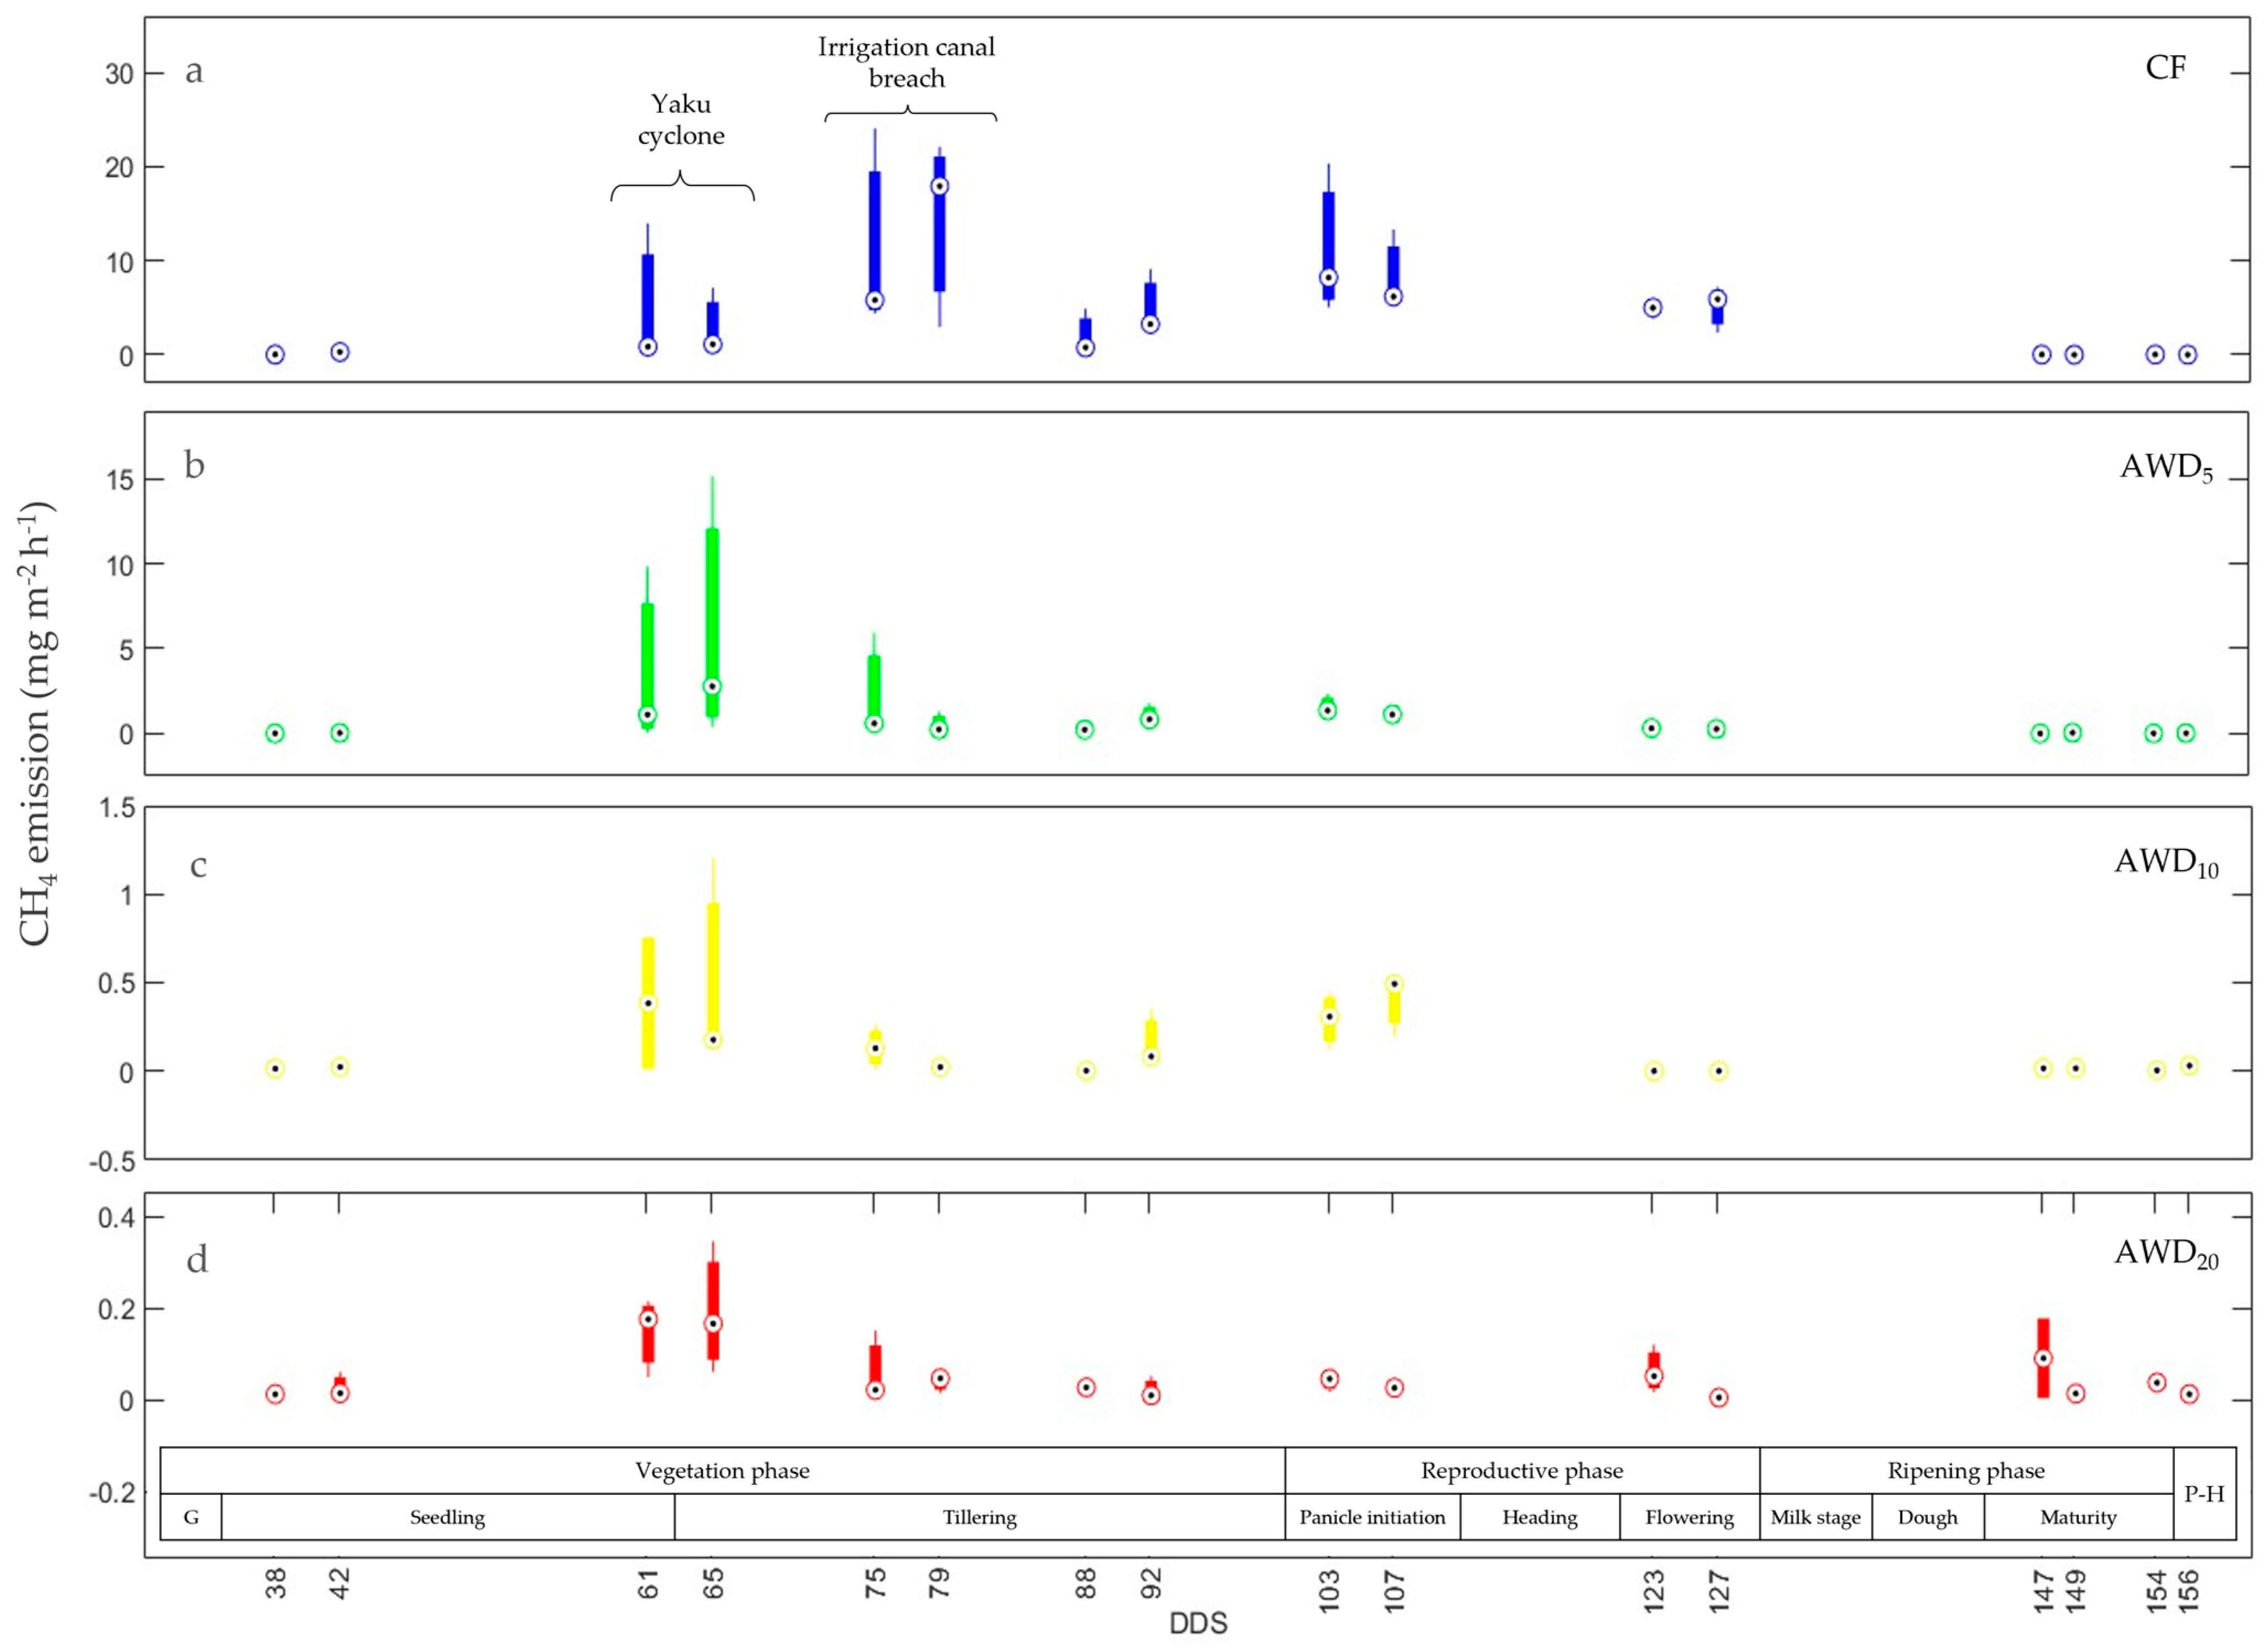
3.1. Methane CH4 Emission Dynamics

The temporal variation of CH4 throughout the experiment period, from the germination stage to post-harvest, is depicted (Figure 7). The magnitudes and trends of CH4 emission flux varied with AWD treatments, crop growth phase, and meteorological conditions. An increase in emissions was observed during the tillering stage (61 and 65 DAS) under both AWD and CF irrigation regimens, with emissions ranging from 0.167 to 2.778 mg   m 2   h 1 . This trend persisted for the CF condition, while there was a rapid decline for the AWD treatment (Table 2). A second increase in CH4 emissions were observed during the flowering stage (103 and 107 DAS) under both AWD and CF irrigation regimens, with emissions ranging from 0.028 to 8.124 mg   m 2   h 1 .
The results indicate that CH4 emissions under CF, ranging from 0.025 to 17.924 mg   m 2   h 1 , were significantly higher than those under other AWD treatments. The maximum CH4 emission values were 2.778, 0.493, and 0.177 mg   m 2   h 1 for AWD5, AWD10, and AWD20, respectively.
From 7 March (62 DAS), an unorganized tropical cyclone named “Cyclone Yaku” was present near the north and central coast until 18 March (73 DAS) [32]. This presence facilitated the entry and accumulation of moisture on the occidental watershed. As a result, intense rainfall and unprecedented daily precipitation records occurred along the northern coast, significantly impacting the hydrological regimen during the experimental period.

3.2. Dynamics of N2O Emissions

The temporal variation of N2O throughout the experiment period, from germination to post-harvest, is observed (Figure 8). The increase in emissions during the maximum tillering stage (75 and 79 DAS) under both AWD and CF irrigation regimens corresponds to a period of extreme drought, with emissions ranging from 0.011 to 0.623 mg   m 2   h 1 . Some high values were observed after urea fertilization, with emissions ranging from 0.008 and 0.379 mg   m 2   h 1 on 42 DAP and between 0.008 and 0.211 mg   m 2   h 1 on 107 DAP, for the AWD irrigation regimen.
The highest peaks of N2O emission occur under the AWD regimen, 0.178, 0.623, and 0.379 mg   m 2   h 1 for AWD5, AWD10, and AWD20, respectively, compared to the emission under CF, which was 0.029 mg   m 2   h 1 .

3.3. Cumulative Emissions of CH4 and N2O

The effects of irrigation regimens significantly influenced ( p < 0.05 ) the cumulative greenhouse gas emissions (Table 3). For CH4, significant differences among treatments are observed. Values range from 1.59 kg   ha 1 for the AWD20 irrigation regimen to 108.55 kg   ha 1 under the CF regimen. In Figure 9a, the significance and Spearman’s R values are observed. Cumulative CH4 emissions were significantly higher under the CF irrigation regimen. The AWD irrigation regimen reduced CH4 emissions, decreasing by 84%, 96%, and 99% in AWD5, AWD10, and AWD20, respectively.
Regarding cumulative N2O emissions, significant differences among treatments are observed. Values range from 0.63 kg   ha 1 for the CF irrigation regimen to 2.36 kg   ha 1 under the AWD10 regimen. In Figure 9b, the significance and Spearman’s R values are observed. Cumulative N2O emissions were significantly higher under the AWD irrigation regimen. The AWD irrigation regimen increased N2O emissions at all levels, increasing by 66%, 273%, and 255% in AWD5, AWD10, and AWD20, respectively.
The highest cumulative methane (CH4) emissions from crops are observed during the vegetative stage across all treatments. In contrast, when it comes to the total N2O emissions based on crop growth stages, the maturity phase produces the most emissions in the CF system. Whereas in the AWD system, the growth phase, coinciding with nitrogen fertilization results in the maximum emissions (Table 4).

3.4. Rice Yield, Water Use Efficiency, GWP, YGWP, and Emission Factors

Irrigation regimens significantly influenced ( p < 0.05 ) yield, GWP, and YGWP (Table 3). In all three AWD treatments, GWP was reduced compared to the CF regimen. GWP values were 782.11, 755.58, and 656.46 kg CO2 equivalent ha 1 for the AWD5, AWD10, and AWD20 regimen, respectively, while for the CF regimen, values reached 3 211.54 kg CO2 equivalent ha 1 . The reduction in GWP compared to the CF regimen was 76%, 77%, and 80% for the AWD5, AWD10, and AWD20 regimens, respectively.
With respect to WUE, AWD irrigation demonstrates higher efficiency, with 0.83, 0.96, and 0.92 kg   m 3 for AWD5, AWD10, and AWD20, respectively; thus, there is a 28% reduction in water use in AWD irrigation compared to CF.
YGWP values were 0.065, 0.054, and 0.048 kg CO2 equivalent kg 1 for the AWD5, AWD10, and AWD20 regimens, respectively, while for the CF regimen, a value of 0.229 kg CO2 equivalent kg 1 was obtained. The AWD regimen reduced YGWP values compared to the CF regimen by 71%, 76%, and 79% for the AWD5, AWD10, and AWD20, regimens, respectively. No significant differences were shown between treatments ( p < 0.05 ), regarding YGWP.
The CH4 EF ranged from 0.01 kg   ha 1   d 1 for the AWD20 regimen, while for the CF regimen, a value of 0.92 kg   ha 1   d 1 was obtained. The N2O EF ranged from 0.005 kg   ha 1   d 1 .

4. Discussion

4.1. CH4 Emission Dynamics

CH4 emissions from rice fields were influenced by the AWD irrigation regimen [11]. In Figure 7, it can be observed that the highest emission rates were under the CF regimen. Although these emission rates are comparable to those recorded in other locations (Table 5) [3,5,14,16], there are studies reporting higher [2,12,19] or lower values [6,10].
According to the crop phenology, CH4 emissions increase as the plants grow until reaching the flowering stage. This increase is due to the optimal development of aerenchyma tissue, especially in the early stages of plant development, leading to increased exudate release and fermentation of easily degradable soil organic matter [10]. Thus, peak emission levels were recorded during the vegetative stage (17.924 mg   m 2   h 1 in CF and 2.778 mg   m 2   h 1 in AWD) and the reproductive stage (8.214 mg   m 2   h 1 in CF and 1.353 mg   m 2   h 1 in AWD). This increase can also be explained by microbial degradation, root exudate release, and microbial biomass growth during the maximum tillering phase [14]. These results are consistent with previous research [10,12,16].
The decrease in emissions under the CF regimen started during the maturation stage (0.002–0.025 mg   m 2   h 1 ), which coincides with the period when irrigation is suspended, where there is greater availability of oxygen in the rhizosphere. Furthermore, soil aeration promotes the oxidation of CH4 by methanotrophic bacteria in underground soil layers and consequently reduces CH4 emissions [3].
Despite this, these CH4 fluxes were higher throughout almost the entire crop development compared to the fluxes under the AWD treatment. Despite the climatic and soil conditions of previous studies, they reported differences when compared with the CF treatment (Table 5). This can be attributed to the fact that in rice cultivation systems, the transfer and release of CH4 to the atmosphere mainly occur through three mechanisms, with the most important being the diffusion of gas dissolved in interfaces between water and air, as well as between soil and water [33]. This diffusion process can be promoted by the porosity of the soil; in this study the soil texture was sandy loam. This restricts the time available for methanotrophs to degrade CH4 [14].
The aerated conditions of the AWD treatment could be affected by the strong and abnormal rainfall caused by the natural phenomenon Cyclone “Yaku”. These coincided with the beginning of the tillering period (Table 4), which resulted in an increase in emissions because the soil remained saturated, generating longer anoxic conditions [34].

4.2. Dynamics of N2O Emission

N2O emissions in rice fields are directly influenced by the AWD irrigation regimen and the quantity of fertilizers used. Figure 8 shows that the highest N2O emission rates occur when using the AWD irrigation regimen (0.003–0.623 mg   m 2   h 1 ), compared to emissions under the CF regimen (0.007–0.076 mg   m 2   h 1 ).
It is important to highlight that recent research has observed higher emission peaks under the AWD regimen [2,16], although most of them are lower than the maximum value recorded in this study (0.623 mg   m 2   h 1 ), as detailed in Table 2 [3,5,13]. This could be due to the use of a high amount of nitrogen fertilizers (250 kg   N   ha 1 ), which is the conventional dose in this study area, as reported by local farmers [35]. It is important to mention that this nitrogen amount exceeds that used in previous research, as shown in Table 5. Therefore, it led to higher inorganic nitrogen production and excessive growth of the nitrifying microorganism population. Moreover, the lower moisture conditions during intermittent drainage periods favor N2O overproduction [12]. The alternation between oxygenated and anoxic conditions during the AWD regimen can enhance nitrification and denitrification processes, depending on oxygen availability [3]. It is suggested that the alternation of soil wetting and drying stimulated N2O production due to the use of endogenous nitrogen released from soil organic matter, originating from both fertilizer application and nutrients released by plant roots [16].
However, N2O emissions were also affected by the long periods without irrigation due to a break in a water distribution channel between days 70 and 80 DAP. This interruption had a major impact on emissions under AWD (0.178–0.623 mg   m 2   h 1 ). Despite this change in conditions, emissions under CF did not increase significantly, as the soil remained waterlogged for an extended period, resulting in complete denitrification [15,36].

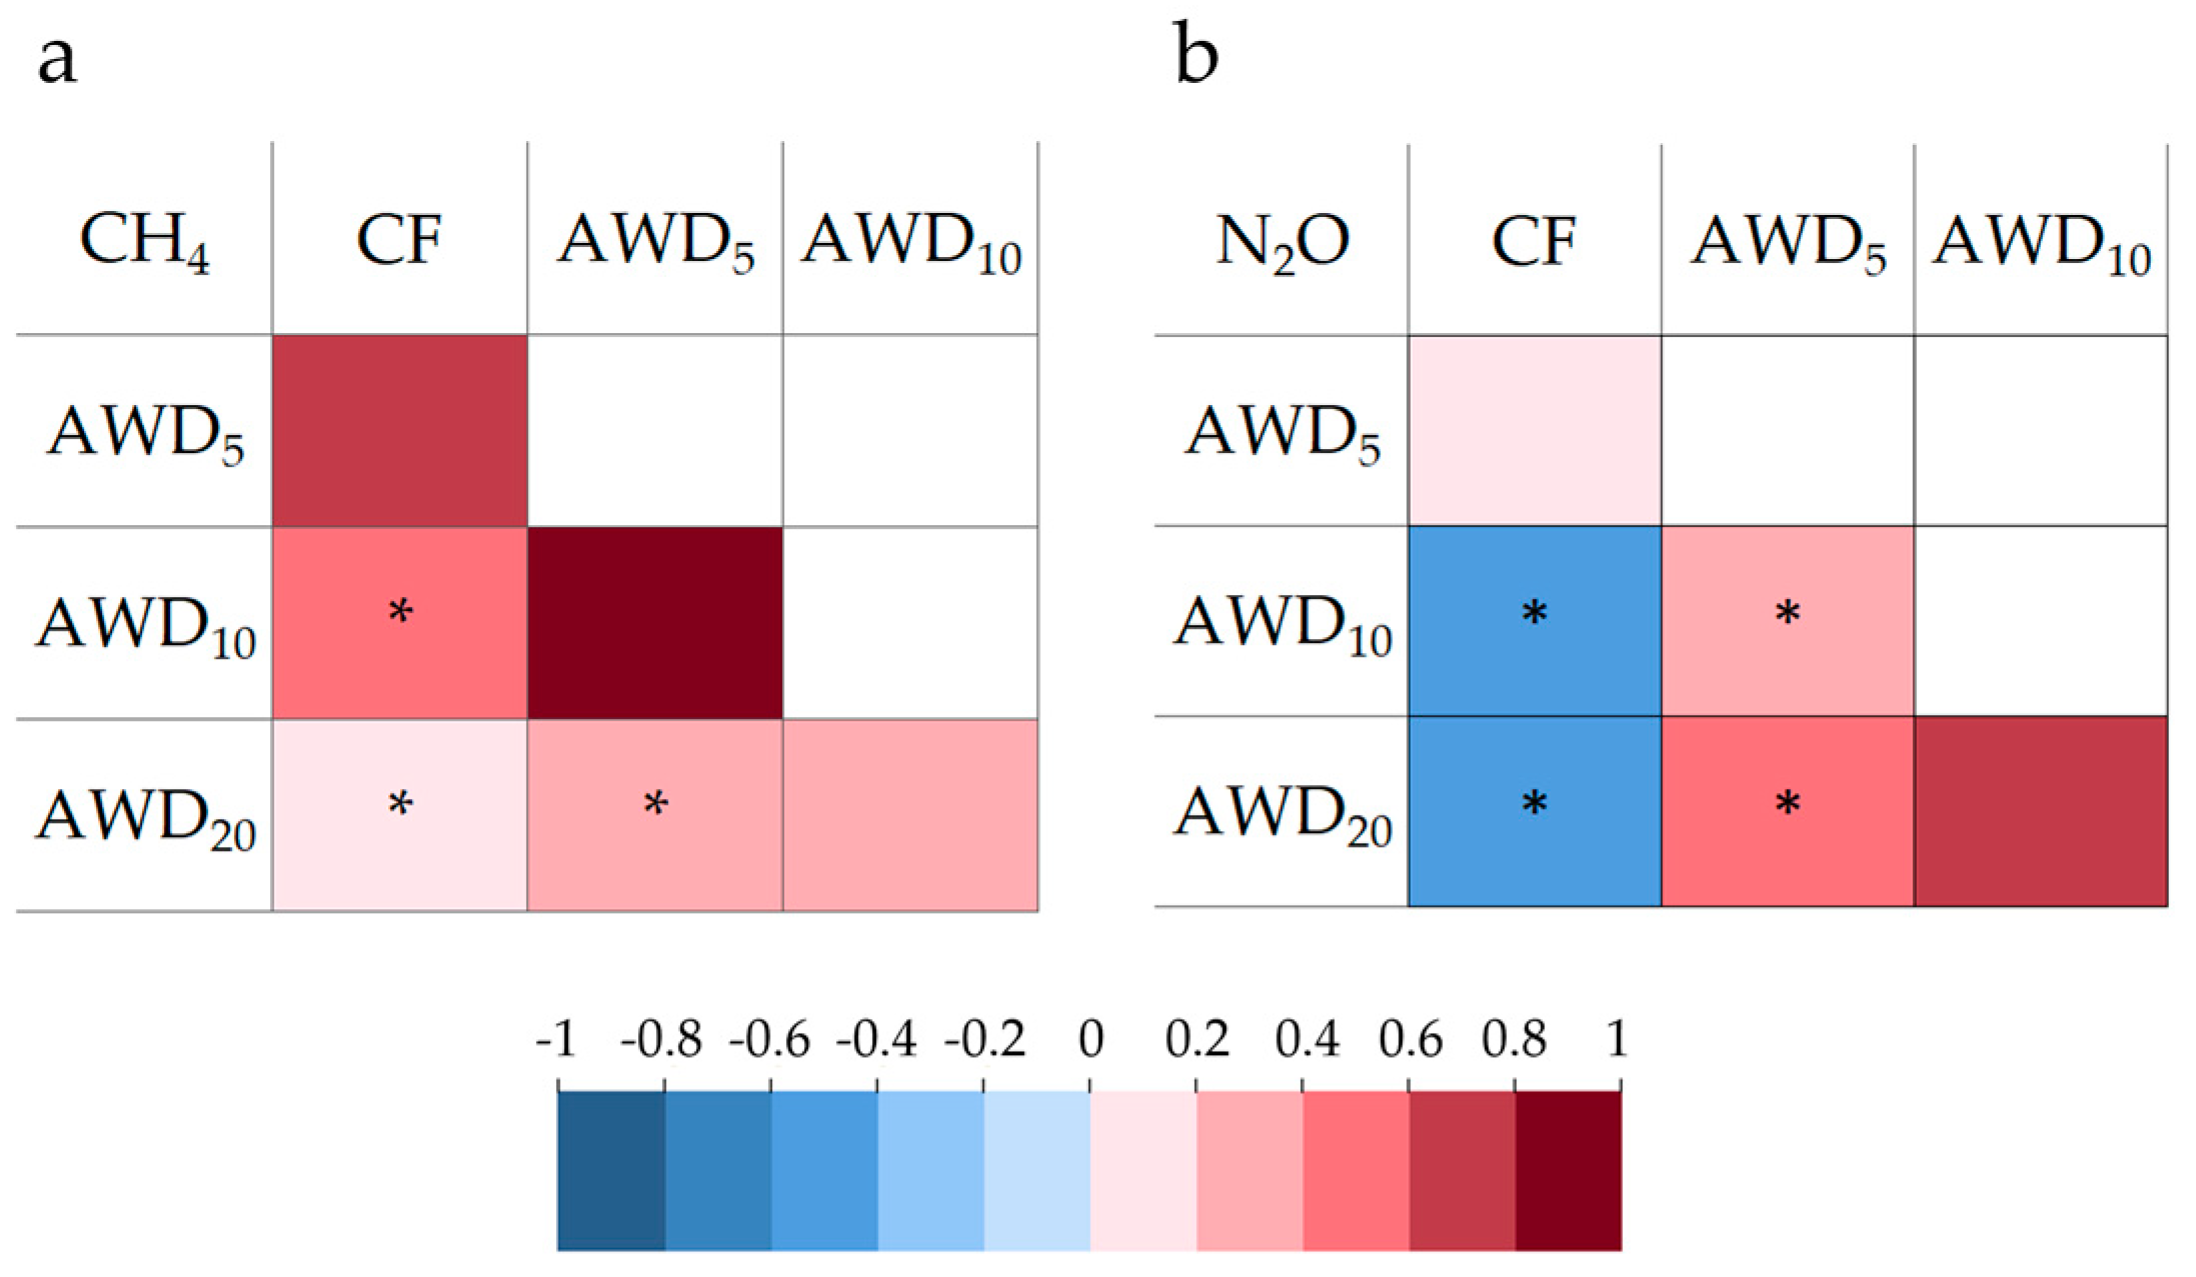
4.3. Effect of Water Regimens on Cumulative GHG Emissions

Water management affected CH4 emissions from rice cultivation. In this study, AWD irrigation significantly reduced ( p < 0.05 ) CH4 emissions compared to the conventional farmers practice (Table 3). These results are consistent with previous findings (Table 5) [5,12], with reductions of 99% in the AWD20 treatment. Because, intermittent aeration makes an oxygen-rich soil environment, resulting in CH4 oxidation by methanotrophs, causing a drop in CH4 emissions (1.670 kg   ha 1 para AWD20). It has been reported that up to 80% of CH4 produced during the rice cultivation season is oxidized by these methanotrophs [17,34].
In contrast, rice cultivation under the CF regimen creates an anaerobic soil environment, i.e., a reducing environment. Leading to a low redox potential (−150 mV), this medium favors the anaerobic decomposition of complex organic substances by methanogens [5,14]. Generating two important reactions: the reduction of CO2 with H2 derived from organic compounds or methylated compounds and the decarboxylation of acetic acid, which is known as methanogenesis, driving the production of CH4 [37].
Water management also had a significant impact on cumulative N2O emissions (Table 3). Under CF conditions, N2O emissions were minimal (0.631 kg   ha 1 ). In contrast, in fields with AWD irrigation, emissions were significantly higher, with the highest in the AWD10 treatment (2.354 kg   ha 1 ). The variation in water regimens, transitioning from CF to AWD, influenced nitrification and denitrification rates, depending on oxygen availability. During the flooding period, nitrification of ammonium ions (NH4+) is low, inhibiting N2O production [3]. However, during the drying cycle, the upper soil layer initially becomes aerobic, but the lower layer remains anaerobic, even if the water level is more than 15 cm below the soil surface [14]. This explains that despite the AWD20 treatment having the longest aeration time (2.243 kg   ha 1 ) it did not surpass the cumulative emissions of the AWD10 treatment (2.354 kg   ha 1 ).

4.4. Effect of AWD Irrigation on Emission Factors, Grain Yield, Water Use Efficiency, GWP and YGWP

Water management influenced the CH4 emission factor. Under the AWD regimen, values ranged between 0.01 and 0.92 kg   ha 1   d 1 , compared to the CF regimen, where 0.92 kg   ha 1   d 1 was obtained. It is relevant to mention that the value obtained in the CF regimen falls within the range of values presented by the IPCC for South America (0.86–1.88 kg   CH 4   ha 1   d 1 ) [38]. FE measured by the IPCC is based on specific assumptions, such as the absence of organic amendments in the fields and aeration conditions for 180 days before planting, conditions that were applied in our experiment.
Regarding grain yield, a decrease is observed with respect to the AWD treatments. It is possible that this decrease is due to the rapid drainage of water in the sandy loam soil, which caused the plant to suffer from drought stress, in addition to the high temperatures in the area [15]. However, for AWD10 only a 2% decrease was recorded. This suggests that increasing soil air exchange with AWD can provide sufficient oxygen to the root system to facilitate the mineralization of soil organic matter. This increases soil fertility and improves rice production, which does not happen in the AWD5 treatment [39].
In contrast, the maximum grain yield value is observed in the CF regimen (14.01 t   ha 1 ), which coincides with the maximum CH4 emissions (140,963 kg   ha 1 ). This is related to optimal vegetative and root development, which generates an increase in available carbon and root exudation. The latter is a substrate used by methanogenic bacteria that cause high yields and emissions of CH4 [12,33].
It is observed that AWD irrigation could increase WUE mainly due to the reduction in the amount of irrigation [40]. Of the three AWD levels, AWD10 had the highest efficiency due to its high performance and low irrigation level due to intermittent drainage periods, which is an alternative for times of low water supply for irrigation.
On the other hand, the AWD scale factor for CH4 varied between 0.01 and 0.16, significantly lower values than those presented by the IPCC (0.41–0.72 kg   C H 4   ha 1   d 1 ), corresponding to the water regimen with multiple drainage periods [38]. The IPCC also specifies that crop fields must have a period without flooding. However, in this study, this period was interrupted due to the presence of Cyclone “Yaku”, explaining the notable difference in emission factor values in the AWD regimen.
Different water regimens revealed a trade-off relationship between CH4 and N2O emissions. Despite the 100% increase in cumulative N2O emissions with AWD irrigation compared to CF irrigation, this only offset less than 1% of the total GWP. Overall, the AWD irrigation regimen reduced GWP by 77% compared to the CF irrigation. These results confirm that the total GWP in rice fields is mainly determined by CH4 emissions, even though N2O (265 kg CO2) has a higher radiative forcing in terms of CO2 [41]. Consequently, CH4 represents the main contributor to GWP in rice cultivation, accounting for over 90% of the total GWP. In this study, CH4 emissions represented 94.78% in AWD and 98.9% in CF. These findings align with previous research [6,12,16,34]. In other studies, it is mentioned that the primary contributor to GWP in CF irrigation corresponds to N2O due to variations in drainage to field capacity during fertilization, leading to increased N2O emissions [15]. Therefore, the most effective measures to reduce GWP and greenhouse gas emissions in rice cultivation should focus on reducing CH4 emissions.
The YGWP, or the relationship between total GHG emissions and grain yield, was used to measure the efficiency and sustainability of a rice management system. Similarly to the GWP, AWD irrigation demonstrated the potential to reduce YGWP by an average of 75% compared to CF irrigation [5,16]. Although the AWD20 regimen presented the lowest YGWP value (0.05), it is considered that the AWD10 regimen effectively mitigates GWP, as it only reduces grain yield by 2%. Additionally, neither treatment shows significant differences regarding YGWP. This means that AWD irrigation has an environmental improvement effect, contributing to a reduction in water use with the additional potential of saving fossil fuel-based energy and reducing CO2 emissions, which is why it can be considered as a strategy for mitigation for decision-makers and policymakers. In addition, it supports the state’s commitment to the United Nations Framework Convention on Climate Change.

4.5. Challenges and Viability

In this study, the challenge was due to the transportation of the closed static chambers to the field, which is why they were replaced with a lighter material using opaque chambers. In addition, the presence of abnormal precipitation caused by Cyclone “Yaku” significantly altered soil moisture conditions, generating variations in greenhouse gas (GHG) emissions in the proposed treatments. Despite these challenges, AWD irrigation stood out as a low GHG emission regimen, establishing itself as an effective mitigation option to reduce emissions in rice fields.
This is an irrigation system practiced in the Lambayeque region during periods of drought caused by a lack of rain [18]. However, this regimen can be applied in any season to benefit the predominantly family-based agriculture practiced by the population. This can contribute to the economic viability of the locality and ensure food security.

5. Conclusions

In the context of climate change, both the availability of water resources and food security have significant risks. For this reason, the AWD method becomes relevant by greatly reducing greenhouse gas emissions and the demand for irrigation water. In this study, grain yield and greenhouse gas emissions were evaluated under the CF regimen and irrigation levels AWD5, AWD10, and AWD20. An average 93% reduction in CH4 emissions was observed, as well as a 198% increase in N2O emissions. Regarding grain yield, it experienced a decrease of 15%, 2%, and 5% for the AWD5, AWD10, and AWD20 levels, respectively. With respect to WUE, AWD irrigation shows greater efficiency, with 0.83, 0.96, and 0.92 kg   m 3 for AWD5, AWD10, and AWD20, respectively, and a 28% water reduction in AWD irrigation. Despite the increase in N2O emissions, the GWP was mainly influenced by the reduction of CH4. This resulted in a notable decrease in GWP under the AWD irrigation regimen. This pattern was also reflected in the total GHG emissions in relation to grain yield (YGWP), being 0.07, 0.06, and 0.05 kg CO2 eq kg 1 grain yield for irrigation regimens AWD5, AWD10, and AWD20, respectively. The findings highlight the importance of a more detailed and specialized approach in AWD10 treatment, considering its minimal impact on grain yield. The results of this study support the adoption of AWD irrigation as a strategy to mitigate CO2 emissions while contributing to the reduction of water use. This approach acquires relevance in the socioeconomic and climatic context of the northern coast of Peru, since it safeguards the supply of rice in the population’s diet during times of drought.

Author Contributions

Conceptualization, L.F.d.P. and L.R.-F.; methodology, E.H.-A., I.E.-C. and M.B.-C.; validation, L.R.-F., L.F.d.P. and L.C.-V.; investigation, I.E.-C., M.B.-C. and L.R.-F.; resources, L.R.-F., L.C.-V. and L.F.d.P.; data curation, L.R.-F., I.E.-C. and M.B.-C.; writing-original draft preparation I.E.-C., M.B.-C. and L.R.-F.; writing-review and editing, L.R.-F., L.C.-V. and L.F.d.P.; supervision, L.R.-F., E.H.-A., L.C.-V. and L.F.d.P.; project management, L.R.-F. All authors have read and agreed to the published version of the manuscript.

Funding

This research was funded by the National Scientific Research and Advanced Studies Program (PROCIENCIA) of PROCIENCIA-Peru, under the project “Implementation of the technological tool in the development of a precision system with remote sensors to optimize the use of water and reduce the emission of greenhouse gases in rice fields for the benefit of farmers in the Lambayeque region” (Project No. PRO501078113-2022-PROCIENCIA-Peru).

Institutional Review Board Statement

Not applicable.

Informed Consent Statement

Not applicable.

Data Availability Statement

The data presented in this study are available on request from the corresponding author.

Conflicts of Interest

The authors declare no conflicts of interest.

References

  1. Park, J.-R.; Jang, Y.-H.; Kim, E.-G.; Lee, G.-S.; Kim, K.-M. Nitrogen Fertilization Causes Changes in Agricultural Characteristics and Gas Emissions in Rice Field. Sustainability 2023, 15, 3336. [Google Scholar] [CrossRef]
  2. Rajasekar, P.; Selvi, J.A.V. Sensing and Analysis of Greenhouse Gas Emissions from Rice Fields to the Near Field Atmosphere. Sensors 2022, 22, 4141. [Google Scholar] [CrossRef] [PubMed]
  3. Islam, S.M.M.; Gaihre, Y.K.; Islam, M.R.; Ahmed, M.N.; Akter, M.; Singh, U.; Sander, B.O. Mitigating Greenhouse Gas Emissions from Irrigated Rice Cultivation through Improved Fertilizer and Water Management. J. Environ. Manag. 2022, 307, 114520. [Google Scholar] [CrossRef] [PubMed]
  4. Masson-Delmotte, V.; Zhai, P.; Pirani, A.; Connors, S.L.; Péan, C.; Berger, S.; Caud, N.; Chen, Y.; Goldfarb, L.; Gomis, M.I.; et al. IPCC Climate Change 2021: The Physical Science Basis. Contribution of Working Group I to the Sixth Assessment Report of the Intergovernmental Panel on Climate Change; Cambridge University Press: Cambridge, UK; New York, NY, USA, 2021. [Google Scholar]
  5. Islam, S.M.M.; Gaihre, Y.K.; Islam, M.R.; Akter, M.; Al Mahmud, A.; Singh, U.; Sander, B.O. Effects of Water Management on Greenhouse Gas Emissions from Farmers’ Rice Fields in Bangladesh. Sci. Total Environ. 2020, 734, 139382. [Google Scholar] [CrossRef] [PubMed]
  6. Liao, B.; Cai, T.; Wu, X.; Luo, Y.; Liao, P.; Zhang, B.; Zhang, Y.; Wei, G.; Hu, R.; Luo, Y.; et al. A Combination of Organic Fertilizers Partially Substitution with Alternate Wet and Dry Irrigation Could Further Reduce Greenhouse Gases Emission in Rice Field. J. Environ. Manag. 2023, 344, 118372. [Google Scholar] [CrossRef]
  7. Della Lunga, D.; Brye, K.R.; Slayden, J.M.; Henry, C.G. Evaluation of Site Position and Tillage Effects on Global Warming Potential from Furrow-Irrigated Rice in the Mid-Southern USA. Geoderma Reg. 2023, 32, e00625. [Google Scholar] [CrossRef]
  8. Mallareddy, M.; Thirumalaikumar, R.; Balasubramanian, P.; Naseeruddin, R.; Nithya, N.; Mariadoss, A.; Eazhilkrishna, N.; Choudhary, A.K.; Deiveegan, M.; Subramanian, E.; et al. Maximizing Water Use Efficiency in Rice Farming: A Comprehensive Review of Innovative Irrigation Management Technologies. Water 2023, 15, 1802. [Google Scholar] [CrossRef]
  9. Liu, L.; Ouyang, W.; Liu, H.; Zhu, J.; Ma, Y.; Wu, Q.; Chen, J.; Zhang, D. Potential of Paddy Drainage Optimization to Water and Food Security in China. Resour. Conserv. Recycl. 2021, 171, 105624. [Google Scholar] [CrossRef]
  10. Habib, M.A.; Islam, S.M.M.; Haque, M.A.; Hassan, L.; Ali, M.Z.; Nayak, S.; Dar, M.H.; Gaihre, Y.K. Effects of Irrigation Regimes and Rice Varieties on Methane Emissions and Yield of Dry Season Rice in Bangladesh. Soil Syst. 2023, 7, 41. [Google Scholar] [CrossRef]
  11. Cheng, H.; Shu, K.; Zhu, T.; Wang, L.; Liu, X.; Cai, W.; Qi, Z.; Feng, S. Effects of Alternate Wetting and Drying Irrigation on Yield, Water and Nitrogen Use, and Greenhouse Gas Emissions in Rice Paddy Fields. J. Clean. Prod. 2022, 349, 131487. [Google Scholar] [CrossRef]
  12. Liang, K.; Zhong, X.; Fu, Y.; Hu, X.; Li, M.; Pan, J.; Liu, Y.; Hu, R.; Ye, Q. Mitigation of Environmental N Pollution and Greenhouse Gas Emission from Double Rice Cropping System with a New Alternate Wetting and Drying Irrigation Regime Coupled with Optimized N Fertilization in South China. Agric. Water Manag. 2023, 282, 108282. [Google Scholar] [CrossRef]
  13. Gaihre, Y.K.; Bible, W.D.; Singh, U.; Sanabria, J.; Baral, K.R. Mitigation of Nitrous Oxide Emissions from Rice–Wheat Cropping Systems with Sub-Surface Application of Nitrogen Fertilizer and Water-Saving Irrigation. Sustainability 2023, 15, 7530. [Google Scholar] [CrossRef]
  14. Ariani, M.; Hanudin, E.; Haryono, E. The Effect of Contrasting Soil Textures on the Efficiency of Alternate Wetting-Drying to Reduce Water Use and Global Warming Potential. Agric. Water Manag. 2022, 274, 107970. [Google Scholar] [CrossRef]
  15. Loaiza, S.; Verchot, L.; Valencia, D.; Guzmán, P.; Amezquita, N.; Garcés, G.; Puentes, O.; Trujillo, C.; Chirinda, N.; Pittelkow, C.M. Evaluating Greenhouse Gas Mitigation through Alternate Wetting and Drying Irrigation in Colombian Rice Production. Agric. Ecosyst. Environ. 2024, 360, 108787. [Google Scholar] [CrossRef]
  16. Sha, Y.; Chi, D.; Chen, T.; Wang, S.; Zhao, Q.; Li, Y.; Sun, Y.; Chen, J.; Lærke, P.E. Zeolite Application Increases Grain Yield and Mitigates Greenhouse Gas Emissions under Alternate Wetting and Drying Rice System. Sci. Total Environ. 2022, 838, 156067. [Google Scholar] [CrossRef] [PubMed]
  17. Alauddin, M.; Rashid Sarker, M.A.; Islam, Z.; Tisdell, C. Adoption of Alternate Wetting and Drying (AWD) Irrigation as a Water-Saving Technology in Bangladesh: Economic and Environmental Considerations. Land Use Policy 2020, 91, 104430. [Google Scholar] [CrossRef]
  18. Yu, B.; Liu, J.; Wu, D.; Liu, Y.; Cen, W.; Wang, S.; Li, R.; Luo, J. Weighted Gene Coexpression Network Analysis-Based Identification of Key Modules and Hub Genes Associated with Drought Sensitivity in Rice. BMC Plant Biol. 2020, 20, 478. [Google Scholar] [CrossRef]
  19. Matsuda, S.; Nakamura, K.; Hung, T.; Quang, L.X.; Horino, H.; Hai, P.T.; Ha, N.D.; Hama, T. Paddy Ponding Water Management to Reduce Methane Emission Based on Observations of Methane Fluxes and Soil Redox Potential in the Red River Delta, Vietnam. Irrig. Drain. 2022, 71, 241–254. [Google Scholar] [CrossRef]
  20. Elsadek, E.; Zhang, K.; Mousa, A.; Ezaz, G.T.; Tola, T.L.; Shaghaleh, H.; Hamad, A.A.A.; Alhaj Hamoud, Y. Study on the In-Field Water Balance of Direct-Seeded Rice with Various Irrigation Regimes under Arid Climatic Conditions in Egypt Using the AquaCrop Model. Agronomy 2023, 13, 609. [Google Scholar] [CrossRef]
  21. Raes, D. Manuales de Capacitación de AquaCrop: Libro I: Comprensión de AquaCrop; Organización de las Naciones Unidas para la Alimentación y la Agricultura: Roma, Italy, 2017. [Google Scholar]
  22. Porras-Jorge, R.; Ramos-Fernández, L.; Ojeda-Bustamante, W.; Ontiveros-Capurata, R. Performance Assessment of the AquaCrop Model to Estimate Rice Yields under Alternate Wetting and Drying Irrigation in the Coast of Peru. Sci. Agropecu 2020, 11, 309–321. [Google Scholar] [CrossRef]
  23. Lombardi, B.; Loaiza, S.; Trujillo, C.; Arevalo, A.; Vázquez, E.; Arango, J.; Chirinda, N. Greenhouse Gas Emissions from Cattle Dung Depositions in Two Urochloa Forage Fields with Contrasting Biological Nitrification Inhibition (BNI) Capacity. Geoderma 2022, 406, 115516. [Google Scholar] [CrossRef] [PubMed]
  24. Chirinda, N.; Arenas, L.; Loaiza, S.; Trujillo, C.; Katto, M.; Chaparro, P.; Nuñez, J.; Arango, J.; Martinez-Baron, D.; Loboguerrero, A.; et al. Novel Technological and Management Options for Accelerating Transformational Changes in Rice and Livestock Systems. Sustainability 2017, 9, 1891. [Google Scholar] [CrossRef]
  25. Elder, J.W.; Lal, R. Tillage Effects on Gaseous Emissions from an Intensively Farmed Organic Soil in North Central Ohio. Soil Tillage Res. 2008, 98, 45–55. [Google Scholar] [CrossRef]
  26. Yu, K.; Xiao, S.; Zheng, F.; Fang, X.; Zou, J.; Liu, S. A Greater Source of Methane from Drainage Rivers than from Rice Paddies with Drainage Practices in Southeast China. Agric. Ecosyst. Environ. 2023, 345, 108321. [Google Scholar] [CrossRef]
  27. Luan, J.; Wu, J. Gross Photosynthesis Explains the ‘Artificial Bias’ of Methane Fluxes by Static Chamber (Opaque versus Transparent) at the Hummocks in a Boreal Peatland. Environ. Res. Lett. 2014, 9, 105005. [Google Scholar] [CrossRef]
  28. Liu, N.; Liu, F.; Sun, Z.; Wang, Z.; Yang, L. Nitrogen Addition Changes the Canopy Biological Characteristics of Dominant Tree Species in an Evergreen Broad-Leaved Forest. Sci. Total Environ. 2023, 902, 165914. [Google Scholar] [CrossRef]
  29. Hu, M.; Wade, A.J.; Shen, W.; Zhong, Z.; Qiu, C.; Lin, X. Effects of Organic Fertilizers Produced by Different Production Processes on Nitrous Oxide and Methane Emissions from Double-Cropped Rice Fields. Pedosphere 2023, S1002016023000255. [Google Scholar] [CrossRef]
  30. Van Dung, T.; Thu Nguyen, K.; Ho, N.H.P.; Lich Duong, N.T.; Vu, N.M.T.; Nguyen, T.P.L.; Van, L.V.; MacDonald, B. Reducing Greenhouse Gas Emission by Alternation of the Upland Crop Rotation in the Mekong Delta, Vietnam. Soil Water Res. 2023, 18, 16–24. [Google Scholar] [CrossRef]
  31. Montgomery, D. Diseño y Análisis de Experimentos; Grupo editorial Iberoamérica: México City, Mexico, 1991. [Google Scholar]
  32. SENAMHI. Boletín Climático Nacional (Marzo 2023); Servicio Nacional de Meteorología e Hidrología del Perú: Lima, Peru, 2023. [Google Scholar]
  33. Lakshani, M.M.T.; Deepagoda, T.K.K.C.; Li, Y.; Hansen, H.F.E.; Elberling, B.; Nissanka, S.P.; Senanayake, D.M.J.B.; Hamamoto, S.; Babu, G.L.S.; Chanakya, H.N.; et al. Impact of Water Management on Methane Emission Dynamics in Sri Lankan Paddy Ecosystems. Water 2023, 15, 3715. [Google Scholar] [CrossRef]
  34. Phungern, S.; Azizan, S.N.F.; Yusof, N.B.; Noborio, K. Effects of Water Management and Rice Varieties on Greenhouse Gas Emissions in Central Japan. Soil Syst. 2023, 7, 89. [Google Scholar] [CrossRef]
  35. White, M.; Heros, E.; Graterol, E.; Chirinda, N.; Pittelkow, C.M. Balancing Economic and Environmental Performance for Small-Scale Rice Farmers in Peru. Front. Sustain. Food Syst. 2020, 4, 564418. [Google Scholar] [CrossRef]
  36. Jiang, Y.; Carrijo, D.; Huang, S.; Chen, J.; Balaine, N.; Zhang, W.; Van Groenigen, K.J.; Linquist, B. Water Management to Mitigate the Global Warming Potential of Rice Systems: A Global Meta-Analysis. Field Crops Res. 2019, 234, 47–54. [Google Scholar] [CrossRef]
  37. Khaliq, M.A.; Khan Tarin, M.W.; Jingxia, G.; Yanhui, C.; Guo, W. Soil Liming Effects on CH4, N2O Emission and Cd, Pb Accumulation in Upland and Paddy Rice. Environ. Pollut. 2019, 248, 408–420. [Google Scholar] [CrossRef]
  38. IPCC Refinement to the 2006 IPCC Guidelines for National Greenhouse Gas Inventories; Chapter 5 Cropland; IPCC: Geneva, Switzerland, 2019; Volume 4.
  39. Oo, A.Z.; Sudo, S.; Inubushi, K.; Chellappan, U.; Yamamoto, A.; Ono, K.; Mano, M.; Hayashida, S.; Koothan, V.; Osawa, T.; et al. Mitigation Potential and Yield-Scaled Global Warming Potential of Early-Season Drainage from a Rice Paddy in Tamil Nadu, India. Agronomy 2018, 8, 202. [Google Scholar] [CrossRef]
  40. Li, Z.; Shen, Y.; Zhang, W.; Wang, Z.; Gu, J.; Yang, J.; Zhang, J. A Moderate Wetting and Drying Regime Produces More and Healthier Rice Food with Less Environmental Risk. Field Crops Res. 2023, 298, 108954. [Google Scholar] [CrossRef]
  41. IPCC. Climate Change 2014: Synthesis Report. Contribution of Working Groups I, II and III to the Fifth Assessment Report of the Intergovernmental Panel on Climate Change; Core Writing Team, Pachauri, R.K., Meyer, L.A., Eds.; IPCC: Geneva, Switzerland, 2014; p. 151. [Google Scholar]
Figure 1. Location of the study area on the northern coast of Peru (a), Lambayeque region (b), Agricultural Experimental Station (EEA) INIA—Vista Florida, Lambayeque (c).
Agronomy 14 00248 g001
Figure 2. Variation in Ta (a), HR (b), Rs (c), and Vv (d) every five minutes during the monitoring hour with the portable automatic station. Daily variation in Ta and cumulative precipitation during crop development (e) with the Vista Florida SENAMHI automatic station.
Agronomy 14 00248 g002
Figure 3. Greenhouse gas (GHG) monitoring and nitrogen fertilization (a), Crop phenology (b).
Agronomy 14 00248 g003
Figure 4. Diagram of the opaque closed static chamber.
Agronomy 14 00248 g004
Figure 5. Diagram of the transparent closed static chamber.
Agronomy 14 00248 g005
Figure 6. Closed static chambers in the field: transparent (a) and opaque (b).
Agronomy 14 00248 g006
Figure 7. Temporal Variation of CH4 Flux ( mg   m 2   h 1 ) during the crop development under CF irrigation regimen (a), AWD5 (b), AWD10 (c), and AWD20 (d).
Agronomy 14 00248 g007
Figure 8. Temporal Variation of N2O Flux ( mg   m 2   h 1 ) during the crop development under CF irrigation regimen (a), AWD5 (b), AWD10 (c), and AWD20 (d).
Agronomy 14 00248 g008
Figure 9. Non-parametric Spearman correlation and Dunn statistical test between irrigation regimens based on CH4 emission (a) and N2O emission (b). The (*) indicates significant differences between treatments ( p < 0.05 ).
Agronomy 14 00248 g009
Table 1. Water balance in mm according to the different irrigation regimens.
ComponentsCFAWD5AWD10AWD20
Precipitation164.6164.6164.6164.6
Irrigation1997142814341447
Percolation1723.31180.91206.91330.7
Evapotranspiration738722.6717.3729.9
Water Use Efficiency (WUE) is determined by the ratio of the grain yield to the irrigation volume.
Table 2. Flux of CH4 and N2O Emissions under Continuous Flooding (CF) and AWD Treatments.
FechaDAP C - CH 4   ( m g   m 2   h 1 ) N - N 2 O   ( m g   m 2   h 1 )
CFAWD5AWD10AWD20CFAWD5AWD10AWD20
11 February 2023380.0250.0080.0130.0140.0070.0100.0270.021
15 February 2023420.2890.0330.0230.0160.0080.0430.0810.379
6 March 2023610.8571.1020.3840.1770.0160.0130.0340.009
10 March 2023651.1102.7780.1770.1670.0190.0170.0300.028
20 February 2023755.8160.6030.1290.0230.0110.1780.6230.148
24 March 20237917.9240.2420.0220.0480.0110.1310.3200.059
2 April 2023880.7690.2230.0020.0280.0290.0450.0400.019
6 April 2023923.2630.8310.0830.0110.0160.0100.0330.041
17 April 20231038.2141.3530.3070.0470.0190.0200.0190.014
21 April 20231076.1881.1220.4930.0280.0080.0280.0280.211
7 May 20231234.9960.3100.1020.0530.0180.0030.0200.010
11 May 20231275.9020.2630.0500.0060.0170.0130.0240.007
31 May 20231470.0200.0030.0150.0920.0760.0180.0260.027
2 June 20231490.0020.0420.0160.0150.0460.0460.0100.024
7 June 20231540.0250.0050.0040.0390.0270.0300.005-
9 June 20231560.0060.0200.0310.0140.0500.0180.0250.016
Table 3. Effect of Irrigation Regimens and Their Levels on Rice Yield, CH4 and N2O Emissions, Emission Factor, GWP, and YGWP.
Water RegimensGrain YieldEUAEmission (kg ha−1)EF (kg ha−1 d−1)GWP aYGWP b
(t ha−1)(kg m−3)CH4N2OCH4N2O
CF14.01 a0.70108.55 a0.63 a0.92 a0.01 a3211.54 a0.23 a
AWD511.85 b0.8317.72 a1.05 a0.15 a0.01 a782.11 b0.07 b
AWD1013.72 c0.964.02 b2.36 b0.03 b0.02 b755.58 b0.06 c
AWD2013.32 c0.921.59 c2.24 c0.01 c0.02 b656.46 b0.05 c
a WUE (regarding the water use efficiency; kg   m 3 ) is calculated by dividing grain yield by irrigation volume. b GWP (global warming potential; kg CO2 equivalent ha 1 ) of CH4 and N2O was calculated using GWP values of 28 and 273 for CH4 and N2O, respectively. c YGWP (global warming potential at yield scale, kg CO2 equivalent kg 1 grain yield) was calculated by dividing the global warming potential by yield ( kg   ha 1 ).
Table 4. Cumulative emissions according to the phenological stage of rice cultivation.
Phenological
Stage
Emission CH4 (kg ha−1)Emission N2O (kg ha−1)
CFAWD5AWD10AWD20CFAWD5AWD10AWD20
Vegetation64.01725.7032.2141.0210.1680.7401.9701.489
Reproductive24.9263.9300.6970.1070.0680.0660.1040.101
Ripening51.9894.8161.6110.4670.3030.1650.2560.622
Post-Harvest0.0300.0460.0300.0760.0920.0720.0250.030
Table 5. Maximum flux of CH4 and N2O emissions under continuously flooded irrigation and AWD treatments according to various authors.
SiteClimate by
Köppen
SeasonSoil YearN 1
( k g   h a 1 )
CH4 Emission
( m g   m 2   h 1 )
N2O Emission
( m g   m 2   h 1 )
Ref.
CFAWDCFAWD
Alabama,
United States
Humid subtropicalDryLoamy2013105--0.010.06[13]
Daca,
Bangladesh
SavannaDryClay loam20187835340.130.12[5]
201919140.050.05
Mymensingh,
Bangladesh
Monsoonal Dry Loamy201890 730.030.06
2019750.040.03
Daca,
Bangladesh
SavannaDryClay loam20187819170.080.09[3]
201920130.090.08
202017130.090.08
Guangzhou, ChinaDry winter subtropicalDryClay loam201718029290.260.3[12]
Wet201815025210.20.3
Dry16026250.210.31
Wet201915031310.150.24
Dry18039330.40.31
Hubei,
China
Cool summerWetLoamy2021180740.010.2[6]
2022750.010.23
Hung Yeng, VietnamDry winter subtropicalDryClay2017-3024--[19]
Wet8496--
Jakenan, IndonesiaMonsoonalDryLoamy20201201070.10.1[14]
Wedarijaksa, IndonesiaLoamy clay10.80.120.14
Liaoning, ChinaWarm continental summerDryLoamy20171801730.91.2[16]
201841.50.30.4
2019320.050.09
Mymensingh,MonsoonalDryLoamy201918074--[10]
Bangladesh
Tamil Nadu, IndiaSavannaWet 20201802890.50.9[2]
Dry20212080.80.8
1 fertilizante nitrogenado.
Disclaimer/Publisher’s Note: The statements, opinions and data contained in all publications are solely those of the individual author(s) and contributor(s) and not of MDPI and/or the editor(s). MDPI and/or the editor(s) disclaim responsibility for any injury to people or property resulting from any ideas, methods, instructions or products referred to in the content.

