Article

Vegetation Restoration Increases Soil Carbon Storage in Land Disturbed by a Photovoltaic Power Station in Semi-Arid Regions of Northern China

1
College of Grassland, Resources and Environment, Inner Mongolia Agricultural University, Hohhot 010018, China
2
Inner Mongolia Key Laboratory of Soil Quality and Nutrient Resource, Hohhot 010018, China
3
Key Laboratory of Agricultural Ecological Security and Green Development, Universities of Inner Mongolia Autonomous, Hohhot 010018, China
4
College of Desert Control Science and Engineering, Inner Mongolia Agricultural University, Hohhot 010018, China
5
Grassland Research Institute, Chinese Academy of Agricultural Sciences, Hohhot 010010, China
6
Inner Mongolia Academy of Agricultural & Animal Husbandry Sciences, Hohhot 010031, China
*
Author to whom correspondence should be addressed.
Agronomy 2024, 14(1), 9; https://doi.org/10.3390/agronomy14010009
Submission received: 7 November 2023 / Revised: 14 December 2023 / Accepted: 18 December 2023 / Published: 20 December 2023

Abstract

:
The photovoltaic industry is developing rapidly because of its renewable energy and other advantages. However, the installation of this infrastructure may affect soil, vegetation, and carbon dynamics, making it is necessary to carry out vegetation restoration work at a plant’s location in the later stages of its construction. For this reason, three types of artificial vegetation were selected (Pinus sylvestris var. mongolica, Astragalus membra-naceus var. mongholicus and Medicago sativa) as research objects in an ecological photovoltaic power plant in Northern China, to study the changes in soil organic carbon storage (SOCS), carbon:nitrogen ratios (C:N) and C:phosphorus ratios (C:P) at different soil depths and for different vegetation types. Natural vegetation plots undisturbed by the construction of the power plant were used as a control. Seven years after revegetation, we found that the storage and content of soil organic carbon in all three artificial vegetation plots were notably lower compared to the control. Nevertheless, the soil’s organic carbon content for Medicago sativa plots increased was significantly higher by 1.2 g·kg−1 compared to Pinus sylvestris var. mongolica and A. membranaceus var. mongholicus plots, while organic carbon storage increased significantly by 3.55 t·ha and 7.15 t·ha. SOCS, C:N, and C:P concentrations in the 0–20 cm soil layer exhibited a significantly higher value in comparison to those of the 20–40 cm soil layer. As the soil depth increased, all the concentrations declined gradually. Vegetation type and soil depth, as well as their interaction, had a significant impact on soil carbon storage, C:N, and C:P. The study area was restricted by the availability of P. In general, vegetation restoration is a beneficial ecological practice for soil restoration at photovoltaic power stations. It is believed that planting alfalfa can accelerate the improvement of soil carbon with an extension of vegetation recovery time. In order to restore the balance of nutrients for plants, it is necessary to avoid human interference at the later stage, and to supplement phosphorus as soon as possible to minimize phosphorus limitation at the later stage of vegetation growth, which is of great importance to increasing the likelihood of success in reclaiming disturbed land.

1. Introduction

With the progress of science and technology and the support of governments, the solar photovoltaic industry has developed rapidly in recent years [1]. The renewable nature of solar energy resources has granted this technology great potential for further development [2,3]. Some experts predict that by the year 2100, the contribution of photovoltaics to the world’s electricity demand could be between 32,700 and 133,000 GW [1]. Although photovoltaic power has many advantages, including no need for fuel, lower operating costs, and helping to improve the lives of residents in remote areas that otherwise have no access to electricity, the ecological functions of the land, including carbon sequestration, can be significantly impacted by the installation of a photovoltaic system [4,5].
The installation of a solar photovoltaic plant involves significant earthwork: native vegetation is removed, the land is excavated, and compaction fill is added [6]. Altering the soil can modify its physical, chemical, and biological characteristics, which in turn can impact water and nutrient dynamics and availability. These changes involve a complex interplay between the soil and vegetation, affecting their ecological functions and interactions. One study showed that vegetation removal can lead to a reduction in soil aggregates and soil organic carbon (SOC) in some semi-arid areas [7]. The impact of the installation and operation of solar power plants on the environment has been studied by researchers [8,9]. The restoration of vegetation in the area affected by a photovoltaic power plant is considered an effective measure [10,11,12]. In 1982, the concept of integrating photovoltaic power generation with agriculture was initially presented by Goetzberger and Zastrow (1982) [13]. Since then, several studies have examined the vegetation growth surrounding photovoltaic power stations [14,15]. Xu et al. (2014) and Han et al. (2006) [16,17] reported that photovoltaic facilities in semi-arid regions significantly reduce surface and air temperature, which was conducive to accelerating plant growth and regional plant recovery. Liu et al. (2019) [18] found that the construction of a photovoltaic power plant promoted the growth of local vegetation by changing the microhabitat. When the plant environment was stable, the vegetation coverage rate reached 90.5%. Furthermore, the regular cleaning of photovoltaic panels also increases water input and promotes vegetation growth in semi-arid ecosystems [19,20]. One researcher found that soil nutrient availability also changed after vegetation restoration at photovoltaic power stations, and changes in vegetation cover caused by photovoltaic facility construction can affect the carbon sequestration potential of both the soil and vegetation [21]. Therefore, large-scale development of the photovoltaic industry may form new carbon sinks in the photovoltaic array coverage area. Although there is a great deal of research on the potential of terrestrial plants to sequester carbon [22,23], there is still a lack of relevant studies on the assessment of the carbon sequestration potential of vegetation influenced by photovoltaic facilities. Given this, we investigated whether the revegetation of a photovoltaic facility is capable of engendering SOCS properties similar to those at an undisturbed reference site. We conducted the experiment at a photovoltaic plant where vegetation restoration was implemented. Pinus sylvestris var. mongolica, Astragalus membranaceus var. mongholicus, and Medicago sativa, were planted between the photovoltaic panels, and nearby areas with natural grass vegetation were used as a control.
To understand the potential for organic carbon sequestration in soil and soil fertility after vegetation restoration, we addressed the following questions: (1) How did the SOCS under Pinus sylvestris var. mongolica, Astragalus membranaceus var. mongholicus, and Medicago sativa change compared to natural grass vegetation? (2) How is the 0–40 cm soil profile related to the SOCS, the soil C:N, and the soil C:P for the three types of vegetation. (3) How did the type of vegetation affect soil C:N and C:P, and were there nutrient limitations?

2. Materials and Methods

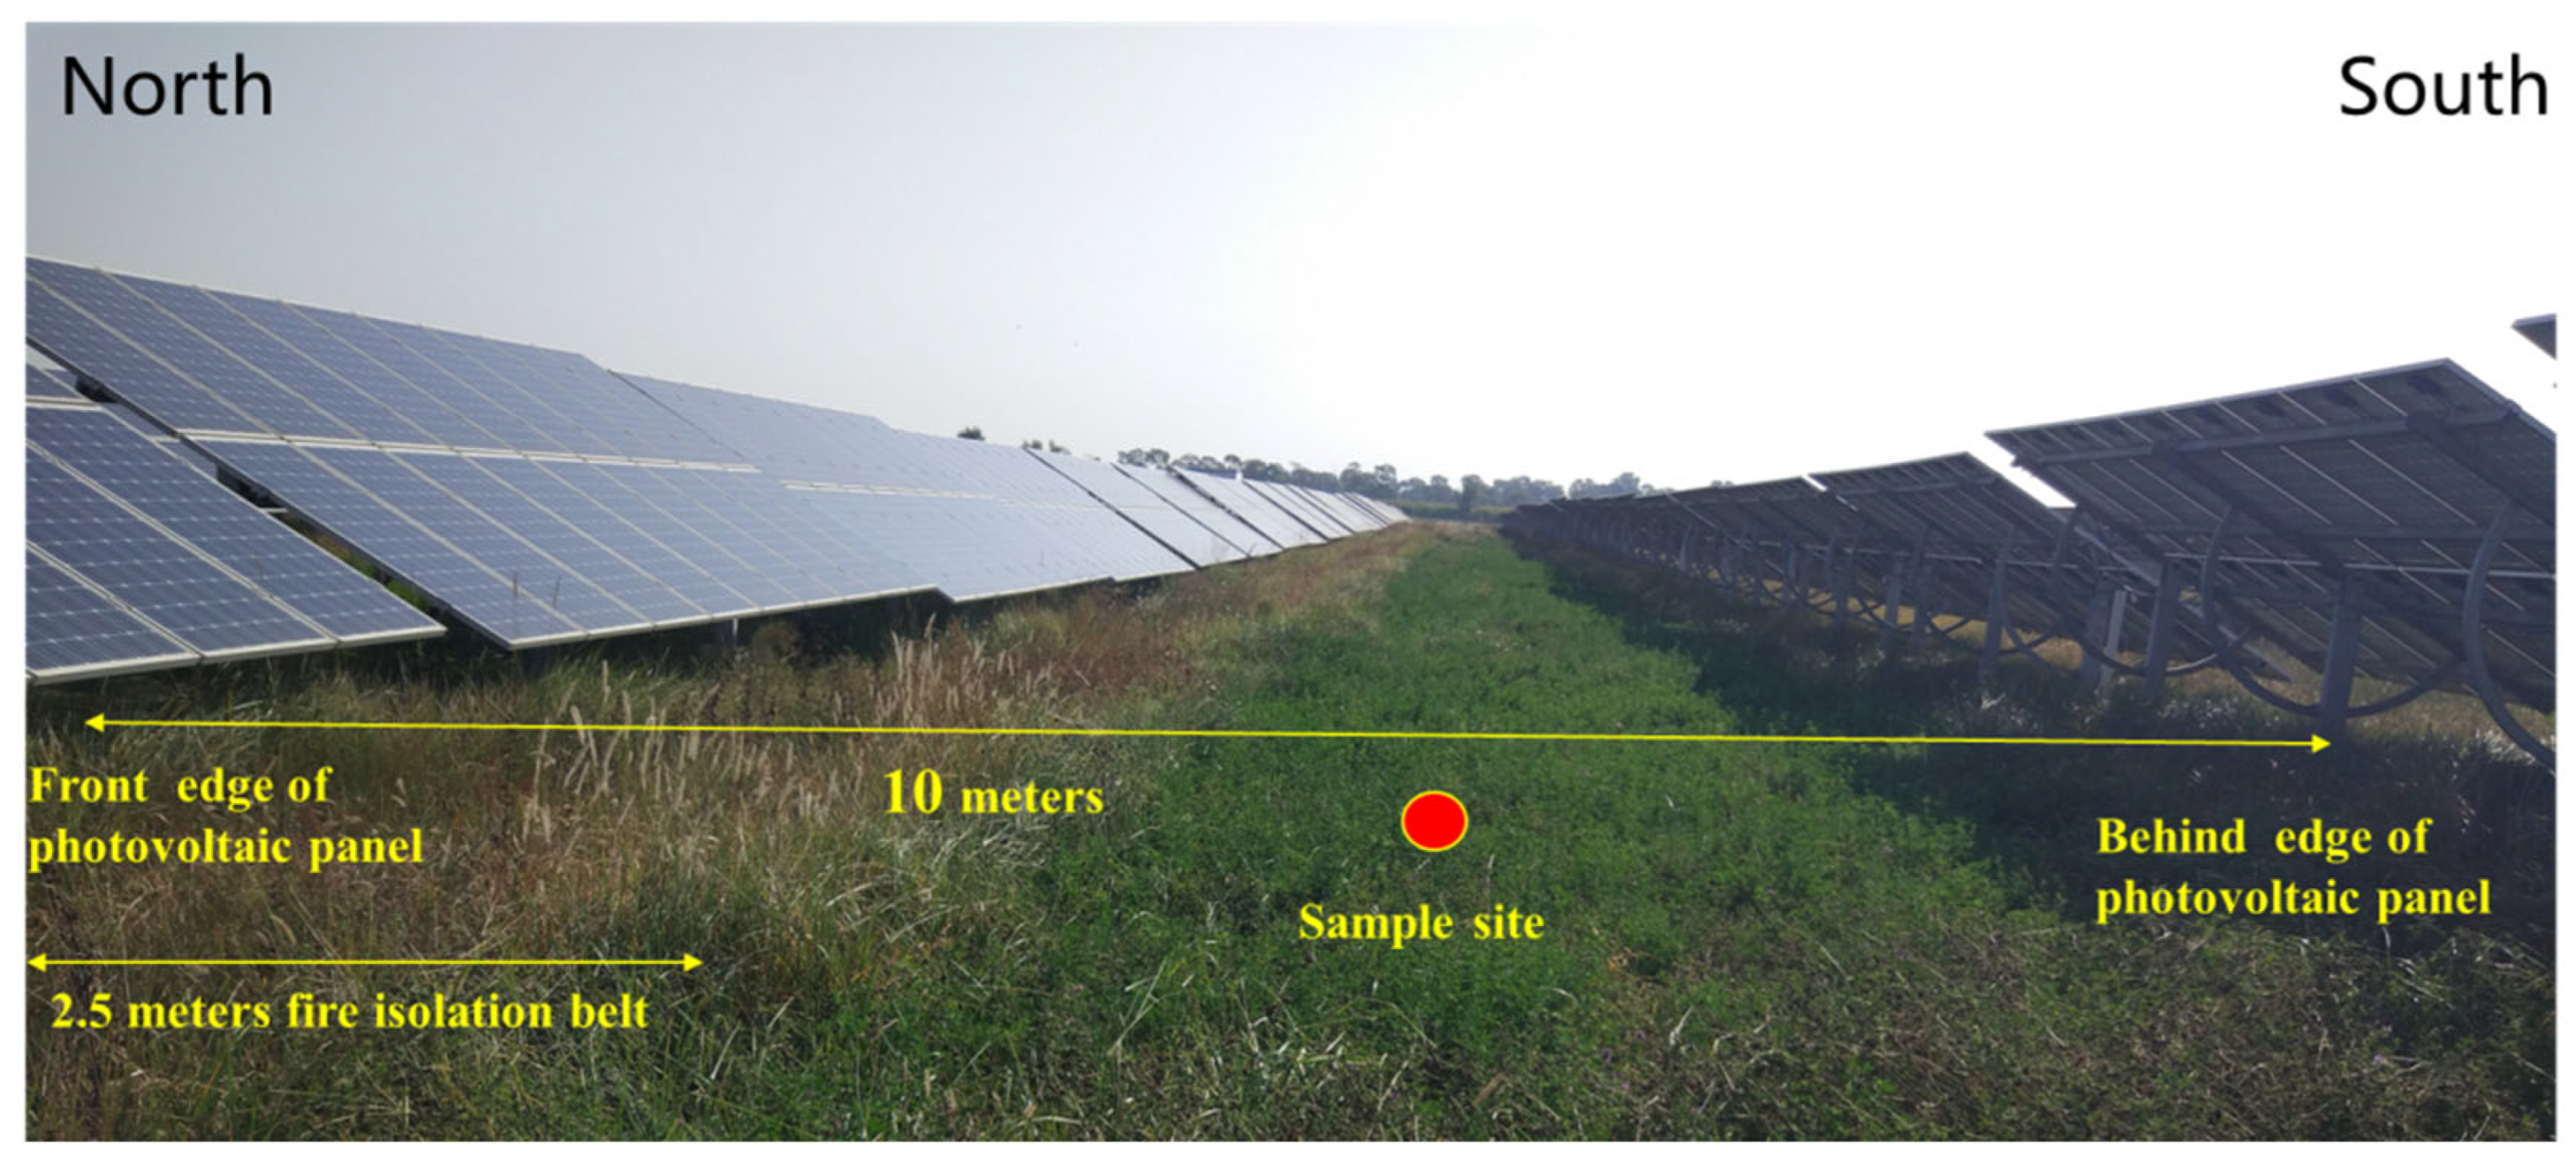
2.1. Site Description

The study was carried out at the Da You Photovoltaic Agriculture, Forestry and Animal Husbandry Demonstration Base (110°47′ E, 40°36′ N), located in the town of Shaerqin in Inner Mongolia, China (Figure 1). The climate here is dry, temperate, and semi-arid. The soil texture at the sampling site is sandy and the annual rainfall is about 399 mm, of which about 70% falls between June and September. The power station was put into operation in 2012, and successfully connected to the state grid in January 2013. The total area of the station was 118 hectares. The total length of each group of photovoltaic panels was 700 m, the specifications of the panels were 752 cm long and 318 cm wide. The angle between the photovoltaic panels and the ground was 30°.The front edge was 138 cm away from the ground and the back edge was 297 cm away from the ground. The study area was fenced and there was no grazing in the study area. In spring 2013, Pinus sylvestris var. mongolica, Astragalus membranaceus var. mongholicus, and Medicago sativa L. were planted in the electric panels. The row spacing of the photovoltaic panel array was 10 m. Vegetation in the passage of each row of panels is pruned for fire prevention every autumn, and a 2.5 m fire isolation belt was placed below the front edge of the photovoltaic panel.

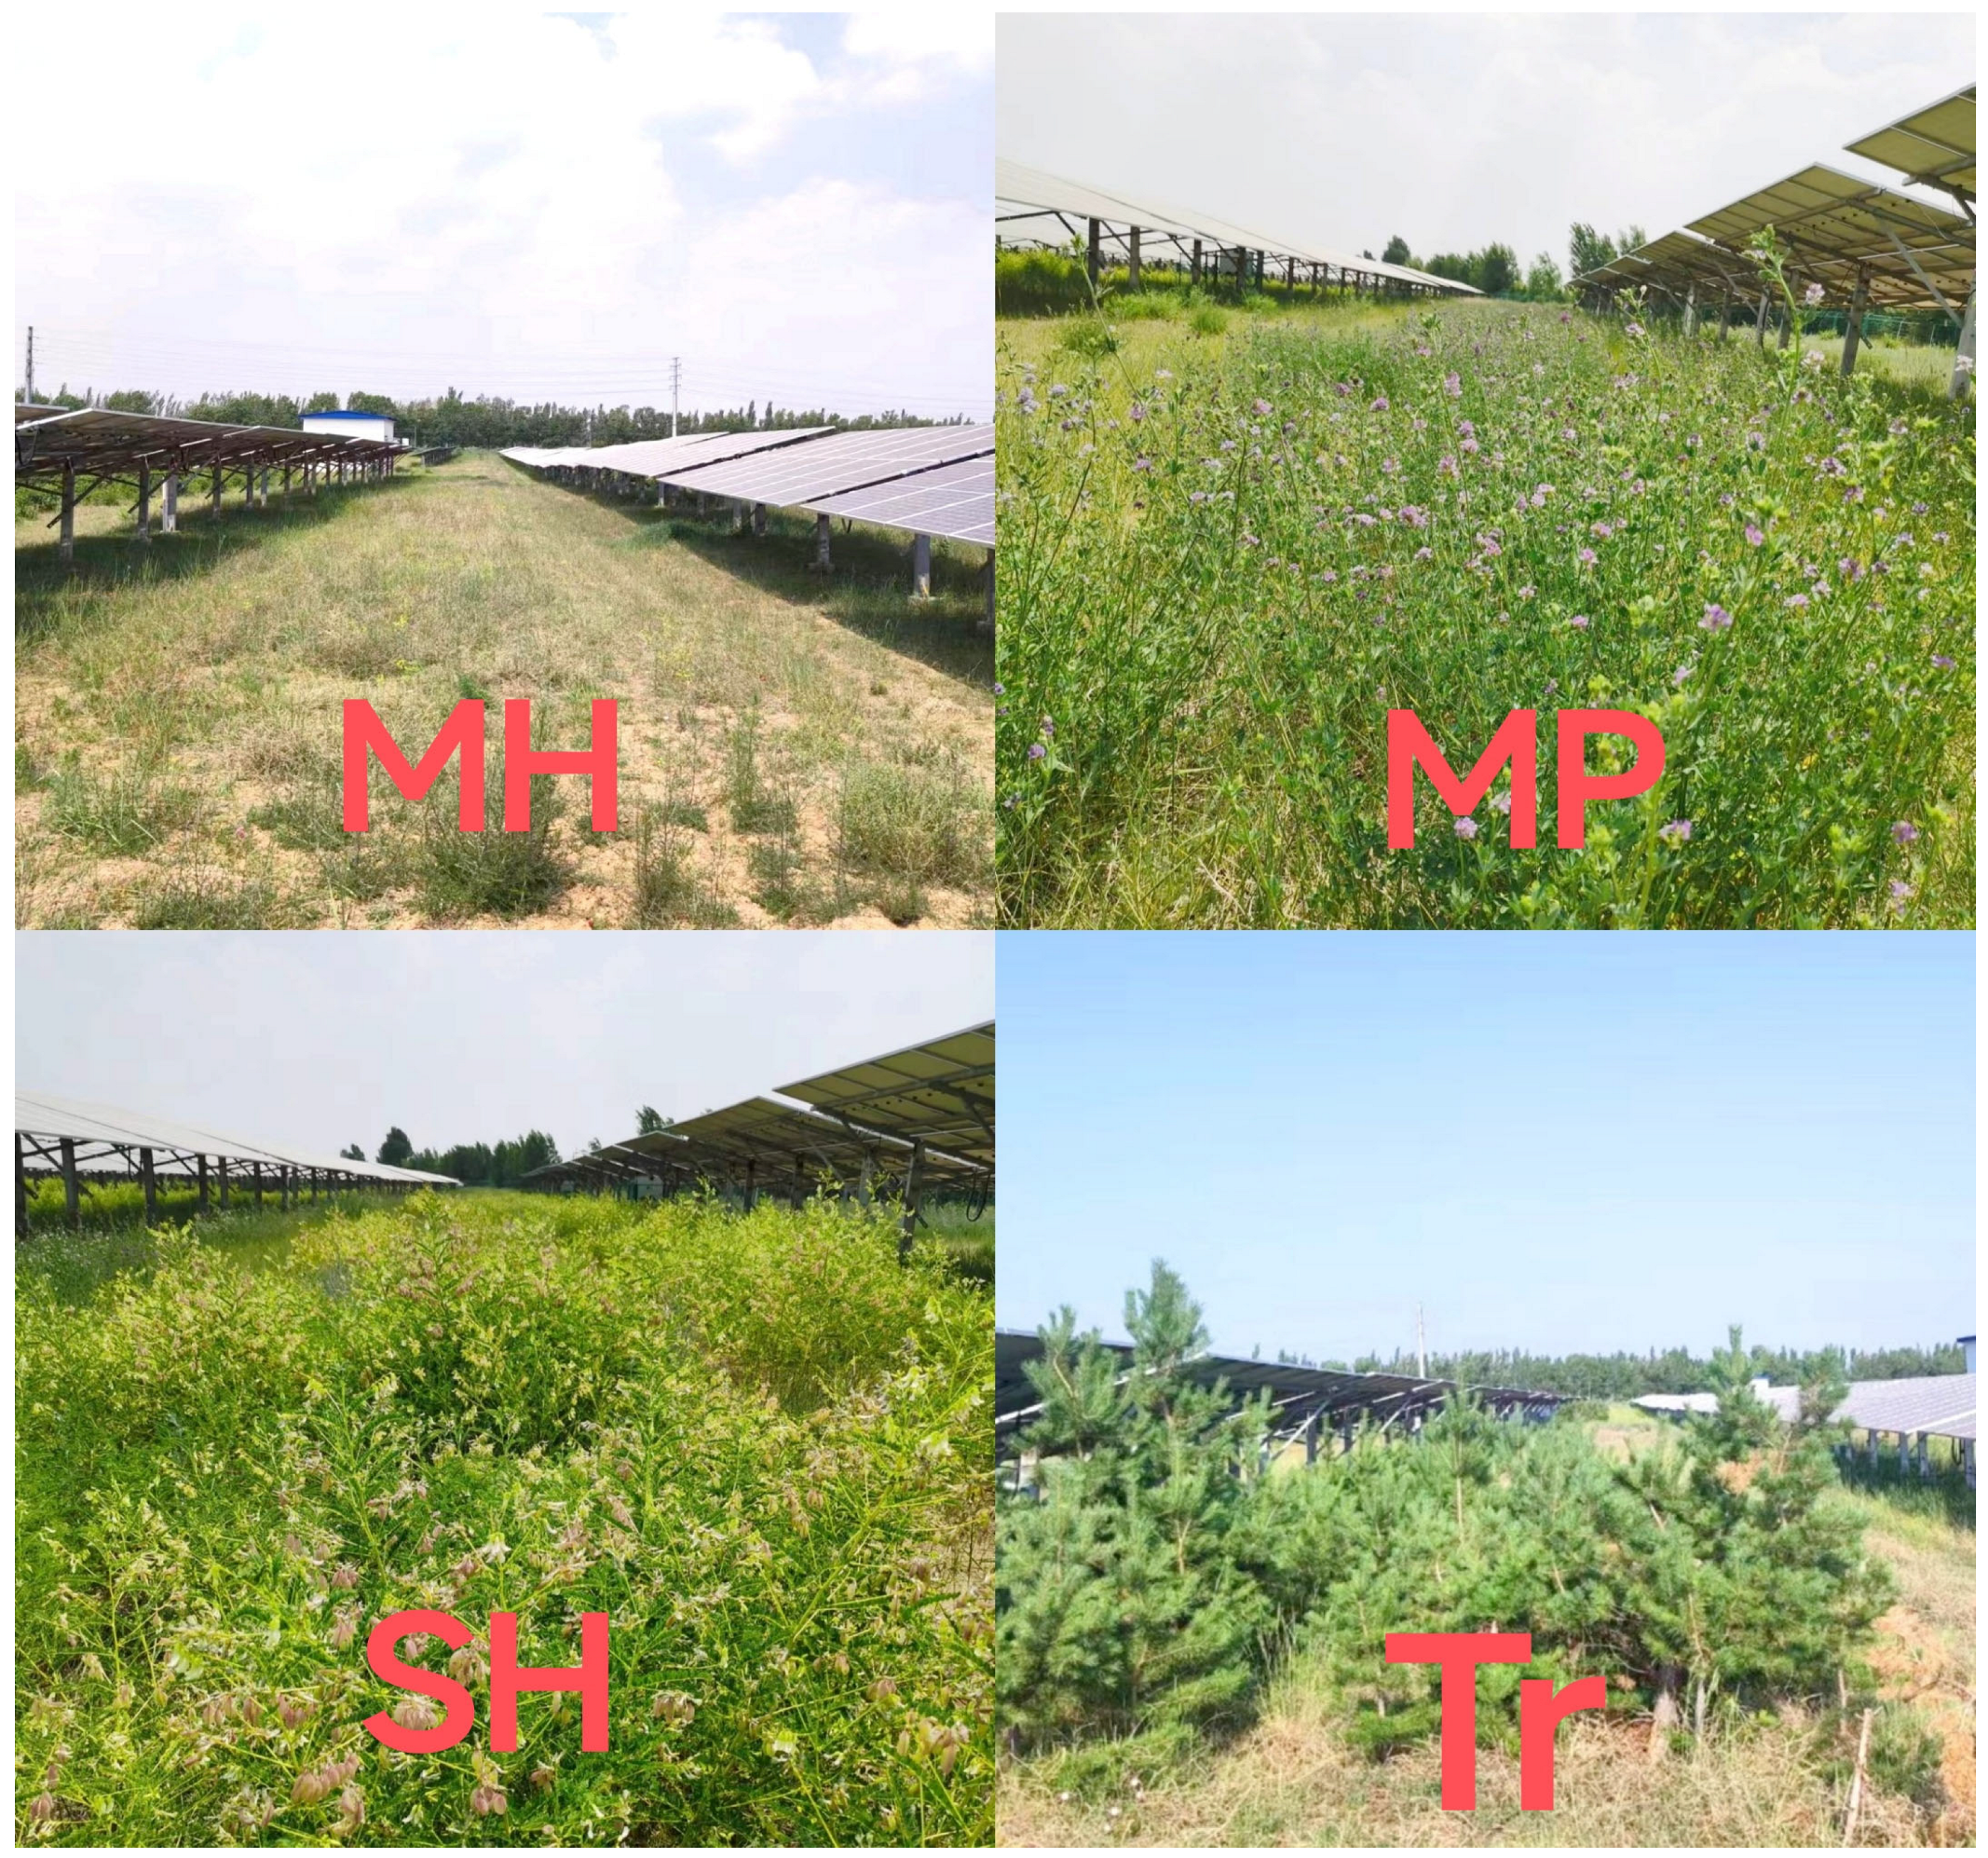
2.2. Experimental Design and Sampling Method

The study used four treatments, each representing a specific type of vegetation restoration. Each treatment was replicated three times. We established 30 × 10 m plots as true replicas at each representative site in the photovoltaic panel array. The four treatments were mixed herbs (MH) and single herbs (SH), medicinal plants (MP) and tree plots (Tr) (Table 1). The grasses in the MH plot grew naturally and were undisturbed by the construction of the power station construction; the MH plots served as control plots. The plants of the other three plots were planted. The spacing of the plots was greater than 30 m, and the terrain, vegetation, and soil were basically the same (Figure 2). During the planting of the three treatments, the plots were loosened and weeded, and no fertilizer was applied. The control plots were not loosened, weeded, or fertilized in any way. Ground samples were collected during the month of July in the year 2020. Soil samples were collected between the solar photovoltaic panels. An S-type sampling design was used to randomly sample multiple points in each plot. The soil profile was hand-excavated and bulk density rings and mixed soil samples were collected at depths of 0–20 and 20–40 cm. The soil samples at the sampling point of each plot were mixed in the same layer and subsampled for the determination of soil bulk density and chemical analyses. Each plot was triple-sampled. The samples were returned to the laboratory and, after air drying, sundries such as plant roots and gravel were removed and screened, and the gravel content > 2 mm was determined at the same time. Since almost all soil particle sizes are less than 2 mm, the gravel content in this study is not included in the carbon storage analysis.
The grammetric soil water content was determined. Soil bulk density (BD) was measured at each depth using the bulk density ring method. Soil pH was determined with Hach pH meters (Hach Company, Loveland, CO, USA) and electrical conductivity (EC) was determined with conductivity meters (Mettler-Toledo, Maryland Heights, MO, USA, [24]). The SOC was determined using the H2SO4-K2Cr2O7 method [25]. The total nitrogen (TN) in the soil was determined by the Kjeldahl method [26], and the total phosphorus (TP) in the soil was determined colorimetrically via the ammonium molybdate method [27].

2.3. Data Calculation and Statistical Analysis

In our study, SOC stocks from two soil depths of 0 to 20 and 20 to 40 cm were selected in different restoration types. The storage (t·ha) of SOC for each layer was calculated as follows [28]:
SOCS = (BD × Csoc× H)/10
where organic carbon is stored with SOCS (t·hm−2), BD is the bulk density (g·cm−3), Csoc is the content of SOC content (g·kg−1), and H is the thickness of the sampled soil layer (cm).
All statistical analyzes were performed with SPSS 22.0 (SPSS Inc., Chicago, IL, USA) and Excel. We used the least significant difference (LSD) of the one-way ANOVA to test the significance of physical and chemical properties, organic carbon storage, C:N, and C:P of different vegetation patterns (α = 0.05). The study employed a two-way ANOVA to investigate the effects of vegetation type, soil depth, and their interactions on environmental factors for the purpose of studying SOCS, C:N, and C:P (p = 0.05). The Pearson test was used for the correlation between the environmental factors and C:N and C:P.

3. Results

3.1. Physical and Chemical Properties of Soil in Various Vegetation Types

The physical and chemical properties of soil under various types of vegetation and for two soil layers are presented in Table 2. SOC decreased significantly, while the bulk density and electrical conductivity of the soil increased with increasing soil depth. PH, bulk density, water content, and EC were not statistically different between soil layers. The pH of the MH plot was significantly lower than that of the other three plants in the 0–20 cm layer, and the pH of the MP plot in the 0–20 cm layer was the highest, at 8.25. The bulk densities of this plot were much lower than those of the other three plots, especially in the 20–40 cm soil layer, and were 1.28 g·cm−3. There was no significant difference in the soil water moisture between the different vegetation types. The maximum soil EC was 4.12 s·m−1 in the 0–20 cm layer of the MH plot. Only the SOC contents were significantly different between the soil layers of the same vegetation type and between the vegetation types in the same soil layer. Furthermore, the highest value was 5.25 g·kg−1 in 0–20 cm of undisturbed natural grass plot (MH), followed by 4.50 g·kg−1 in the 0–20 cm of the Alfalfa plot (SH). Furthermore, the type of vegetation significantly influenced the bulk density, pH and SOC content (p < 0.05). The depth of the soil also significantly influenced the SOC content (p < 0.05).

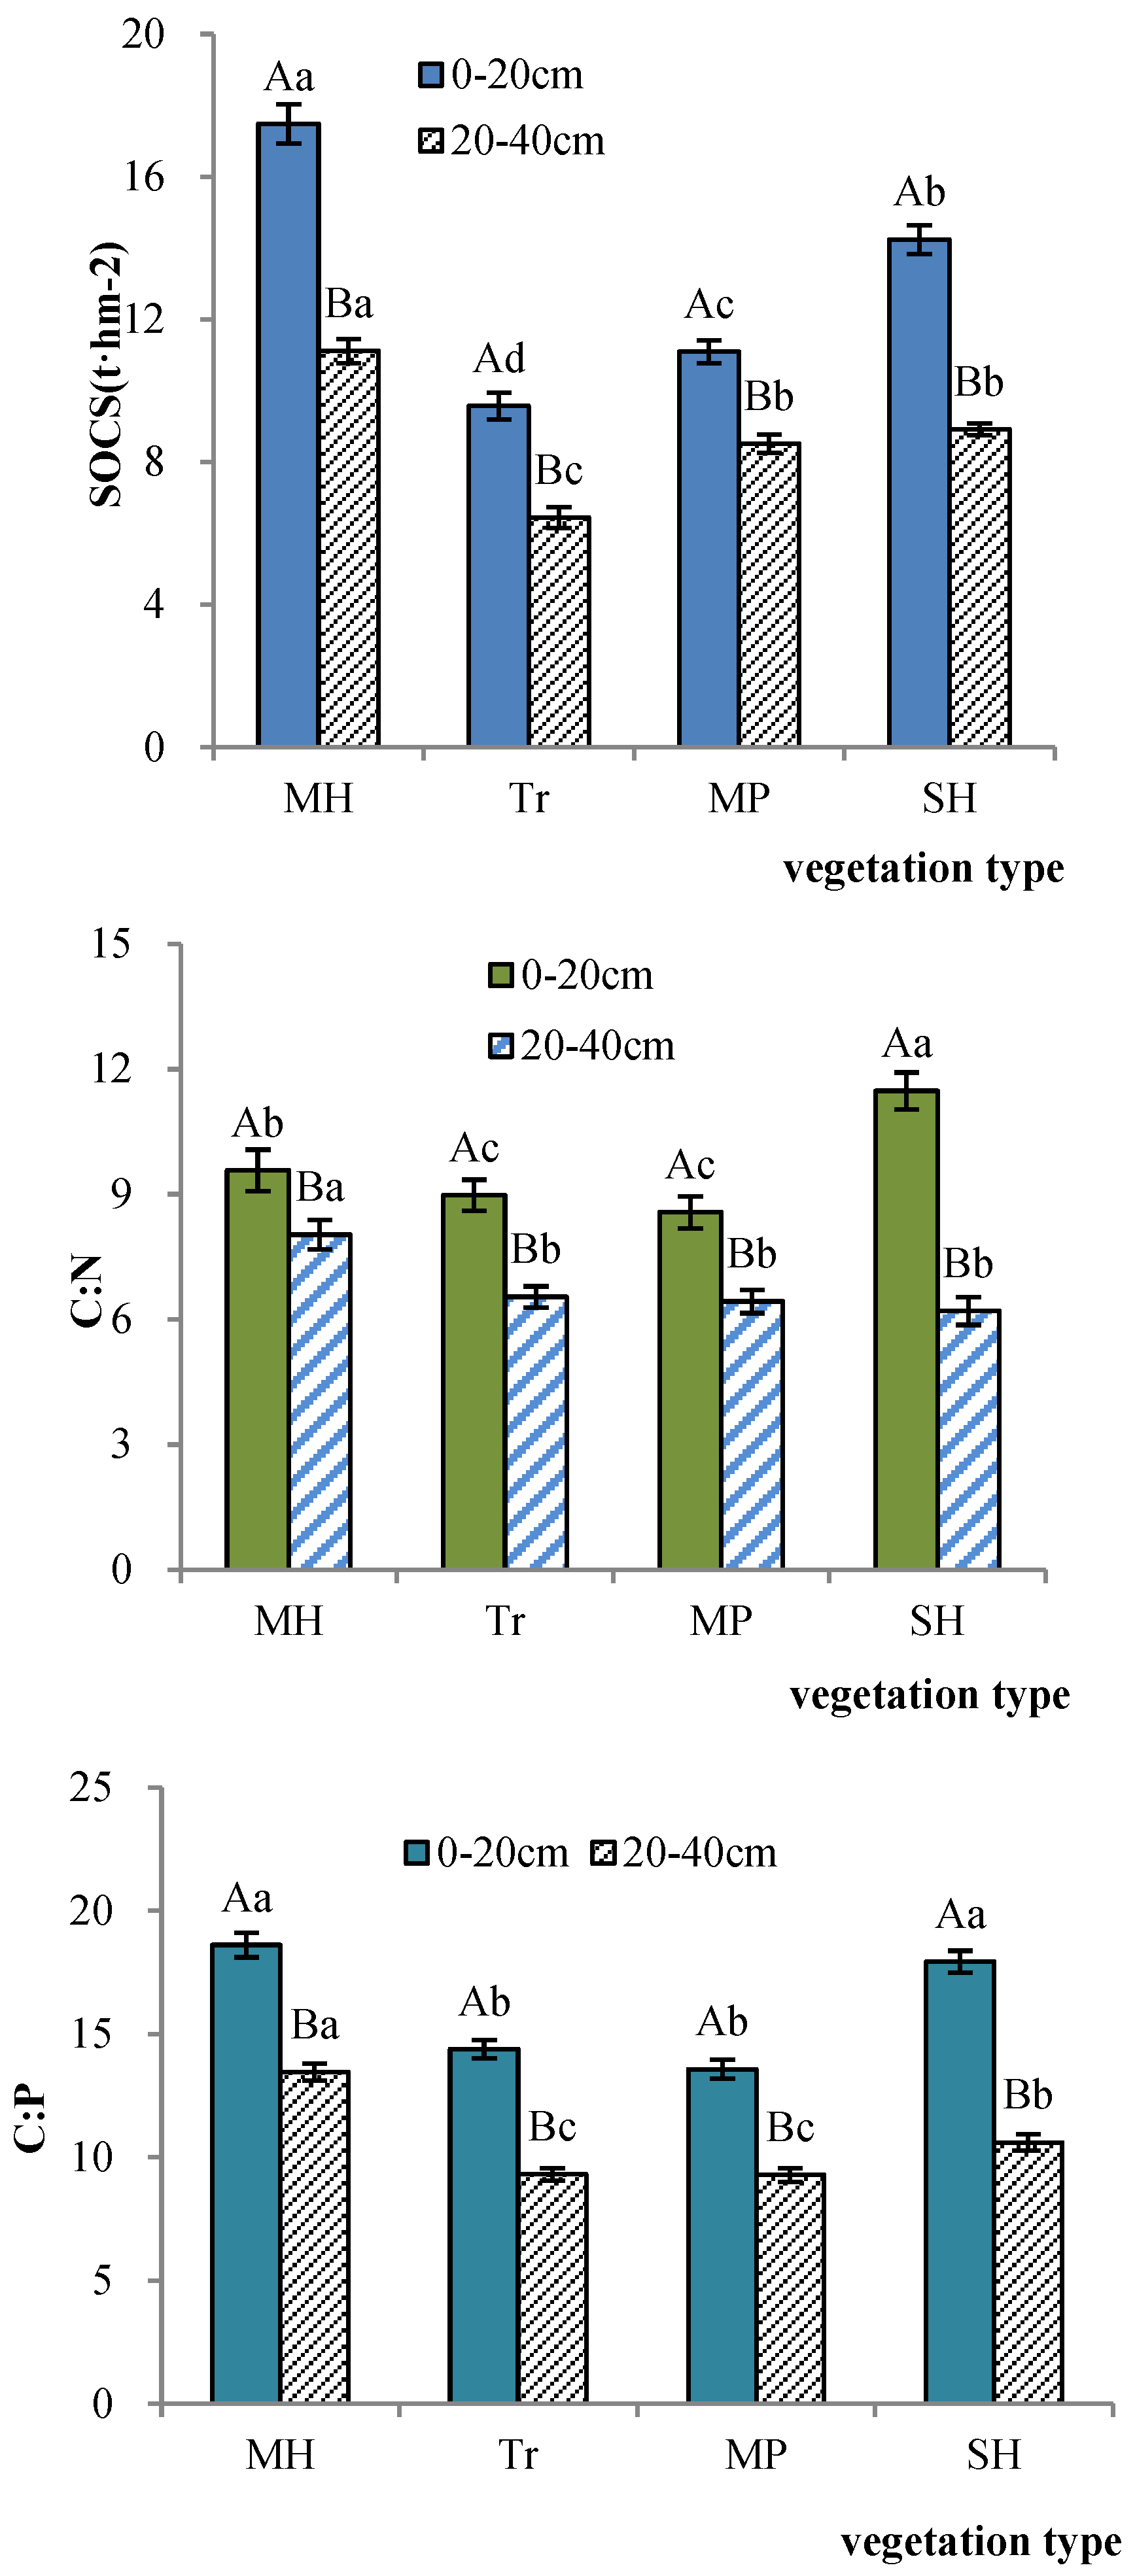
3.2. Changes in SOC Storage, C:N, and C:P under Different Types of Vegetation

Significant differences in SOCS, C:N, and C:P were found between the vegetation types at each depth of the soil (Figure 3). The SOCS of the MH plot was highest under different vegetation in the 0–20 cm stratum. Followed by the SH, MP, and Tr plots. SOCS in the 20–40 cm soil layer was consistent with that in the 0–20 cm stratum. The SOCS in the MH, Tr, MP, and SH plots was 14.30 t·hm−2, 8.01 t·hm−2, 9.80 t·hm−2, and 11.58 t·hm−2, respectively, at a depth of 0–40 cm.
The SOCS, C:N, and C:P ratios varied significantly (p < 0.05) between vegetation types in the same soil stratum and between soil strata of the same vegetation types (Figure 3). On the whole, the SOCS, C:N, and C:P decreased significantly with increasing soil depth. The C:N in the 0–20 cm stratum was significantly higher in the SH than in the other three treatments. The maximum value of SOCS and C:P appeared in the MH plot, which was significantly higher than in the other three plantations. In general, vegetation type and soil depth and their interactions significantly affected SOC, C:N, and C:P (p < 0.001) (Table 3).

3.3. The Correlation between Soil Organic Carbon Storage, C:N, C:P, and the Physical and Chemical Properties of the Soil for Different Vegetation Types

The correlation between soil organic carbon (SOC) and soil organic carbon stocks (SOCS) with C:N and C:P ratios, as well as the physical and chemical properties of the soil across various vegetation types, is summarized in Table 4. The correlation coefficient between SOCS and SOC was highly positive and statistically significant, with a p-value of less than 0.01 and a correlation coefficient of 0.961. Both C:N and C:P had a significant positive correlation with soil water content (p < 0.05), and an extremely significant positive correlation with SOC (the correlation coefficients were 0.848 and 0.971, respectively). Soil electrical conductivity, bulk density, and pH had no correlation with SOCS, C:N, and C:P.

4. Discussion

4.1. Effects of Vegetation Type on SOC and SOCS

The study showed that the SOC of the three types of artificial vegetation plots were substantially below that of the undisturbed natural grass treatment (MH). However, the SOC of the SH plot was much greater than that of the other three restoration types, evidencing that the SH complex had a higher SOC sequestration capacity than the other plant communities. (Table 2). Therefore, the variation of SOCS depends on SOC and soil bulk density. The MP plots had higher bulk densities than the Tr and SH plots. (Table 2). However, the narrow differences in the bulk density of the soil at 0–40 cm depth between the SH plot, the MH plot and the MP plot resulted in the limited effects of the bulk density of the soil on SOCS. We found that the differences between vegetation types were largely due to the differences between SOCS (Table 2). As reported by Shrestha et al. (2008) [29], the main components of the carbon cycle in plant and soil systems are: plant-generated carbon inputs and microbially decomposed carbon outputs. Alfalfa has the dual role of nitrogen fixation and carbon fixation, making it of great significance in the development of low-carbon agriculture [30]. Gentile et al. (2005) [31] and Ojeda et al. (2018) [32] demonstrated that alfalfa root biomass was closely related to soil carbon stocks. Although we did not measure root biomass, seven-year-old alfalfa plots tend to have higher root biomass. Furthermore, regular washing of the photovoltaic panels brings extra moisture to the vegetation, water input which may accelerate alfalfa root breakdown and turnover [33]. Huang et al. (2021) [34] showed that planting Pine had great potential for carbon sequestration, while our results of the Tr treatment showed the opposite. Chapela et al. (2001) [35] found that after 12 years of planting pine trees, the organic carbon of the soil in the soil layer of 0–10 cm hardly changed, while the organic carbon content of the soil in the soil layer at depths of 10–20 and 20–30 cm decreased by 30 and 44%, respectively. Consequently, it is not surprising that SOC contents and SOCS were significantly lower in the Tr plot than in the SH plot. The storage of carbon in the soil in this study was significantly positively correlated with its content (Table 4), which also indicated that the storage of soil elements was largely dependent on the content of soil elements [36].
In our study, soil depth had significant effects on the SOC and SOCS (Table 3), and the SOCS of the four vegetation types decreased with soil depth (Figure 3). These findings align with those reported by Xu et al. (2019) [37] who indicated that the SOC sequestration rates gradually decreased with soil depth. Such differences in the SOC concentrations can be attributed to the distribution of roots within the soil. The input of carbon from the plant root biomass decreased with soil depth, resulting in a decrease in SOC with soil depth. Thus, it is not unexpected that the SOC and SOCS show obvious surface aggregation (Fang et al., 2020) [30]. Furthermore, our research also demonstrated a notable impact of vegetation type on SOC and SOCS within the 0–40 cm depth (Table 2 and Table 3, Figure 3). For this reason, future studies should collect subsoil samples when analyzing the changing characteristics of organic carbon.

4.2. Responses of Soil C:N and C:P to Vegetation Type and Soil Depth

The soil C:N balance is a major indicator of nutrient C and N cycling [38]. The soil’s carbon-to-nitrogen ratio in the research site was from 6.20 to 11.48, which is lower than the average soil carbon-to-nitrogen ratio (10–12) in China [39]. Generally, the lower the C:N of the soil, the faster the mineralization rate [40,41], indicating that the sequestration of SOC, the decomposition of organic matter, and the mineralization rate of the study area would be faster than average. The C:N of the SH plot was higher than that of the Tr and MP plots in the 0–20 cm soil layer. Fang et al. (2020) [30], found that N accumulation through symbiotic fixation has been demonstrated in alfalfa, indicating a greater soil C and N sequestration potential in the SH plot. Altogether, the C:P ratio of the soil is an indicator of the P mineralizing capacity of the soil [38]. In this study, the average value of soil C:P was 13.40, significantly lower than the national average (52.70) [38]. The results indicate that the concentration of phosphorous in the study site is fairly high. The C:P of the SH plot was higher than that of the Tr and MP plots in the 0–40 cm soil layer.
The high C:P content leads to a restriction of P in the microbial decomposition of organic materials. Plant growth can be negatively affected by microorganisms competing with plants for inorganic phosphorus in the soil [42]. The P absorbed by plants gradually increases, which causes the P in the soil to become limiting. Therefore, P would be a limiting factor in the late stage of plant growth. The C:P ratio of the SH plot, the Tr, and the MP plots in the soil layer at 0–40 cm was lower than the MH plot. This relationship could be attributed to the lower soil organic carbon (SOC) in restored soils compared to undisturbed natural soils. Therefore, the content of SOC and the type of vegetation also significantly affect the C:P of the soil (Table 3 and Table 4). Our study also found that C:N and C:P and soil water content were significantly positively related (Table 4), because water is one of the important limiting factors of drought when vegetation grows.
Numerous studies indicate a decrease in soil C:N and C:P with increasing soil depth [38,40]. Our results are similar to theirs (Figure 3). Because of environmental factors, soil microorganisms, and surface litter input can easily affect nutrient content in the shallow soil layer, nutrients tend to concentrate in the surface layer [43] It is possible that the surface organic carbon and soil total nitrogen content were higher. However, the variability range of the organic carbon content was greater than that of the total nitrogen content as the soil depth increased. This results in a relatively lower C:N ratio in the 20–40 cm soil layer. The low C:P ratio in the 20–40 cm soil layer may be due to the relatively stable P content at different soil depths and the C:P ratio was mainly affected by the SOC content [24].

5. Conclusions

We analyzed the restoration of soil nutrients at a photovoltaic power station by comparing the changes of SOCS, C:N, and C:P for three vegetation types and a control. After seven years of vegetation restoration, soil organic carbon and soil organic carbon storage in the SH plot was the highest among the three types of vegetation restoration, but it is still far lower than the control (MH plot) of the original soil. It is believed that with the extension of vegetation recovery time, planting alfalfa can accelerate the improvement of soil carbon content.
With increasing soil depth, soil organic carbon content and storage decreased markedly. The organic carbon mass fraction of the soil was strongly influenced by the vegetation type, soil depth, and their interaction. Additionally, the study area was restricted by phosphorus, and increasing phosphorus levels can prevent phosphate restrictions during the later growing season.

Author Contributions

Conceptualization and methodology, M.L. and W.Z.; software, J.Z.; validation and formal analysis, W.Z.; investigation and resources, W.L. and H.D.; data curation, W.Z. and J.Z.; writing—original draft preparation, J.Z.; writing—review and editing, W.Z.; visualization, supervision, project administration, and funding acquisition, Y.G. All authors have read and agreed to the published version of the manuscript.

Funding

This study was supported by the Inner Mongolia Natural Science Foundation (2022MS04013), the National Natural Science Foundation of China (41301605), and the 2024 Inner Mongolia Autonomous Region Graduate Student Research and Innovation Program.

Data Availability Statement

No new data were created or analyzed in this study. Data sharing is not applicable to this article.

Conflicts of Interest

The authors declare no conflict of interest.

References

  1. Breyer, C.; Bogdanov, D.; Gulagi, A.; Aghahosseini, A.; Barbosa, L.S.N.S.; Koskinen, O.; Barasa, M.; Caldera, U.; Afanasyeva, S.; Child, M.; et al. On the role of solar photovoltaics in global energy transition scenarios. Prog. Photovolt. Res. Appl. 2017, 25, 727–745. [Google Scholar] [CrossRef]
  2. De Marco, A.; Petrosillo, I.; Semeraro, T.; Pasimeni, M.R.; Aretano, R.; Zurlini, G. The contribution of Utility-Scale Solar Energy to the global climate regulation and its effects on local ecosystem services. Glob. Ecol. Conserv. 2014, 2, 324–337. [Google Scholar] [CrossRef]
  3. Ellabban, O.; Abu-Rub, H.; Blaabjerg, F. Renewable energy resources: Current status, future prospects and their enabling technology. Renew. Sustain. Energy Rev. 2014, 39, 748–764. [Google Scholar] [CrossRef]
  4. Hernandez, R.R.; Armstrong, A.; Burney, J.; Ryan, G.; Moore-O’leary, K.; Diédhiou, I.; Grodsky, S.M.; Saul-Gershenz, L.; Davis, R.; Macknick, J.; et al. Techno–ecological synergies of solar energy for global sustainability. Nat. Sustain. 2019, 2, 560–568. [Google Scholar] [CrossRef]
  5. Wilberforce, T.; Baroutaji, A.; El Hassan, Z.; Thompson, J.; Soudan, B.; Olabi, A.G. Prospects and challenges of concentrated solar photovoltaics and enhanced geother-mal energy technologies. Sci. Total Environ. 2019, 659, 851–861. [Google Scholar] [CrossRef] [PubMed]
  6. Hernandez, R.; Easter, S.; Murphy-Mariscal, M.; Maestre, F.; Tavassoli, M.; Allen, E.; Barrows, C.; Belnap, J.; Ochoa-Hueso, R.; Ravi, S.; et al. Environmental impacts of utility-scale solar energy. Renew. Sustain. Energy Rev. 2014, 29, 766–779. [Google Scholar] [CrossRef]
  7. Albaladejo, J.; Martinez-Mena, M.; Roldan, A.; Castillo, V. Soil degradation and desertification induced by vegetation removal in a semiarid environment. Soil Use Manag. 1998, 14, 1–5. [Google Scholar] [CrossRef]
  8. Phillips, J. Determining the sustainability of large-scale photovoltaic solar power plants. Renew. Sustain. Energy Rev. 2013, 27, 435–444. [Google Scholar] [CrossRef]
  9. Armstrong, A.; Ostle, N.J.; Whitaker, J. Solar park microclimate and vegetation management effects on grassland carbon cycling. Environ. Res. Lett. 2016, 11, 074016. [Google Scholar] [CrossRef]
  10. Ravi, S.; Macknick, J.; Lobell, D.; Field, C.; Ganesan, K.; Jain, R.; Elchinger, M.; Stoltenberg, B. Colocation opportunities for large solar infrastructures and agriculture in drylands. Appl. Energy 2016, 165, 383–392. [Google Scholar] [CrossRef]
  11. Hoffacker, M.K.; Allen, M.F.; Hernandez, R.R. Land-sparing opportunities for solar energy development in agricultural landscapes: A case study of the great central valley. CA, United States. Environ. Sci. Technol. 2017, 51, 14472–14482. [Google Scholar] [CrossRef] [PubMed]
  12. Walston, L.J.; Mishra, S.K.; Hartmann, H.M.; Hlohowskyj, I.; McCall, J.; Macknick, J. Examining the potential for agricultural benefits from pollinator habitat at solar facilities in the United States. Environ. Sci. Technol. 2018, 52, 7566–7576. [Google Scholar] [CrossRef] [PubMed]
  13. Goetzberger, A.; Zastrow, A. On the coexistence of solar-energy conversion and plant cultivation. Int. J. Sol. Energy 1982, 1, 55–69. [Google Scholar] [CrossRef]
  14. Marrou, H.; Guilioni, L.; Dufour, L.; Dupraz, C.; Wery, J. Microclimate under agrivoltaic systems: Is crop growth rate affected in the partial shade of solar panels? Agric. For. Meteorol. 2013, 177, 117–132. [Google Scholar] [CrossRef]
  15. Beatty, B.; Macknick, J.; McCall, J.; Braus, G.; Buckner, D. Native Vegetation Performance Under a Solar PV Array at the National Wind Technology Center; U.S. Department of Energy: Washington, DC, USA, 2017.
  16. Xu, K.; Zhang, H. Environmental impacts of large-scale solar plants on desert region: Modeling ground temperature. Int. J. Smart Grid Clean Energy 2014, 3, 390–394. [Google Scholar] [CrossRef]
  17. Han, L.; Wang, P.; Yang, H.; Liu, S.; Wang, J. Study on NDVI-Ts space by combining LAI and evapotranspiration. Sci. China 2006, 49, 747–754. [Google Scholar] [CrossRef]
  18. Liu, Y.; Zhang, R.; Huang, Z.; Cheng, Z.; López-Vicente, M.; Ma, X.; Wu, G. Solar photovoltaic panels significantly promote vegetation recovery by modifying the soil surface microhabitats in an arid sandy ecosystem. Land Degrad. Dev. 2019, 30, 2177–2186. [Google Scholar] [CrossRef]
  19. Morris, V.L. Cleaning agents and techniques for concentrating solar collectors. Sol. Energy Mater. 1980, 3, 35–55. [Google Scholar] [CrossRef]
  20. Pringle, A.M.; Handler, R.M.; Pearce, J.M. Aquavoltaics: Syner-gies for dual use of water area for solar photovoltaic electricity generation and aquaculture. Renew. Sust. Energ. Rev. 2017, 80, 572–584. [Google Scholar] [CrossRef]
  21. Choi, C.S.; Cagle, A.E.; Macknick, J.; Bloom, D.E.; Caplan, J.S.; Ravi, S. Effects of Revegetation on Soil Physical and Chemical Properties in Solar Photovoltaic Infrastructure. Front. Environ. Sci. 2020, 8, 140. [Google Scholar] [CrossRef]
  22. Okolo, C.C.; Gebresamuel, G.; Zenebe, A.; Haile, M.; Eze, P.N. Accumulation of organic carbon in various soil aggregate sizes under different land use systems in a semi-arid environment. Agric. Ecosyst. Environ. 2020, 297, 106924. [Google Scholar] [CrossRef]
  23. Yu, P.; Liu, S.; Ding, Z.; Zhang, A.; Tang, X. Changes in Storage and the Stratification Ratio of Soil Organic Carbon under Different Vegetation Types in Northeastern China. Agronomy 2020, 10, 290. [Google Scholar] [CrossRef]
  24. Yan, Z.; Ding, W.; Xie, G.; Yan, M.; Han, Y.; Xiong, X. Quantitative relationship between soil pH and electrical conductivity values and cadmium phytoavailability for Chinese cabbage under simulated conditions. Ecotoxicol. Environ. Saf. 2023, 266, 115566. [Google Scholar] [CrossRef] [PubMed]
  25. Nelson, D.W.; Sommers, L.E. Total carbon, organic carbon and organic matter. Methods Soil Anal. Part 3 Chem. Methods 1996, 5, 96–1010. [Google Scholar]
  26. Bremner, J.; Mulvaney, C. Nitrogen—Total. Methods Soil Anal. Part 3 Chem. Methods 1996, 72, 532–535. [Google Scholar]
  27. Schimel, J.P.; Weintraub, M.N. The implications of exoenzyme activity on microbial carbon and nitrogen limitation in soil: A theoretical model. Soil Biol. Biochem. 2003, 35, 549–563. [Google Scholar] [CrossRef]
  28. Guo, L.B.; Gifford, R.M. Soil carbon stocks and land use change: A meta analysis. Glob. Chang. Biol. 2002, 8, 345–360. [Google Scholar] [CrossRef]
  29. Shrestha, B.M.; Singh, B.R. Soil and vegetation carbon pools in a mountainous watershed of Nepal. Nutr. Cycl. Agroecosyst. 2008, 81, 179–191. [Google Scholar] [CrossRef]
  30. Fang, Y.; Huang, Z.; Cui, Z.; He, H.; Liu, Y. Trade-offs between forage crop productivity and soil nutrients for different ages of alfalfa grassland. Land Degrad. Dev. 2020, 32, 374–386. [Google Scholar] [CrossRef]
  31. Gentile, R.; Martino, D.; Entz, M. Influence of perennial forages on subsoil organic carbon in a long-term rotation study in Uruguay. Agric. Ecosyst. Environ. 2005, 105, 419–423. [Google Scholar] [CrossRef]
  32. Ojeda, J.J.; Caviglia, O.P.; Agnusdei, M.G. Vertical distribution of root biomass and soil carbon stocks in forage cropping systems. Plant Soil 2018, 423, 175–191. [Google Scholar] [CrossRef]
  33. Craine, J.M.; Gelderman, T.M. Soil moisture controls on temperature sensitivity of soil organic carbon decomposition for a mesic grassland. Soil Biol. Biochem. 2011, 43, 455–457. [Google Scholar] [CrossRef]
  34. Huang, Z.; Cui, Z.; Liu, Y.; Wu, G. Carbon accumulation by Pinus sylvestris forest plantations after different periods of afforestation in a semiarid sandy ecosystem. Land Degrad. Dev. 2021, 32, 2094–2104. [Google Scholar] [CrossRef]
  35. Chapela, I.H.; Osher, L.J.; Horton, T.R.; Henn, M.R. Ectomycorrhizal fungi introduced with exotic pine plantations induce soil carbon depletion. Soil Biol. Biochem. 2001, 33, 1733–1740. [Google Scholar] [CrossRef]
  36. Zhao, F.; Kang, D.; Han, X.; Yang, G.; Yang, G.; Feng, Y.; Ren, G. Soil stoichiometry and carbon storage in long-term afforestation soil affected by understory vegetation diversity. Ecol. Eng. 2015, 74, 415–422. [Google Scholar] [CrossRef]
  37. Xu, H.; Qu, Q.; Li, P.; Guo, Z.; Wulan, E.; Xue, S. Stocks and Stoichiometry of Soil Organic Carbon, Total Nitrogen, and Total Phosphorus after Vegetation Restoration in the Loess Hilly Region, China. Forests 2019, 10, 27. [Google Scholar] [CrossRef]
  38. Tian, H.; Chen, G.; Zhang, C.; Melillo, J.M.; Hall, C.A.S. Pattern and variation of C:N:P ratios in China&rsquo;s soils: A synthesis of observational data. Biogeochemistry 2010, 98, 139–151. [Google Scholar] [CrossRef]
  39. Tessier, J.T.; Rayal, D.J. Use of nitrogen to phosphorus ratios in plant tissue as an indicator of nutrient limitation and nitrogen saturation. J. Appl. Ecol. 2003, 40, 523–534. [Google Scholar] [CrossRef]
  40. Cleveland, C.C.; Liptzin, D. C:N:P stoichiometry in soil: Is there a “Redfield ratio” for the microbial biomass? Biogeochemistry 2007, 85, 235–252. [Google Scholar] [CrossRef]
  41. Wang, S.; Yu, G. Ecological stoichiometry characteristics of ecosystem carbon, nitrogen and phosphorus elements. Sheng Tai Xue Bao 2008, 28, 3937–3947. [Google Scholar]
  42. Wang, W.; Sardans, J.; Zeng, C.; Zhong, C.; Li, Y.; Peñuelas, J. Responses of soil nutrient concentrations and stoichiometry to different human land uses in a subtropical tidal wetland. Geoderma 2014, 232–234, 459–470. [Google Scholar] [CrossRef] [PubMed]
  43. Barreto, P.A.B.; Gama-Rodrigues, E.F.; Gama-Rodrigues, A.C.; Fontes, A.G.; Polidoro, J.C.; Moço, M.K.S.; Machado, R.C.R.; Baligar, V.C. Distribution of oxidizable organic C fractions in soils under cacao agroforestry systems in Southern Bahia, Brazil. Agrofor. Syst. 2011, 81, 213–220. [Google Scholar] [CrossRef]
Figure 1. Location of the study site.
Agronomy 14 00009 g001
Figure 2. Four treatments.
Agronomy 14 00009 g002
Figure 3. Soil carbon stock and C:N and C:P of the four vegetation types. Note: MH, mixed herb plot (undisturbed natural vegetation plot); Tr, tree plot (pines were planted); MP, medicinal plant plot; SH, single herb plot (alfalfa was planted). Different capital letters indicate significant differences between the different depths of the same vegetation (p < 0.05), lowercase letters indicate significant differences between the different vegetation types at the same depth (p < 0.05). The four treatments were mixed herbs (MH), single herbs (SH), medicinal plants (MP), and trees (Tr).
Agronomy 14 00009 g003
Table 1. The experimental design.
Treatment CodeTreatmentTimes RepeatedPlant SpeciesSampled Soil LayerSampled Location
MH (CK)Mixed herbs plot3Undisturbed natural grassTwo layers (0–20 and 20–40 cm)Vegetation growing area
SHSingle herb plot3Alfalfa (Medicago sativa L.) was artificially planted
MPMedicinal plant plot3Astragalus membranaceus var. mongholicus was artificially planted
TrTree plot3Pinus sylvestris var. mongolica was artificially planted
Note: The four treatments were mixed herbs (MH), single herbs (SH), medicinal plants (MP), and tree plots (Tr).
Table 2. Physical and chemical properties of soil of the four vegetation types.
Vegetation TypeSoil Depth (cm)SOC
(g·kg−1)
pHSoil Bulk Density (g·cm−3)Soil Water Content (%)Electrical Conductivity (s·m−1)
MH0–205.25 ± 0.11 Aa8.02 ± 0.06 Ab1.66 ± 0.03 Aa0.09 ± 0.00 Aa4.12 ± 0.73 Aa
20–403.25 ± 0.07 Ba8.06 ± 0.02 Ab1.71 ± 0.03 Aa0.05 ± 0.01 Aa3.85 ± 0.63 Aa
Tr0–203.45 ± 0.07 Ac8.20 ± 0.08 Aa1.39 ± 0.03 Ab0.10 ± 0.01 Aa3.41 ± 0.63 Ab
20–402.51 ± 0.04 Bc8.15 ± 0.06 Aab1.28 ± 0.04 Ab0.06 ± 0.01 Aa3.68 ± 0.28 Aa
MP0–203.51 ± 0.06 Ac8.25 ± 0.05 Aa1.58 ± 0.06 Aa0.09 ± 0.01 Aa3.35 ± 0.55 Ab
20–402.45 ± 0.05 Bc8.21 ± 0.03 Aa1.74 ± 0.08 Aa0.04 ± 0.01 Aa3.52 ± 0.42 Aa
SH0–204.50 ± 0.09 Ab8.15 ± 0.01 Aa1.58 ± 0.03 Aa0.10 ± 0.01 Aa3.56 ± 0.60 Ab
20–402.66 ± 0.04 Bb8.12 ± 0.05 Aab1.68 ± 0.05 Aa0.06 ± 0.01 Aa3.64 ± 0.56 Aa
Note: Results are shown as mean ± standard errors. MH, mixed herb plot (undisturbed natural vegetation plot); Tr, tree plot (pines were planted); MP, medicinal plant plot, SH, single herb plot (alfalfa was planted). The different capital letters indicate significant differences between different depths of the same vegetation type (p < 0.05), lowercase letters indicate significant differences between the different vegetation types at the same depth (p < 0.05). The four treatments were mixed herbs (MH), single herbs (SH), medicinal plants (MP), and trees (Tr).
Table 3. Two-way ANOVA on the effects of vegetation type and soil depth on soil physicochemical properties, C stocks, and C:N and C:P stoichiometry.
FactorSoil Water ContentElectrical ConductivitySoil Bulk DensitypHSOCSOCSC:NC:P
X2.9910.72222.389 ***10.848 ***313.748 ***230.888 ***28.208 ***134.445 ***
Y62.270 ***0.053.1440.6871820.584 ***606.625 ***472.324 ***861.551 ***
X × Y0.2880.1724.636 *0.63361.281 ***25.714 ***40.223 ***12.364 ***
Note: X, vegetation type; Y, soil depth; X × Y, interactions between vegetation types and soil; * p < 0.05; *** p < 0.001.
Table 4. Correlation between the different soil physicochemical properties and SOCS and C:N and C:P in the study area.
ItemsSoil Water
Content
Electrical
Conductivity
Soil Bulk
Density
pHSOC
SOCS0.3790.1490.402−0.2810.961 **
C:N0.620 *−0.035−0.0370.1260.848 **
C:P0.534 *0.0440.117−0.0860.917 **
Note: * p < 0.05; ** p < 0.01.
Disclaimer/Publisher’s Note: The statements, opinions and data contained in all publications are solely those of the individual author(s) and contributor(s) and not of MDPI and/or the editor(s). MDPI and/or the editor(s) disclaim responsibility for any injury to people or property resulting from any ideas, methods, instructions or products referred to in the content.

