Article

Stem Hydraulic Conductance, Leaf Photosynthesis, and Carbon Metabolism Responses of Cotton to Short-Term Drought and Rewatering

Key Laboratory of Agricultural Soil and Water Engineering in Arid and Semiarid Areas of Ministry of Education, Northwest A & F University, Yangling 712100, China
*
Author to whom correspondence should be addressed.
Agronomy 2024, 14(1), 71; https://doi.org/10.3390/agronomy14010071
Submission received: 11 November 2023 / Revised: 18 December 2023 / Accepted: 19 December 2023 / Published: 27 December 2023
(This article belongs to the Topic Tolerance to Drought and Salt Stress in Plants)

Abstract

:
Water stress can trigger acclimation responses and damage plants. The aim of this study was to evaluate the integrative responses of cotton hydraulic conductance, leaf photosynthesis, and carbon metabolism to short-term drought and subsequent rewatering. A water-controlled pot experiment was conducted in 2020, with soil water drying continuing for one day (D1), two days (D2), and three days (D3) after it reached 40% ± 5% of the soil water holding capacity at the blooming stage of cotton, and the soil was then rewatered to the soil water holding capacity. We investigated how the stem hydraulic conductance, gas exchange, and biochemical traits of cotton were affected by imposed drought stress and subsequent rewatering. The hydraulic characteristics of cotton in the D2 and D3 treatments evolved with damage, complete closure of stomatal conductance, and complete deterioration of photosynthesis, in addition to severe floating changes in the carbon metabolism affected by drought. The leaves’ functional characteristics after rewatering cannot be completely recovered to full-irrigation levels, and the recovery extent was strongly linked to the duration. Consequently, it is considered desirable to maintain normal physiological activity during the cotton reproductive period, and the drought episode can be sustained for 1 day in a long-term perspective when the soil water content is depleted to 40% ± 5% of the soil water holding capacity. These results can provide in-depth ideas for better understanding the hydraulic and physiological responses of cotton to drought episodes and rewatering, and they can help drought-affected cotton to cope with future climate change.

1. Introduction

Climate change induces anomalous fluctuations in the total precipitation and frequency of periodic droughts [1]. As previously reported, drought stress impacts 40% of the world’s population, and it is not uncommon to see 50% yield reductions due to drought stress [2,3]. As previous studies have shown, limited water supply adversely influences plant physiology, metabolism, and, ultimately, yield, with the extent of damage depending on the severity, duration, and occurrence stage of the stress [4]. Therefore, it is crucial to clarify the relations between irrigation scheduling and crop water stress and recovery, thereby developing accurate irrigation scheduling that promotes water conservation without sacrificing crop yields.
Ensuring a high cotton yield, which is the main raw material of China’s textile industry, is an important goal in the current cotton industry [5]. Regarding the individual effects of drought stress on cotton physiology, biochemistry, and yield, a large amount of information exists [6]. Specifically, a range of responses of hydraulic characteristics and physiology follow under the conditions of water stress [7].
Leaf water potential is a physiological index to evaluate the severity of water stress in plants [7]. According to the theory of “transpiration pull”, the soil water potential decreases when subjected to drought stress, while the resistance to water transport in the soil rises; the water potential gap between the roots and the soil reduces, which causes a considerable decrease in the plant water potential (leaf water potential and stem water potential) [8]. Substantial decreases in photosynthesis under water stress have been observed to be mainly associated with stomatal and non-stomatal limitations, depending on the extent and the severity of the applied stress [8]. A decrease in photosynthetic rate occurs first due to the stomatal closure and reduced cell expansion caused by ABA. Meanwhile, a significant reduction in transpiration occurs, which increases intrinsic water use efficiency and eliminates xylem water tension [8]. At this stage, CO2 diffusion limitation caused by stomatal factors is the dominant factor constraining the photosynthetic rate [9]. When the decrease in net photosynthetic rate induces a series of domestication changes in carbon and nitrogen metabolism, photosynthetic pigment synthesis, chlorophyll fluorescence parameters, and biomass allocation and growth, non-stomatal factors become dominant as the water stress increases [10]. Drought stress strengthens the link between chlorophyll fluorescence parameters and photosynthetic traits [11]. Drought stress causes a decrease in maximum photochemical quantum efficiency (Fv/Fm), PSII quantum efficiency (ΦPSII), and photochemical burst coefficient (qP) and an increase in nonphotochemical burst coefficient (NPQ) [12]. Drought stress induces stomatal restriction and reduces intercellular CO2 concentration (Ci). The limitation of CO2 absorption results in an imbalance between PSII activity and the Calvin cycle, which increases the excitation energy of PSII and causes the photodamage of PSII oxygen evolving complexes and disruption of diverse D1 proteins. Thus, the drought-stress-induced inactivation of PSII reaction centers and photoinhibition adversely affect chlorophyll fluorescence and fast induction kinetics [13]. Cotton develops a series of adaptive mechanisms when it is subjected to drought adversity stress itself, and if the stress is within its adaptive range, rehydration produces a physiological compensatory effect, i.e., there is a short period of rapid growth after the stress is lifted to make up for the damage caused by the stress [14].
Hydraulic failure and carbon starvation are two major physiological mechanisms of drought-related plant mortality. The first refers to irreversible damage to plant water transport that results in tree desiccation and is typically quantified as the percentage loss of xylem hydraulic conductivity [15]. The second is associated with a massive loss of carbohydrates required to maintain minimal primary and secondary metabolic functions and is usually quantified in terms of non-structural carbohydrate (NSC) content. NSCs include starch (the major storage compound in woody plants) and soluble sugars, which are derived directly from photosynthesis or starch consumption and are involved in a variety of physiological functions such as respiration, expansion pressure maintenance, phloem transport, hydrodynamic repair, signaling, and defense. Under drought stress, the xylem embolism formation originates from a purely physical process in which gas enters the xylem conduit due to increased xylem tension, while the NSC depletion mainly depends on the imbalance between photosynthetic carbon absorption and carbon substrate demand [16]. Long-term drought-induced stomatal closure significantly reduces the number of non-structural carbohydrates (NSCs) [17]. Because of the reduction in growth due to the carbon sink limitation before the reduction in photosynthesis, NSCs concentrations may rise during short-term drought [15]. The starch may decrease by conversion to sugar, may not change, or may increase during the drought episode [18]. Indeed, according to the extent of the drought, the plant carbon balance may become negative (i.e., the continued carbon demand for maintenance and defense consumes most of the non-structural carbohydrates [NSC], leading to plant starvation) [15]. And the extent of drought damage affects the recovery of cotton stem hydraulic conductance and NSCs after rewatering, but it has received limited attention in short-term drought conditions [19]. It is vital to comprehend the changes in key physiological functions in addition to the extent of damage caused by short-term drought stress.
As mentioned above, the mechanisms of drought adaptation and response to crop growth, photosynthesis, and other key ecophysiological processes have been extensively characterized, and have mostly emphasized the process of hydrologic deficit periods [20]. However, given the evolving nature of drought episodes, it is critical to explore the ability of plants to acclimatize and recuperate from drought stress. Therefore, this study aimed to: (1) investigate the responses of the stem hydraulic conductance of cotton in response to drought episode and rewatering as well as the recovery of xylem embolism after rewatering; (2) determine the changes in photosynthetic capacity and chlorophyll fluorescence parameters following drought episode and rewatering; (3) identify the responses of carbon metabolism to drought episode and rewatering, which can facilitate an in-depth understanding of cotton’s hydro-physiology and, thus, provide a scientific basis for designing irrigation scheduling.

2. Materials and Methods

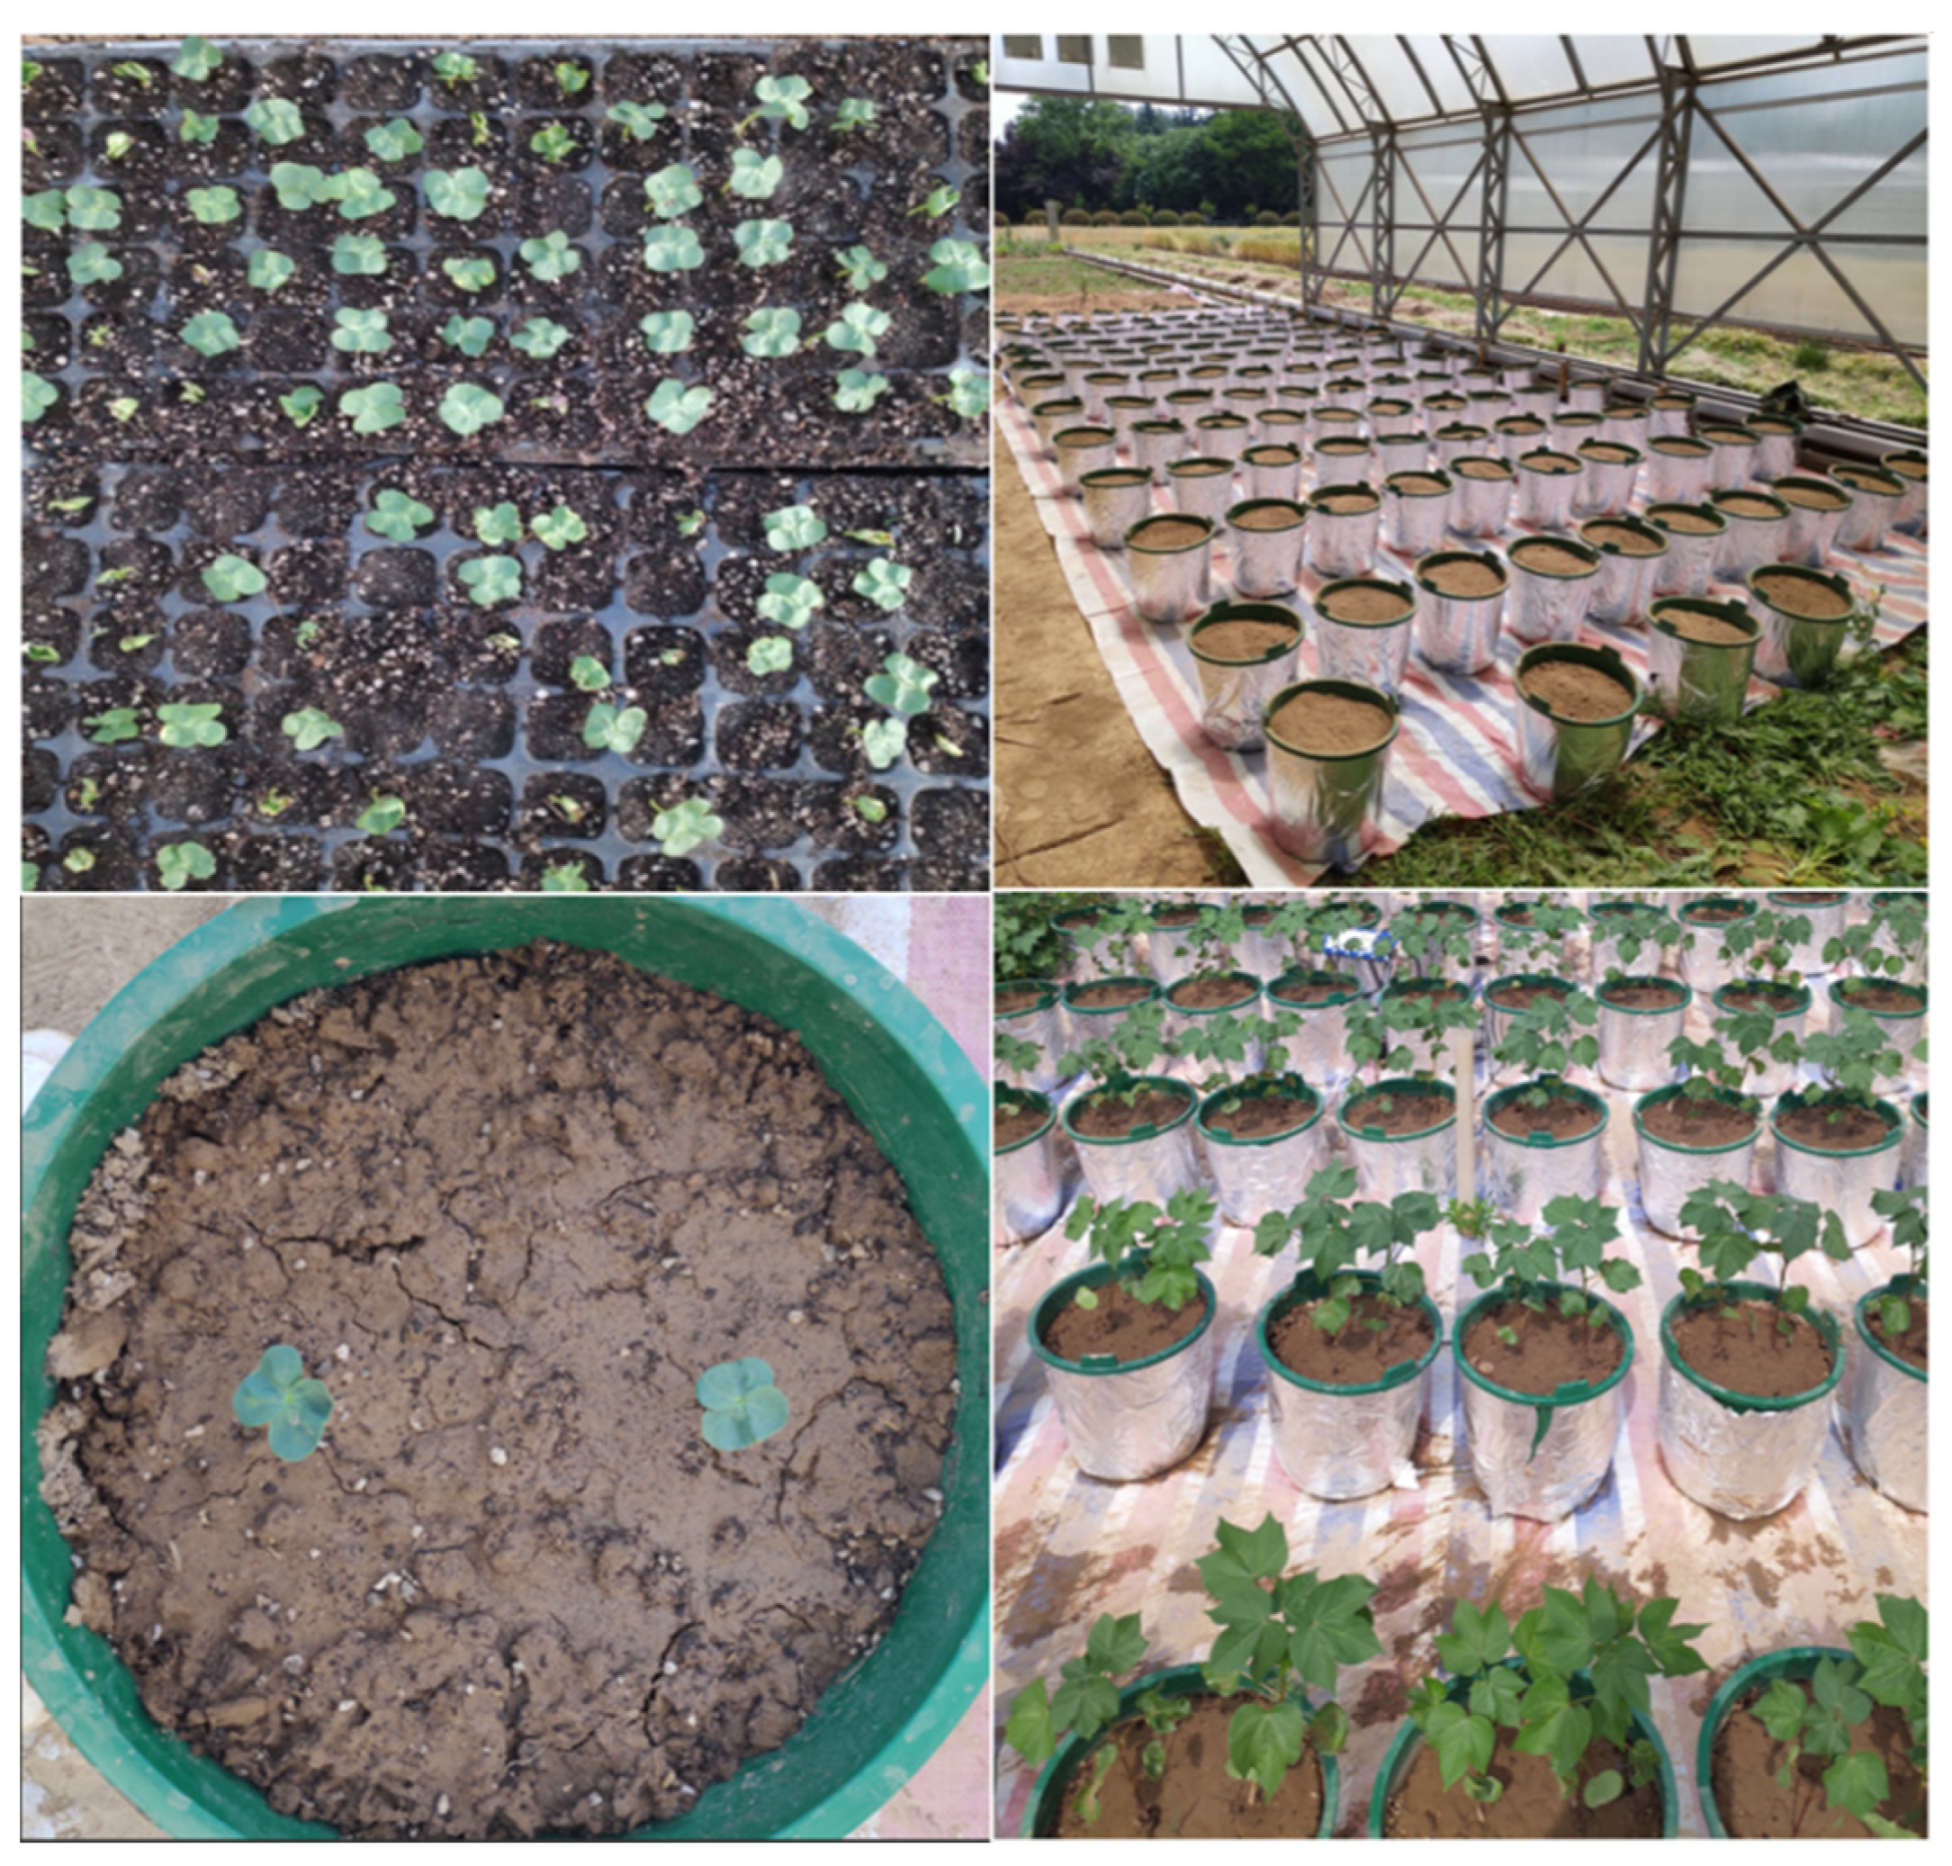
2.1. Plant Material and Growth Conditions

The experiment was performed from May to October in 2020 at the Key Laboratory of Agricultural Soil and Water Engineering in Arid and Semiarid Areas of Ministry of Education, Northwest A&F University, Yangling, Shaanxi Province, China (N34°, E108° and 524.7 m a.s.l.). The cotton (cultivar Xinluzao 26, a drought-resistant variety) was seeded in ~15 L plastic pots (30 cm in height, 25 cm in bottom diameter, and 30 cm in top diameter) to achieve the precise control of soil water (Figure 1). Each pot was filled with air-dried heavy loam soil (soil bulk density 1.35 g cm−3 and soil water holding capacity 21% [g g−1]), with 4 uniformly punched holes of about 5 mm diameter in the bottom and laid gauze to function as an air-permeable and filtration layer. Local soils from the tilled layer (0~20 cm) were selected to enhance the relevance to field conditions. The soil (pH 8.14) contained 12.02 g kg−1 organic matter, 11.2 mg kg−1 available N, 13.50 mg kg−1 available P, and 102.3 mg kg−1 available K. The surface of the soil was mixed with nutritive soil to reduce the impact of irrigation and avoid soil compaction. The soil was air-dried, crushed, and sieved before use to make it uniform and eliminate spatial differences. A wire netting (2 mm mesh size) was used to remove the small stones and residual plant roots and leaves, which should not have changed the composition and physical properties of the soil. The same fertilization scheduling was applied in each pot, with N (300 kg ha−1), phosphorus (120 kg ha−1), and potassium (60 kg ha−1) applied at 10% at the seedling stage, 40% at the bud stage, and 50% at the boll stage. Three replicates were conducted with two plants in each pot. The mobile rain shelter was opened on sunny days and closed on rainy days to maintain the same surrounding environmental conditions.
There were three drought durations, including soil water drying continuing for one day (D1), two days (D2), and three days (D3) after it reached 40% ± 5% of the soil water holding capacity, and the soil was then rewatered to the soil water holding capacity. A full irrigation treatment was also used as the CK. The soil water content was regulated according to the weight. The pots were weighed on a daily basis and re-watered at 18:00. A vertical plastic pipe was placed adjacent to the inner wall to supply water from the bottom of the pot. The cotton was planted on 29 May and harvested on 2 November, and the drought-rewatering experiment was performed from 6 September to 19 September at the blooming stage of cotton. The soil was maintained to the soil water holding capacity at the other growth stages of cotton.

2.2. Measurements and Methods

2.2.1. Soil Water Content

Soil water content was measured by the 5TM sensors (Decagon Devices Company, Pullman, WA, USA), which were corrected by the weighing method. Soil auger was used to retrieve soil samples (5, 10, 15, 20, 30 cm), and the samples were then placed in aluminum specimen boxes and weighed to obtain the wet weight. Subsequently, the samples were dried in an oven at 105 °C until the weight was constant, and then the dried soil samples were weighed. There were three replicates in each pot: one below the root, one on the right side of the root near the center of the pot, and one on the left side of the root.

2.2.2. Stem and Leaf Water Potential

The predawn (4:00 a.m.–5:00 a.m.) stem water potential (φpd-stem, MPa) was measured during the drought episode and rewatering, and three replicate plants per treatment were randomly selected in each measurement. To ensure that the stem section could be placed into the pressure chamber, the stem section with only one incision was cut from the top of the plant downward. As soon as the stem flow from the incision stopped pressing and entered the portable plant water pressure chamber, the incision was made upright, and the reading was recorded.
The leaves were collected to measure pre-dawn leaf water potential (φpd-leaf) and midday water potential (φmd-leaf) before dawn (04:00–05:00) and at noon (12:00–13:00) using PMS 1515D pressure chamber (PMS Instrument Company, Albany, NY, USA). A sharp blade was used to cut the petiole perpendicularly, and it was put in the pressure chamber immediately, with the exposed cross-section of the petiole observed with a magnifying glass. When blisters just emerged on the cross-section, the water potential was recorded as the reading of the pressure chamber.

2.2.3. Stem Hydraulic Conductance

Following the φpd-stem measurements, the stem hydraulic conductance (Kinit) was measured using a low-pressure hydrometer measurement system, obtaining one set of φpd-stem and Kinit per plant. The segments used to measure Kinit were cut under water from the base of a 10 cm long stem at predawn (4:00 a.m.–5:00 a.m.). Firstly, each cut stem segment was connected to the inlet and outlet of the water flow passage, and then a 3–5 kPa pressure to the passage was applied to drive a 10 mmol L−1 KCl solution (Vacuum de-aeration and 0.22 μm filtered) to pass through the branch, and the weigh change of the outflow water was recorded with a ten thousand-position balance at the outlet. By recording the change in water weight in 15 s, the initial hydraulic conductance (Kinit, mg mm−1 kPa−1 s−1) was calculated. After measuring Kinit, the cut segment was flushed for 5~10 min at a 100 kPa pressure to eliminate any possible existing native embolisms, and it was measured again using the method stated above to obtain the maximum hydraulic conductance (Kmax, mg mm−1 kPa−1 s−1). The percentage loss of hydraulic conductance (PLC, %) was calculated as follows:
P L C = 1 K i n i t / K m a x

2.2.4. Photosynthetic Parameters

Three cotton plants were selected randomly, and the photosynthetic parameters of the functional leaf (the fourth fully expanded main stem leaf from the top) were measured with an LI-6800 portable photosynthesis system (LI-COR, Lincoln, NE, USA) at 9:00 a.m.–11:00 a.m. during drought and rewatering. The measurement conditions were set as follows according to Sakshaug [21]: relative humidity 65%, chamber CO2 concentration 380 μmol mol−1, flow rate 500 μmol m−2 s−1, leaf temperature ~27 °C, and photosynthetic photon flux density 1500 μmol m−2 s−1 provided by an LED light source. The photosynthetic parameters included net photosynthetic rate (An), stomatal conductance (Gs), transpiration rate (T), and intercellular CO2 concentration (Ci). The leaf water use efficiency (WUE) was calculated as follows:
W U E i = A n / T

2.2.5. Chlorophyll Fluorescence Parameters

The chlorophyll fluorescence parameters were measured using an imaging fluorometer, i.e., Handy FluorCam (Photo Systems Instrument, Drásov, Czech Republic). The leaves were treated in the dark for 30 min before measurements, and then the imaging fluorometer was used to measure the chlorophyll fluorescence parameters, including the minimum fluorescence yield of the dark-adapted state (Fo) and maximum fluorescence yield of the dark-adapted state (Fm); the value of Rfd-Lss was recorded. The maximum variable fluorescence (Fv = Fm − Fo), maximal PSII quantum yield (Fv/Fm), and energy transformation potential activities of Q Y m a x were calculated as follows [22]:
Q Y m a x = F m F o F m

2.2.6. Non-Structural Carbohydrates Contents

After the measurement of photosynthetic parameters and chlorophyll fluorescence parameters, the three measured cotton leaves were sampled and oven-dried at 50 °C for 72 h for non-structure carbohydrates contents determination. The non-structural carbohydrates content involved starch and soluble sugar (SS) contents. Ethanol (80%) was used to extract the soluble sugar from the leaf samples powder, perchloric acid (35%) was used to hydrolyze the starch, and the soluble sugar was colorimetrically quantified with a spectro-photometer (Merck KGaA, Darmstadt, Germany) as a standard. Both components were quantified using the Anthrone method [23].

2.2.7. Vulnerability Curve of Xylem Embolism

The dehydration method [24] was used to construct the vulnerability curve. Irrigation was withheld from potted plants, which were dehydrated naturally under field conditions and then transported to the laboratory. The stem water potential and the corresponding K values were then measured in accordance with the procedures described earlier. The stem was cut from the intact plant underwater, and the hydraulic conductance was measured; it was dehydrated to measure water potentials through natural drought. These hydraulic conductivities can be plotted directly against stem water potential. The Weibull cumulative distribution function was used for fitting:
K i n i t K m a x = e x p φ s t e m b c
where φstem is the stem water potential, and b and c are the fitted parameters.
After the curve was fitted, the optimal values of b and c were obtained, and the P50, P12, and P88 were calculated as follows [25]:
P 50 = b ln 2 1 c  
P 12 = b ln 100 l n 88 1 c
P 88 = b l n 100 l n 12 1 c

2.3. Statistical Analysis

SPSS 19.0 soft (SPSS Inc., Chicago, IL, USA) was used for statistical analyses. A one-way analysis of variance (ANOVA) was applied to test the differences in means of treatments. The figures and the analyses of correlations between parameters were prepared using Origin 2018.

3. Results

3.1. The Dynamics of Soil Water Content

Both the atmosphere and crop influenced soil water content (SWC). The variations of SWC during the drought episode are displayed in Figure 2. After sufficient water supply, the SWC reached 0.205, which was 98% of the soil water holding capacity. With the increasing soil depth, the SWC decreased. After 1 day of drought, the SWC in the 0~30 cm soil layer generally decreased by 24% compared to the full irrigation treatment. There was a significant reduction in SWC in the 0~15 cm soil layer to 65–75% of the soil water holding capacity. The SWC decreased to about 50% of soil water holding capacity after 2 days of drought, which was 30% lower than that of the previous day. The SWC of D1, D2, and D3 gradually decreased and remained in the range of 35–45% of the soil water holding capacity, which was close to the wilting water content of the soil. The SWC of the top 10 cm soil layer remained lower than the average water content, which was greatly influenced by the atmosphere.

3.2. Stem and Leaf Water Potentials

The stem and leaf water potentials including φmd-stem, φpd-leaf, and φmd-leaf showed decreasing trends compared with those of full irrigation, and they all reached the maximum decreasing rate when the SWC reached 40% ± 5% of the soil water holding capacity (Figure 3). The drought duration after the SWC reached 40% ± 5% of the soil water holding capacity significantly affected φmd-stem and φmd-leaf, while it had no significant effect on φpd-leaf. The φmd-stem of D2 and D3 decreased by 23.3% and 20.2% compared with that of D1, respectively. Compared with D1, D3 and D2 decreased φmd-leaf by 15.5% and 15.4%, respectively. The decreasing rates of φmd-stem and φmd-leaf significantly slowed down with the increasing drought duration, but the declining rate of φpd-leaf basically remained stable. The water potential of cotton measured over a day demonstrated the following order: φmd-stem > φpd-leaf > φmd-leaf. Stem water potential was more vulnerable to drought stress and, thus, could reflect the soil water availability more effectively than leaf water potential. φmd-stem, φpd-leaf, and φmd-leaf reached the minimum values in D3, which were −3.19, −3.63, and −4.00 Mpa, respectively.
After experiencing different drought durations, cotton suffered from different degrees of water stress. Thereafter, the rewatering process behaved differently among different treatments. The longer the drought duration, the slower the recovery of plant water potential after rewatering. The φpd-stem after rewatering demonstrated the following order: D1 > D2 > D3. After 2 h of rewatering, the φmd-stem of D1, D2, and D3 recovered to 4.0%, 18.9%, and 19.2% of the full irrigation level, respectively; after 1 d of rewatering, the φmd-stem of D1, D2, and D3 recovered to 93.8%, 72.0%, and 61.4% of the full irrigation level, respectively. D1, D2, and D3 required 1 d, 3 d, and 5 d to ensure that φmd-stem recovered to 95% ± 5% of the full irrigation level. The recovery rate of stem water potential was always greater or equal to that of the leaf water potential.

3.3. Recovery of Stem Hydraulic Conductance

Figure 4a reveals a linear relationship between the mean soil water content and the percentage loss of hydraulic conductance (PLC) in cotton stem xylem. A significant difference (p < 0.05) in PLC between D1 and CK was found, and the PLC of D2 and D3 was significantly different (p < 0.01) from that of CK. It can be seen that PLC was dramatically increased by 46.9% and 87.5% in D2 and D3 in comparison to D1, respectively. The drought duration had a highly significant effect on PLC, and the effect varied depending on drought duration. In contrast to the trends of SWC and PLC, there existed a lagging effect of the PLC of cotton in response to the decrease in SWC. The SWC decreased by 24%, 46.7%, and 53.8% after 1 d, 2 d, and 3 d of drought stress, while the PLC was only 9.5%, 10%, and 16.5%, respectively. When the SWC decreased steadily to the wilting water content of the soil, the PLC showed a linear increase. There was merely a 3.5% change in SWC from D1 to D3, with corresponding 1.47 times (D2) and 1.88 times (D3) increases in embolism intensity.
Hydraulic conductance completely recovered to its pre-dehydration levels after rewatering; however, the required recovery duration varied among treatments (Figure 4b). The drought duration had a highly significant effect (p < 0.05) on the extent of cotton embolism recovery. PLC, which quantifies the severity of xylem embolism in stem xylem, was 0 at 1 day after rewatering in D1, indicating that the hydraulic conductance was fully recovered. The complete recovery of hydraulic conductance took 3 d in D2, and the hydraulic conductance of D3 was not fully recovered to the full irrigation level after 5 d of rewatering. After 9 h of rewatering, the recovery rate of D3 and D2 was 1.63 times and 1.43 times that of D1, respectively, and the recovery rate decreased during the subsequent rewatering.

3.4. Photosynthetic Responses to Drought Episode and Rewatering

To eliminate the effect of meteorological factors on the leaf photosynthetic parameters, the CK treatment was set to maintain the soil water as soil water holding capacity. The variations in photosynthetic parameters differed significantly among CK, D1, D2, and D3 treatments (Figure 5).
The difference in transpiration rate (T) among the drought-rewatering and CK treatments as well as the reduction of transpiration rate gradually increased with the increasing drought duration. Compared to CK, D1, D2, D3 reduced T by 91%, 98%, and 95%, respectively, indicating that there was no transpiration occurring. After 2 h of rewatering, the T of D1 recovered to 41% of the full irrigation level (p = 0.006 < 0.01), which was still significantly different from that of CK (p = 0.01 < 0.05), and there was no significant difference in recovery rates between D2 and D3. After 1 day of rewatering, the T of D1 was recovered to 114% of full irrigation level (p = 0.227) and that of D2 was recovered to 92% of full irrigation level (p = 0.772 > 0.05). The T of D1 and D2 could be considered to have basically recovered. After 7 days of rewatering, the T of D3 was greater than the full irrigation level, and it could be considered that the recovery duration of T was 6 days in D3.
A similar trend was observed for net photosynthetic rate (An) and transpiration rate (T). The reduction of An increased with the increasing drought duration. An decreased continuously and eventually stabilized during the drought stress. The decrease in An was 88% in D1 and 97% in D2 compared with CK, respectively, and no significant difference was observed between D2 and D3. After 2 h of rewatering, the An of D1 rapidly recovered to 35% of the full irrigation level, but there was still significant difference from that of the full irrigation treatment (p = 0.017 < 0.05). The An of D2 and D3 recovered to 33% and 29% of the full irrigation level, respectively, which were significantly (p = 0.001 < 0.01) lower than that of D1. After 1 day of rewatering, the An of D1 recovered to the level of CK (p = 0.554) and that of D2 was recovered to 87% of the full irrigation level (p = 0.086 > 0.05). The full recovery of An occurred between 1 and 4 days after rewatering in D2, whereas the full recovery of D1 occurred within 1 day of rewatering. After 3 days of rewatering, the An of D3 was not statistically different from that of the full irrigation treatment (p = 0.666), and the recovery was greater than 90% of the full irrigation level, which could be considered complete recovery.
The change in stomatal conductance (Gs) fluctuated greatly with the changes in meteorological factors since it was very sensitive to them. Overall, the Gs decreased with increasing drought duration and gradually recovered following rewatering. The reduction of Gs was 95% in D1 and 97% in D2, and the D3 treatment was consistent with the D2 treatment, which indicated that the closure of Gs occurred primarily in the early stage of the drought episode. After 2 h of rewatering, the Gs of D1 recovered to 20% of the full irrigation level, which was still significantly less than that of the full irrigation treatment. The Gs recovered to 21.6% and 20% of the full irrigation level in D2 and D3, respectively, with no significant difference among D1, D2, and D3 in terms of the extent of recovery. After 1 day of rewatering, the Gs of D1 was not significantly different from that of full irrigation treatment (p = 0.601), and the extent of recovery was greater than 90%, which was considered fully recovered. The Gs of D2 recovered up to 80% of the full irrigation level, which was slightly slower compared with that of D1, and the full recovery duration was longer than 1 day. After 3 days of rewatering, the Gs of D3 was recovered up to 80% of the full irrigation level and did not differ significantly from that of full irrigation treatment (p = 0.220), assuming that the main recovery duration was 3 days after rewatering.
The intercellular CO2 concentration (Ci) trends were relatively complex during the drought and rewatering processes, but the full irrigation treatment remained relatively stable throughout the process. In contrast to the variations of T and An, the variation of Ci exhibited a latency during the drought process. The D1 treatment sharply increased Ci by 55% compared to CK. Because of the fluctuation in meteorological conditions, CK significantly decreased Ci (p = 0.002), whereas the Ci of D2 and D3 remained at a high level, which was not significantly different from that of D1. After 2 h of rewatering, the Ci of D1 recovered to a level insignificantly different from that of CK, indicating that the main recovery duration was 2 h after rewatering in D1. The Ci of D2 was basically recovered after 1–4 days of rewatering, which indicated that the recovery duration of D2 was longer than 1 day. After 3 days of rewatering, the Ci of D3 recovered to more than 80% of the full irrigation treatment, implying that its recovery duration was primarily 3 days.
There were no significant (p = 0.147) differences in leaf intrinsic water use efficiency (WUEi) between D1 and CK. The WUEi of both D2 and D3 was significantly greater than that of D1. After 2h of rewatering, the WUEi of D1 first increased sharply and then gradually decreased with increasing rewatering duration. After 1 day of rewatering, there was no statistical difference (p = 0.064) in WUEi between D1 and CK, which indicated that the main recovery duration of D1 was within 1 day. The same trend was observed in D1 and D2. After 5 days of rewatering, there was no significant difference in WUEi between D3 and CK, which indicated that the main recovery duration of D3 was greater than 5 days.

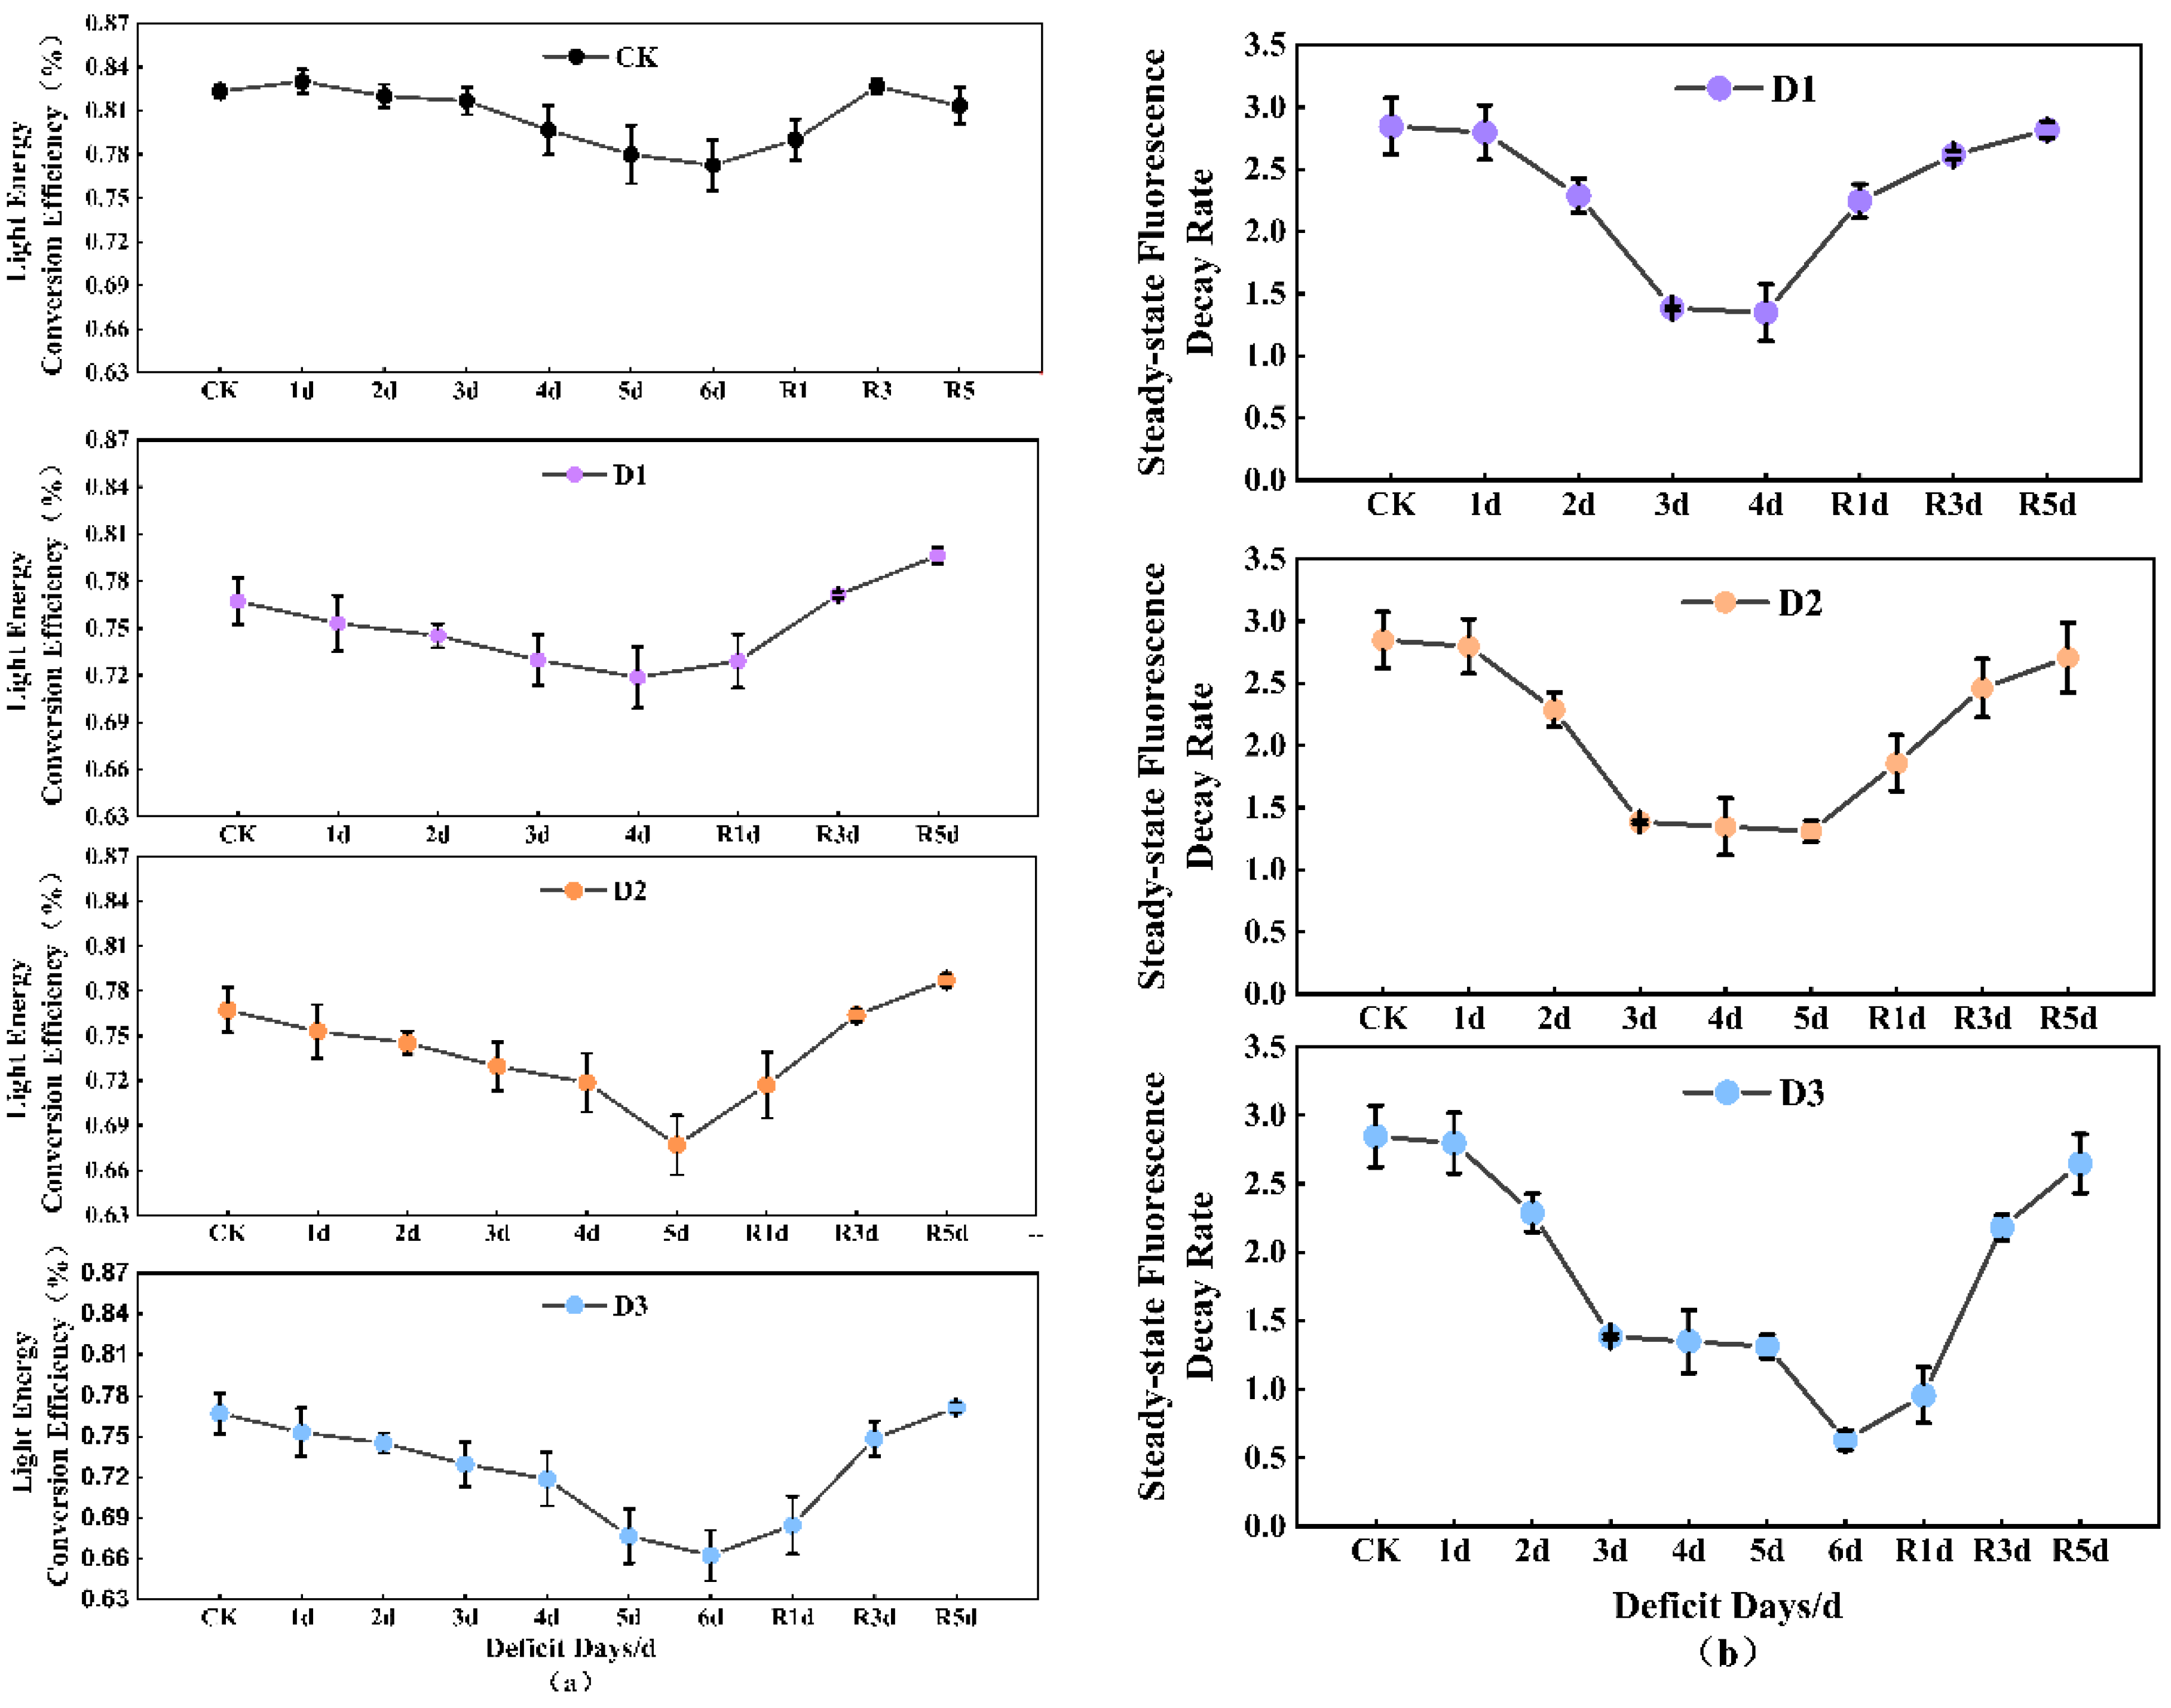
3.5. Chlorophyll Fluorescence Parameters

The light energy conversion efficiency and steady-state fluorescence decay rate of cotton leaves varied during the drought and rewatering process. The QYmax decreased significantly as drought duration increased (Figure 6a), and D1, D2, and D3 significantly decreased QYmax by 10%, 13.2%, and 14.2% compared to CK, respectively. After 1 day of rewatering, the QYmax of D1 recovered completely, and there was no significant difference compared to CK. The QYmax of D2 and D3 recovered to 93% and 88%, both of which were significantly different from that of CK. After 3 days of rewatering, there existed no significance among D2, D3, and CK, which indicated that D2 and D3 had completely recovered after 3 days of rewatering.
As the drought duration increased, QYmax significantly decreased by 10%, 13.2%, and 14.2% in D1, D2, and D3 compared to CK, respectively. After 1 day of rewatering, the QYmax of D1 completely recovered, and there was no significant difference compared to CK. The QYmax of D2 and D3 recovered to 93% and 88% of the full irrigation level compared to CK, both of which were considered to have recovered completely after 3 days of rewatering.
As shown in Figure 6b, the steady-state fluorescence decay rate (Rfd-Lss) trend was similar to the actual light energy conversion efficiency of photosystem II during drought and rewatering, but the changes were more pronounced. The loss values gradually increased with the increasing drought duration. As observed, D1, D2, and D3 had significant loss values of 31.1%, 54%, and 78%, respectively. After 1 day of rewatering, the Rfd-Lss of D1, D2, and D3 recovered to 85%, 66%, and 33% of the full irrigation level, respectively. After 2 days of rewatering, they all fully recovered with insignificant differences compared to CK.

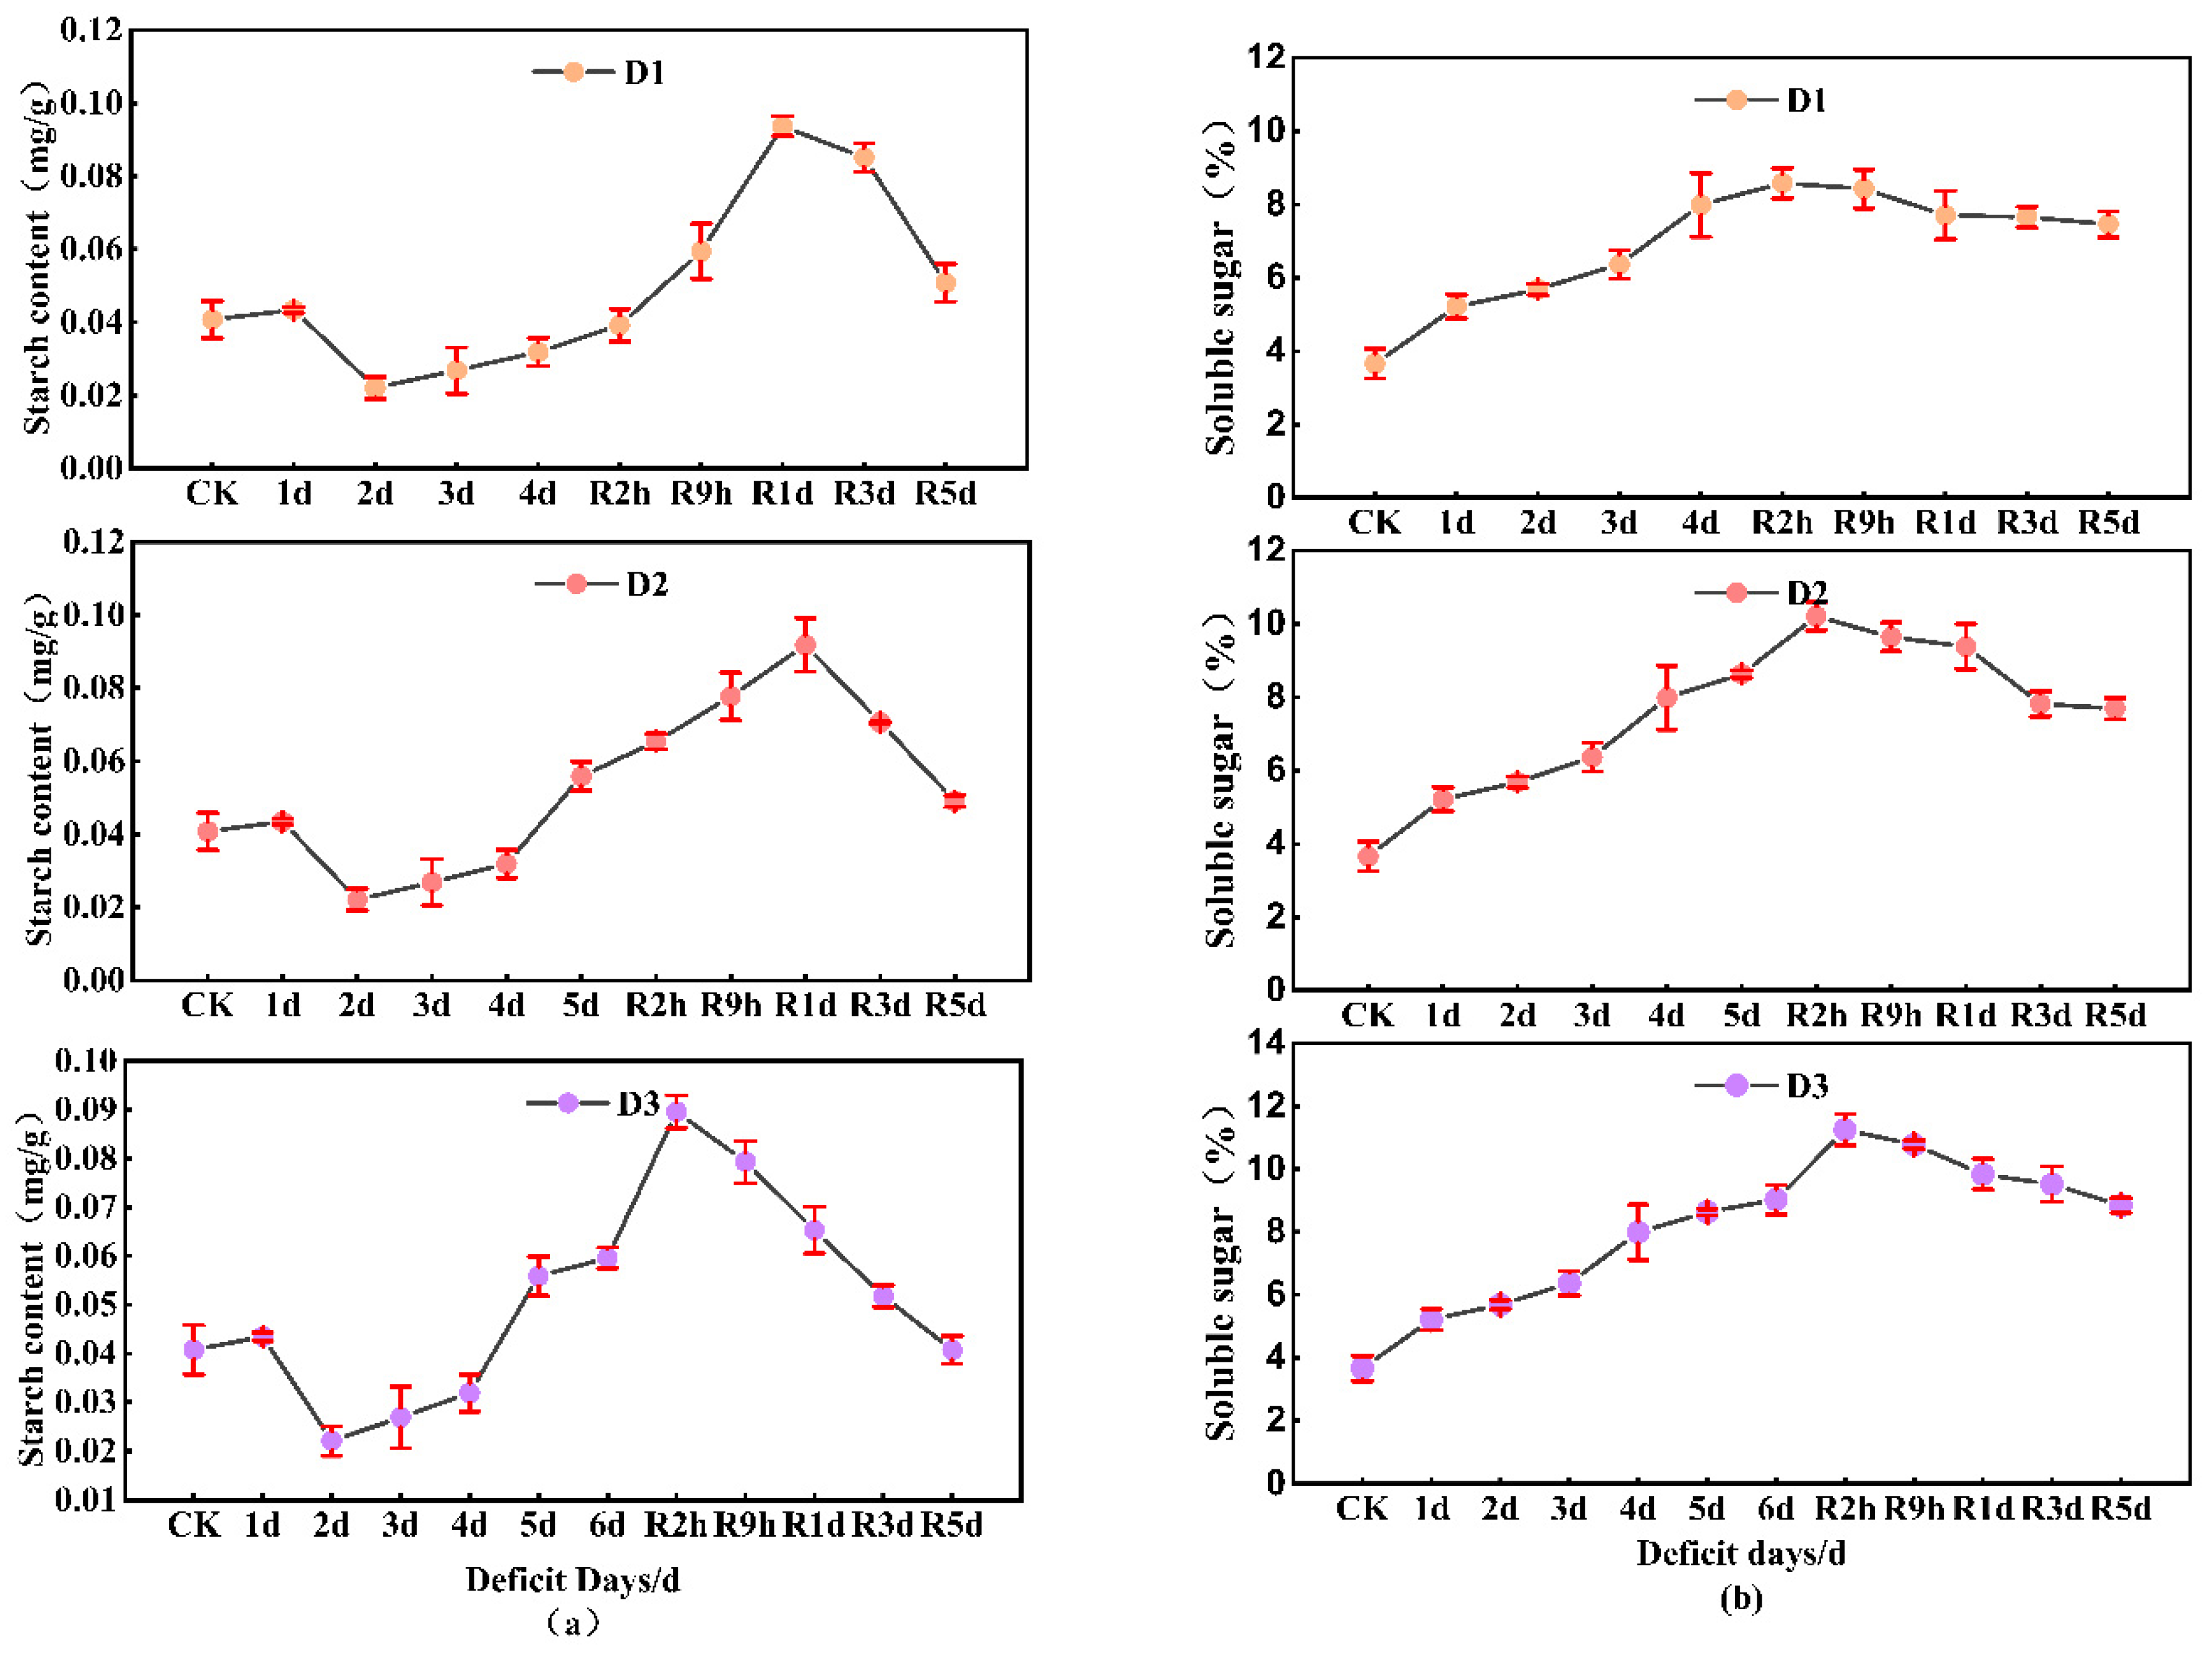
3.6. Non-Structural Carbohydrates

The soluble sugar content (SS) of D1 decreased by 21.8% when compared to that of CK (Figure 7a), but D2 and D3 significantly increased SS with the increasing drought duration. All treatments showed an increasing and then decreasing trend during the rewatering process. After 2 h of rewatering, the SS of D1, D2, and D3 increased by 18.0%, 23.3%, and 73.6% compared to that of CK, respectively, when the D3 treatment peaked in Rfd-Lss. After 1 day of rewatering, the SS of D1 and D2 reached its peak. After 5 days of rewatering, the reducing soluble sugar content in each treatment was in the order of D1 > D2 > CK > D3. The recovery rate of D3 became significantly slower by 4.5% than that of D2, which indicated that with the increase in drought duration, the increasing rate of soluble sugar content gradually reduced, and it ultimately realized zero growth or even negative growth.
The variation of starch content (SC) in cotton leaves presented a more complex trend than soluble sugars (SS) during drought stress. As shown in Figure 7b, D1 significantly decreased SC by 21.8% compared with CK, and D2 and D3 increased SC by 37.0% and 46.2%, respectively, which demonstrated a trend of first decreasing and then increasing with the increasing drought duration. The starch content of cotton leaves continued to increase at the beginning of rewatering, subsequently decreasing over time. Notably, the peak of starch content occurred at a different time in each treatment. After 1 day of rewatering, the starch content of D1 and D2 increased to the peak, which was 129% and 124% higher than that of CK, and then gradually decreased with the increasing rewatering duration of hydration. After 5 days of rewatering, the SC of D1 and D2 was still 24.4% and 19.5% higher than that of CK, but the recovery rate of D2 was higher than that of D1. The starch content of D3 reached the peak after 2h of rewatering, increasing by 120% compared with the CK treatment, where the peak time was earlier than that of D1 and D2. The leaf starch content decreased significantly compared with the peak (p = 0.001) after 1 day of rewatering and basically recovered to the initial level after 5 days of rewatering, which was not statistically different from that of CK (p = 0.512). The recovery rate of the starch content of different treatments was in the order of D3 > D2 > D1.

3.7. Stem Xylem Vulnerability Curves

The embolism vulnerability curve (Figure 8) of cotton was established by measuring the φpd-stem and the corresponding PLC during the drought process, and it was fitted with the Weibull cumulative distribution function. The results of the Weibull function are shown in Figure 8. Cotton’s P12, P50, and P88 were all significantly different, indicating that the hydraulic conductance gradually decreased as water stress aggravated, and the embolism extent showed a continuous and steady increase. The percentage loss of hydraulic conductance in D1 dropped to 32% and to 47% in D2, which was similar to P50 and could be considered as the critical value of hydraulic conductance loss at this time.

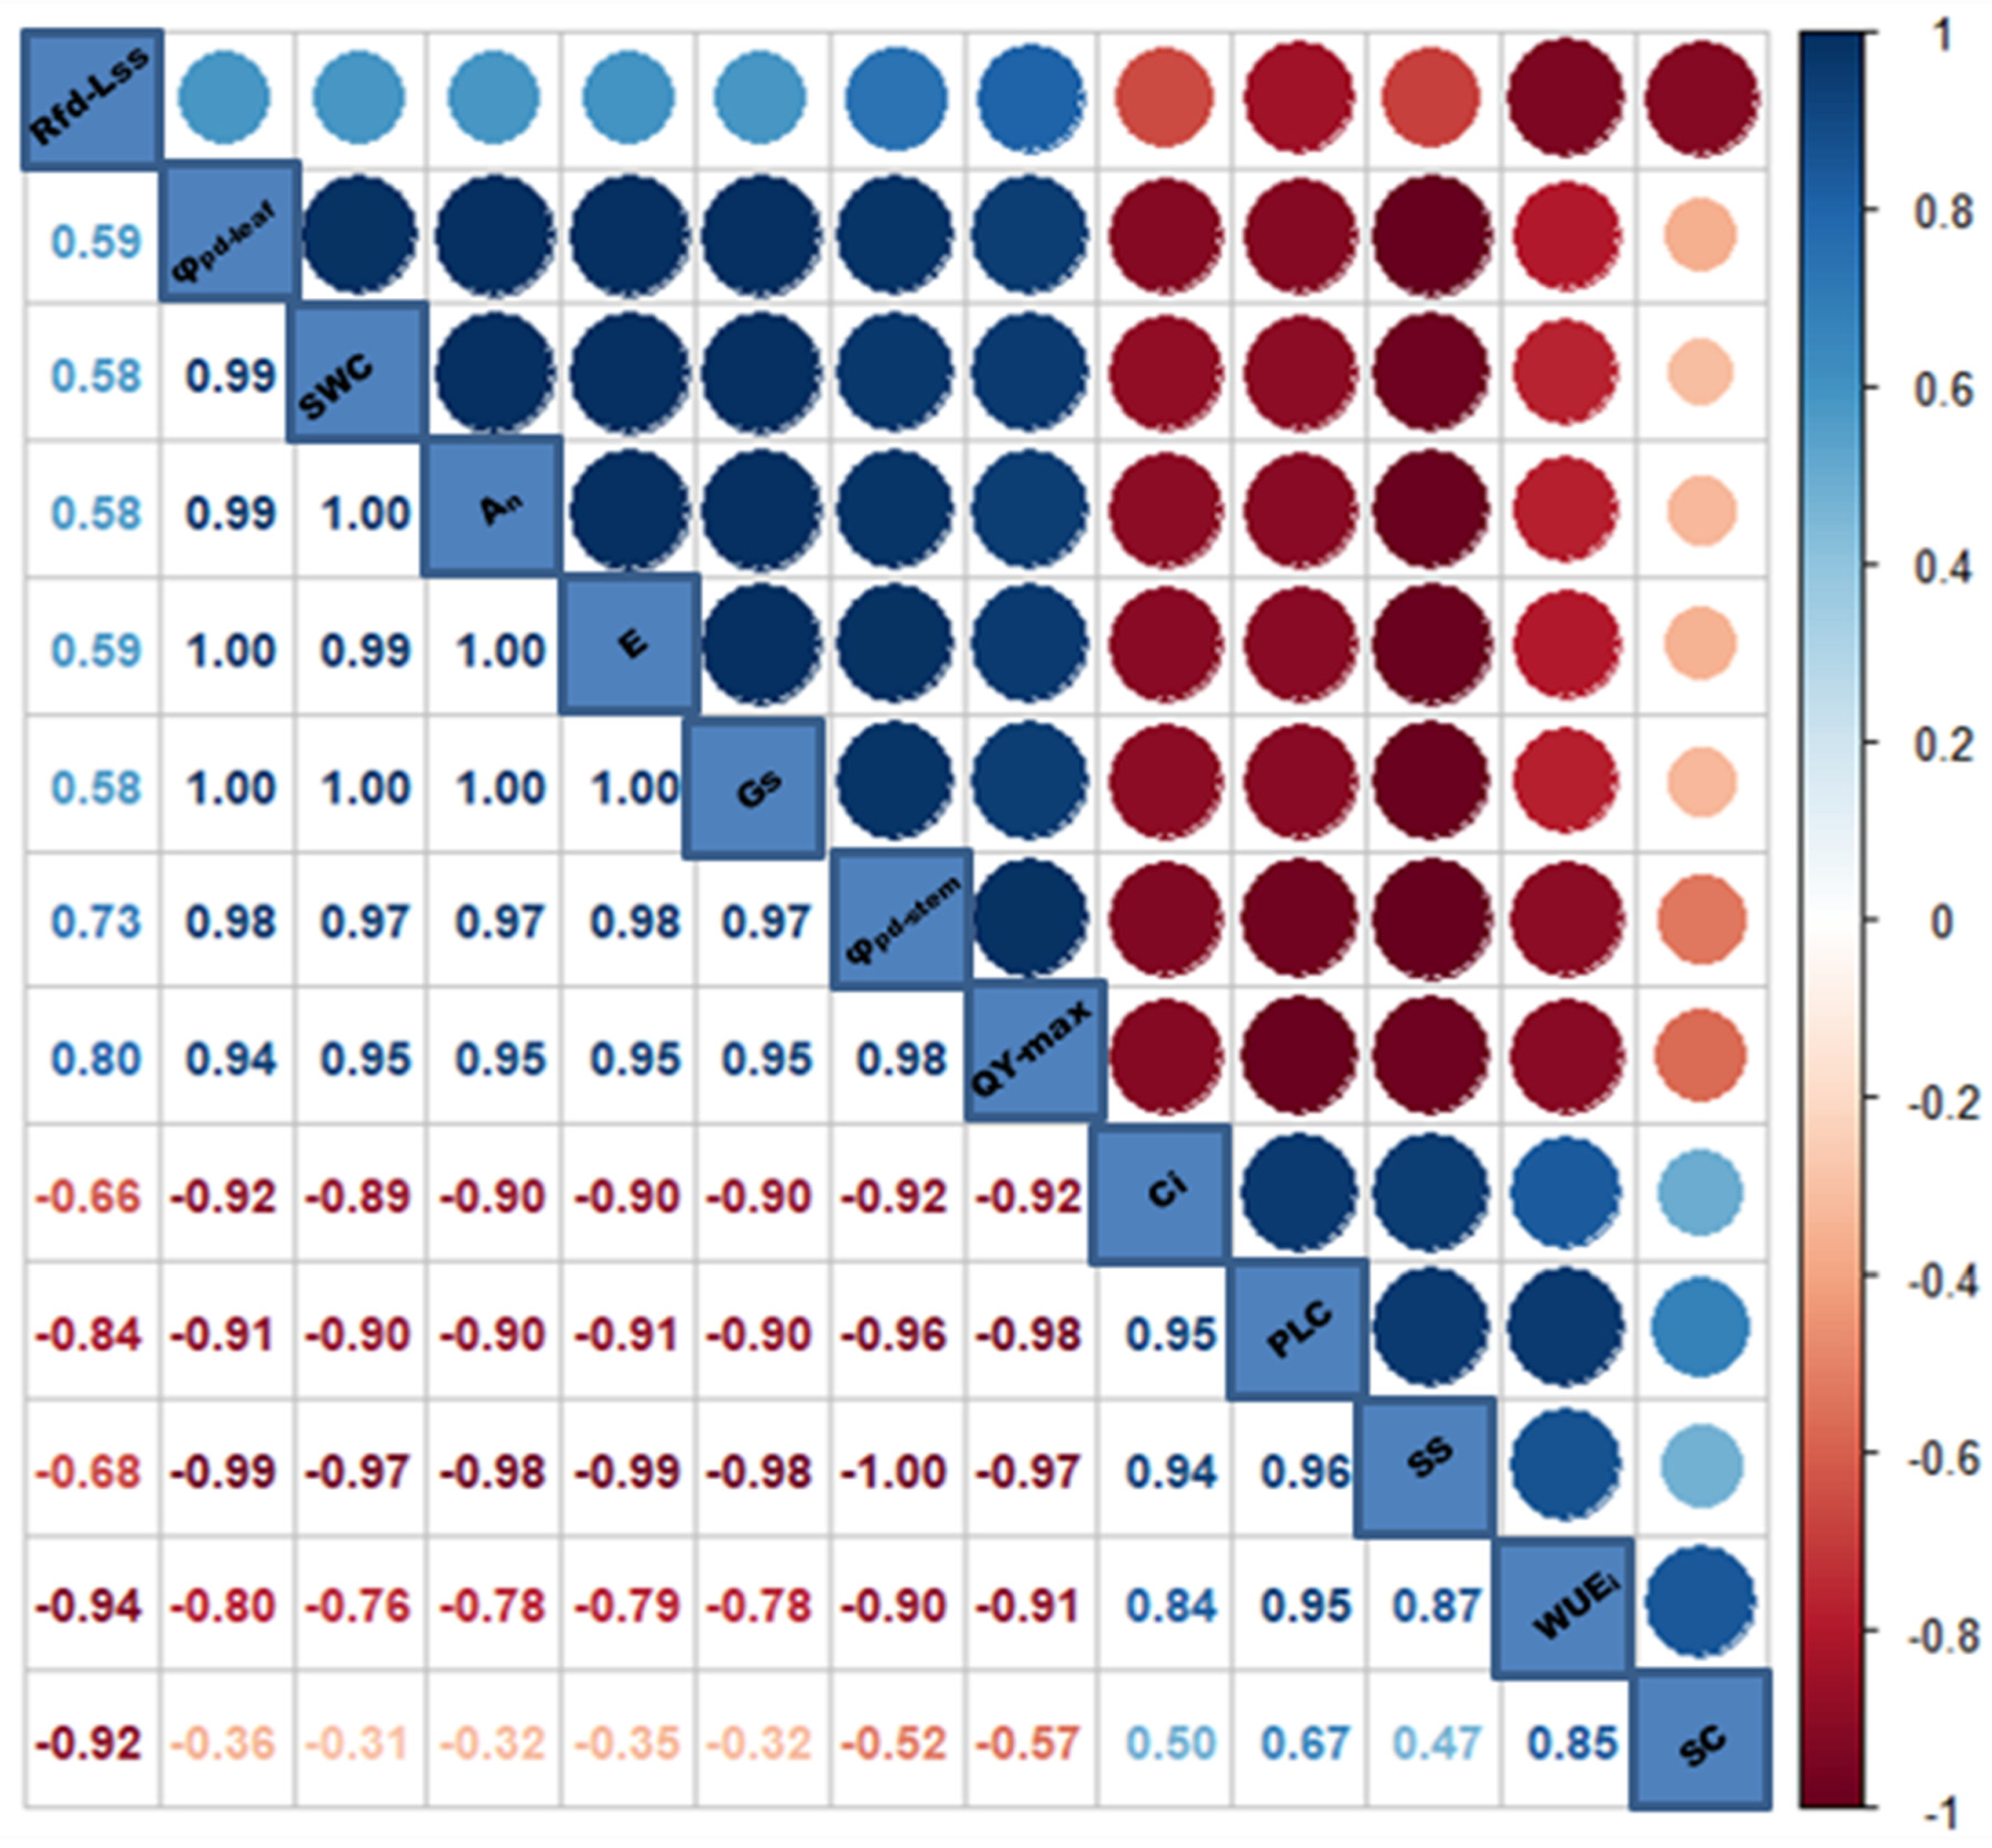
3.8. Analysis of Multiple Functional Traits under Drought–Rewatering Conditions

The correlations between soil parameters, hydraulic characteristics, photosynthetic parameters, and fluorescence parameters during the drought process are shown in Figure 9. As shown in the figure, there were significant positive correlations between GS, E, An, SWC, φpd-stem, φpd-leaf, and two chlorophyll fluorescence parameters. There were significant negative correlations between Ci and Gs, A, E, SWC, and with PLC, SS, WUEi, SC. There were significant negative correlations between PLC and φpd-stem, φpd-leaf.

4. Discussion

4.1. Effect of Drought–Rewatering on Stem Hydraulic Conductance of Cotton

When the soil water deficit reached the lower irrigation limit and then continued for different days, it produced subversive changes in the hydraulic characteristics and physiological responses of cotton. Water depletion in the soil caused by leaf transpiration lowered the soil and plant water potentials, inducing a progressive regulation of tree water loss by stomatal closure or by leaf shedding [26]. Cavitation occurred in the stems only after a prolonged water stress, confirming that this process occurred only under severe drought conditions [27]. The findings on the percentage loss of hydraulic conductance (PLC) in the xylem of cotton stems revealed a maintained loss of hydraulic conductance embedded in the xylem of cotton with adequate water supplement. The PLC presented a continuous linear increase with the decline in SWC during the drought stress to the lower irrigation limit; embolism underwent a multiplicative pattern after drought stress remained continuous for varying days. It was only two days after drought stress that the PLC of D1, D2, and D3 had a significant difference from that of the CK treatment. In terms of embolism initiation, i.e., a PLC of 12%, such a delayed response of the PLC was indicative of the preservation of a normal xylem sap flow in cotton in the early stages of drought due to the internal storage of water in the surrounding bast tissue. A study [28] found that a complete stomatal closure always preceded the occurrence of embolism. Figure 3 reveals the same pattern on cotton, possibly because of stomatal regulation moderating the leaf-to-xylem water potential gradient and preventing cavitation preliminarily [29]. There was an appreciable increase in the level of xylem embolism in cotton after the complete closure of stomata after 2 days of drought stress (Figure 3), which confirmed that stomatal closure delayed the formation of embolism [30]. The results illustrated that embolism occurred during drought stress with a 60% loss of hydraulic conductance, which was still fully recovered after rewatering, in contrast to [31] Holbrook’s research, which concluded that embolism only occurred under extreme drought conditions and was irreversible once produced. This study was in contrast to [32], who argued that embolism was a physiological phenomenon that occurred frequently in plants and that the formation and repair of hydraulic conductance of embolism occurred in plants at all times. Trees died only when 90% embolism had occurred in the stem xylem tissue [33]. Yet, some findings showed that mortality occurred at near 50% loss of xylem conductance. In our experiments, the PLC of the D3 treatment almost reached 60% (Figure 4); therefore, we recommend that cotton rewatering should be initiated immediately after reaching the lower limit of SWC and then a continuous deficit of 2 d from the perspective of hydraulic safety. Since there was a tiny initial embolism in the cotton xylem as well as a small percentage of irreversible conduits, cotton embolism recovered quickly after rewatering [34]. During short-term drought stress during the boll stage, cotton manifested a systematic “drought avoidance” mechanism by minimizing embolism through premature stomatal closure [35]. Crop water potential at P50 achieved −3.89 MPa (Figure 8), and plants were supposed to achieve crop water potential at this level under D2 or D3 treatments, which was rarely observed in conventional irrigation field conditions and extremely rare for a reduction in water potential to induce embolism formation, which made cotton unlikely to cause hydraulic failure [24]. Although many woody plants are described by vulnerability curves for xylem embolism vulnerability and drought tolerance, cotton, as a relatively well-developed xylem crop, is not susceptible to vulnerability curves [33,36]. The stem water potential of D2 was similar to that of P50 (Figure 4 and Figure 8), while the corresponding stomata (Figure 5) was completely closed, and photosynthesis was completely ceased. At this time, the drought caused irreversible losses to cotton physiology and yield, while the drought extent of the D3 treatment was exacerbated. Consequently, it is considered desirable to maintain normal physiological activity during the cotton reproductive period, and the drought episode can be sustained for 1 d in a long-term perspective when the SWC is depleted to the lower limit of the field water holding capacity.

4.2. Effect of Drought–Rewatering on Photosynthesis and Chlorophyll Fluorescence Parameters of Cotton

The reduction in the leaf gas exchange of cotton leaves was primarily limited by stomatal closure at the beginning of drought stress, which confirmed the plant economics hypothesis that the initial reduction in Pn in response to drought deficit was normally associated with stomatal limitation [37], whereas biochemical or other limitations occurred as drought stress became more severe [38]. The net photosynthetic rate of cotton leaves entered a rapid degradation stage after 1 day of drought deficit, the Ci of the leaves decreased, and the constricted CO2 supply was the main factor for the decline of the net photosynthetic rate. A greater reduction in stomatal conductance and a sharp increase in intercellular CO2 concentration occurred after 2 days of drought stress, at which point stomatal conductance was influenced by non-stomatal factors [39], as it has been implicated as the major factor for increased IWUE in various treatments [40]. Also, the reduced stomatal conductance also decreased T, which restricted the excessive loss of water and enhanced the acclimation to drought stress [27].
Simultaneously, stomatal movement, which was closely related to photosynthesis, was driven by both internal physiological and external environmental factors [41]. The degree and rate of photosynthesis reduction and recovery were related, and both were critical for plant carbon balance during drought stress [38]. Because of the climate, we failed to observe the data of photosynthetic parameters after 1 day of rewatering. The basic recovery of transpiration rate, net photosynthetic rate, and stomatal conductance was observed in D3 treatment after 3 days of rewatering, whereas both D1 and D2 treatments basically recovered after 1 day of rewatering. The recovery duration of D3 may be less than 3 days, so the recovery rate of D1, D2, and D3 was in the order of D1 ≈ D2 > D3. Usually, if Pn recovery after rewatering is rapid, the predominance of diffusive limitation is likely to have occurred; on the other hand, the longer Pn takes to recover, the more likely biochemical limitations play a role in the photosynthetic reduction [42]. However, another possibility for a slow recovery of Pn was an increase in ABA levels, keeping the stomata partially closed to ensure transpiration occurred at lower levels [42]. Given the higher PLC observed in D3 than D1 and D2 in the present study, the xylem cavitation should have occurred, which would indicate the importance of ABA accumulation in facilitating vessel refilling [43].
Furthermore, the leaf photosynthetic parameters of each treatment demonstrated an obvious compensatory effect after rewatering, as evidenced by an increase in cotton transpiration rate and net photosynthetic rate. Studies have shown that modest drought stress could restore plants’ physiological functions after rewatering [44], and even a compensatory effect occurs to fully restore plants’ physiological functions, thereby compensating for previous drought losses [45]. In this study, the D1 treatment increased by 19.7% after 4 days of rewatering and the D3 treatment increased by 23.7% after 7 days of rewatering compared to the full irrigation treatment, indicating that the timing of the compensatory effect after rewatering varied for different soil drought stresses, which was more clearly reflected by the trend of the intrinsic water use efficiency after rewatering.
Chlorophyll fluorescence evaluates the photosynthetic responses to fluctuating resource availability [46]. QYmax is commonly used to characterize environmental stress, and there is little change in the non-stress state. Here, we found that QYmax significantly decreased under drought stress (Figure 6), which revealed that the PSII may be damaged and the primary reaction of photosynthesis may be inhibited [47]. A large amount of evidence indicated that the responses of the parameters to drought may not be more sensitive relative to these gas exchanges [48]. The RfdLss was the least stressed by drought and recovered fastest when the D1 treatment was rewatered compared to the D2 and D3 treatments, indicating that the photosystem activity was non-destructively down-regulated under mild deficit, which protected the photosynthetic apparatus [49]. After rewatering, all three treatments gradually recovered again and reached full water supply levels or even became higher than the full water supply levels, indicating that the photochemical activity of the PSII reaction center gradually became stronger and had a compensatory effect after rewatering. However, in general, drought stress under different treatments reduced the opening of the PSII reaction center to different degrees and inhibited the efficient photosynthesis [11]. Therefore, in practice, the number of days of drought after the soil reaches the lower limit of soil water content should be minimized.

4.3. Effect of Drought–Rewatering on Non-Structural Carbohydrates of Cotton

In this study, the soluble sugar content of cotton leaves under short-term drought-rewatering conditions demonstrated an increasing trend during the drought episode and a decreasing trend after rewatering. The longer the drought duration, the greater the soluble sugar content. Many previous studies [50] have documented that carbon assimilation decreases while carbohydrate accumulates in plants exposed to drought. Similarly, this study showed that despite the notable decline in photosynthetic rate, carbohydrate concentration increased in leaves of cotton under drought deficit, being more pronounced with the increasing drought duration (Figure 7). Drought deficit induced increased soluble carbon metabolite concentrations in cotton leaves, which was possibly due to the accumulation of photosynthetic products in cotton exceeding the consumption [49]. The net photosynthetic rate of cotton leaves decreased by about 30% at the beginning of drought deficit in each treatment (Figure 5), but they were still able to photosynthesize normally and transform the byproducts into structural and non-structural carbohydrates, which indicated that the accumulation rate was much higher than that of consumption. In our study, photosynthesis was disrupted when the loss value of the transpiration rate and net photosynthetic rate of cotton leaves both reach about 90%; the soluble sugar content still increased, but the starch content decreased. One possible explanation is the reduced accumulation of photosynthetic assimilates caused by blocked photosynthesis; meanwhile, drought activated starch degradation and promoted the conversion of starch to soluble sugars, which could improve drought tolerance [50]. On the other hand, due to the plant metabolism’s short-term lag that results in low metabolic efficiency, soluble sugars stagnate and assemble for later distribution calls [51]. The starch content of each treatment increased first and then declined, which was consistent with the majority of studies, showing that plants acquire carbohydrates under drought stress [52]. In contrast, the studies by Choat found that the loss in carbohydrates in plants only occurred with increasing drought duration and stress levels to a certain level, which ultimately resulted in plant mortality [53]. Obviously, the starch content in all treatments showed an increasing trend, which indicated that short-term drought stress was not sufficient to cause “carbon starvation” in cotton in this study. After rewatering, the soluble sugar and starch concentrations of cotton leaves continuously increased, but the soluble sugar content and the starch content began to progressively decline after 2 h and 9 h after rewatering, respectively. The probable explanation can be that the photosynthesis recovered rapidly and the intrinsic water use efficiency increased significantly due to the compensation effect after rewatering, which, therefore, resulted in the rapid accumulation of photosynthetic products. When the compensation effect ended, the plant returned to normal physiological levels. It was shown that the starch content in the cotton leaves was relatively low and, thus, resulted in a relatively small effect on the overall nonstructural carbohydrate throughout the drought process. Similar results were obtained by [54] in a study of nonstructural carbohydrates in young trees, which could also be considered as young trees as annual woody plants.

5. Conclusions

The results showed that stem water potential, net photosynthetic rate, transpiration rate, and chlorophyll fluorescence parameters decreased with the increasing drought duration, while stem hydraulic conductance, intercellular carbon dioxide concentration, and intrinsic water use efficiency increased. The majority of measurements in D1 recovered to the full irrigation level in one day, including stem water potential, chlorophyll fluorescence parameters, leaf photosynthetic parameters, and stem hydraulic conductance. All measurements in D2 completely recovered after 1–3 days of rewatering, whereas those in D3 took 3–5 days. The leaf functional traits could not be fully recovered after rewatering in adequate and normal water conditions; the intensity of recovery was proportional to the drought duration. The soluble sugar content increased with increasing drought duration, which showed a decreasing trend after 5 days of rewatering. The starch content increased after rewatering and gradually decreased with rewatering duration, returning to the initial level within 5 days. The physiological status of the cotton in this circumstance as well as the time involved in rewatering were strongly influenced by the duration after the SWC was depleted to the lower limit of the field water holding capacity. When the value of the xylem percentage loss of hydraulic conductivity (PLC) in D2 (47%) is close to the critical value of hydraulic conductivity loss (P50), the hydraulic conductivity cannot be fully recovered, which affects the subsequent transportation of water, such that a drought episode can be sustained for 1 day in a long-term perspective when the SWC is depleted to the lower irrigation limit, and the normal physiological function of cotton can be maintained. Furthermore, the responses of plants can vary at various growth stages to drought–rewatering, so the influence of growth stages should be taken into account in future studies.

Author Contributions

Conceptualization, K.Z. and J.F.; Methodology, Z.L. (Zhenlin Lai), K.Z. and Z.L. (Zhenqi Liao); Validation, S.P.; Formal analysis, Z.L. (Zhenlin Lai); Investigation, K.Z., H.K., S.P. and Z.D.; Resources, J.F.; Data curation, Z.L. (Zhenlin Lai), K.Z., H.K. and Z.D.; Writing—original draft, Z.L. (Zhenlin Lai); Writing—review and editing, Z.L. (Zhenqi Liao); Visualization, S.P. and J.F.; Supervision, Z.B.; Funding acquisition, J.F. All authors have read and agreed to the published version of the manuscript.

Funding

This study was supported by the National Key Research and Development Program of China (No. 2017YFC0403303) and the Chinese Universities Scientific Fund (No. 2452020018).

Data Availability Statement

Data are contained within the article.

Conflicts of Interest

The authors declare no conflict of interest.

References

  1. Ciais, P.; Reichstein, M.; Viovy, N.; Granier, A.; Ogée, J.; Allard, V.; Aubinet, M.; Buchmann, N.; Bernhofer, C.; Carrara, A.; et al. Europe-Wide Reduction in Primary Productivity Caused by the Heat and Drought in 2003. Nature 2005, 437, 529–533. [Google Scholar] [CrossRef] [PubMed]
  2. AR5 Synthesis Report: Climate Change 2014; IPCC: Geneva, Switzerland, 2015.
  3. Hsiao, T.C. Plant Responses to Water Stress. Annu. Rev. Plant Physiol. 1973, 24, 519–570. [Google Scholar] [CrossRef]
  4. Gray, S.B.; Dermody, O.; Klein, S.P.; Locke, A.M.; McGrath, J.M.; Paul, R.E.; Rosenthal, D.M.; Ruiz-Vera, U.M.; Siebers, M.H.; Strellner, R.; et al. Intensifying Drought Eliminates the Expected Benefits of Elevated Carbon Dioxide for Soybean. Nat. Plants 2016, 2, 16132. [Google Scholar] [CrossRef] [PubMed]
  5. Chao, K.; Chao, J.C.Y. The Development of Cotton Textile Production in China, 1st ed.; Harvard University Asia Center: Cambridge, MA, USA, 1977; Volume 74, ISBN 978-0-674-20021-0. [Google Scholar]
  6. Klesse, S.; Babst, F.; Lienert, S.; Spahni, R.; Joos, F.; Bouriaud, O.; Carrer, M.; Di Filippo, A.; Poulter, B.; Trotsiuk, V.; et al. A Combined Tree Ring and Vegetation Model Assessment of European Forest Growth Sensitivity to Interannual Climate Variability. Glob. Biogeochem. Cycles 2018, 32, 1226–1240. [Google Scholar] [CrossRef]
  7. Khajeddin, S.; Matinkhah, S.; Jafari, Z. A Drought Resistance Index to Select Drought Resistant Plant Species Based on Leaf Water Potential Measurements. J. Arid Land 2019, 11, 623–635. [Google Scholar] [CrossRef]
  8. Reddy, Y.A.N.; Reddy, Y.N.P.; Ramya, V.; Suma, L.S.; Reddy, A.B.N.; Krishna, S.S. Chapter 8—Drought Adaptation: Approaches for Crop Improvement. In Millets and Pseudo Cereals; Singh, M., Sood, S., Eds.; Woodhead Publishing Series in Food Science, Technology and Nutrition; Woodhead Publishing: Sawston, UK, 2021; pp. 143–158. ISBN 978-0-12-820089-6. [Google Scholar]
  9. Sakoda, K.; Yamori, W.; Groszmann, M.; Evans, J.R. Stomatal, Mesophyll Conductance, and Biochemical Limitations to Photosynthesis during Induction. Plant Physiol. 2021, 185, 146–160. [Google Scholar] [CrossRef]
  10. Siddique, Z.; Jan, S.; Imadi, S.R.; Gul, A.; Ahmad, P. Drought Stress and Photosynthesis in Plants. In Water Stress and Crop Plants; John Wiley & Sons, Ltd.: Hoboken, NJ, USA, 2016; pp. 1–11. ISBN 978-1-119-05445-0. [Google Scholar]
  11. Zhang, Y.J.; Gao, H.; Li, Y.H.; Wang, L.; Kong, D.S.; Guo, Y.Y.; Yan, F.; Wang, Y.W.; Lu, K.; Tian, J.W.; et al. Effect of Water Stress on Photosynthesis, Chlorophyll Fluorescence Parameters and Water Use Efficiency of Common Reed in the Hexi Corridor. Russ. J. Plant Physiol. 2019, 66, 556–563. [Google Scholar] [CrossRef]
  12. Chen, Z.; Liu, Z.; Han, S.; Jiang, H.; Xu, S.; Zhao, H.; Ren, S. Using the Diurnal Variation Characteristics of Effective Quantum Yield of PSII Photochemistry for Drought Stress Detection in Maize. Ecol. Indic. 2022, 138, 108842. [Google Scholar] [CrossRef]
  13. Li, S.; Tan, T.; Fan, Y.; Raza, M.A.; Wang, Z.; Wang, B.; Zhang, J.; Tan, X.; Chen, P.; Shafiq, I.; et al. Responses of Leaf Stomatal and Mesophyll Conductance to Abiotic Stress Factors. J. Integr. Agric. 2022, 21, 2787–2804. [Google Scholar] [CrossRef]
  14. Snider, J.L.; Thangthong, N.; Pilon, C.; Virk, G.; Tishchenko, V. OJIP-Fluorescence Parameters as Rapid Indicators of Cotton (Gossypium Hirsutum L.) Seedling Vigor under Contrasting Growth Temperature Regimes. Plant Physiol. Biochem. 2018, 132, 249–257. [Google Scholar] [CrossRef]
  15. McDowell, N.; Pockman, W.T.; Allen, C.D.; Breshears, D.D.; Cobb, N.; Kolb, T.; Plaut, J.; Sperry, J.; West, A.; Williams, D.G.; et al. Mechanisms of Plant Survival and Mortality during Drought: Why Do Some Plants Survive While Others Succumb to Drought? New Phytol. 2008, 178, 719–739. [Google Scholar] [CrossRef] [PubMed]
  16. Nardini, A.; Battistuzzo, M.; Savi, T. Shoot Desiccation and Hydraulic Failure in Temperate Woody Angiosperms during an Extreme Summer Drought. New Phytol. 2013, 200, 322–329. [Google Scholar] [CrossRef] [PubMed]
  17. Adams, H.D.; Zeppel, M.J.B.; Anderegg, W.R.L.; Hartmann, H.; Landhäusser, S.M.; Tissue, D.T.; Huxman, T.E.; Hudson, P.J.; Franz, T.E.; Allen, C.D.; et al. A Multi-Species Synthesis of Physiological Mechanisms in Drought-Induced Tree Mortality. Nat. Ecol. Evol. 2017, 1, 1285–1291. [Google Scholar] [CrossRef] [PubMed]
  18. Tomasella, M.; Casolo, V.; Natale, S.; Petruzzellis, F.; Kofler, W.; Beikircher, B.; Mayr, S.; Nardini, A. Shade-Induced Reduction of Stem Nonstructural Carbohydrates Increases Xylem Vulnerability to Embolism and Impedes Hydraulic Recovery in Populus Nigra. New Phytol. 2021, 231, 108–121. [Google Scholar] [CrossRef] [PubMed]
  19. Barros, F.D.V.; Bittencourt, P.R.L.; Brum, M.; Restrepo-Coupe, N.; Pereira, L.; Teodoro, G.S.; Saleska, S.R.; Borma, L.S.; Christoffersen, B.O.; Penha, D.; et al. Hydraulic Traits Explain Differential Responses of Amazonian Forests to the 2015 El Niño-Induced Drought. New Phytol. 2019, 223, 1253–1266. [Google Scholar] [CrossRef] [PubMed]
  20. Ilyas, M.; Nisar, M.; Khan, N.; Hazrat, A.; Khan, A.H.; Hayat, K.; Fahad, S.; Khan, A.; Ullah, A. Drought Tolerance Strategies in Plants: A Mechanistic Approach. J. Plant Growth Regul. 2021, 40, 926–944. [Google Scholar] [CrossRef]
  21. Sakshaug, E.; Bricaud, A.; Dandonneau, Y.; Falkowski, P.G.; Kiefer, D.A.; Legendre, L.; Morel, A.; Parslow, J.; Takahashi, M. Parameters of Photosynthesis: Definitions, Theory and Interpretation of Results. J. Plankton Res. 1997, 19, 1637–1670. [Google Scholar] [CrossRef]
  22. Liao, Z.; Zhang, K.; Fan, J.; Li, Z.; Zhang, F.; Xiukang, W.; Wang, H.; Minghui, C.; Zou, Y. Ridge-Furrow Plastic Mulching and Dense Planting with Reduced Nitrogen Improve Soil Hydrothermal Conditions, Rainfed Soybean Yield and Economic Return in a Semi-Humid Drought-Prone Region of China. Soil Tillage Res. 2022, 217, 105291. [Google Scholar] [CrossRef]
  23. DuBois, M.; Gilles, K.A.; Hamilton, J.K.; Rebers, P.A.; Smith, F. Colorimetric Method for Determination of Sugars and Related Substances. Anal. Chem. 1956, 28, 350–356. [Google Scholar] [CrossRef]
  24. Sperry, J.S.; Tyree, M.T. Water-Stress-Induced Xylem Embolism in Three Species of Conifers. Plant Cell Environ. 1990, 13, 427–436. [Google Scholar] [CrossRef]
  25. Domec, J.-C.; Gartner, B.L. Cavitation and Water Storage Capacity in Bole Xylem Segments of Mature and Young Douglas-Fir Trees. Trees 2001, 15, 204–214. [Google Scholar] [CrossRef]
  26. Hayat, F.; Ahmed, M.A.; Zarebanadkouki, M.; Javaux, M.; Cai, G.; Carminati, A. Transpiration Reduction in Maize (Zea mays L) in Response to Soil Drying. Front. Plant Sci. 2020, 10, 1695. [Google Scholar] [CrossRef]
  27. Wang, Y.; Wang, Y.; Tang, Y.; Zhu, X.-G. Stomata Conductance as a Goalkeeper for Increased Photosynthetic Efficiency. Curr. Opin. Plant Biol. 2022, 70, 102310. [Google Scholar] [CrossRef]
  28. Hochberg, U.; Windt, C.W.; Ponomarenko, A.; Zhang, Y.-J.; Gersony, J.; Rockwell, F.E.; Holbrook, N.M. Stomatal Closure, Basal Leaf Embolism, and Shedding Protect the Hydraulic Integrity of Grape Stems. Plant Physiol. 2017, 174, 764–775. [Google Scholar] [CrossRef]
  29. Liu, H.; Ye, Q.; Gleason, S.M.; He, P.; Yin, D. Weak Tradeoff between Xylem Hydraulic Efficiency and Safety: Climatic Seasonality Matters. New Phytol. 2021, 229, 1440–1452. [Google Scholar] [CrossRef]
  30. Creek, D.; Lamarque, L.J.; Torres-Ruiz, J.M.; Parise, C.; Burlett, R.; Tissue, D.T.; Delzon, S. Xylem Embolism in Leaves Does Not Occur with Open Stomata: Evidence from Direct Observations Using the Optical Visualization Technique. J. Exp. Bot. 2020, 71, 1151–1159. [Google Scholar] [CrossRef]
  31. Brodribb, T.J.; Holbrook, N.M. Stomatal Closure during Leaf Dehydration, Correlation with Other Leaf Physiological Traits. Plant Physiol. 2003, 132, 2166–2173. [Google Scholar] [CrossRef]
  32. Hacke, U.G.; Sperry, J.S. Limits to Xylem Refilling under Negative Pressure in Laurus Nobilis and Acer Negundo. Plant Cell Environ. 2003, 26, 303–311. [Google Scholar] [CrossRef]
  33. Cardoso, A.A.; Batz, T.A.; McAdam, S.A.M. Xylem Embolism Resistance Determines Leaf Mortality during Drought in Persea Americana 1 [OPEN]. Plant Physiol. 2020, 182, 547–554. [Google Scholar] [CrossRef] [PubMed]
  34. de Campos Siega, T.; Bertoldo, E.; Vismara, L.; Nicareta, C.; Junior, A. Cavitation and Embolism in Plants: Literature Review. Aust. J. Basic Appl. Sci. 2018, 12, 1. [Google Scholar] [CrossRef]
  35. Ullah, A.; Sun, H.; Yang, X.; Zhang, X. Drought Coping Strategies in Cotton: Increased Crop per Drop. Plant Biotechnol. J. 2017, 15, 271–284. [Google Scholar] [CrossRef] [PubMed]
  36. Skelton, R.P.; Dawson, T.E.; Thompson, S.E.; Shen, Y.; Weitz, A.P.; Ackerly, D. Low Vulnerability to Xylem Embolism in Leaves and Stems of North American Oaks. Plant Physiol. 2018, 177, 1066–1077. [Google Scholar] [CrossRef] [PubMed]
  37. de Souza Lorenzoni-Paschoa, L.; Amaral, G.C.; Pezzopane, J.E.M.; Toledo, J.V.; de Abreu, K.M.P.; Xavier, T.M.T.; Cuzzuol, G.R.F. Climate Change and the Ecophysiology of Bertholletia Excelsa Seedlings. Plant Growth Regul. 2022, 98, 155–165. [Google Scholar] [CrossRef]
  38. Flexas, J.; Bota, J.; Escalona, J.M.; Sampol, B.; Medrano, H. Effects of Drought on Photosynthesis in Grapevines under Field Conditions: An Evaluation of Stomatal and Mesophyll Limitations. Funct. Plant Biol. 2002, 29, 461–471. [Google Scholar] [CrossRef]
  39. Aroca, A.; Gotor, C.; Romero, L.C. Hydrogen Sulfide Signaling in Plants: Emerging Roles of Protein Persulfidation. Front. Plant Sci. 2018, 9, 1369. [Google Scholar] [CrossRef] [PubMed]
  40. Divo, M.; Cote, C.; de Torres, J.P.; Casanova, C.; Marin, J.M.; Pinto-Plata, V.; Zulueta, J.; Cabrera, C.; Zagaceta, J.; Hunninghake, G.; et al. Comorbidities and Risk of Mortality in Patients with Chronic Obstructive Pulmonary Disease. Am. J. Respir. Crit. Care Med. 2012, 186, 155–161. [Google Scholar] [CrossRef] [PubMed]
  41. Hetherington, A.M.; Woodward, F.I. The Role of Stomata in Sensing and Driving Environmental Change. Nature 2003, 424, 901–908. [Google Scholar] [CrossRef] [PubMed]
  42. Hasan, M.M.; Gong, L.; Nie, Z.-F.; Li, F.-P.; Ahammed, G.J.; Fang, X.-W. ABA-Induced Stomatal Movements in Vascular Plants during Dehydration and Rehydration. Environ. Exp. Bot. 2021, 186, 104436. [Google Scholar] [CrossRef]
  43. Lovisolo, C.; Perrone, I.; Carra, A.; Ferrandino, A.; Flexas, J.; Medrano, H.; Schubert, A. Drought-Induced Changes in Development and Function of Grapevine (Vitis spp.) Organs and in Their Hydraulic and Non-Hydraulic Interactions at the Whole-Plant Level: A Physiological and Molecular Update. Funct. Plant Biol. 2010, 37, 98–116. [Google Scholar] [CrossRef]
  44. Sun, Y.; Wang, C.; Chen, H.Y.H.; Ruan, H. Response of Plants to Water Stress: A Meta-Analysis. Front. Plant Sci. 2020, 11, 978. [Google Scholar] [CrossRef]
  45. Zia, R.; Nawaz, M.S.; Siddique, M.J.; Hakim, S.; Imran, A. Plant Survival under Drought Stress: Implications, Adaptive Responses, and Integrated Rhizosphere Management Strategy for Stress Mitigation. Microbiol. Res. 2021, 242, 126626. [Google Scholar] [CrossRef]
  46. Porcar-Castell, A.; Tyystjärvi, E.; Atherton, J.; van der Tol, C.; Flexas, J.; Pfündel, E.E.; Moreno, J.; Frankenberg, C.; Berry, J.A. Linking Chlorophyll a Fluorescence to Photosynthesis for Remote Sensing Applications: Mechanisms and Challenges. J. Exp. Bot. 2014, 65, 4065–4095. [Google Scholar] [CrossRef] [PubMed]
  47. Li, Q.-M.; Liu, B.-B.; Wu, Y.; Zou, Z.-R. Interactive Effects of Drought Stresses and Elevated CO2 Concentration on Photochemistry Efficiency of Cucumber Seedlings. J. Integr. Plant Biol. 2008, 50, 1307–1317. [Google Scholar] [CrossRef] [PubMed]
  48. Cetner, M.D.; Kalaji, H.M.; Goltsev, V.; Aleksandrov, V.; Kowalczyk, K.; Borucki, W.; Jajoo, A. Effects of Nitrogen-Deficiency on Efficiency of Light-Harvesting Apparatus in Radish. Plant Physiol. Biochem. 2017, 119, 81–92. [Google Scholar] [CrossRef]
  49. Li, J.; Cang, Z.; Jiao, F.; Bai, X.; Zhang, D.; Zhai, R. Influence of Drought Stress on Photosynthetic Characteristics and Protective Enzymes of Potato at Seedling Stage. J. Saudi Soc. Agric. Sci. 2017, 16, 82–88. [Google Scholar] [CrossRef]
  50. Du, Y.; Zhao, Q.; Chen, L.; Yao, X.; Zhang, W.; Zhang, B.; Xie, F. Effect of Drought Stress on Sugar Metabolism in Leaves and Roots of Soybean Seedlings. Plant Physiol. Biochem. 2020, 146, 1–12. [Google Scholar] [CrossRef]
  51. Barber, T.M.; Hanson, P.; Kabisch, S.; Pfeiffer, A.F.H.; Weickert, M.O. The Low-Carbohydrate Diet: Short-Term Metabolic Efficacy Versus Longer-Term Limitations. Nutrients 2021, 13, 1187. [Google Scholar] [CrossRef]
  52. Irène, H.; Florent, P.; Ronan, S.; Maria, P.; Gaëlle, R.; Myriam, D.; Angélique, C.; Marjorie, P.; Marie, B.; Mark, S.; et al. Arabidopsis Plants Acclimate to Water Deficit at Low Cost through Changes of Carbon Usage: An Integrated Perspective Using Growth, Metabolite, Enzyme, and Gene Expression Analysis. Plant Phy. 2010, 154, 357–372. [Google Scholar] [CrossRef]
  53. Choat, B.; Brodribb, T.J.; Brodersen, C.R.; Duursma, R.A.; López, R.; Medlyn, B.E. Triggers of Tree Mortality under Drought. Nature 2018, 558, 531–539. [Google Scholar] [CrossRef]
  54. Sulpice, R.; Pyl, E.-T.; Ishihara, H.; Trenkamp, S.; Steinfath, M.; Witucka-Wall, H.; Gibon, Y.; Usadel, B.; Poree, F.; Piques, M.C.; et al. Starch as a Major Integrator in the Regulation of Plant Growth. Proc. Natl. Acad. Sci. USA 2009, 106, 10348–10353. [Google Scholar] [CrossRef]
Figure 1. The photos of cotton experiment.
Agronomy 14 00071 g001
Figure 2. Changes in soil water content at different soil depths during the drought process.
Agronomy 14 00071 g002
Figure 3. Changes in stem and leaf water potentials of cotton during drought and rewatering processes. Figure (a) shows the changes in stem and leaf water potentials of cotton during the defict time; Figure (b) shows the changes in stem water potentials of cotton among different treatments in the predawn after rewater time; Figure (c) shows the changes in leaf water potentials among different treatments of cotton in the predawn after rewater time. Notes: D1: the treatment one day after it reached 40% ± 5% of soil water holding capacity; D2: the treatment two days after it reached 40% ± 5% of soil water holding capacity; D3: the treatment three days after it reached 40% ± 5% of soil water holding capacity. φmd stem: stem water potential at midnoon; φpd leaf: leaf water potential at pre-dawn; φmd leaf: leaf water potential at midnoon; φpd stem: stem water potential at pre-dawn. ns: not significant, (p > 0.05); *, Significant at p < 0.05; **, Significant at p < 0.01; ***, Significant at p < 0.001.
Agronomy 14 00071 g003
Figure 4. Changes in the PLC during (a) drought and (b) rewatering processes. Notes: D1: the treatment one day after it reached 40% ± 5% of soil water holding capacity; D2: the treatment two days after it reached 40% ± 5% of soil water holding capacity; D3: the treatment three days after it reached 40% ± 5% of soil water holding capacity. Bars are the means ± standard deviation (n = 3).
Agronomy 14 00071 g004
Figure 5. Variation of gas exchange parameters of leaves in (a) D1, (b) D2, and (c) D3 during drought-rewatering process. Notes: D1: the treatment one day after it reached 40% ± 5% of soil water holding capacity; D2: the treatment two days after it reached 40% ± 5% of soil water holding capacity; D3: the treatment three days after it reached 40% ± 5% of soil water holding capacity. E: Transpiration rate, A: net photosynthetic rate, Ci: intercellular CO2 concentration; Gs: stomatal conductance. Bars are the means ± standard deviation (n = 3).
Agronomy 14 00071 g005aAgronomy 14 00071 g005b
Figure 6. Changes in (a) light energy conversion efficiency and (b) steady-state fluorescence decay rate during drought and rewatering in the process of depletion and recovery. Notes: D1: the treatment one day after it reached 40% ± 5% of soil water holding capacity; D2: the treatment two days after it reached 40% ± 5% of soil water holding capacity; D3: the treatment three days after it reached 40% ± 5% of soil water holding capacity. Bars are the means ± standard deviation (n = 3).
Agronomy 14 00071 g006
Figure 7. Response of (a) starch content and (b) soluble sugar content in leaves to drought and rewatering. Notes: D1: the treatment one day after it reached 40% ± 5% of soil water holding capacity; D2: the treatment two days after it reached 40% ± 5% of soil water holding capacity; D3: the treatment three days after it reached 40% ± 5% of soil water holding capacity. Bars are the means ± standard deviation (n = 3).
Agronomy 14 00071 g007
Figure 8. Xylem vulnerability curves of the stems. Percentage loss of conductivity (PLC) is calculated based on individual estimated Kmax by Weibull function. The reference line corresponds to 50% PLC.
Agronomy 14 00071 g008
Figure 9. Correlation coefficient matrix of relationship among various physiological characteristics (Rfd-Lss: steady state fluorescence decay rate, φpd-leaf: leaf water potential at pre-dawn, SWC: soil water content, An: net photosynthetic rate, E: transpiration rate, Gs: stomatal conductance, φpd-stem: stem water potential at predawn, QY-max: maximum quantum yield of Photosystem II photochemistry, Ci: intercellular CO2 concentration, PLC: the loss of hydraulic conductivity, SS: soluble sugar content; WUEi: intrinsic water-use efficiency, SC: starch content).
Agronomy 14 00071 g009
Disclaimer/Publisher’s Note: The statements, opinions and data contained in all publications are solely those of the individual author(s) and contributor(s) and not of MDPI and/or the editor(s). MDPI and/or the editor(s) disclaim responsibility for any injury to people or property resulting from any ideas, methods, instructions or products referred to in the content.

