Article

The Effects of Biochar-Based Organic Fertilizer and Mineral Fertilizer on Soil Quality, Beet Yield, and Sugar Yield

College of Agricultural, Northeast Agricultural University, Harbin 150030, China
*
Authors to whom correspondence should be addressed.
These authors contributed equally to this work.
Agronomy 2023, 13(9), 2423; https://doi.org/10.3390/agronomy13092423
Submission received: 15 August 2023 / Revised: 16 September 2023 / Accepted: 18 September 2023 / Published: 20 September 2023

Abstract

:
The addition of biochar-based organic fertilizer (BOF) can improve sugar beet yield, but its effects on the growth of sugar beet and on soil quality at different densities remain unclear. Six treatments, comprising two densities D1 and D2 (80,000 and 90,000 plant ha−1) and three application rates B1, B2, and B3 (2.75, 3.25, and 3.75 t ha−1) of BOFs + mineral fertilizer, respectively, are investigated in this research. The mineral fertilizers are typically used to supplement the total N, P2O5, and K2O deficiencies. The BOFs were used in the soil before sowing, and the mineral fertilizer was added to the soil after the first pair of true leaves was grown. At 160 days after sowing (DAS), the root-to-shoot ratio under the D2B2 treatment was significantly higher than that under the other treatments. The effect of density on the photosynthesis rate of sugar beet was not significant. The BOF application amount and density exerted interaction effects on soil physicochemical properties and the activities of different soil enzymes affecting each other. Both the D2B2 and D2B3 treatments reduced the content of NO3-N in the 40–60 cm soil layer. Combined 90,000 plants ha–1 with 3.25 t ha−1 BOFs can increase the soil nutrient content of the 0–60 cm soil layer, improve the rhizosphere soil environment, promote the uniform distribution of dry matter, and increase sugar production.

1. Introduction

Currently, North-East China is one of the main sugar-beet-producing regions in the country [1]. The selection of an appropriate number of plants per unit area is one of the important factors that lead to high yields [2,3]. In addition, increasing the planting density also increases the total dry matter accumulation of sugar beet [4]. According to a study, 90,000–110,000 plants ha–1 is the appropriate planting density for sugar beet to achieve suitable growth levels. In northern China, it is considered that a density of about 90,000 plants ha−1 is more appropriate [5,6], and a higher planting density might lead to shade between leaves, insufficient light for individual plants, decelerated leaf growth, and reduced dry matter accumulation at the roots [2,3,7].
Sugar beet plants are highly sensitive to fertilizer application during growth [8]. Especially in high-density planting, to achieve higher yields, the usual practice is to increase the amount of fertilizer. Application of inadequate amounts of inorganic nitrogen fertilizer might lead to accelerated leaf aging [9], while excessive application of inorganic nitrogen fertilizer may cause the leaves to continue growing vigorously even in the later stages of growth, reduce the root yield and sugar purity, and lead to nitrate contamination in groundwater [10,11]. In order to reduce the use of inorganic fertilizers to protect the environment, the use of organic fertilizers is emerging as a desirable option. Organic fertilizers offer the advantages of improving the physical and chemical properties of soil and increasing the soil’s organic matter content [12]. Biochar provides a large specific surface area, porous structure, and abundant surface functional groups [13]. These properties allow for the increase in the number of soil microorganisms and the improvement of soil enzyme activities [14].
Soil enzymes catalyze the decomposition of various substances present in the soil, thereby transforming the soil and promoting the soil nutrient cycle, leading to a better concentration of nutrients needed for plant growth [15]. Soil enzyme activity can also be used to explain some information about soil quality and microorganisms, and the high activity of soil β-glucosidase enzyme can be used to indicate the increase in the number of monosaccharide microorganisms in shallow soil. The application of organic fertilizer can increase soil urease activity, indicating that soil has better organic matter and nitrogen cycling capacity [16,17]. In addition, biochar affects soil chemistry. Biochar usually alters the soil pH, thereby improving nutrient dissolution and enhancing soil fertility, which ultimately contributes to increasing crop yields [18]. However, organic fertilizers are gradual-release fertilizers, due to which the nutrient requirements of sugar beets are often not met immediately [19]. Consequently, it becomes important to use organic and inorganic fertilizers in combination. Studies have concluded that the combined use of mineral fertilizers and organic fertilizers significantly improves soil properties, such as soil pH and organic matter content, compared to the application of chemical fertilizers alone, while also reducing soil bulk density and increasing the soil’s ability to store water [20,21]. Certain other studies concluded that the combination of organic fertilizer with N, P, K fertilizers greatly increased soil fertility and soil enzyme activities [22,23].
Our study in 2018 confirmed that, compared with fertilizer alone, the combination of fertilizer and biochar-based organic fertilizer can enhance the nitrogen assimilation ability of beet, delay the aging of beet, and increase the yield of beet [24]. To our knowledge, there is a lack of research on the effects of different densities and application of biochar-based organic fertilizers on the soil in beets and how soil changes feed back to the beets. In this paper, we use the same three BOF application rates as in the previous study in addition to two different densities. The main purpose of this investigation is to determine whether it is possible to apply different amounts of biochar-based fertilizer based on chemical fertilizer at low density and high density in order to achieve the following: (a) improve the physical and chemical properties of soil and improving soil quality; (b) enhance soil enzyme activity and improve the soil environment of rhizosphere soil; and (c) improve the photosynthetic capacity of sugar beets and promote a more rational distribution of dry matter above and below ground, thereby increasing sugar production. Our research also provides a theoretical basis for high yield and high sugar production of sugar beet.

2. Materials and Methods

2.1. Experimental Design and Material

The experiments took place in 2019 and 2020 at the Xiang Yang experimental station. During the study period, the average temperature in the beet growth period was 19–20 °C, with a frost-free period of nearly 170 days each year and total rainfall of over 550 mm during the sugar beet growth period. The KWS Company (KWS SAAT AG) (Einbaek, Germany) provided the seeds ‘KWS1176’. The BOFs were obtained from the Run Nong Technology Company (Wuchang, Harbin, China). The crop straw was cracked at a sustained high temperature of 450 °C for 3 h then fermented with solid livestock manure for 6 days to produce BOF. The pH, cation exchange capacity, and specific surface area of biochar were 9.76, 62.32 cmol kg −1, and 89.7 m2 g−1, respectively. The data of the test site, seed source, BOFs, and chernozem soil nutrient contents were provided by Chen et al. [24].
Each treatment received five replicates in a randomized block design. We conducted 96% S-Metolachlor enclosed weeding before sowing. The experimental site comprised 30 plots (5 replicates × 6 treatments), and each plot had a size of 41.6 m2 (length = 8 m and width = 5.2 m). The row spacing was 65 cm, and the sowing method was acupoint sowing. The two planting densities employed, referred to as D1 and D2, were 80 and 90 thousand plants ha−1, respectively. The three biochar-based organic fertilizer application rates denoted as B1, B2, and B3, were 2.75, 3.25, and 3.75 t ha−1, respectively. The mineral fertilizer was discovered to be employed to keep the levels of total potassium, phosphorus, and nitrogen consistent. BOFs were applied as the base fertilizer before seeding, and mineral fertilizer was applied after the first line of true leaves was fully developed.
On 26 April 2019 and 22 April 2020, seeds were sowed. Sampling was performed at 60, 85, 110, 135, and 160 days after sowing (DAS). Table 1 lists the rates of fertilizer application for each treatment.

2.2. Determination of the Properties of Soil and Biochar

The N and C contents in both soil and the BOF were analyzed via an elemental analyzer (EA–3000, Euro Vector, Redavalle, Italy). The available phosphorus in the soil was extracted using 0.5 M NaHCO3 (TianDa Chemical Reagent Co., Ltd., Tianjin, China) (pH 8.5) and quantified at 700 nm [25]. The methods to extract and quantify the soil-available potassium were introduced by Welsh et al. [26]. A pH meter and conductivity meter were used, respectively, for the soil pH levels and soil conductivity (pH–3110, WTW, Munich, Germany, DDSJ-308F, INESA, Shanghai, China). Soil carbon flux was determined using a portable soil respiratory system (Soilbox-343, Eco Tech, Beijing, China). The measurements were conducted at 8:30–10:30 a.m., and each continuous measurement was performed for 15 min, with automatic recording of the output after every 30 s. The soil moisture content was determined using a portable moisture analyzer (SK-100, Sunko, Kanagawa, Japan). The P and K content of the biochar were determined according to Khan et al. [27].

2.3. Sugar Beet Sampling and Measurement

The measurement of the chlorophyll fluorescence parameters in the leaves for each treatment occurred at 60 (seedling emergence), 85 (foliage luxuriating), 110 (root enlargement), 135 (sugar accumulation), and 160 (harvest time) DAS, respectively. With four plants per plot, twelve randomly chosen sugar beet plants from different treatments were rinsed in distilled water. Then, the mixed plant samples were taken back to the lab in a cryogenic freezer and then divided into two groups: one group of these identified plants was stored at −80 °C until use in the subsequent physiological assays, and the other plant samples were dried and stored at room temperature.

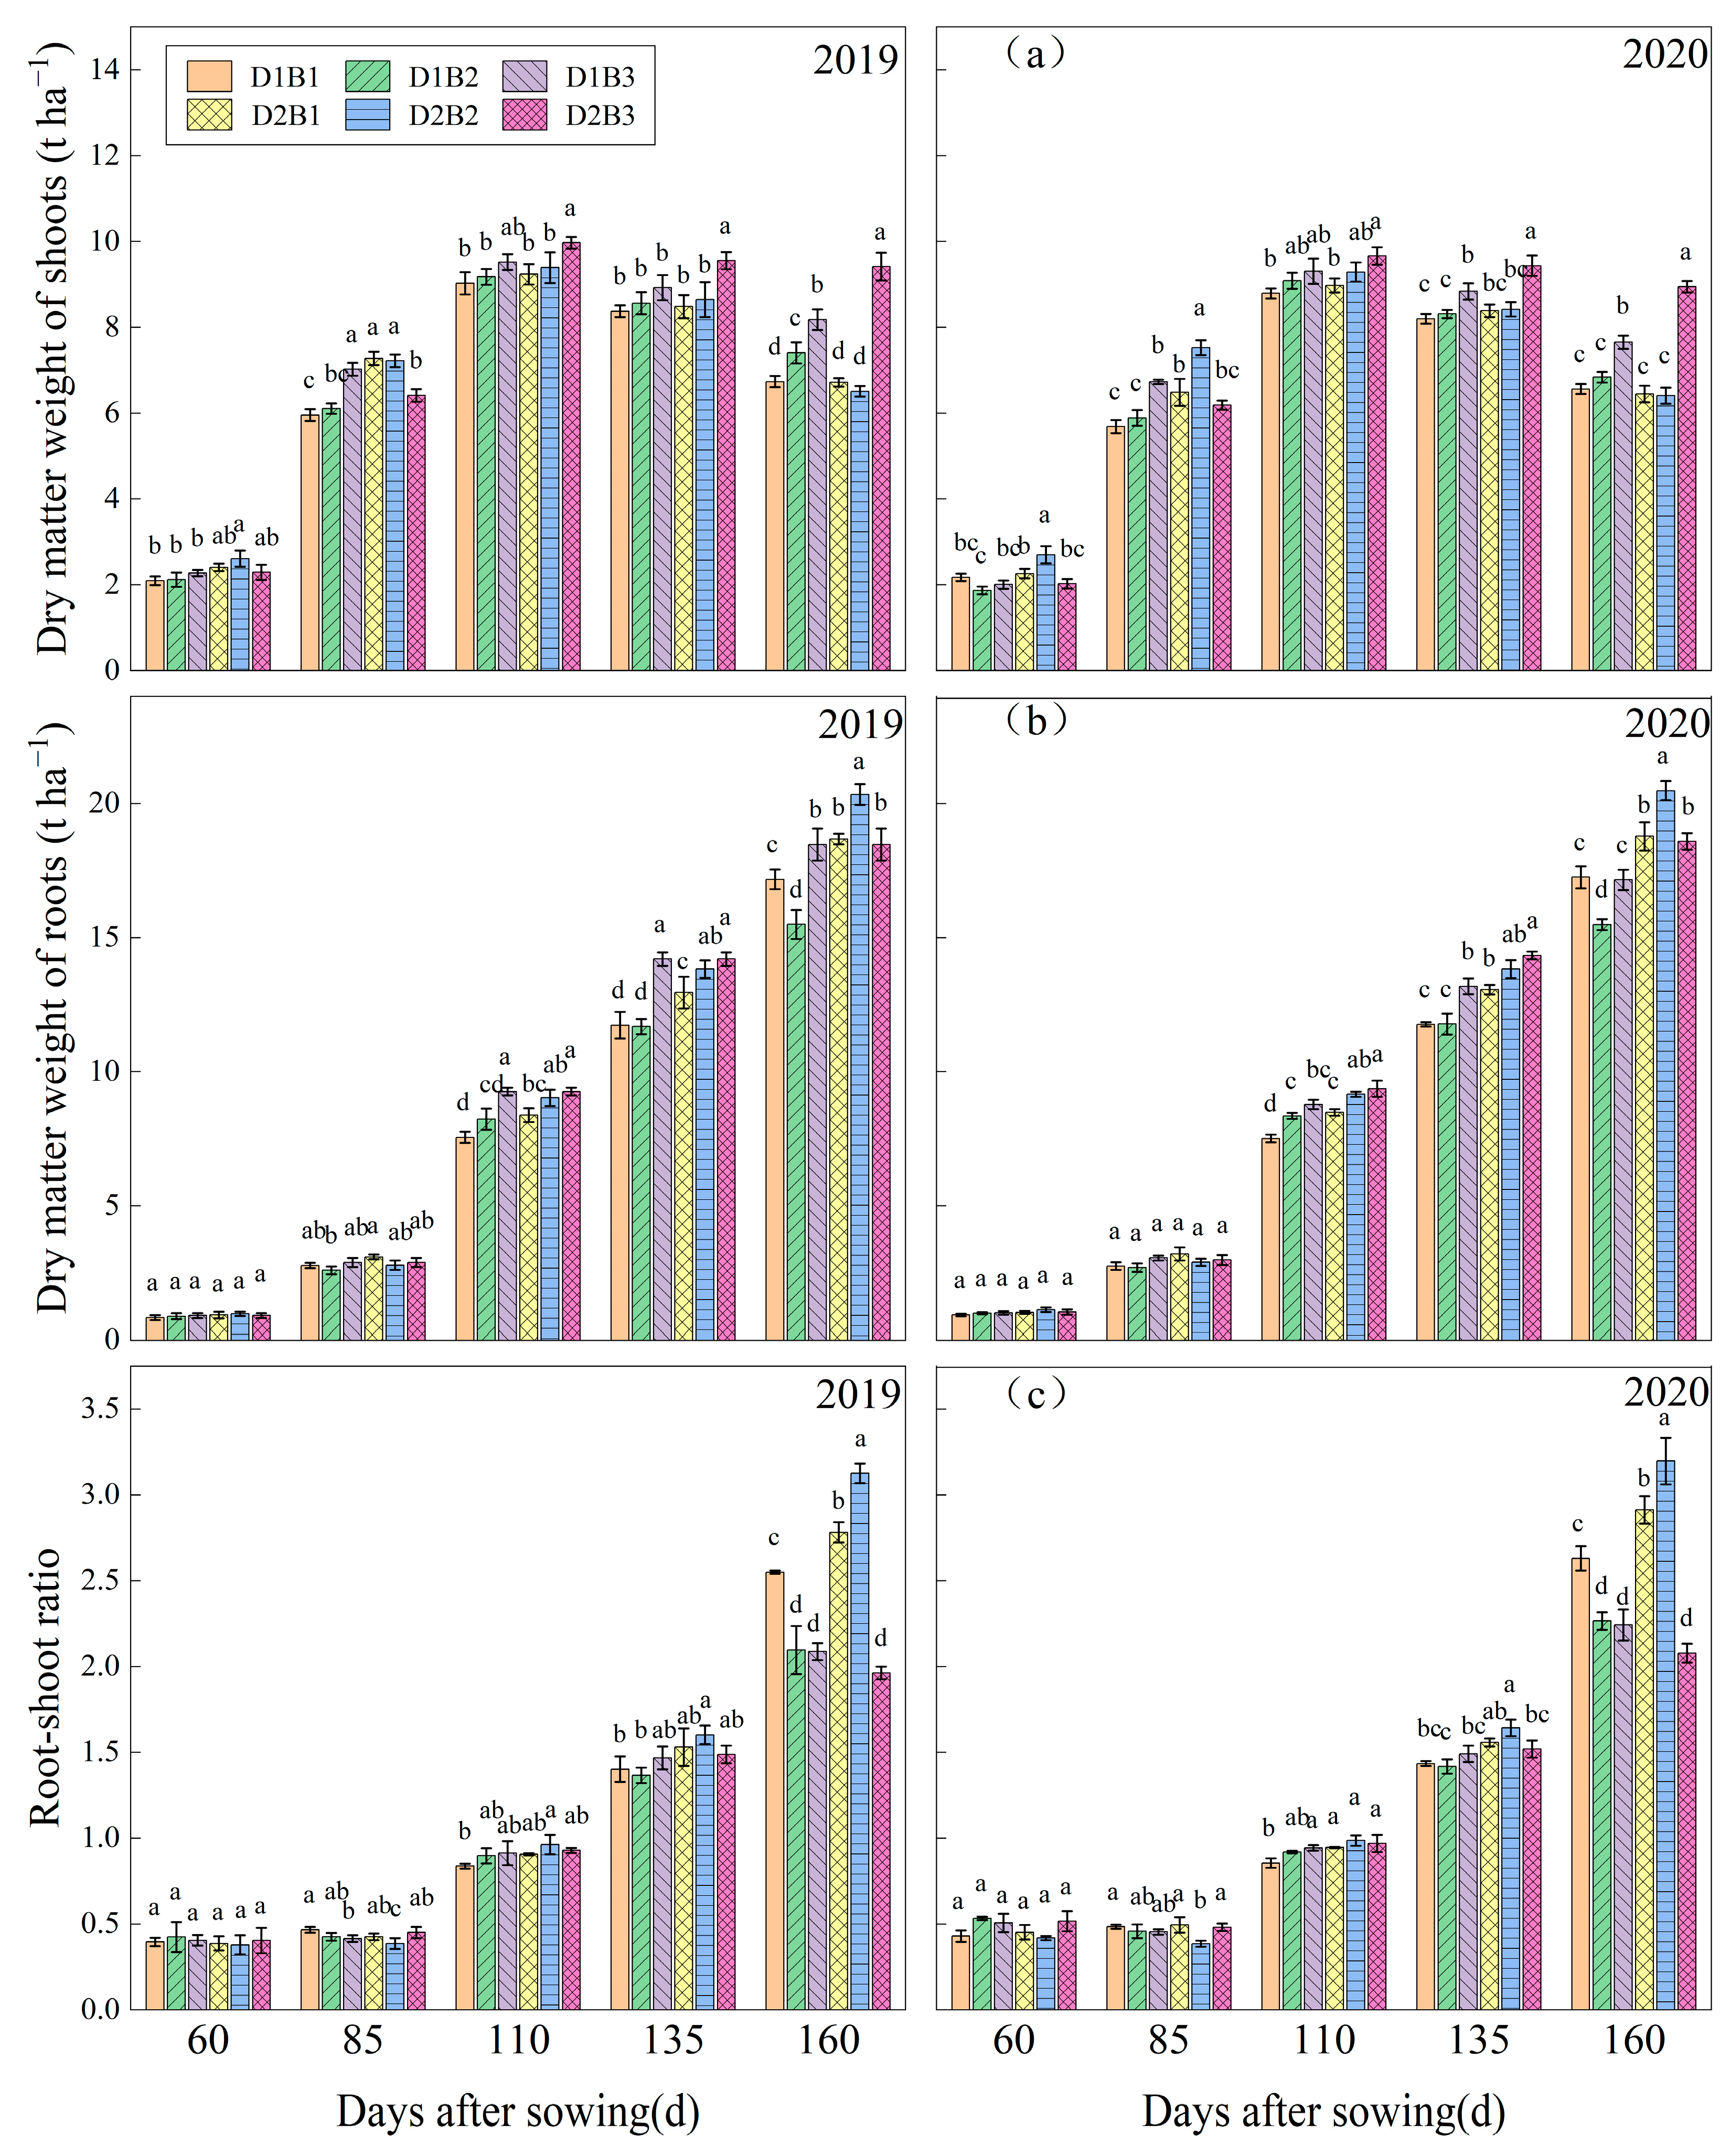
2.4. Dry Matter Accumulation

The method used to prepare the plants for the determination of dry matter accumulation was introduced by Zhang et al. [28]. Afterward, the following Equation (1) was used for calculations.
Root - to - shoot   ratio = Root dry matter shoot dry matter

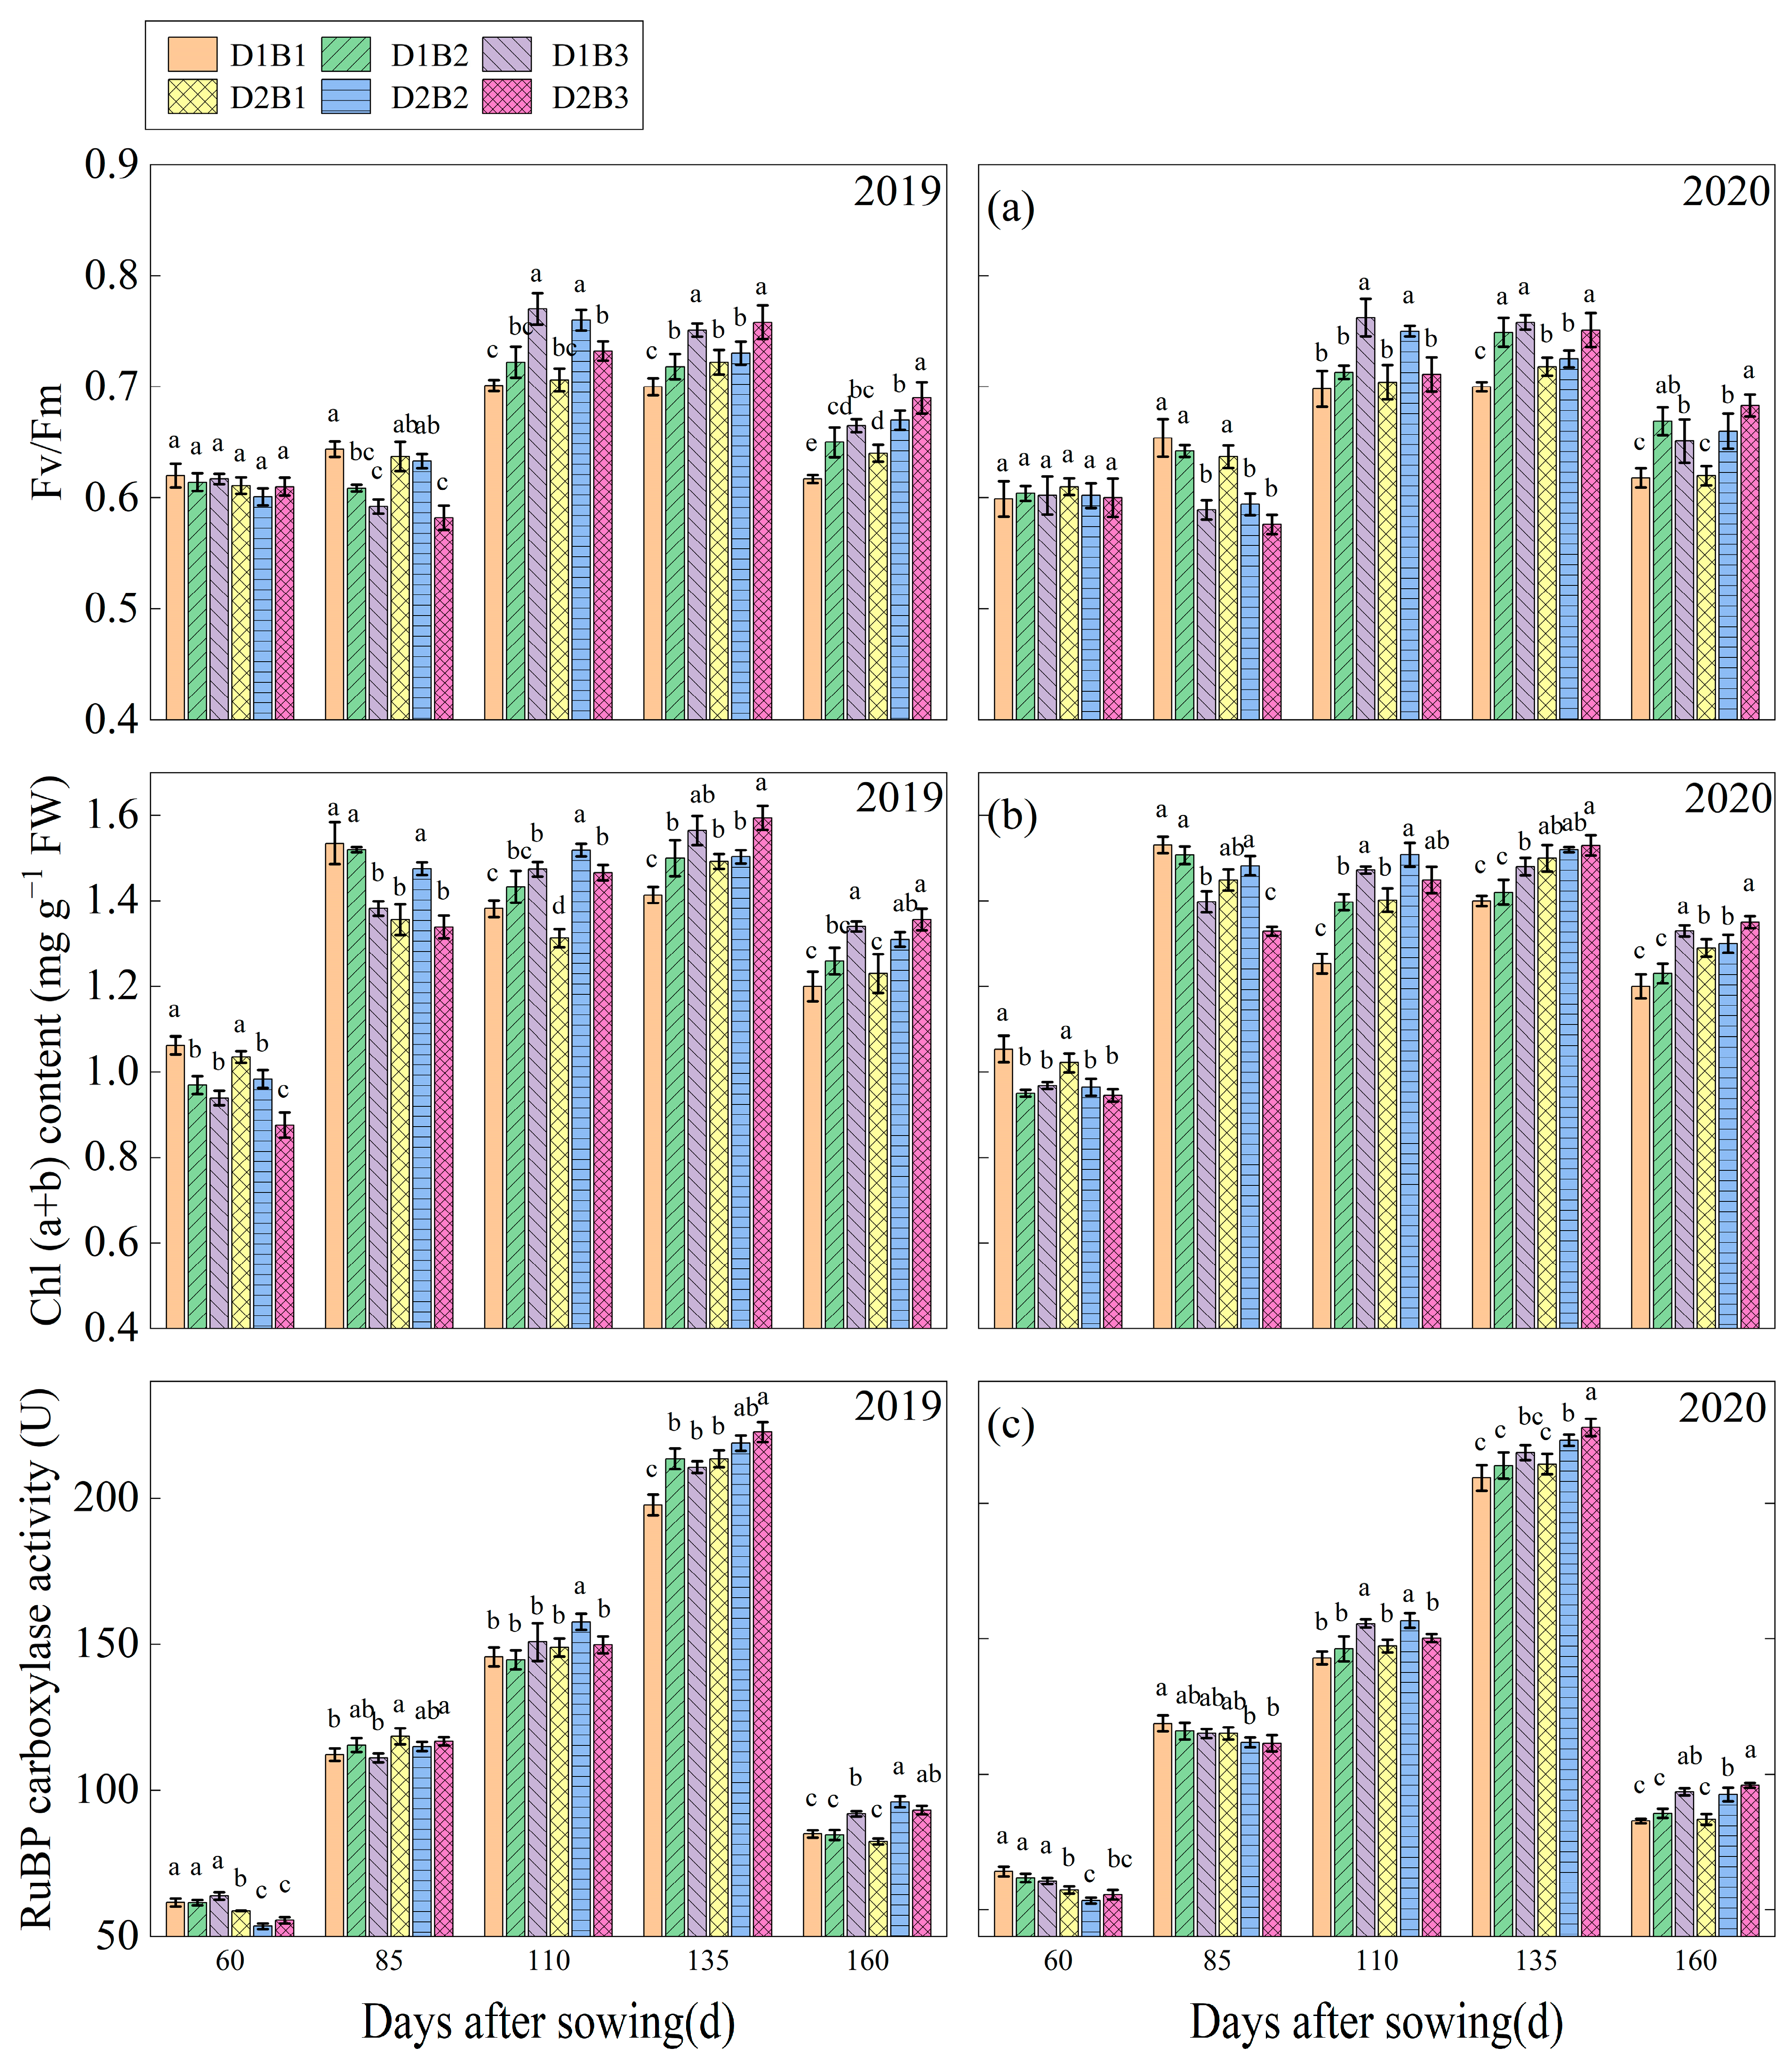
2.5. Chlorophyll Fluorescence Parameters

The determination of the chlorophyll fluorescence system was carried out between 9:00 and 10:00 a.m. on a sunny day, and the penultimate pair of true leaves was selected. Using a pulse modulation (PAM-2500, WALZ, Bavaria, Germany) portable chlorophyll fluorescence system, the maximum photosynthetic rate (Fv/Fm) was determined. After 20 min in complete darkness, measurements on leaves were performed in red light. The lighting parameters refer to Zhang et al. [21].

2.6. The Contents of Photosynthetic Pigments

A total of 0.1 g sugar beet leaves were treated with 5 mL of anhydrous ethanol (Tianjin Yongda Chemical Reagent Co., Ltd., Tianjin, China) to extracted photosynthetic pigments until the leaves turned fully discolored, at which point the absorbance was calculated [29].

2.7. Activity of RuBP Carboxylase

The activity of RuBP carboxylase was assessed using an ELISA kit, which was from Chundu Biotechnology Company, Wuhan, China, in accordance with the provided instructions. Based on the standard curve, the activity of RuBP in each sample was computed and expressed in international units (IU).

2.8. Root Activity

The root activity of sugar beet was determined using the method of Qi et al. [30]. The triphenyltetrazolium chloride (TTC) reduction method was used, and TTC amount of root reduction per unit of fresh weight was used.

2.9. Contents of NO3-N in the 0–60 cm Soil Layer

Soil samples were collected at 160 DAS. All 30 plots were sampled by the five-point sampling method, using a ring knife (61.8 mm × 40 mm) to collect soil. One soil sample was taken from each 20 cm depth. The NO3-N was extracted from the fresh soil samples by 1 M KCl and then assessed using an auto-analyzer (AutoAnalyzer-AA3, Seal Analytical, Norderstedt, Germany) [31].

2.10. The Activity of Soil Enzyme

Fresh rhizosphere soil samples were collected at 60, 85, 110, 135, and 160 DAS. Three beet plants were randomly selected each time from each plot. Two profiles were randomly excavated for each plant, and 15–20 cm beetroots were collected for rhizosphere soil. All rhizosphere soil samples were collected no more than 5 mm away from the root surface and were transported back to the laboratory in a cooler. The urease activity in each soil sample was determined using colorimetry [32]. The α-xylosidase and β-glucosidase activities were determined by performing the microplate fluorometric assay [33,34]. Soil polyphenol oxidase activity was determined through catetriol colorimetry [35]. Titration of soil catalase activity was performed using 0.1 mol L–1 KMnO4 [36].

2.11. Yield, Sugar Content, and Partial Factor Productivity of N

Harvesting was performed on 29 September 2019 and 27 September 2020. The unsampled plots were used to randomly choose 30 sugar beet plants. The green tops of the selected plants were removed, the soil on the roots was cleaned, and each component was individually weighed. The sugar content (%) in each sample was measured using a refractometer (RM–40, Mettler Toledo, Zurich, Switzerland). The crop yield and sugar yield were calculated according to Formulas (2) and (3) as indicated below. The partial factor productivity of N (PFPN) [18] was computed according to Formula (4).
Crop Yield (t ha–1) = Root weight plant–1 × Density
Sugar yield = Crop yield × Sugar Content
PFPN   ( kg   kg 1 ) = Yield N application amount

2.12. Statistical Analysis

All the data from each measured item in the present paper were analyzed using SPSS Statistics Version 22.0 (IBM Inc., Chicago, IL, USA). Duncan’s multiple range test was conducted to compare the means (p < 0.05). The figures were prepared using Origin 2019 (Origin Lab, Northampton, MA, USA).

3. Results

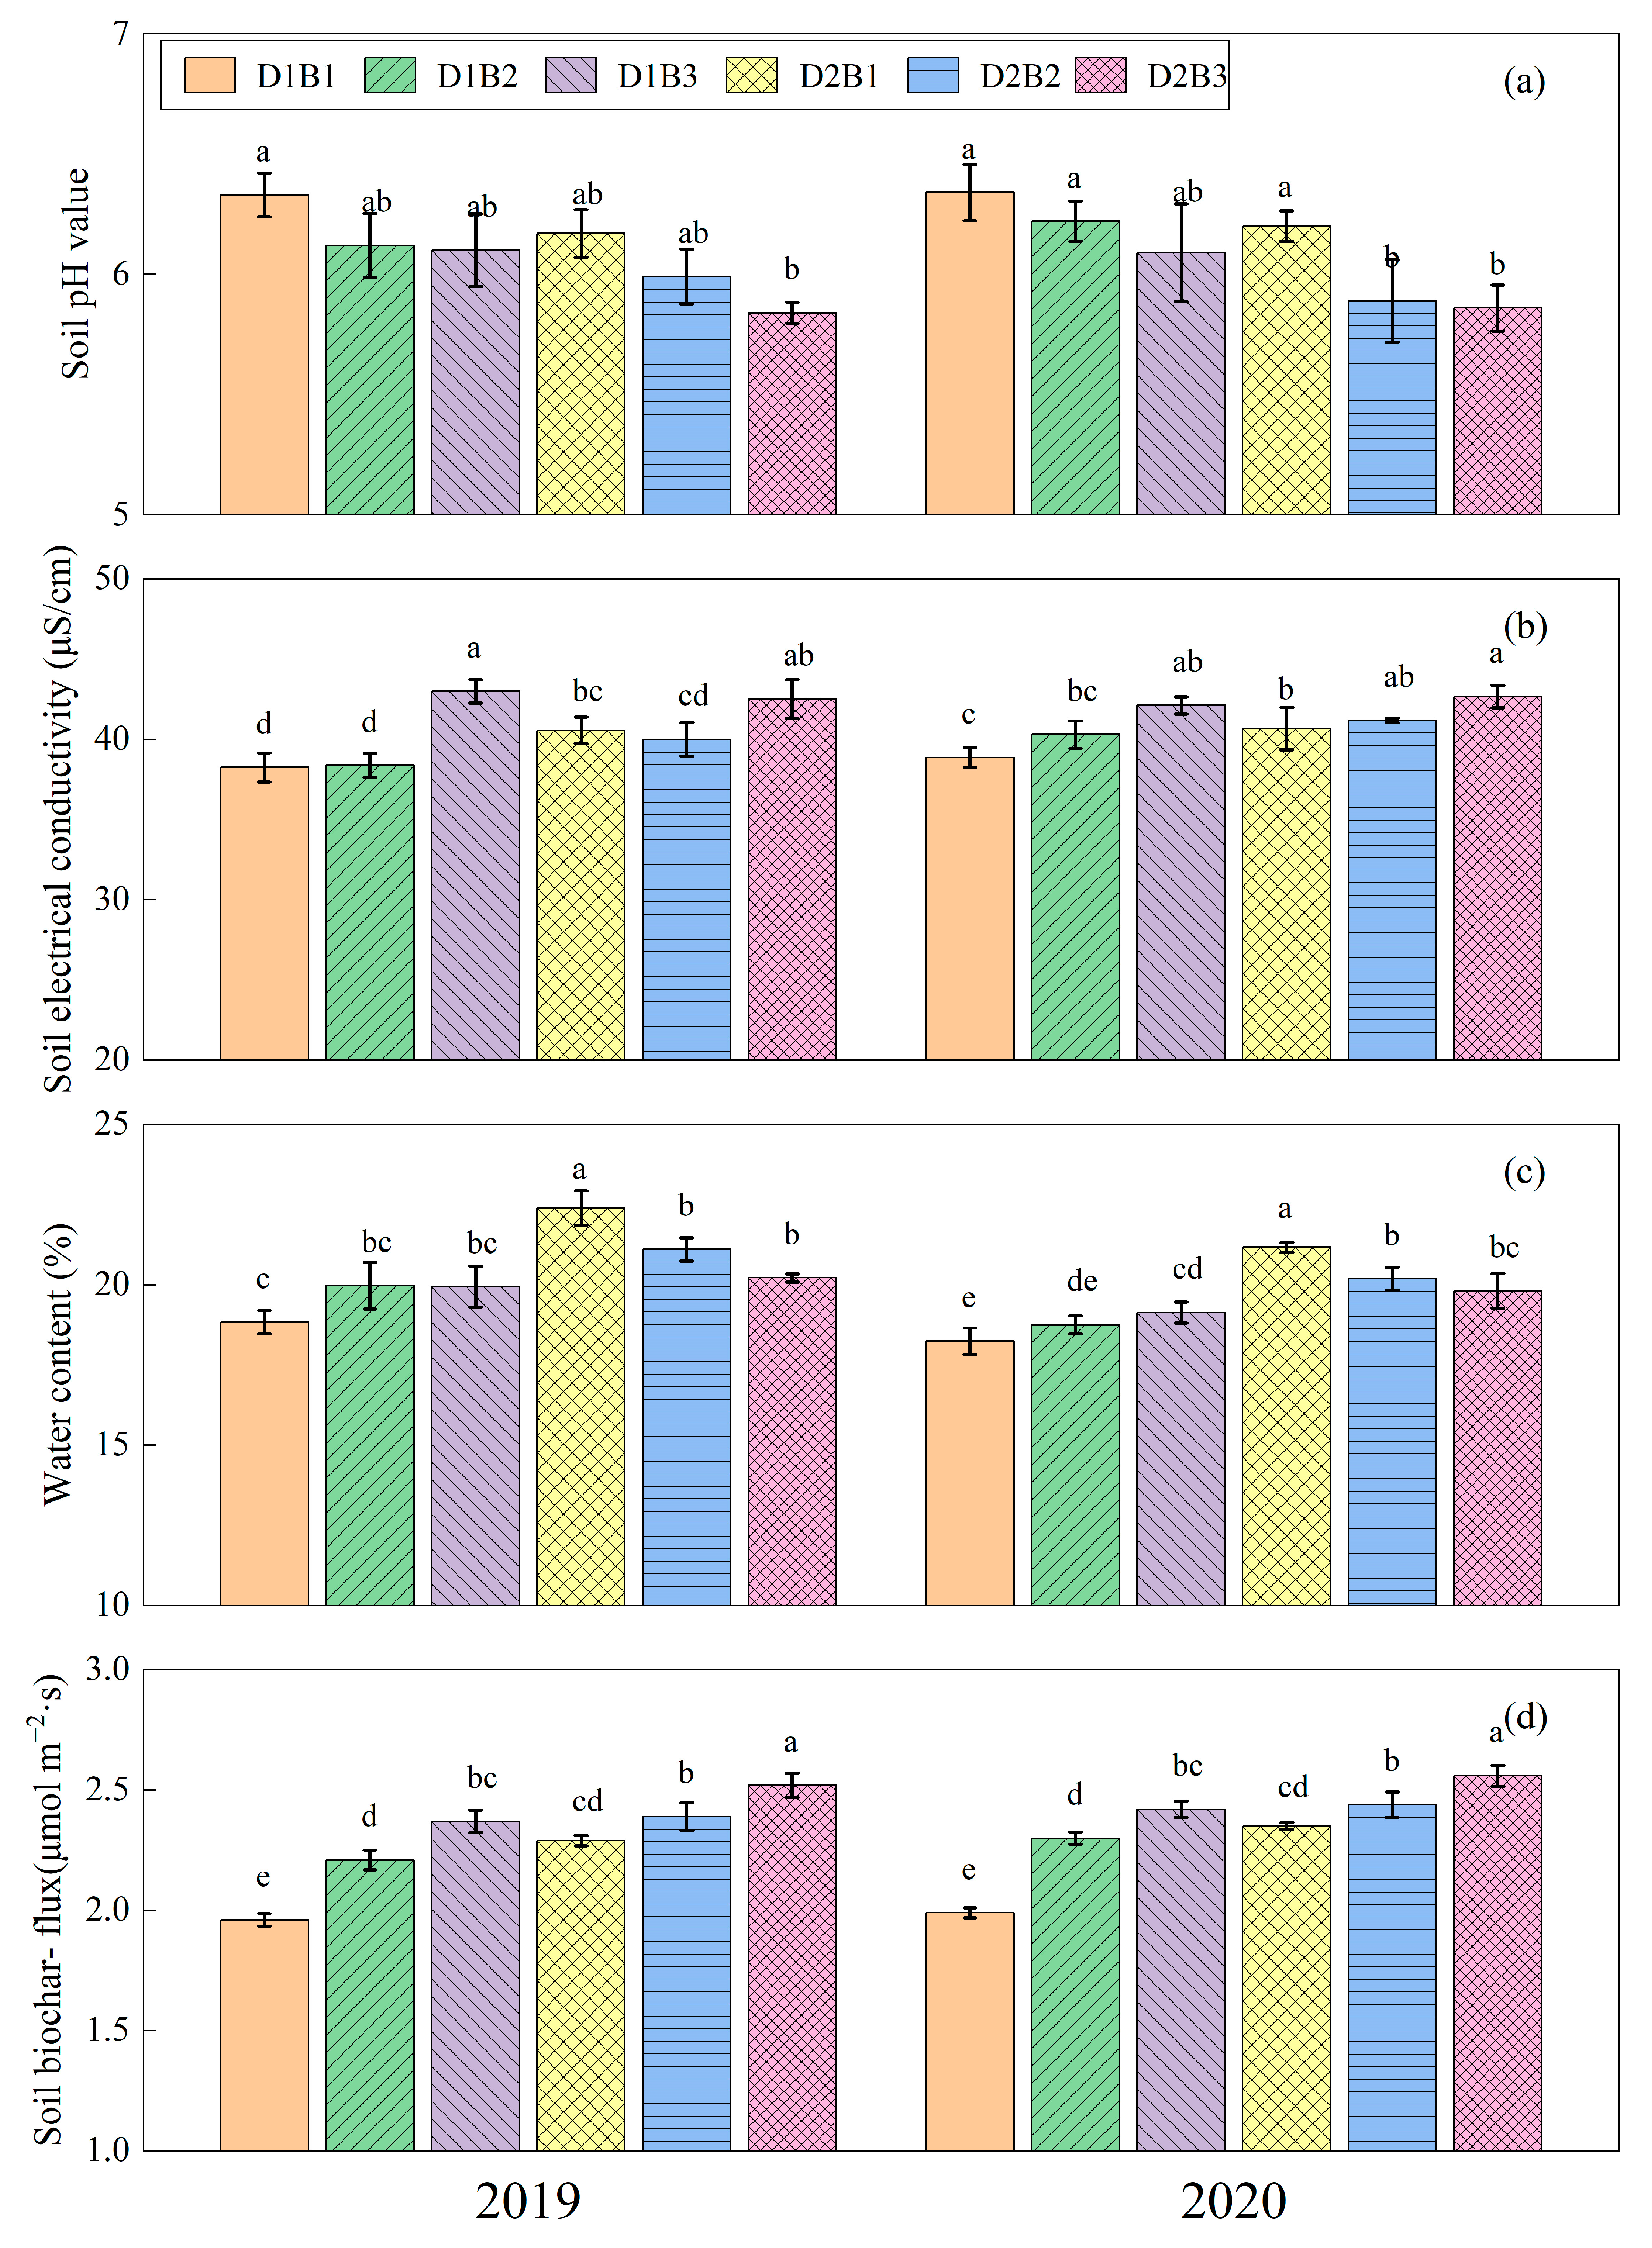
3.1. Soil Physical and Chemical Properties

The two densities and different BOF application rates significantly altered the physical and chemical properties of the soil (Figure 1). Increasing the applied amount of BOF and planting density decreased soil pH (Figure 1a). The soil electrical conductivity of both densities was the highest at the B3 application amount of BOF (Figure 1b). The soil water content of the D2B1 treatment was the highest, which was significantly higher than that observed in other treatments (Figure 1c). The soil biochar flux under the D2B3 treatment was the highest and had significant difference from other treatments (Figure 1d).

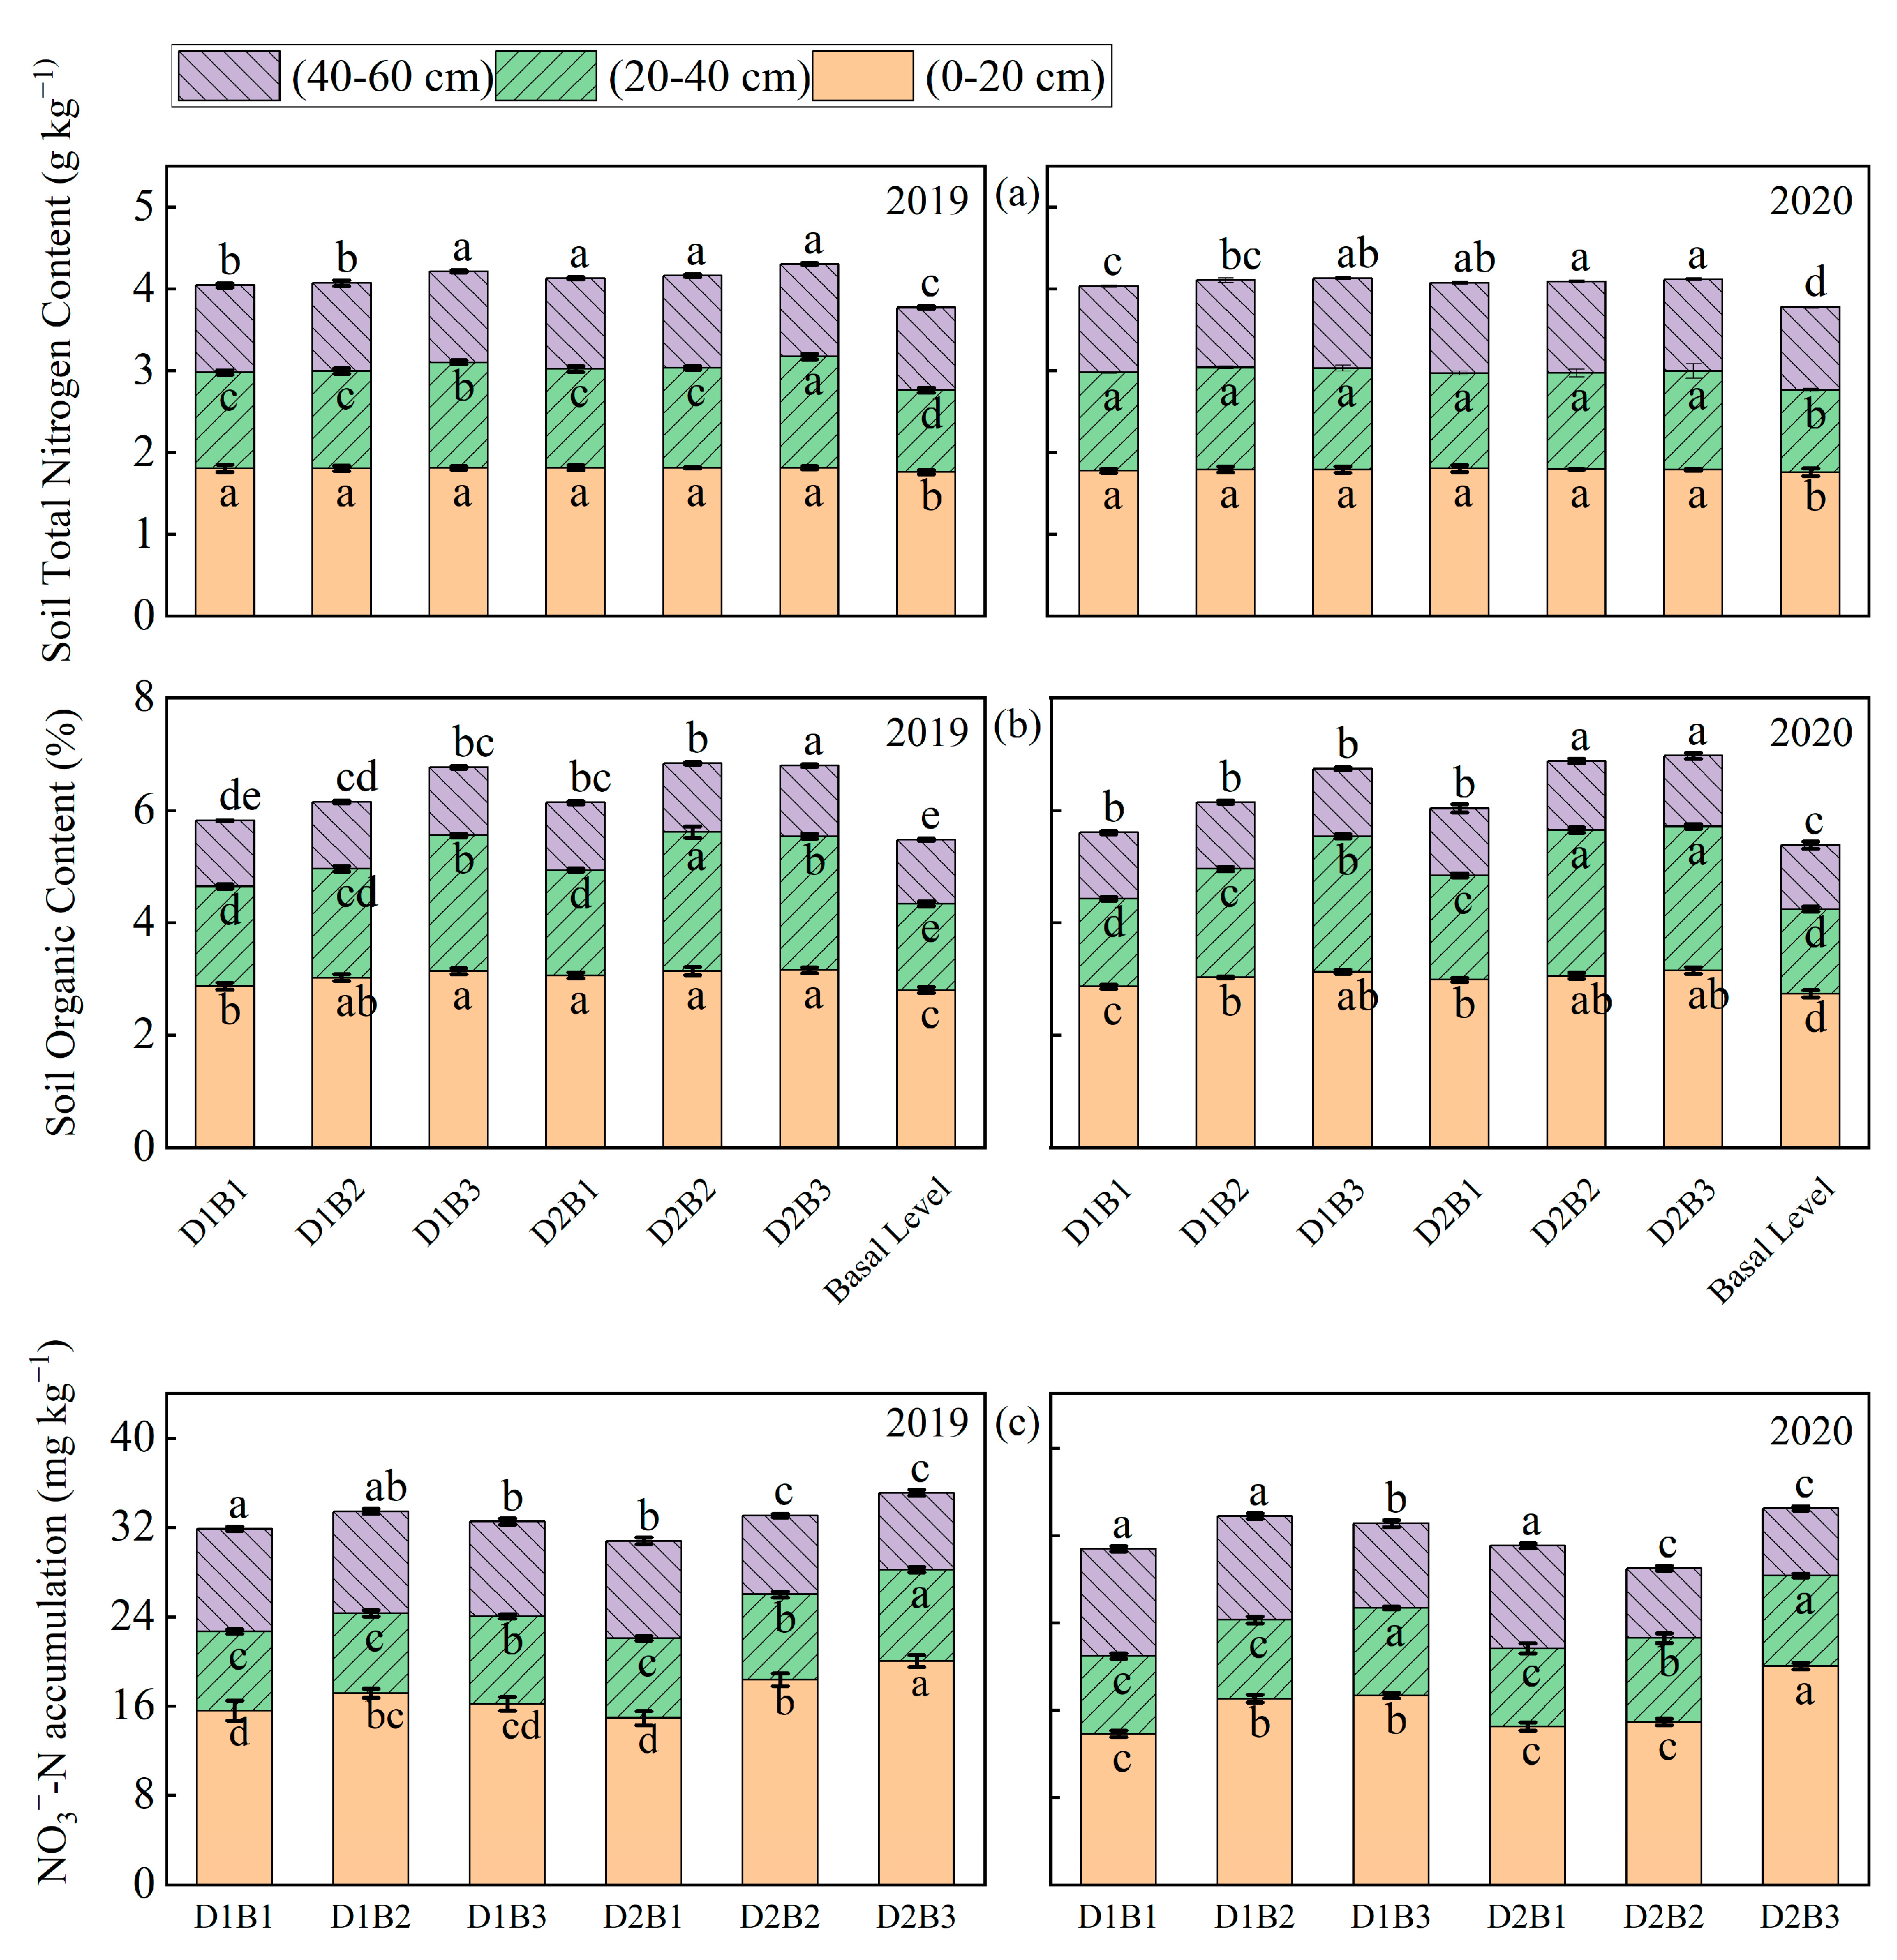
3.2. Soil Nutrients in the 0–60 cm Soil Layer

The nutrient content of the 0–60 cm soil layer was significantly increased by the amount of BOF applied compared to the basal level soil nutrients. With an increasing soil depth, the amount of total nitrogen and organic matter in the soil dropped (Figure 2). The total nitrogen content in the 0–60 cm soil layer under the D1B3 treatment was 3.3% and 2.0% higher than that under the D1B1 and D1B2 treatments, respectively, while that under the D1B3 treatment was 2.7% and 2.0% higher than that under the D2B1 and D2B2 treatments, respectively (Figure 2a). In the 0–20 cm soil layer, no significant difference was observed in the total nitrogen content among all treatments. In 2019, the total nitrogen content in the 20–40 cm soil layer under the D2B3 treatment was significantly higher compared to the other treatments. The total nitrogen content in the 40–60 cm soil layer increased with the increase in the application amount of BOFs. However, the difference was not significant among the different treatments under the same density. At the same density, as the BOF application rate increased, we found that the soil organic matter content in the 0–60 cm soil layer increased (Figure 2b). In the 0–20 cm soil layer, there was no significant difference in the soil organic matter content among the D1B3, D2B1, D2B2, and D2B3 treatments. The soil organic matter content under the D2B2 treatment was significantly higher compared to the D1B1, D1B2, D1B3, and D2B1 treatments in the 20−40 cm soil layer. Compared with 20–40 and 40–60 cm soil, the NO3-N content of 0–20 cm soil was higher, and the NO3-N content of the 0–20 cm D2B3 treatment was significantly higher than that observed in other treatments. The NO3-N content of 20–40 cm soil showed an increasing trend with the increase of density and application amount of BOFs. At 40–60 cm, the NO3-N content of the soil showed a decreasing trend with the increasing density and application amount of BOFs (Figure 2c).

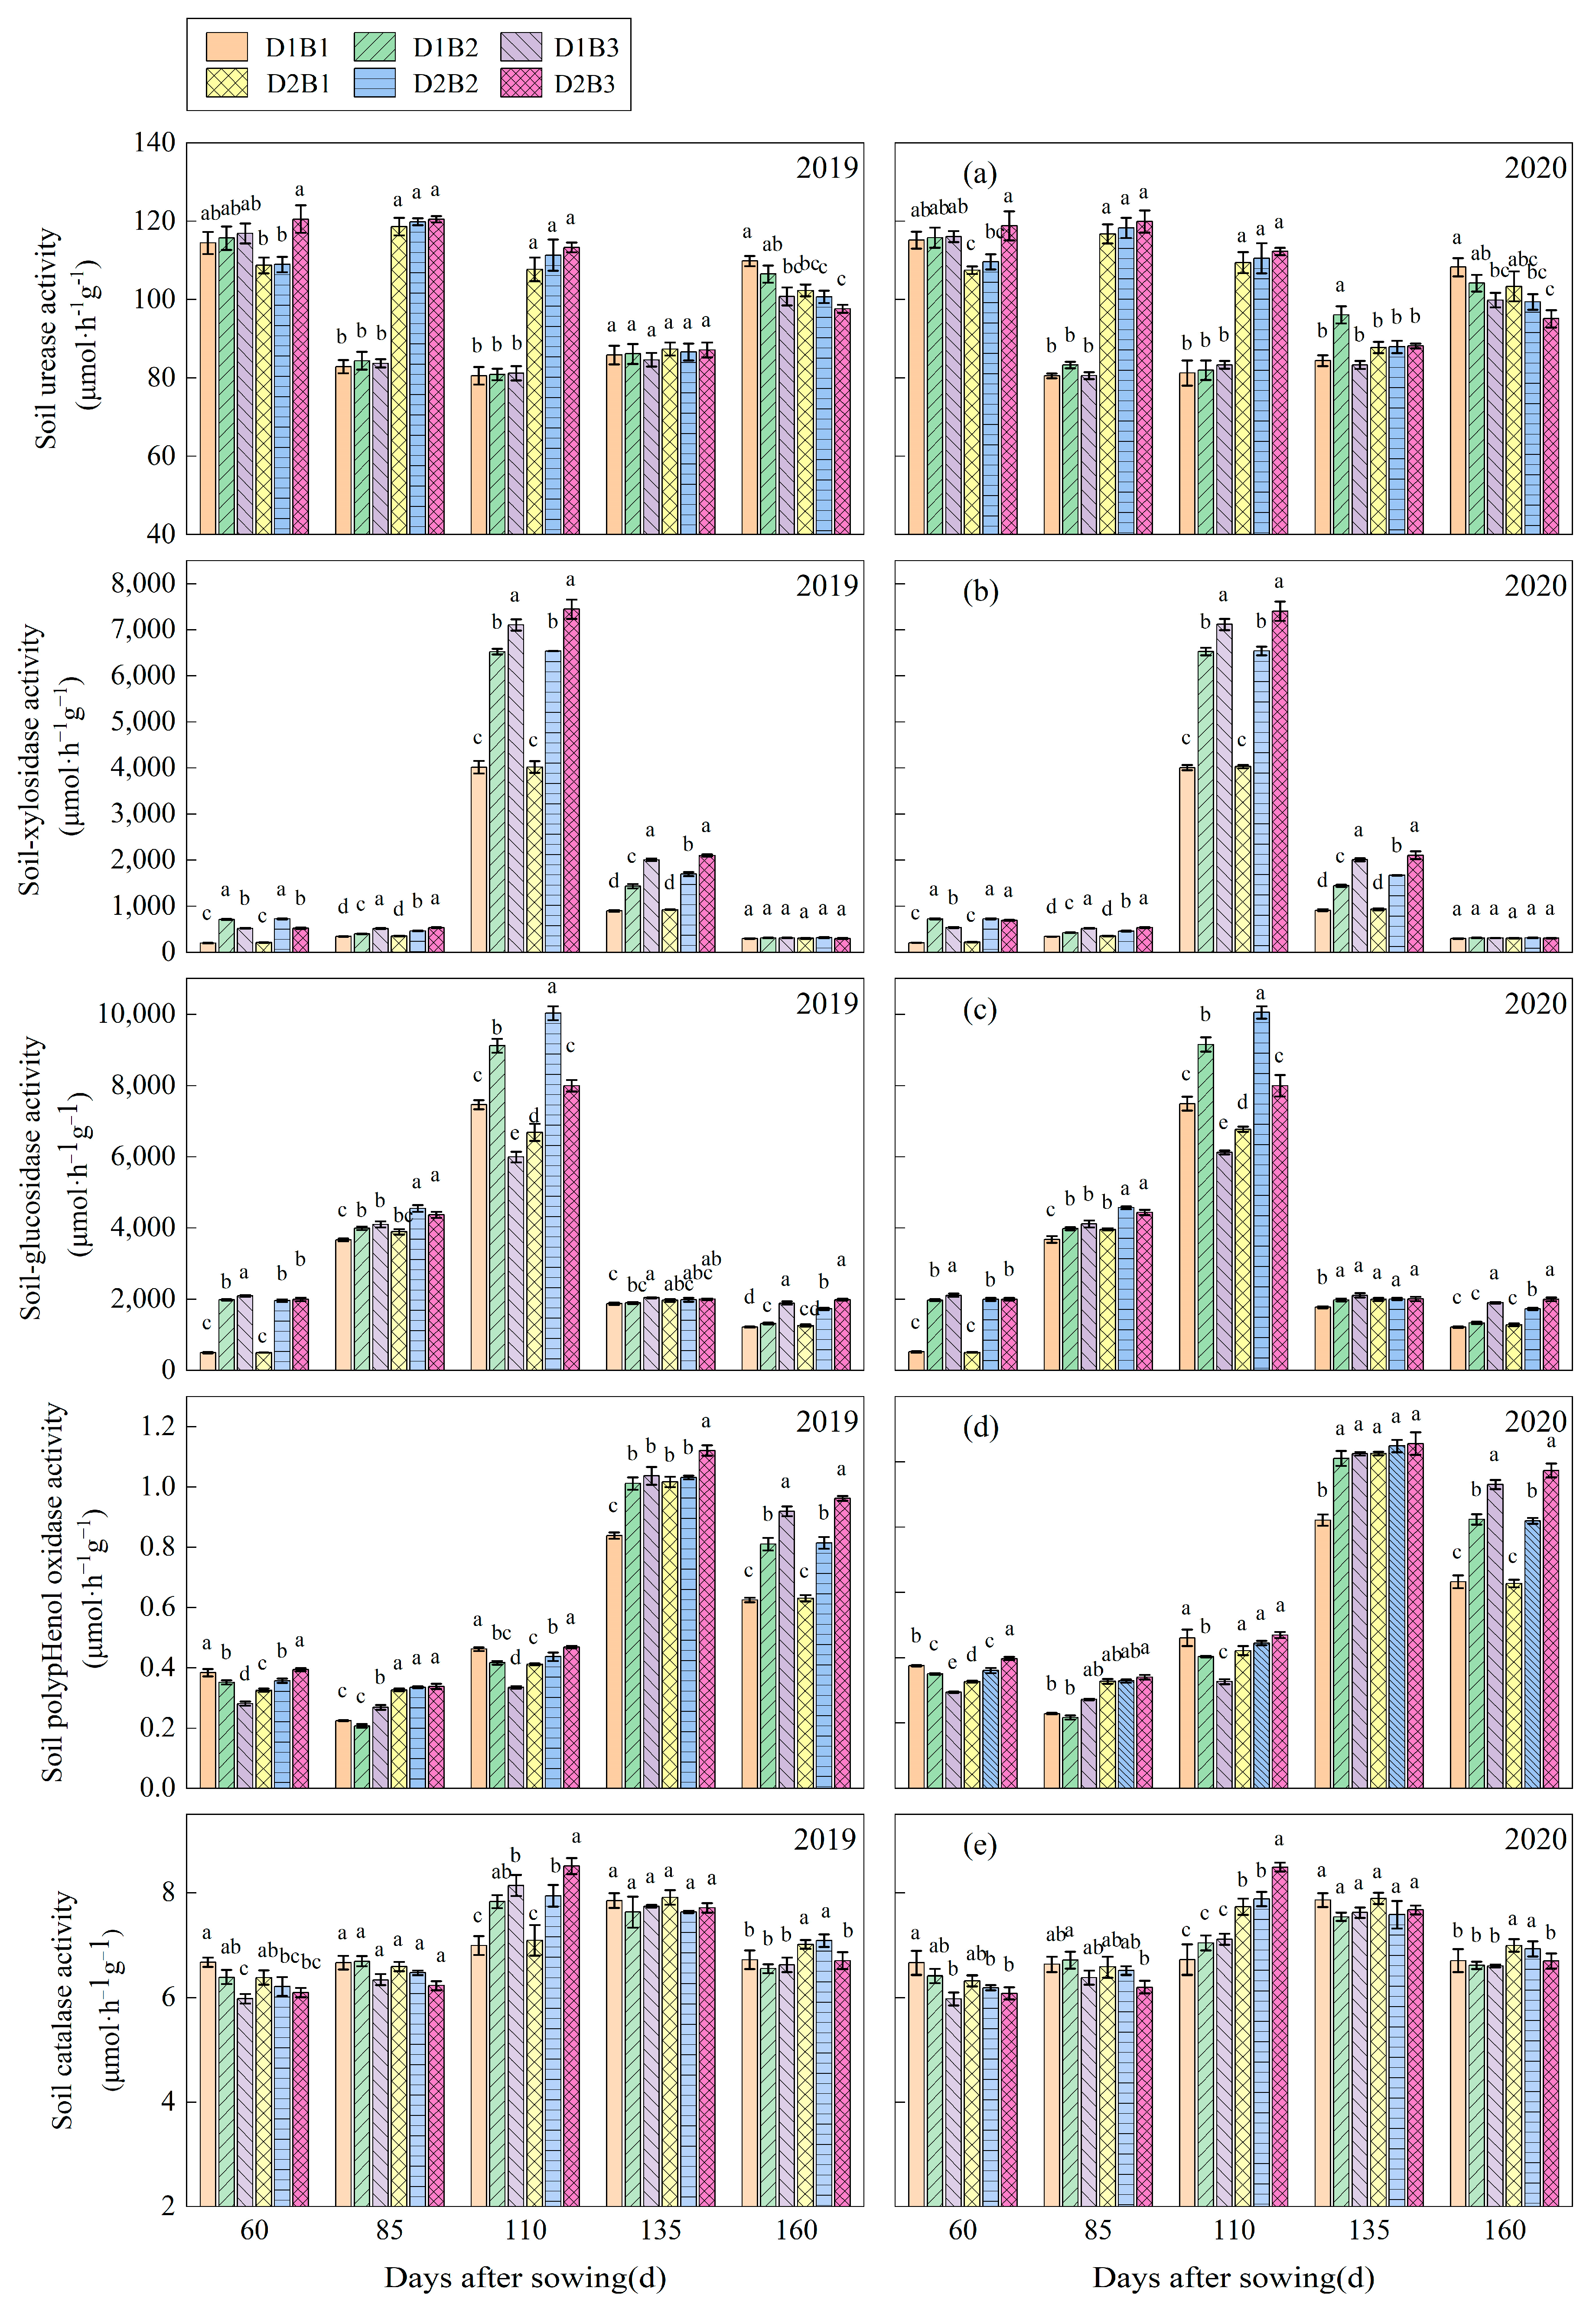
3.3. Activity of Soil Enzyme

Soil urease activity reflects, to a certain extent, the soil fertility level. At 85 DAS and 110 DAS, increasing planting density significantly increased the soil urease activity (Figure 3a). With the increase in the BOF application amount, the activity of α-xylosidase in the soil was also considerably increased at 85, 110, and 135 DAS. However, no significant difference was seen in the α-xylosidase activity among all treatments at 160 DAS (Figure 3b). At 110 DAS, the β-glucosidase activity was significantly higher in the D2B2 treatment compared to that in the other treatments. At 160 DAS, the activity of this enzyme showed an increasing trend with the increase in the application amount of biochar-based organic fertilizer (Figure 3c). At 60 DAS, the activity of polyphenol oxidase decreased with the rise in the BOF application amount at the D1 planting density and increased with an increase in the BOF application amount under the D2 density (Figure 3d). At 160 DAS, the D2B1 and D2B2 treatments soil catalase exhibited significantly higher activity compared to the other treatments (Figure 3e).

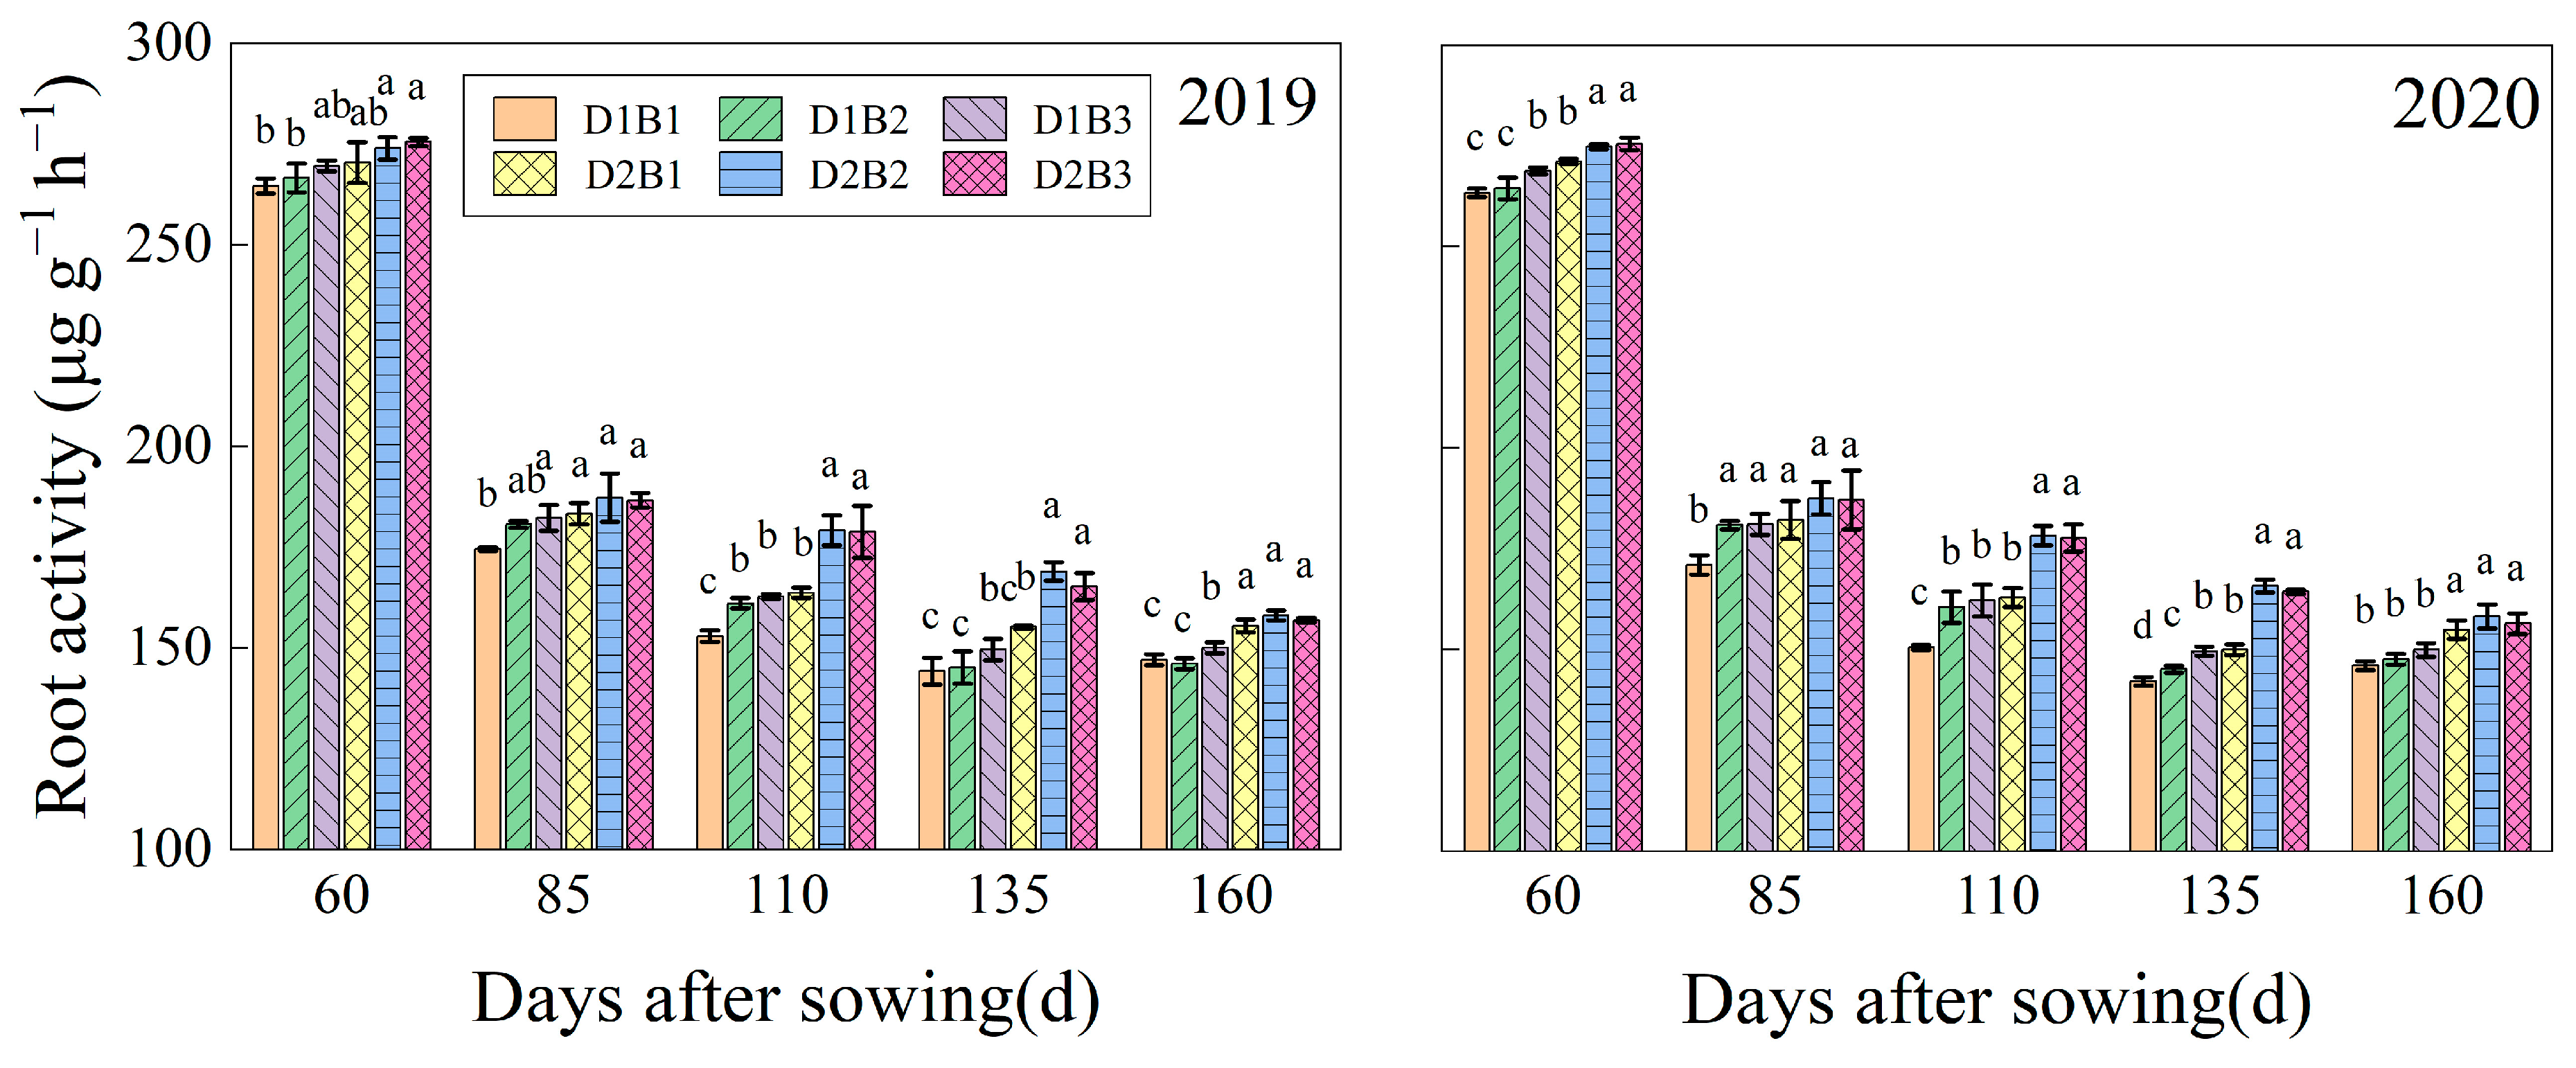
3.4. Root Activity of Sugar Beet

Beet root activity is highest at 60 DAS and decreases with the growth period (Figure 4). The D2B2 and D2B3 treatments had the lowest root activity at 160 DAS, and the other treatments had the lowest root activity at 135 DAS. At 60 DAS, the root activity of the D1B3 treatment was the highest; in other periods, the root activity of the D2B2 treatment was the highest. At 110 and 135 DAS, the root activity of the D2B2 treatment differed most from that of other treatments, which was 17.7%, 11.1%, 10.0%, 10.5%, and 0.3% higher than D1B1, D1B2, D1B3, D2B1, and D2B3 at 110 DAS, and 16.9%, 15.3%, 11.8%, 9.7%, and 1.5% at 135 DAS, respectively.

3.5. Dry Matter and Root-To-Shoot Ratio

According to the results, the accumulation of dry matter and the root-to-shoot ratio of sugar beet were found to be significantly impacted by the two planting densities and the quantity of BOFs used (Figure 5). There was no significant difference among the different treatments in terms of the dry matter of roots and the root-to-shoot ratio at 60 DAS (Figure 5b,c). The dry matter content of roots in the D2B2 treatment was 24.4%, 33.8%, and 24.7% higher than that of the D1B1, D1B2, and D1B3 treatments, respectively (Figure 5a). At 135 and 160 DAS, the dry matter of shoots in the D2B3 treatment was noticeably higher in comparison with those in the other treatments. With the increase in the application rate of BOF at the D1 density, the root-to-shoot ratio decreased. At the D2 density, however, the root-to-shoot ratio decreased at 160 DAS, and the root-to-shoot ratio in the D2B2 treatment was 22.1%, 45.1%, 46.2%, 11.1%, and 56.6% higher than that in the other treatments, respectively.

3.6. Photosynthetic System of Sugar Beet

The two densities and the different content of BOFs significantly altered the photosynthesis in the sugar beet plants (Figure 6). The Fv/Fm declined with the rise in the application rate of BOF in the treatment with D1 density. At the same time, it first increased, and then decreased in the treatment with D2 density, at 110 DAS (Figure 6a). In addition, the D2B3 treatment presented the highest Fv/Fm at 160 DAS. At 60 DAS, BOF application at 2.75 t ha−1 significantly decreased the Chl (a + b) rate, the value of which in the D1B1 group was 10.2% and 10.9% higher than that in the D1B2 and D1B3 groups, respectively. The corresponding value in the D2B1 group was 3.4% and 13.1% higher than in the D2B2 and D2B3 groups, respectively (Figure 6b). However, under the same density, further increase in the application rate of BOF decreased the Chl (a + b) rate at 160 DAS. Moreover, the activity of RuBP carboxylase in the sugar beet leaves was highest at 135 DAS in each treatment (Figure 6c).

3.7. Sugar Content, Sugar Yield of Sugar Beet, and Partial Factor Productivity of N

Increasing the BOF application amount significantly increased the sugar beet root yield at the low planting density in 2019 and 2020 (Table 2). With the increase in BOF application, the sugar content exhibited a decreasing trend at the low density, and in 2020, the D2B2 treatment had the highest sugar content at the high planting density. The D2B2 treatment presented the highest sugar content as well as the sugar yield, and the sugar content of the D2B2 treatment group was significantly higher than those in all the other treatment groups. The partial factor productivity of N (PFPN) of the D2B3 treatment was 12.17%, 9.81%, 5.59%, 2.90%, and 1.23% higher than that of other treatments, respectively.

3.8. Test of Interagent Effects on Soil pH, Soil Electrical Conductivity, Water Content, Soil Biochar Flux, Yield, Sugar Content, Sugar Yield, and PFPN

To analyze the effect of density and BOFs on soil pH, soil electrical conductivity, water content, soil biochar flux, yield, sugar content, sugar yield, and PFPN, interagent effects were tested (Table 3). The results show that the main effect of BOF on sugar production was not significant, but the impact of D × B on soil pH, soil electrical conductivity, water content, soil biochar flux, yield, sugar content, and PFPN was significant (p < 0.05) or highly significant (p < 0.001). The interaction effect of D × B on sugar content and sugar yield was highly significant (p < 0.001) and on soil electrical conductivity and water content was significant (p < 0.05). Simple effects analysis was performed on the indicators whose main effects of D × B reached highly significant or significant levels (Table 4). The results show that the simple effect of BOF application amount on water content was significant at the D1 density (p < 0.05). The simple effect on soil electrical conductivity, sugar content, and sugar yield was highly significant (p < 0.001). The simple effect of BOF application on soil electrical conductivity and sugar yield was significant at the D2 density (p < 0.05) and extremely significant on water content and sugar content (p < 0.001). The simple effect of density on soil electrical conductivity and sugar content was significant (p < 0.05), and it was extremely significant (p < 0.001) on water content and sugar yield under the B1 application amount of BOF. The simple effect of density on yield per plant and soil electrical conductivity reached a significant level (p < 0.05), and the effect on water content, sugar content, and sugar yield reached extremely significant levels (p < 0.001) under the B2 application amount of BOF. Under the B3 application amount of BOF, the simple effect of density on soil electrical conductivity reached a significant level (p < 0.05), and the influence of density on water content, sugar content, and sugar yield reached a highly significant level (p < 0.001).

4. Discussion

Soil pH is the basic physical and chemical property of soil, which also confirms that it is essential to evaluate soil properties. In the present study, soil pH decreased after fertilization in all treatment groups. At the two densities, under the B3 application amount of BOF, the minimum pH value was reached at 160 DAS, while in the other treatment groups, the soil pH first decreased, then increased, and finally decreased again (Figure 1a). Some previous studies suggested that the use of biochar would increase soil pH [37]. The BOFs we used were alkaline, but the soil pH did not increase compared with that before seeding. We speculate that this might be related to the increase in root exudes brought about by high-density planting. Soil carbon flux is derived mainly from the respiration of plant roots and the microbes and animals living in the soil [38]. In the present study, the soil carbon flux of the high planting density treatment groups was significantly higher than that of the low planting density treatment groups. Its value increased with the increase in the BOF application amount (Figure 1d). The results indicate that increasing planting density and application amount of biochar-based organic fertilizer could increase soil vitality. A study suggests that the use of biochar can reduce the gas flux in soil with high water content [39]. In our study, the soil water content of the D2 density treatment was higher than the D1 density treatment (Figure 1c), which suggests that biochar-based organic fertilizer and density may work together to regulate field gas emissions, but we have no further evidence. At 135 DAS and 160 DAS, the soil conductivity under the D1B3 and D2B3 treatments was higher in comparison with that under the other treatments at the same density (Figure 1b). This indicates that the increase in the BOF application amount could increase the concentration of mineral ions in the soil, thereby providing a greater number of ion exchange sites, ultimately improving soil activity [40,41]. A previous study has also suggested that the long-term maintenance of soil fertility is closely associated with the increase in the soil’s electrical conductivity after adding organic fertilizer [42].
The application of organic fertilizers reduced nitrogen leaching and increased soil nitrogen retention [43]. The NO3-N content in the 20–40 cm soil layer under the D2 planting density was higher than that under the D1 planting density. We note that, at this time, the root activity at the D2 density was also significantly higher than that at the D1 density (Figure 4), which indicates that the root activity of sugar beet may be related to NO3-N content in 20–40 cm soil layer, which we also believe might be related to the changes in soil physicochemical properties, physical activity, and soil ecological structure after BOF application at different densities [44]. The total nitrogen and organic matter content in the 0–60 cm soil layer under each treatment were significantly higher than those before fertilization (Figure 2). In addition to the increase of soil organic matter caused by the increase in the use of biochar-based organic fertilizer [45], it may also be related to a decrease in soil pH after seeding, which previous studies have suggested may increase soil organic carbon content [46]. In addition, the organic matter content in the 0–60 cm soil layer under the D2B3 treatment was 16.4%. Furthermore, the organic matter content under the B3 application amount of BOF—16.4%, 10.1%, 1.2%, 9.7%, and 0.5%—is higher than that under the other treatments, which could also be the reason why dry matter accumulation in the shoot of plants under the D2B3 treatment was greater than that in plants under the other treatments at 160 DAS.
Soil enzyme activity is considered a suitable soil characteristic for assessing the degree of soil alteration during agricultural production [47]. In the present study, at 85 DAS and 110 DAS, the urease activity of the soil under high planting density was significantly higher in comparison with low planting density (Figure 3a). This may be the reason why the PFPN of the D2B1, D2B2, and D2B3 treatments is higher than that in the D1 density treatments (Table 2). A previous study suggested that urease activity could reflect the efficient use of nitrogen by plants to some extent [48]. The activities of α-xylosidase and β-glucosidase were observed to be higher at 110 DAS (Figure 3b,c), and increasing the amount of BOF applied could improve the activities of these two enzymes as greater nutrient sources were available to the soil microbes. This could also be the reason for the rapid increase in the soil polyphenol oxidase activity at 110–135 DAS. The soil catalase activity in the high planting density treatment groups was higher than that in the low planting density treatment groups at 110–160 DAS, which also suggests that high-density treatments may have more soil microbes (Figure 3e). Trasar-Cepeda et al. believe that catalase activity in the soil is related to the number of aerobic microorganisms in the soil [49]. Soil microorganisms and plant root exudates are the main sources of soil polyphenol oxidase. In the present study, in increasing the BOF application amount, the activity of soil polyphenol oxidase has been significantly improved, whereases density had no significant effect on the activity of this enzyme at 160 DAS (Figure 3d). Therefore, it was speculated that, in sugar beet planting, the B3 application amount of BOF is more conducive to promote soil aromatic compound cycling after harvest and reduce the pollution of phenolic substances in soil and water [50,51,52].
Crop productivity depends on dry matter accumulation as well as on the efficient distribution of dry matter accumulation [53]. At foliage luxuriating, an increase in the proportion of dry matter accumulation in the leaves could effectively promote the accumulation of dry matter in the plant roots [54]. This study showed no significant difference in root-to-shoot ratio between treatments at 60 DAS. At 85 DAS, the root-to-shoot ratio of the D2B2 treatment was reduced by 23.3%, 14.55%, 12.7%, 19.4%, and 20.9% compared with other treatments (Figure 5c). Regarding sugar beet yields, our previous studies have shown that the use of BOF can increase sugar beet yields compared to fertilizers alone [24]. In this study, with the same amount of biochar-based organic fertilizer application, high-density planting can significantly increase the population yield and sugar production of sugar beet (Table 2). In addition to the increase of soil organic matter under high density [55], the increase of population photosynthesis level also helps to improve the productivity of sugar beet. The chlorophyll fluorescence parameter Fv/Fm (maximum photosynthetic efficiency of the photosystem II) is an important index that associates plant photosynthesis with the external environment of the plant. This index reflects the ability of the plant to absorb light energy [55]. Chlorophyll (Chl) is an important photosynthetic pigment in plants, which determines the photosynthetic capacity of crops [56]. When plants are photosynthesizing, RuBP carboxylase is a key enzyme that can reflect the photosynthetic capacity of plants [57]. The above results show that the D2B2 treatment could effectively promote the growth of beet leaves and increase the accumulation of dry matter in leaves during the foliage luxuriating period. We found that the Fv/Fm of the D1B3 and D2B2 treatments were significantly higher than those of other treatments at the root enlargement stage (110 DAS) (Figure 6a), and RuBP carboxylase activity and Chl (a + b) were also higher than those of other treatments (Figure 6b,c). The Fv/Fm of the D1B3 and D2B2 treatments were significantly higher than those of the other treatments, and the RuBP activity and Chl (a + b) were also higher than those of the other treatments, indicating that these two treatments still had good photosynthetic capacity at 110 DAS, which was conducive to the accumulation and underground distribution of dry matter in beet at the later stage. At 160 DAS, the D1B3 treatment still had higher Chl (a + b), and the above-ground dry matter accumulation was significantly higher than that of all treatments except D2B3, but the root-to-shoot ratio and root dry matter accumulation were significantly lower than that of the D2B2 treatment. At this time, the underground dry matter accumulation and root-to-shoot ratio of the D2B2 treatment were significantly higher than those of other treatments (Figure 5b), indicating that excessive application of biochar-based organic fertilizer at low density would lead to a large amount of above-ground nutrient accumulation in the late growth and development of beet, resulting in a decrease in nutrient distribution to the underground. This may also be the reason why the sugar content of the D2B2 treatment group is significantly higher than that of other treatments (Table 2).

5. Conclusions

High-density planting and the proper amount of BOF application can reduce soil pH, increase soil conductivity, increase carbon flux, and increase soil organic matter content. It can also increase the activities of soil urease, α-xylosidase, β-glucosidase, and catalase, as well as increase the number of soil microorganisms, thus improving the activity of soil polyphenol oxidase. Furthermore, it can improve soil fertility and activity, which can also change the distribution of NO3- N in 0–60 cm soil, improve root vitality, and enhance the ability of plant roots to absorb nutrients. Thus, the photosynthetic capacity of 110 DAS beet was improved, dry matter accumulation was increased, root-to-shoot ratio was increased, and the yield, sugar production, and PFPN of beet were increased. Therefore, from the perspectives of efficient crop production and long-term usability of the soil, the combination of 90 thousand plants ha–1 + 3.25 t ha−1 BOFs is recommended as the most suitable.

Author Contributions

Conceptualization, C.L. and Y.W.; methodology, Y.W.; software, X.Y.; validation, J.C., J.L. and C.W.; formal analysis, P.Z.; investigation, H.Z.; resources, C.L.; data curation, J.C.; writing—original draft preparation, J.C.; writing—review and editing, H.Z. and L.Z.; visualization, J.C.; supervision, Y.W.; project administration, C.L.; funding acquisition, C.L. and P.Z. All authors have read and agreed to the published version of the manuscript.

Funding

This research was funded by the National Natural Science Foundation of China, grant numbers 32071973 and 31671622. The APC was funded by Cai feng Li; Postdoctoral General Project of Heilongjiang Province, grant number LBH-Z22088. The APC was funded by Pengfei Zhang.

Data Availability Statement

The datasets generated and/or analyzed in the current study are available from the corresponding author on reasonable request.

Conflicts of Interest

The authors declare no conflict of interest.

References

  1. Geng, G.; Yang, J. Sugar Beet Production and Industry in China. Sugar Tech. 2015, 17, 13–21. [Google Scholar] [CrossRef]
  2. Curcic, Z.; Ciric, M.; Nagl, N.; Taski-Ajdukovic, K. Effect of sugar beet genotype, planting and harvesting dates and their interaction on sugar yield. Front. Plant Sci. 2018, 9, 1041. [Google Scholar] [CrossRef] [PubMed]
  3. Soleymani, A.; Shahrajabian, M.H. Effects of planting dates and row distance on sugar content, root yield and solar radiation absorption in sugar beet at different plant densities. Rom. Agric. Res. 2017, 34, 145–155. [Google Scholar]
  4. Reinsdorf, E.; Koch, H.J.; Loel, J.; Hoffmann, C.M. Yield of bolting winter beet (Beta vulgaris L.) as affected by plant density, genotype and environment. Eur. J. Agron 2014, 54, 1–8. [Google Scholar] [CrossRef]
  5. Li, Q.; Li, Z.; Zhi, Y.; Huang, Y.; Huang, H. Analysis of optimum planting density of sugar beet in Tongliao region. Chin. Sugar 2014, 1, 48–49+52. [Google Scholar] [CrossRef]
  6. Yan, W.; Li, G.; Li, Z.; Cao, Y.; Zhang, S. Effects of nitrogen application and density on photosynthetic characteristics and root tuber yield in fully mulched dry beet. Crops 2019, 4, 100–106. [Google Scholar] [CrossRef]
  7. Wang, P.; Wang, Z.K.; Sun, X.C. Interaction effect of nitrogen form and planting density on plant growth and nutrient uptake in maize seedlings. J. Integr. Agric. 2019, 18, 1120–1129. [Google Scholar] [CrossRef]
  8. Sigdel, S.; Chatterjee, A.; Berti, M.; Wick, A.; Gasch, C. Interseeding cover crops in sugar beet. Field Crops Res. 2021, 263, 108079. [Google Scholar] [CrossRef]
  9. Milford, G.F.J.; Pocock, T.O.; Jaggard, K.W.; Biscoe, P.V.; Armstrong, M.J.; Last, P.J.; Goodman, P.J. An analysis of leaf growth in sugar beet. Ann. Appl. Biol. 1985, 107, 335–347. [Google Scholar] [CrossRef]
  10. Dutton, J.; Huijbregts, T. Root quality and processing. In Sugar Beet, 2nd ed.; Draycott, A.P., Ed.; Blackwell Publishing: Oxford, UK, 2006; pp. 409–442. [Google Scholar] [CrossRef]
  11. Fueki, N.; Sato, K.; Takeuchi, H.; Sato, H.; Nakatsu, S.; Kato, J. Prediction of nitrogen uptake by sugar beet (Beta vulgaris L.) by scoring organic matter and nitrogen management (N-score), in Hokkaido, Japan. Soil Sci. Plant Nutr. 2011, 57, 411–420. [Google Scholar] [CrossRef]
  12. Li, Z.H.; Wang, M.; Yang, Y.; Zhao, S.X.; Zhang, Y.L.; Wang, X.D. Effect of composted manure plus chemical fertilizer application on aridity response and productivity of apple trees on the loess plateau, China. Arid. Land Res. Manag. 2017, 31, 388–403. [Google Scholar] [CrossRef]
  13. Wang, J.L.; Wang, S.Z. Preparation, modification and environmental application of biochar: A review. J. Clean Prod. 2019, 227, 1002–1022. [Google Scholar] [CrossRef]
  14. Ullah, S.; Ali, I.; Liang, H.; Zhao, Q.; Wei, S.Q.; Muhammad, I.; Huang, M.; Nawab Ali, A.; Jiang, L.G. An approach to sustainable agriculture by untangling the fate of contrasting nitrogen sources in double-season rice grown with and without biochar. Global Change Biol. Bioenergy 2021, 13, 382–392. [Google Scholar] [CrossRef]
  15. Adetunji, A.T.; Lewu, F.B.; Mulidzi, R.; Ncube, B. The biological activities of beta-glucosidase, phosphatase and urease as soil quality indicators: A review. J. Soil Sci. Plant Nutr. 2017, 17, 794–807. [Google Scholar] [CrossRef]
  16. Mohammadi, K. Soil microbial activity and biomass as influenced by tillage and fertilization in wheat production. American-Eurasian J. Agric. Environ. Sci. 2011, 10, 330–337. [Google Scholar]
  17. Meyer, A.H.; Wooldridge, J.; Dames, J.F. Variation in urease and β-glucosidase activities with soil depth and root density in a ‘Cripp’s Pink’/M7 apple orchard under conventional and organic management. South Afr. J. Plant Soil 2015, 32, 227–234. [Google Scholar] [CrossRef]
  18. Asai, H.; Samson, B.K.; Stephan, H.M.; Songyikhangsuthor, K.l.; Homma, K.; Kiyono, Y.; Inoue, Y.; Shiraiwa, T.; Horie, T. Biochar amendment techniques for upland rice production in Northern Laos 1. Soil physical properties, leaf SPAD and grain yield. Field Crops Res. 2009, 111, 81–84. [Google Scholar] [CrossRef]
  19. Chatzistathis, T.; Kavvadias, V.; Sotiropoulos, T.; Loannis, E.P. Organic fertilization and tree orchards. Agriculture 2021, 11, 692. [Google Scholar] [CrossRef]
  20. Selvi, D.; Santhy, P.; Dhakshinamoorthy, M.J. Effect of inorganics alone and in combination with farmyard manure on physical properties and productivity of vertic haplustepts under long-term fertilization. J. Indian Soc. Soil Sci. 2005, 53, 302–307. [Google Scholar]
  21. Dhaliwal, S.S.; Naresh, R.K.; Mandal, A.; Walia, M.K.; Gupta, R.K.; Singh, R.; Dhaliwal, M.K. Effect of manures and fertilizers on soil physical properties, build-up of macro and micronutrients and uptake in soil under different cropping systems: A review. J. Plant Nutr. 2019, 42, 2873–2900. [Google Scholar] [CrossRef]
  22. Milosevic, T.; Milosevic, N. The effect of zeolite, organic and inorganic fertilizers on soil chemical properties, growth and biomass yield of apple trees. Plant Soil Environ. 2009, 55, 528–535. [Google Scholar] [CrossRef]
  23. Rafael, R.B.A.; Fernandez-Marcos, M.L.; Cocco, S.; Ruello, M.L.; Fornasier, F.; Corti, G. Benefits of biochars and NPK fertilizers for soil quality and growth of cowpea (Vigna unguiculata L. Walp.) in an acid arenosol. Pedosphere 2019, 29, 311–333. [Google Scholar] [CrossRef]
  24. Chen, J.T.; Wang, X.R.; Liu, X.Y.; Wang, X.F.; Zhao, J.N.; Zhang, H.; Wang, Y.B.; Li, C.F. Beneficial Effects of Biochar-Based Organic Fertilizers on Nitrogen Assimilation, Photosynthesis, and Sucrose Synthesis of Sugar Beet (Beta vulgaris L.). Int. J. Plant Prod. 2022, 16, 755–768. [Google Scholar] [CrossRef]
  25. Welsh, C.; Tenuta, M.; Flaten, D.N.; Thiessen-Martens, J.R.; Entz, M.H. High Yielding Organic Crop Management Decreases Plant-Available but Not Recalcitrant Soil Phosphorus. Agron. J. 2009, 101, 1027–1035. [Google Scholar] [CrossRef]
  26. He, P.; Yang, L.P.; Xu, X.P.; Zhao, S.C.; Chen, F.; Li, S.T.; Tu, S.H.; Jin, J.Y.; Johnston, A.M. Temporal and spatial variation of soil available potassium in China (1990–2012). Field Crops Res. 2015, 173, 49–56. [Google Scholar] [CrossRef]
  27. Khan, N.l.; Clark, I.; Sanchez-Monedero, M.A.; Shea, S.; Meier, S.; Qi, F.J.; Kookana, R.S.; Bolan, N. Physical and chemical properties of biochars co-composted with biowastes and incubated with a chicken litter compost. Chemosphere 2016, 142, 14–23. [Google Scholar] [CrossRef] [PubMed]
  28. Zhang, P.F.; Yang, F.F.; Zhang, H.; Liu, L.; Liu, X.Y.; Chen, J.T.; Wang, X.; Wang, Y.B.; Li, C.F. Beneficial effects of biochar-based organic fertilizer on nitrogen assimilation, antioxidant capacities, and photosynthesis of sugar beet (Beta vulgaris L.) under saline-alkaline stress. Agronomy 2020, 10, 1562. [Google Scholar] [CrossRef]
  29. Lichtenthaler, H.K.; Wellburn, A.R. Determinations of total carotenoids and chlorophylls a and b of leaf extracts in different solvents. Biochem. Soc. Trans. 1983, 11, 591–592. [Google Scholar] [CrossRef]
  30. Qi, W.Z.; Liu, H.H.; Dong, S.T.; Zhao, B.Q.; So, H.B.; Li, G.; Liu, H.D.; Zhang, J.W.; Zhao, B. Morphological and physiological characteristics of corn (Zea mays L.) roots from cultivars with different yield potentials. Eur. J. Agron. 2012, 38, 54–63. [Google Scholar] [CrossRef]
  31. Dong, Q.; Dang, T.; Guo, S.; Hao, M. Effect of different mulching measures on nitrate nitrogen leaching in spring maize planting system in south of Loess Plateau. Agric. Water Manag. 2019, 213, 654–658. [Google Scholar] [CrossRef]
  32. Kandeler, E.; Gerber, H. Short-term assay of soil urease activity using colorimetric determination of ammonium. Biol. Fert. Soils 1988, 6, 68–72. [Google Scholar] [CrossRef]
  33. Marx, M.C.; Wood, M.; Jarvis, S.C. A microplate fluorimetric assay for the study of enzyme diversity in soils. Soil Biol. Biochem. 2001, 33, 1633–1640. [Google Scholar] [CrossRef]
  34. Stemmer, M. Multiple-substrate enzyme assays: A useful approach for profiling enzyme activity in soils? Soil Biol. Biochem. 2004, 36, 519–527. [Google Scholar] [CrossRef]
  35. Perucci, P.; Casuci, C.; Dumontet, S. An improved method to evaluate the o-diphenol oxidase activity of soil. Soil Biol. Biochem. 2000, 32, 1927–1933. [Google Scholar] [CrossRef]
  36. Shi, Z.J.; Lu, Y.; Xu, Z.G.; Fu, S.L. Enzyme activities of urban soils under different land use in the Shenzhen city, China. Plant Soil Environ. 2008, 54, 341–346. [Google Scholar] [CrossRef]
  37. Martinsen, V.; Alling, V.; Nurida, N.L.; Mulder, J.; Hale, S.E.; Ritz, C.; Rutherford, D.W.; Heikens, A.; Breedveld, G.D.; Cornelissen, G. pH effects of the addition of three biochars to acidic Indonesian mineral soils. Soil Sci. Plant Nutr. 2015, 61, 821–834. [Google Scholar] [CrossRef]
  38. Tang, J.W.; Bolstad, P.V.; Martin, J.G. Soil carbon fluxes and stocks in a Great Lakes forest chronosequence. Global Change Biol. 2009, 15, 145–155. [Google Scholar] [CrossRef]
  39. Johnson, M.S.; Webster, C.; Jassal, R.S.; Hawthorne, I.; Black, T.A. Biochar influences on soil CO2 and CH4 fluxes in response to wetting and drying cycles for a forest soil. Sci. Rep. 2017, 7, 6780. [Google Scholar] [CrossRef] [PubMed]
  40. Lech, M.; Fronczyk, J.; Radziemska, M.; Sieczka, A.; Sieczka, A.; Sieczka, A.; Sieczka, A. Monitoring of total dissolved solids on agricultural lands using electrical conductivity measurements. Appl. Ecol. Environ. Res. 2016, 14, 285–295. [Google Scholar] [CrossRef]
  41. Kurtulus, C.; Bozkurt, A. Yearly permanent variation of soil apparent electrical conductivity and water content. J. Food Agric. Environ. 2008, 6, 547–550. [Google Scholar]
  42. Bhardwaj, D.; Ansari, M.W.; Sahoo, R.K.; Tuteja, N. Biofertilizers function as key player in sustainable agriculture by improving soil fertility, plant tolerance and crop productivity. Microb. Cell Fact. 2014, 13, 66. [Google Scholar] [CrossRef] [PubMed]
  43. Wang, Y.S.; Liu, Y.S.; Liu, R.L.; Zhang, A.P.; Yang, S.Q.; Liu, H.Y.; Zhou, Y.; Yang, Z.L. Biochar amendment reduces paddy soil nitrogen leaching but increases net global warming potential in Ni ngxia irrigation, China. Sci. Rep. 2017, 7, 1592. [Google Scholar] [CrossRef] [PubMed]
  44. Zhao, Y.C.; Wang, P.; Li, J.L.; Chen, Y.R.; Ying, X.Z.; Liu, S.Y. The effects of two organic manures on soil properties and crop yields on a temperate calcareous soil under a wheat-maize cropping system. Eur. J. Agron 2009, 31, 36–42. [Google Scholar] [CrossRef]
  45. Yang, Q.Y.; Zhang, M.K. Effect of bio-organic fertilizers partially substituting chemical fertilizers on labile organic carbon and bacterial community of citrus orchard soils. Plant Soil 2023, 483, 255–272. [Google Scholar] [CrossRef]
  46. Tavakkoli, E.; Uddin, S.; Rengasamy, P.; McDonald, G.K. Field applications of gypsum reduce pH and improve soil C in highly alkaline soils in southern Australia’s dryland cropping region. Soil Use Manag. 2022, 38, 466–477. [Google Scholar] [CrossRef]
  47. Trasar-Cepeda, C.; Leirós, M.C.; Seoane, S.; Gil-Sotres, F. Limitations of soil enzymes as indicators of soil pollution. Soil Biol. Biochem. 2000, 32, 1867–1875. [Google Scholar] [CrossRef]
  48. He, Z.Q.; Honeycutt, C.W.; Griffin, T.S.; Larkin, R.P.; Halloran, J.M. Increases of soil phosphatase and urease activities in potato fields by cropping rotation practices. J. Food Agric. Environ. 2010, 8, 1112–1117. [Google Scholar] [CrossRef]
  49. Hikosaka, K.; Hirose, T. Photosynthetic nitrogen-use efficiency in evergreen broad-leaved woody species coexisting in a warm-temperate forest. Tree Physiol. 2000, 20, 1249–1254. [Google Scholar] [CrossRef]
  50. Durán, N.; Esposito, E. Potential applications of oxidative enzymes and phenoloxidase-like compounds in wastewater and soil treatment: A review. Appl. Catal. B Environ. 2000, 28, 83–99. [Google Scholar] [CrossRef]
  51. Insam, H. Developments in soil microbiology since the mid1960s. Geoderma 2001, 100, 389–402. [Google Scholar] [CrossRef]
  52. Toscano, G.; Colarieti, M.L.; Greco, G. Oxidative polymerisation of phenols by a phenol oxidase from green olives. Enzyme Microb Technol 2003, 33, 47–54. [Google Scholar] [CrossRef]
  53. Kumar, R.; Sarawgi, A.K.; Ramos, C.; Amarante, S.T.; Ismail, A.M.; Wade, L.J. Partitioning of dry matter during drought stress in rainfed lowland rice. Field Crops Res. 2006, 98, 455–465. [Google Scholar] [CrossRef]
  54. Abdukadier, K.; Chen, Y.; Liu, H.; Pan, J.; Li, X.; Lin, M.; Lu, W.; Bai, X.; Dong, X.; Li, S. Effects of subsoiling on the characteristics of morphological structure and biomass accumulation of sugar beet in long-term leaf cluster. Xinjiang Agric. Sci. 2022, 59, 2421–2430. [Google Scholar]
  55. Lv, F.L.; Hou, M.M.; Zhang, H.T.O.; Khan, A.; Ayaz, M.; Qiangjiu, C.R.; Hu, C.; Yang, X.Y.; Sun, B.H.; Zhang, S.L. Closing the nitrogen use efficiency gap and reducing the environmental impact of wheat-maize cropping on smallholder farms in the Guanzhong Plain, Northwest China. J. Integr. Agric. 2019, 18, 169–178. [Google Scholar] [CrossRef]
  56. Wen, S.Y.; Shi, N.; Lu, J.W.; Gao, Q.W.; Hu, W.R.; Cao, Z.D.; Lu, J.X.; Yang, H.B.; Gao, Z.Q. Continuous wavelet transform and back propagation neural network for condition monitoring chlorophyll fluorescence parameters Fv/Fm of rice leaves. Agriculture 2022, 12, 1197. [Google Scholar] [CrossRef]
  57. Li, Y.; He, N.P.; Hou, J.H.; Xu, L.; Liu, C.C.; Zhang, H.; Wang, Q.F.; Zhang, X.M.; Wu, X.Q. Factors influencing leaf chlorophyll content in natural forests at the biome scale. Front. Ecol. Evol. 2018, 6, 64. [Google Scholar] [CrossRef]
Figure 1. Effects of BOFs and the two densities on soil physical and chemical properties in 2019 and 2020. (a) Soil pH value, (b) soil electrical conductivity, (c) soil water content, and (d) soil biochar flux during 2019 and 2020. Different letters indicate significant differences between treatments at the p < 0.05 level at each DAS. Error bars represent standard deviations of means (n = 4).
Agronomy 13 02423 g001
Figure 2. Effects of BOFs and the two densities on soil nutrients in 2019 and 2020. (a) Total nitrogen content, (b) total organic matter content in the 0–60 cm soil layer, and (c) residual soil NO3-N contents in the 0–60 cm soil layer under different treatments. Different letters indicate significant differences between treatments at the p < 0.05 level at each DAS. Error bars represent standard deviations of means (n = 4).
Agronomy 13 02423 g002
Figure 3. Effects of BOFs and the two densities on soil enzyme activities in 2019 and 2020. (a) Soil urease activity, (b) soil α-xylosidase activity, (c) soil glucosidase activity, (d) soil polyphenol oxidase activity, and (e) soil catalase activity. Different letters indicate significant differences between treatments at the p < 0.05 level at each DAS. Error bars represent standard deviations of means (n = 4).
Agronomy 13 02423 g003
Figure 4. Effects of the application of BOFs and the two densities on the root activity of sugar beet for the years 2019 and 2020. Different letters indicate significant differences between treatments at the p < 0.05 level at each DAS. Error bars represent standard deviations of means (n = 4).
Agronomy 13 02423 g004
Figure 5. Effects of BOFs and density on dry matter and root-to-shoot ratio in 2019 and 2020. (a) Dry matter accumulation in shoots and (b) roots and (c) root-to-shoot ratio of sugar beet at different DAS in 2019 and 2020. Data are expressed as means ± standard deviations. Each color represents a treatment mean. Different letters indicate significant differences between treatments at the p < 0.05 level at each DAS. Error bars represent standard deviations of means (n = 4).
Agronomy 13 02423 g005
Figure 6. Effects of the application of BOFs and the two densities on the photosynthetic system for the years 2019 and 2020. (a) The maximum photosynthetic efficiency of photosystem II (Fv/Fm), (b) the chlorophyll II a content + chlorophyll II b content (Chl a + b), and (c) the activity of RuBP Carboxylase in sugar beet. Different letters indicate significant differences between treatments at the p < 0.05 level at each DAS. Error bars represent standard deviations of means (n = 4).
Agronomy 13 02423 g006
Table 1. The planting densities and fertilizer application rates for each treatment.
TreatmentsBOF
(t ha−1)
Density
(Plant ha−1)
N
(kg ha−1)
P2O5
(kg ha−1)
K2O
(kg ha−1)
D1B12.7580,000703535
D1B23.2580,000502525
D1B33.7580,000301515
D2B12.7590,000703535
D2B23.2590,000502525
D2B33.7590,000301515
Urea, diamine phosphate, and potassium sulfate were used as sources of N, P2O5, and K2O, respectively, supplied to the soil.
Table 2. Root Yield, Sugar Content, and Sugar Yield of Sugar Beet and Partial Factor Productivity of N (PFPN).
YearTreatmentYield
(t ha−1)
Sugar Content
(%)
Sugar Yield
(t ha−1)
PFPN
(kg kg−1)
2019D1B177.413 ± 0.467 e17.650 ± 0.029 b14.306 ± 0.104 c430.074 ± 2.470 e
D1B278.587 ± 0.622 d16.367 ± 0.052 e13.505 ± 0.129 d436.593 ± 3.293 d
D1B381.920 ± 0.696 c16.657 ± 0.004 d14.327 ± 0.113 c455.111 ± 3.683 c
D2B183.820 ± 0.112 b17.697 ± 0.040 a14.833 ± 0.050 b465.667 ± 0.624 b
D2B285.680 ± 0.661 a17.690 ± 0.033 a15.157 ± 0.106 a476.000 ± 3.674 a
D2B386.580 ± 0.509 a17.287 ± 0.057 c14.971 ± 0.105 ab481.000 ± 2.828 a
2020D1B176.267 ± 0.396 c17.633 ± 0.095 bc14.121 ± 0.094 b423.704 ± 2.095 c
D1B278.400 ± 1.188 c16.353 ± 0.085 e13.462 ± 0.224 c435.556 ± 6.285 c
D1B381.333 ± 1.726 b16.577 ± 0.081 d14.156 ± 0.340 b451.852 ± 9.132 b
D2B183.700 ± 1.470 ab17.800 ± 0.054 b14.899 ± 0.217 a465.000 ± 8.165 ab
D2B284.600 ± 0.735 a18.057 ± 0.054 a15.276 ± 0.175 a470.000 ± 4.082 a
D2B385.800 ± 1.122 a17.467 ± 0.107 c14.986 ± 0.105 a476.667 ± 6.236 a
Different letters indicate significant differences between the treatments at the significance level of p < 0.05 at each DAS. The error bars represent the standard deviations of the means (n = 4).
Table 3. Test of Interagent Effects.
DBD × B
FP2FP2FP2
Soil pH12.1420.005 *0.5038.1740.006 *0.5770.2430.7780.039
Soil electrical conductivity6.4640.026 *0.3507.3210.008 *0.55012.8270.001 *0.681
Water content109.7170.000 **0.90135.5160.000 **0.8596.6580.011 *0.526
Soil biochar flux8.6630.012 *0.4195.7150.018 *0.4882.2240.1490.272
Yield202.1560.000 **0.94424.2260.000 **0.8013.0660.0840.338
Sugar content821.7240.000 **0.986228.7110.000 **0.974203.9610.000 **0.971
Sugar yield531.8030.000 **0.9783.7400.0550.38420.6160.000 **0.775
PFPN202.1560.000 **0.94424.2260.000 **0.8013.0660.0840.338
The data in the table are based on 2019 and 2020 averages. * = significance at p < 0.05, ** = significance at p < 0.001.
Table 4. Simple effect analysis of soil electrical conductivity, water content, yield plant−1, sugar content, and sugar yield.
Soil Electrical ConductivityWater ContentSugar ContentSugar Yield
D1F15.57211.154375.78220.414
P0.000 **0.002 *0.000 **0.000 **
20.7220.6500.9840.773
D2F4.57632.01956.8903.942
P0.033 *0.000 *0.000 **0.048 *
20.4330.8420.9050.396
B1F18.42025.3777.389107.615
P0.001 *0.000 **0.019 *0.000 **
20.6060.6790.3810.900
B2F6.55717.015976.082343.863
P0.025 *0.001 **0.000 **0.000 **
20.3530.5860.9880.966
B3F7.14280.640245.175121.556
P0.020 *0.000 **0.000 **0.000 **
20.3730.8700.9540.910
The data in the table are based on 2019 and 2020 averages. * = significance at p < 0.05, ** = significance at p < 0.001.
Disclaimer/Publisher’s Note: The statements, opinions and data contained in all publications are solely those of the individual author(s) and contributor(s) and not of MDPI and/or the editor(s). MDPI and/or the editor(s) disclaim responsibility for any injury to people or property resulting from any ideas, methods, instructions or products referred to in the content.

