Article

Characteristics and Driving Factors of Precipitation-Use Efficiency across Diverse Grasslands in Chinese Loess Plateau

1
State Key Laboratory of Eco-Hydraulics in Northwest Arid Region of China, Xi’an University of Technology, Xi’an 710048, China
2
Shaanxi Forestry Survey and Planning Institute, Xi’an 710082, China
3
State Key Laboratory of Loess and Quaternary Geology, Institute of Earth Environment, Chinese Academy of Sciences, Xi’an 710061, China
4
National Observation and Research Station of Earth Critical Zone on the Loess Plateau, Xi’an 710061, China
*
Author to whom correspondence should be addressed.
Agronomy 2023, 13(9), 2296; https://doi.org/10.3390/agronomy13092296
Submission received: 1 July 2023 / Revised: 26 August 2023 / Accepted: 29 August 2023 / Published: 30 August 2023
(This article belongs to the Special Issue Advance in Grassland Productivity and Sustainability)

Abstract

:
Understanding the characteristics of the precipitation-use efficiency (PUE) of grassland ecosystems and its drivers is critical for predicting how ecosystem functions will respond to future climate change. In this study, we investigated several covarying biotic and abiotic factors (e.g., biomass, coverage, diversity, precipitation, temperature, and humid index (HI)) of 81 sites across a broad natural grassland gradient in the Loess Plateau of China to determine how PUE changes along a precipitation gradient and to assess the effects of biotic and abiotic factors on PUE. Our results showed that HI, below-ground biomass (BGB), vegetation coverage, and species diversity were the most important biotic factors in controlling PUE. HI had a higher positive indirect effect on PUE mainly through its influence on community characteristics. Our results suggest that precipitation and community characteristics are both important for the precipitation-use efficiency of natural grasslands across the arid and semiarid areas of the Loess Plateau. Additionally, improving the vegetation structure and increasing species diversity can help enhance the adaptability of grassland ecosystems to climate change.

1. Introduction

Precipitation is the most essential abiotic driver behind both ecosystem function and the biodiversity of terrestrial biomes [1,2,3]. It is especially true for arid and semiarid ecosystems, which account for roughly 41% of the earth’s land surface and provide habitat and ecological services to one-third of the world’s population [4,5]. In this regard, global climate change is of crucial importance to both policy makers and land managers because it is likely to produce more frequent extreme precipitation and drought events [6,7], which may in turn have an even greater impact on ecosystem processes and function [8,9]. The climate record shows that precipitation regimes change in relation to changing climate patterns, and that will have a strong impact or influence on latitudinal zones and vegetation types [10]. Vegetation types are correlated with a latitudinal zone; then a shift in precipitation will lead to a shift in vegetation zone, presumably creating biotic and/or abiotic constraints of some kind [11], for example, plant diversity, which in turn will have an impact on carbon cycling and presumably carbon sequestration [12].
It has been well documented that above-ground net primary productivity (ANPP) generally increased across ecosystem types with increasing mean annual precipitation (MAP) [13,14]. The largest grassland productivity is distributed in tropical grassland and savanna with a precipitation of 1000–1200 mm, with an average ANPP of 592.3 g m−2 yr−1, while the lowest grassland productivity is distributed in tundra and desert grasslands with a precipitation below 300 mm, with an average ANPP of 82.0 and 115.7 g m−2 yr−1, respectively [14]. Moreover, ANPP is more sensitive to spatial variation than to interannual precipitation fluctuations, and the slopes between ANPP and annual precipitation in temporal variations are much gentler than those along the spatial gradient of precipitation [14]. However, the response of ANPP to the spatial variation in precipitation varies across ecosystems, with the larger slopes for ANPP and precipitation occurring in the desert grasslands and the lower slopes occurring at the tropical grasslands [15]. The relationship between precipitation and the spatiotemporal pattern of ANPP in global arid and semiarid regions remains to be fully understood [16].
Precipitation-use efficiency (PUE), defined as the ratio of ANPP to precipitation, is wildly used as an effective indicator to assess the response of the primary productivity of both arid and semiarid ecosystems to spatiotemporal changes in precipitation [15,17]. Previous studies have indicated that PUE can be influenced by multiple factors, including climate, vegetation features, edaphic condition, and biogeochemical constraints [18,19,20]. For example, the temporal variation of PUE was mainly controlled by precipitation in Eurasian grasslands, with PUE declining with decreasing mean annual precipitation (MAP) but rising slightly at the dry end of the gradient [19]. In addition, PUE in arid regions was mainly affected by precipitation and soil nutrition via their effects on plant productivity, while PUE in semiarid regions was mainly influenced by precipitation, temperature, and soil organic carbon via their effects on vegetative coverage [20]. Moreover, communities with higher plant diversity and functional groups were prone to have greater ANPP and PUE [21].
Because the relative importance of these abiotic and biotic factors and their interactions in relation to the spatial patterns of PUE has not been fully understood yet, this study was designed to investigate PUE changes along a precipitation gradient and to explore underlying mechanisms. Using 81 natural arid and semiarid ecosystem sites across the Loess Plateau of China, we focus on the following four research questions: (1) What is the spatial pattern of PUE in different grassland types along the precipitation gradient? (2) What is the relative importance of these abiotic and biotic factors and their interactions in relation to the spatial patterns of PUE?

2. Materials and Methods

2.1. Study Area

The Loess Plateau is located in northern China, covering an area of approximately 640,000 km2. The region is a transition zone between subhumid climate and semiarid to arid climate characterized by a large south–north precipitation gradient with a mean annual temperature (MAT) range of 3 to 12 °C and a mean annual precipitation (MAP) that ranges from 100 to 800 mm. The elevation reaches between 500 and 2500 m [22]. Except for the most humid southeastern part, which is dominated by forests, over 80% of the Loess Plateau is covered by arid and semiarid grassland ecosystems; the zonal grassland types are meadow grassland, typical temperate grassland, and desert grassland, distributed from south to north [22]. Meadow grassland (MG) in the southern mountainous region comprises herbaceous perennial mesophytic and xeromesophytic species, such as Bothriochloa ischaemum (L.) Keng, Artemisia giraldii Pamp., and Artemisia sacrorum Ledeb.; temperate grassland (TG) stretches across the southern hilly loess part of the region, and is commonly dominated by xeromesophytic and mesoxerophytic species, such as Stipa bungeana Trin., Stipa grandis P. Smirn., and Lespedeza davurica (Laxm.) Schindl.; desert grassland (DG) occurs in the central and northern regions, where xerophytic and strongly xerophytic species dominate, such as Agropyron cristatum (Linn.) Gaertn., Cleistogenes songorica and Agriophyllum squarrosum (L.) Moq., and Artemisia ordosica Krasch. In addition, nonzonal grassland types (such as marshy meadow and warm-temperate herbosa) are scattered across Liupan Mountains to the south and along the banks of the Yellow River in the northern reaches of the Loess Plateau [23].

2.2. Plot Arrangement and Biomass Measurement

We conducted a plot survey and sample collection on the Loess Plateau during the peak period of grassland growth in July and August 2011. There were a total of 81 grass sites, which included 24 meadow grasslands, 26 temperate grasslands, and 31 desert grasslands (Table S1). In each sampling site, we set up 10 quadrats of 1 m × 1 m along a linear transect of 100 to 200 m, and investigated the grassland coverage, height, species composition, individuals’ number, etc., in each quadrat. The majority of plant species identification was performed in the field. Unidentified species were collected and dried with a plant press and later identified by plant taxonomists. In the field, the plant species were mainly judged by observing the characteristics of the plant shape, leaf shape, and flowers. Specifically, we first observed the overall shape of the plant, such as plant height and shape; then we observed the shape, size, texture, and edge of the leaves. In addition, the shape and color of flowers and fruits can also help to determine the plant species. The morphological recognition features of various plant species can be referred to in Flora of China [24]. In addition, we measured the above-ground and below-ground biomass (BGB) of grassland in 5 selected quadrats. BGB was collected with a soil drill with a diameter of 9 cm, and the sampling depth was 0–100 cm. More detailed investigation and sampling methods can be referred to in our published literature [22].

2.3. ANPP

ANPP was regarded as the peak above-ground biomass (AGB) during the growing season [20,25]. The above-ground parts of plants, inclusive of both live biomass and standing dead biomass produced in the current year, were cut with scissors, and then dried in an oven at 60 °C for 48 h and weighed. The average biomass of 5 quadrats in each site was calculated to represent the ANPP value of the sampling site.
A N P P = 1 5 A G B 5

2.4. Plant Diversity

The richness index (R), Shannon–Wiener diversity index (H), and the evenness index (E) for the grassland communities were calculated as follows [22]:
Richness index (R):
R = S
Shannon–Wiener diversity index (H):
H = i = 1 s ( P i ln P i )
Evenness index (E):
E = H ln S
Relative importance value index of the i species (Pi):
P i = R H i + R A i + R B i 3
where S stands for all the species in the plot; H is the Shannon–Wiener diversity index; and RHi, RAi, and RBi are the relative height, relative abundance, and relative biomass of i species in each plot.

2.5. Precipitation-Use Efficiency

PUE was calculated directly as the ratio of ANPP to the mean annual precipitation (MAP) [18].
P U E = A N P P M A P

2.6. Humidity Index (HI)

In the study, HI was used as a bioclimatic index to characterize the impact of a climate factor on grassland productivity and PUE [22]:
H I = M A P M A T + 10
where MAT and MAP are mean annual temperature and mean annual precipitation, respectively.

2.7. Climatic Data

Climatic data from 1970 to 2010 obtained from the records of 26 regional meteorological stations were used to establish the relationship between MAT and MAP at varying latitudes, longitudes, and altitudes. The details of station information are supplied in Table S2. This information was then extrapolated to the 81 survey sites. The selected meteorological stations were roughly evenly distributed near the sampling sites (Figure 1). The nearest distance between the sampling sites and the adjacent meteorological stations was about 10 km, the farthest distance was 113 km, and the average distance was 53 km, which generally reflected the temperature and rainfall conditions around the sample sites. The temperature and precipitation of the meteorological stations were observed continuously 24 h a day by automatic observation equipment. All meteorological data were obtained from the China Meteorological Data Sharing Service System (http://data.cma.cn/ (accessed on date 20 July 2021),). The formula for the calculation is as follows:
M A P = 0.026 A + 40.619 L O N 93.027 L A T 591.203
A T = 0.005 A 0.350 L O N 0.361 L A T + 65.723
where A, LE, and LN are altitude (m) and longitude (E) and latitude (N), respectively.

2.8. Data Analysis

First, we used descriptive statistics to show the basic community characteristics of the grassland ecosystem in the study area. Then we analyzed the variations of PUE, ANPP, BGB, grassland community coverage, height, R, H, and E among different sites and grassland types using one-way analysis of variation (ANOVA). Next, regression analysis was used to fit the relationship between PUE and grassland community parameters and to determine the best fitting model. We also investigated the correlation of all the biotic and abiotic variables using Pearson’s test. To explore the key influence factors on PUE, we performed stepwise regression to detect those factors determining PUE. In addition, path analysis was performed to further determine the direct and indirect effects of a controlling factor on PUE. All statistical analyses were conducted using SPSS 22.0 (SPSS Inc., Chicago, IL, USA) except for the path analysis performed in AMOS 25.0 software.

3. Results

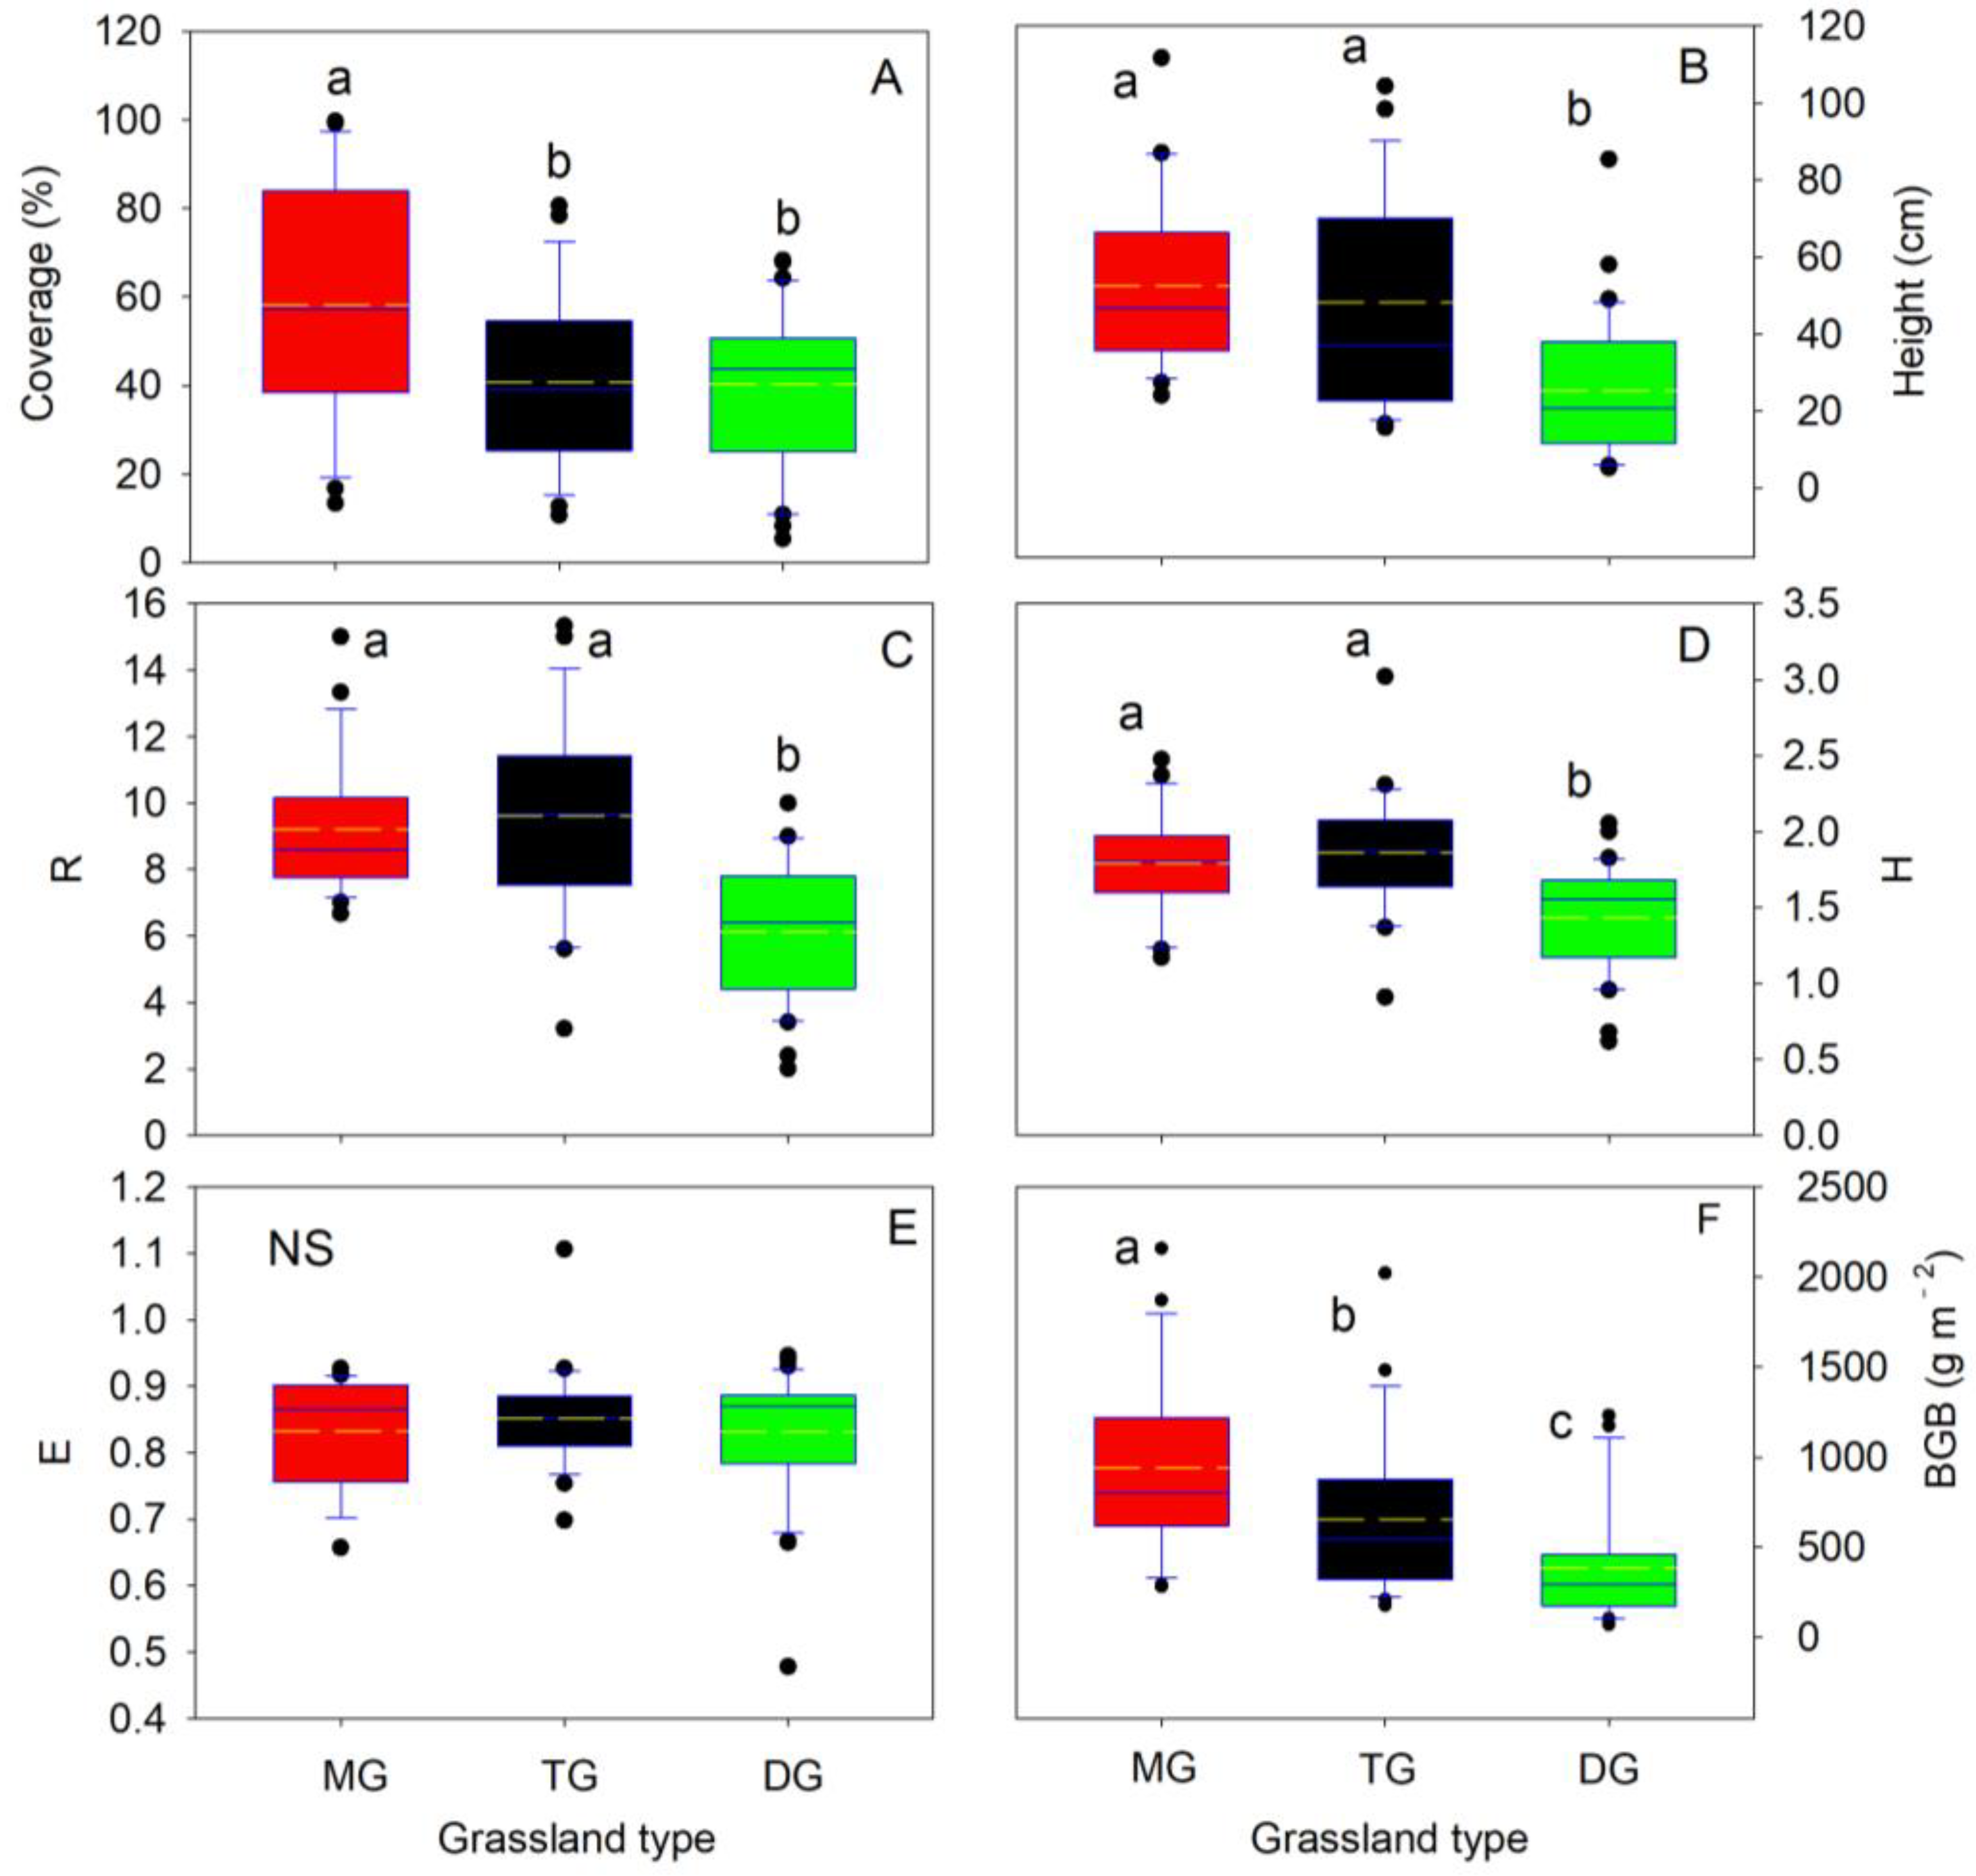
3.1. Descriptions of Grassland Community Characteristics

The characteristics of the grassland community at the 81 sample sites in the study area showed significant differences (p < 0.0001). The average ANPP, BGB, coverage, and height were 143.29 g m2 yr1, 634.77 g m2, 45.72%, and 40.71 cm, respectively, and the variation ranges were 13.90–414.26 g m2 yr1, 69.56–2158.06 g m2, 5.33–99.60%, and 5.20–111.67 cm; the mean values of R, H, and E were 8.16, 1.68, and 0.84, and the ranges were 2.00–15.33, 0.62–3.02, and 0.48–1.11, respectively. Moreover, the average PUE was 0.36 g m2 mm1, and the variation range was 0.06–0.96 g m2 mm1 (Table 1).
MG had the highest ANPP and BGB among the three grassland types, and the lowest was that of DG (Figure 2 and Figure 3F). MG had higher community coverage than that of either TG or DG, with the coverage in both TG and DG showing no significant difference (p > 0.05) (Figure 3A). Although the community height in both MG and TG was higher than that of DG (p < 0.05) the difference between them was nonsignificant (p > 0.05) (Figure 3B). Similarly, both MG and TG had more R and H than DG (Figure 3C,D), while the difference in E in the three grassland types was nonsignificant (p > 0.05) (Figure 3E).

3.2. Variations in PUE among Grassland Types

On the Loess Plateau of China, different grassland types have different PUEs (p < 0.05) (Figure 4). The PUE value for MG was higher than that for either TG or DG, while the PUE values for TG and DG showed no significant difference (p > 0.05) (Figure 4). The PUE values for MG, TG, and DG were 0.50, 0.33, and 0.27 g m−2 mm−1, respectively.

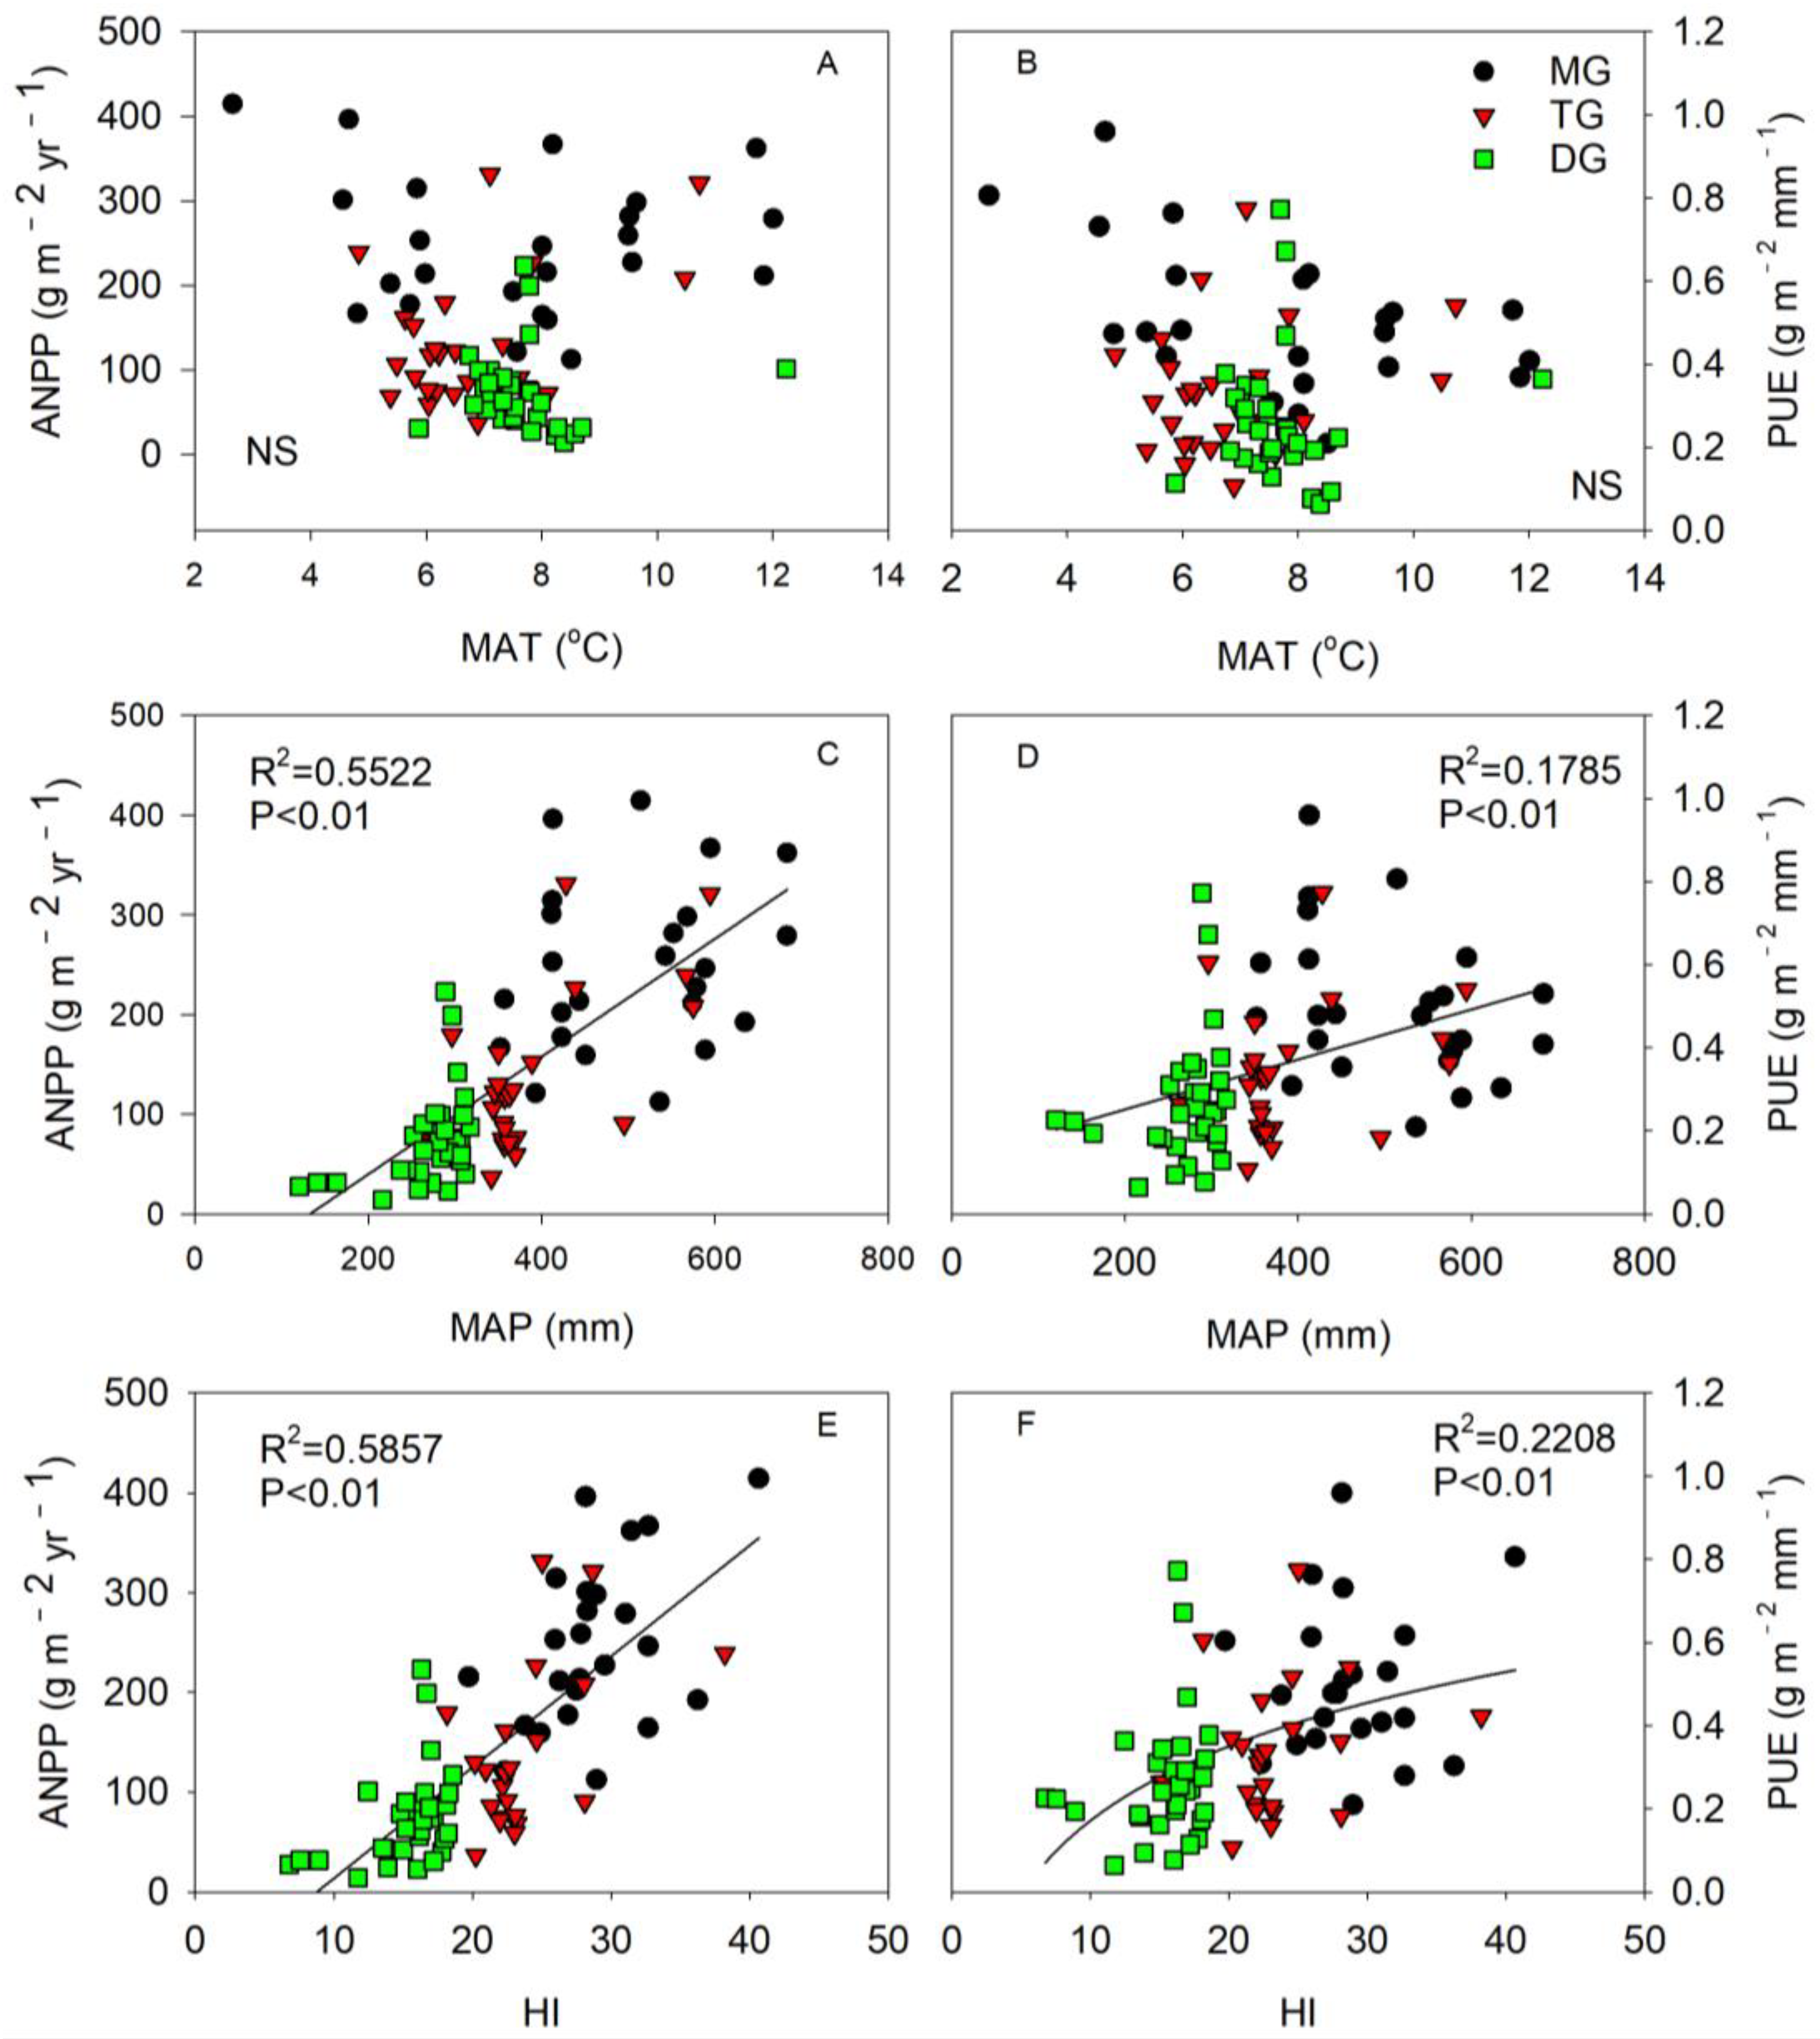
3.3. Spatial Relationship between ANPP, PUE, and Climate Factors

The ANPP and PUE of the grassland in the Chinese Loess Plateau did not show a significant increase trend with the increase in MAT (Figure 5A,B), but they increased significantly with the increase in MAP and HI (p < 0.01) (Figure 5C–F). Moreover, HI showed closer correlations with ANPP and PUE than MAP (Table S3).

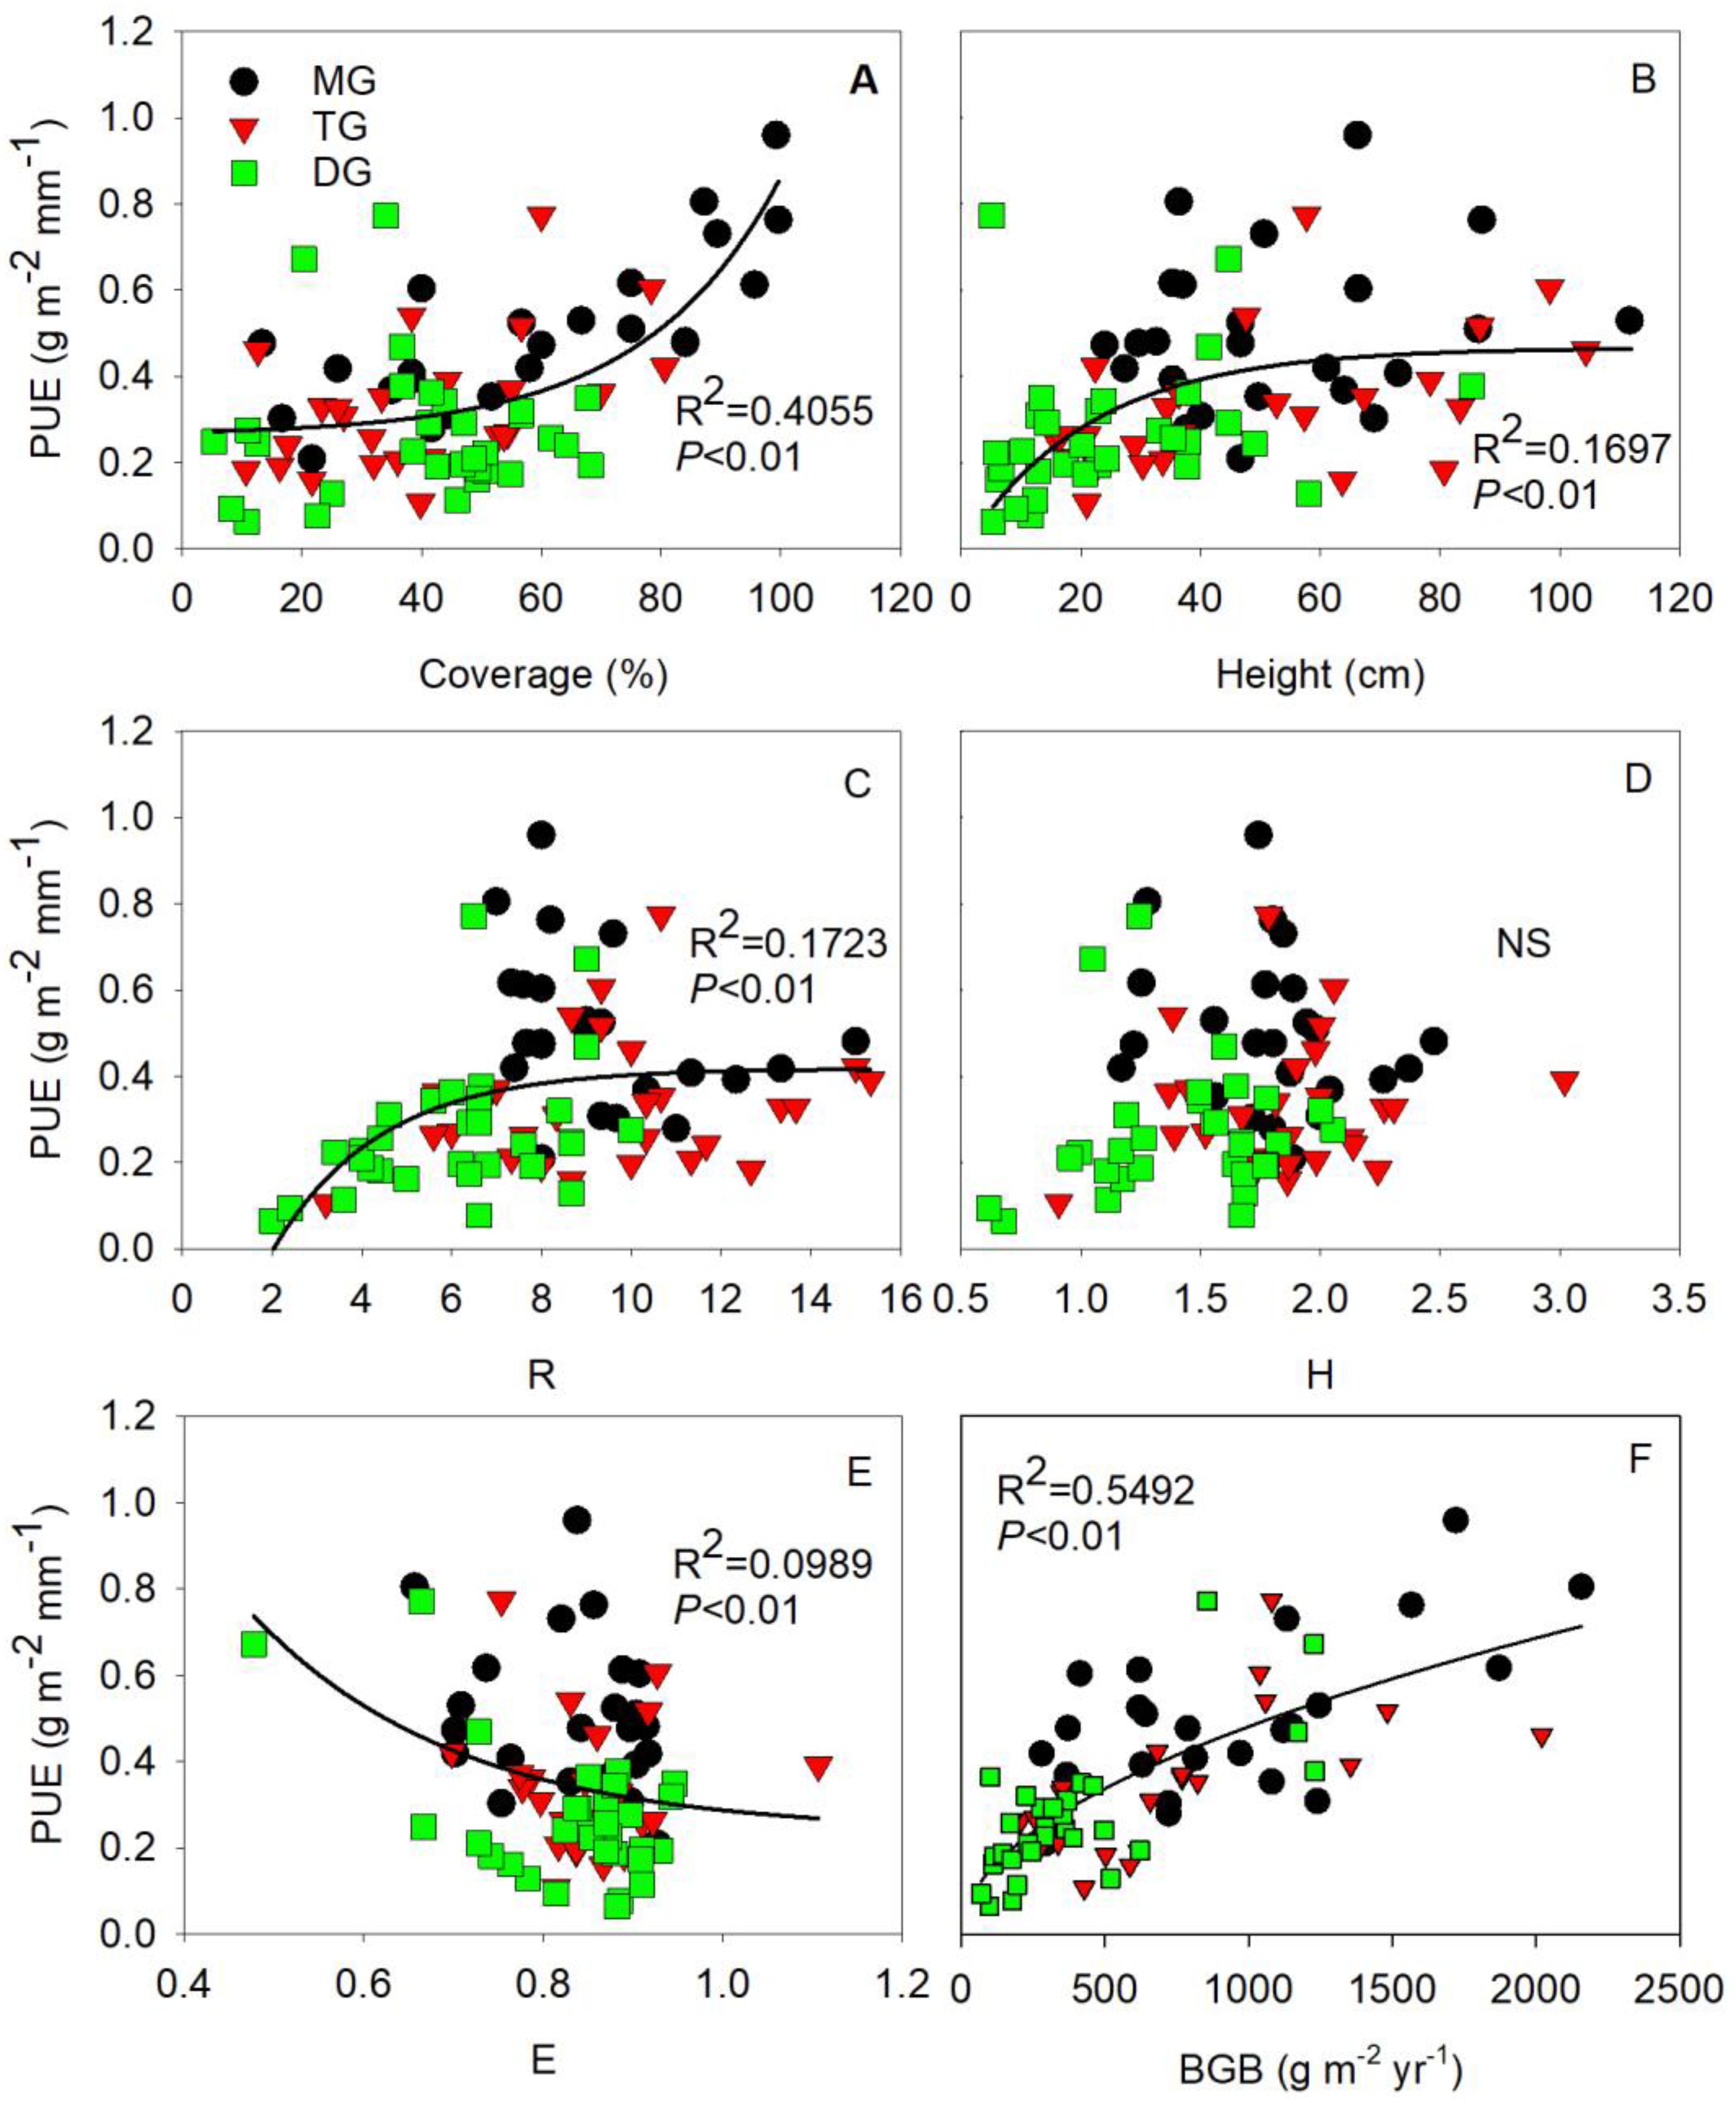
3.4. Spatial Relationship between PUE and Plant Community Structure

PUE increased significantly with the increases in grassland community coverage and BGB (p < 0.01) (Figure 6A,F). It increased with both height and the richness index (R) and, following that relationship, gradually tended to stabilize as PUE increased (Figure 6B,C). There was a nonsignificant relationship with the Shannon–Wiener diversity index (H) (Figure 6D). PUE decreased slightly with evenness (E) (Figure 6E). Correlation analysis revealed that coverage, height R, and BGB were significantly positively correlated with PUE (p < 0.05), while E showed a significantly negative correlation with PUE (p < 0.05) (Table S3).

3.5. Factors Affecting PUE

Stepwise regression revealed that the grass community characteristics of BGB, coverage, and E were the main factors affecting PUE (Table 2). Additionally, the climate variable of HI also had a significant impact on PUE. BGB alone can explain 54.3% of PUE. The linear regression equation was as follows:
PUE = 0.0002 × BGB + 0.003 × coverage + 0.071 × E + 0.005 × HI − 0.045, p < 0.0001, R2 = 0.675
Path analysis further indicated the direct and indirect effects of each control variable on the change of PUE. BGB had the strongest direct positive effect on PUE, while the second was coverage, followed by E and HI (Figure 7). In addition, we found that HI had a higher positive indirect effect on PUE values mainly through its influence on BGB and coverage (Figure 7), resulting in HI exhibiting significant positive correlations with PUE (p < 0.01) (Table S3).

4. Discussion

4.1. Characteristics of ANPP and PUE of Grasslands on the Loess Plateau

In this study, the average ANPP of the grasslands on the Loess Plateau was 143.3 g m−2 yr−1 (Table 1), which was slightly higher than the global average ANPP of desert grasslands (115.7 g m−2 yr−1), but significantly lower than the global average ANPP of temperate grasslands (240.6 g m−2 yr−1) [14]. Compared with the temperate grasslands in other regions of the world, the grasslands on the Chinese Loess Plateau have relatively low precipitation, with MAP of about 400 mm (Table S2), which is not conducive to the formation of high productivity [26]. In addition, the soil nutrients in the Loess Plateau are relatively poor, with a soil organic matter content of less than 1%, which limits the improvement of grassland productivity [27]. Moreover, the grassland ecosystem in this region has been under high pressure owing to, for example, overgrazing and excessive digging of herbs, for a long time, also resulting in low ANPP [28].
The PUE values for grasslands on the Loess Plateau of China (0.06–0.96 g m−2 mm−1) are within the range (0.05–1.81 g m−2 mm−1) of the global arid and semiarid grassland ecosystems, and also close to the values (0.13–0.64 g m−2 mm−1) of typical Chinese grasslands [18]. Moreover, DG and TG have significantly lower PUE than that for MG in the study region (Figure 2), which is consistent with the results of a previous study [26]. Low rainfall, high temperature, and low nutrient combined cause the low ANPP and PUE in desert and temperature grassland ecosystems [25,29]. Meanwhile, lower vegetation coverage and a compact soil structure will also induce precipitation lost with soil evaporation and surface runoff, leading to less precipitation available to plants, and cause low PUE in DG and TG [15,18].

4.2. Effects of Climate Factors on ANPP and PUE

Our results support the notion that both ANPP and PUE were positively correlated with MAP and HI across grassland ecosystems (Figure 5C,D), while MAT showed no significant relationship with ANPP and PUE (Figure 5A,B). In Inner Mongolia, from the western desert to the eastern meadow steppe, PUE showed an increasing trend with MAP along the regional scale precipitation gradient [25]. However, more studies reported that PUE decreased or first increased and then decreased with the increase in precipitation [15,30,31]. In the Eurasian Steppe, PUE showed a prominent unimodal pattern along a precipitation gradient of 70–1130 mm, with the peaks of MAP at 280 mm [15]. However, other researchers reported the PUE peaks of MAP at 400 mm [32] or more [33]. The different ranges of precipitation gradients in different studies may partly explain the discrepancy among the results [31]. Moreover, the opposing relationships of PUE with precipitation observed on either side of the peak PUE may reflect the contrasting limitations on vegetation growth in different precipitation gradients [32]. In arid and semiarid temperate grasslands (MAP < 600 mm) where plant growth is usually limited by precipitation, PUE generally increases with precipitation [18,25]. Meanwhile, in humid ecosystems, other factors, such as soil nutrients and soil moisture, may have constrained the responses of plant production to increased MAP, thus resulting in lower PUE [32,34].
Temperature is also an important factor affecting the formation of plant productivity. On the global scale, grassland ANPP has a significant positive correlation with temperature [14]. On the one hand, the suitable high temperature prolongs the length of the growing season and promotes the accumulation of ANPP in grassland ecosystems [35]. On the other hand, higher temperature helps to maintain the activity of microorganisms, promote the mineralization and decomposition of soil organic matter, and improve the availability of nutrient resources, thus enhancing ANPP [36]. However, ANPP and PUE in this study did not show a significant upward trend with MAT (Figure 5A,B), not only because the temperature was not the limiting factor of ANPP in the arid and semiarid grasslands, but also because this related to the narrow temperature gradient in this study. In addition, a recent study found that the temperature acted with different mechanisms on the productivity of different grassland types, with increased temperature accelerating soil nutrient loss and reducing productivity in temperate grasslands while improving the soil nutrient status and increasing plant productivity in alpine grasslands [37]. The effect of MAT on ANPP and PUE may be offset across different grassland ecosystems. Moreover, our results were supported by a previous study that concluded that temperature had a negligible effect on ANPP in grassland ecosystems [38].
It can be seen from the calculation formula that HI reflects the combined influence of MAP and MAT on ANPP and PUE. Although there was a high positive correlation between HI and MAP (Table S3), HI presented a higher interpretation of ANPP and PUE than that of MAP in the study (Figure 5E,F). The path analysis also showed that HI had both direct and indirect effects on PUE. It could improve PUE by enhancing the BGB, community coverage, and diversity of a grassland ecosystem (Figure 7). Our previous study also found that there was a significant positive correlation between HI and grassland diversity [22].

4.3. Effects of Community Characteristics on PUE

Not only was PUE affected by climatic factors, but also the community characteristics, such as BGB, coverage, and diversity, played a key role in the study region (Figure 7). BGB and ANPP showed a consistent upward trend along the precipitation gradient, with a significant positive correlation of 0.72 (p < 0.01) (Table S3). In arid and semiarid grassland ecosystems, increasing precipitation not only alleviated water stress and directly promoted above- and below-ground productivity, but also indirectly promoted plant biomass and increased PUE by increasing community diversity and improving soil nutrient availability [37]. As a primary driver of variation in ecosystem function, vegetation coverage had a positive effect on ANPP and PUE [21,39]. Hu et al. (2010) [18] concluded that vegetation coverage significantly affected the spatial variation of PUE, which probably accounts for the positive relationship between PUE and MAP [18]. Jiang et al. (2017) [21] reported that communities with high coverage, species diversity, and nutrient content, but low soil bulk density, presented the highest PUE in northern Tibet, China [21]. This is consistent with the hypothesis that vegetation constraints may result in low PUE in dry areas [33]. Furthermore, high vegetation coverage would greatly reduce runoff and help conserve more water in the soil for plant growth [40]. In keeping with this scenario, as vegetation coverage increases, water losses (evaporation and runoff) decrease and plant uptake increases [41].
In addition, species diversity also played an important role in improving the ANPP and PUE of grassland ecosystems. A large number of studies found positive relationships between species diversity and ANPP [12,42]. Vermeire et al. (2009) elucidated that ANPP and PUE were responsive to plant function type composition relative to the amount and seasonal distribution of precipitation [43]. Jiang et al. (2017) reported that total coverage, coverage of forbs and sedges, and species diversity jointly determine PUE, accounting for 47.6% of the total variation in PUE [21]. Our findings highlight the importance of species diversity for maintaining ecosystem function in grasslands and provide further empirical evidence of its important role in providing key ecosystem services linked to ANPP. Additionally, maintaining and enhancing vegetation coverage and species diversity could reduce the adverse effects of climate change on ecosystem functioning in grassland ecosystems.
Apart from those factors discussed above, there are other factors that have a significant effect on PUE due to their higher remainder factors. For example, soil characteristics, such as water-holding capacity, texture, permeability, and depth, are major determinants of soil water availability and have important effects on site-level PUE [15]. Furthermore, abiotic–biotic interactions, such as the relationship between plant water use efficiency and ecosystem transpiration/evaporation ratio, might be important in producing a common PUE rather than species traits alone [30].

5. Conclusions

Our study illustrates that grassland ANPP, species diversity, and PUE increased significantly across the precipitation gradient on the Chinese Loess Plateau. MG had the highest ANPP and PUE among the three grassland types, and the lowest were that of DG. Both MG and TG had higher coverage, plant diversity, and BGB than that in DG. BGB, vegetation coverage, and diversity showed significantly positive correlations with the spatial distribution of PUE. HI performed better than MAP in explaining the variations of PUE, which mainly affected PUE indirectly through community characteristics, such as BGB, coverage, and diversity. Our study highlights the need for further studies to clarify the distinct mechanisms at work in soil characteristics and abiotic–biotic interactions in controlling PUE on both local and regional scales. The results have important implications for the management and conservation of grasslands in the context of the ongoing climate change.

Supplementary Materials

The following supporting information can be downloaded at https://www.mdpi.com/article/10.3390/agronomy13092296/s1, Table S1: Geographical location, meteorology and vegetation community characteristics of 81 sample plots; Table S2: Location, altitude, annual average rainfall and temperature of 26 weather stations in the study region; Table S3: Correlation analysis of biological and abiotic factors in this study.

Author Contributions

Investigation, H.Q., P.X., J.P. and B.W.; Writing—original draft, Z.R.; Writing—review & editing, K.W. All authors have read and agreed to the published version of the manuscript.

Funding

This study was funded by the National Natural Science Foundation of China (42177339, U2243225) and Shaanxi Province Science and Technology Activities for Overseas Students Selected Funding Project (2021015).

Data Availability Statement

Not applicable.

Conflicts of Interest

The authors declare no conflict of interest.

References

  1. Hu, Y.; Li, X.; Guo, A.; Yue, P.; Guo, X.; Lv, P.; Zhao, S.; Zuo, X. Species diversity is a strong predictor of ecosystem multifunctionality under altered precipitation in desert steppes. Ecol. Indic. 2022, 137, 108762. [Google Scholar] [CrossRef]
  2. Korell, L.; Auge, H.; Chase, J.M.; Harpole, W.S.; Knight, T.M. Responses of plant diversity to precipitation change are strongest at local spatial scales and in drylands. Nat. Commun. 2021, 12, 2489. [Google Scholar] [CrossRef] [PubMed]
  3. Liu, H.; Song, X.; Wang, R. Quantitative Impacts of Climate Change and Human Activities on Grassland Productivity in Otog Banner, China from 2001 to 2020. Agronomy 2023, 13, 1140. [Google Scholar] [CrossRef]
  4. Reynolds, J.F.; Smith, D.M.S.; Lambin, E.F.; Turner, B.L.; Mortimore, M.; Batterbury, S.P.J.; Downing, T.E.; Dowlatabadi, H.; Fernández, R.J.; Herrick, J.E.; et al. Global Desertification: Building a Science for Dryland Development. Science 2007, 316, 847–851. [Google Scholar] [CrossRef]
  5. Wang, C.; Wang, X.; Liu, D.; Wu, H.; Lü, X.; Fang, Y.; Cheng, W.; Luo, W.; Jiang, P.; Shi, J.; et al. Aridity threshold in controlling ecosystem nitrogen cycling in arid and semi-arid grasslands. Nat. Commun. 2014, 5, 4799. [Google Scholar] [CrossRef]
  6. Asadieh, B.; Krakauer, N.Y. Global trends in extreme precipitation: Climate models versus observations. Hydrol. Earth Syst. Sci. 2015, 19, 877–891. [Google Scholar] [CrossRef]
  7. Chiang, F.; Mazdiyasni, O.; AghaKouchak, A. Evidence of anthropogenic impacts on global drought frequency, duration, and intensity. Nat. Commun. 2021, 12, 2754. [Google Scholar] [CrossRef]
  8. Li, C.; Fu, B.; Wang, S.; Stringer, L.C.; Wang, Y.; Li, Z.; Liu, Y.; Zhou, W. Drivers and impacts of changes in China’s drylands. Nat. Rev. Earth Environ. 2021, 2, 858–873. [Google Scholar] [CrossRef]
  9. Zhang, Y.; Keenan, T.F.; Zhou, S. Exacerbated drought impacts on global ecosystems due to structural overshoot. Nat. Ecol. Evol. 2021, 5, 1490–1498. [Google Scholar] [CrossRef]
  10. Beigaitė, R.; Tang, H.; Bryn, A.; Skarpaas, O.; Stordal, F.; Bjerke, J.W.; Žliobaitė, I. Identifying climate thresholds for dominant natural vegetation types at the global scale using machine learning: Average climate versus extremes. Glob. Chang. Biol. 2022, 28, 3557–3579. [Google Scholar] [CrossRef]
  11. Huang, E.; Chen, Y.; Fang, M.; Zheng, Y.; Yu, S. Environmental drivers of plant distributions at global and regional scales. Glob. Ecol. Biogeogr. 2021, 30, 697–709. [Google Scholar] [CrossRef]
  12. Chen, S.; Wang, W.; Xu, W.; Wang, Y.; Wan, H.; Chen, D.; Tang, Z.; Tang, X.; Zhou, G.; Xie, Z.; et al. Plant diversity enhances productivity and soil carbon storage. Proc. Natl. Acad. Sci. USA 2018, 115, 4027–4032. [Google Scholar] [CrossRef]
  13. Wang, C.; Vera-Vélez, R.; Lamb, E.G.; Wu, J.; Ren, F. Global pattern and associated drivers of grassland productivity sensitivity to precipitation change. Sci. Total Environ. 2022, 806, 151224. [Google Scholar] [CrossRef] [PubMed]
  14. Sun, Y.; Yang, Y.; Zhao, X.; Tang, Z.; Wang, S.; Fang, J. Global patterns and climatic drivers of above- and belowground net primary productivity in grasslands. Sci. China Life Sci. 2021, 64, 739–751. [Google Scholar] [CrossRef] [PubMed]
  15. Zhang, T.; Yu, G.; Chen, Z.; Hu, Z.; Jiao, C.; Yang, M.; Fu, Z.; Zhang, W.; Han, L.; Fan, M.; et al. Patterns and controls of vegetation productivity and precipitation-use efficiency across Eurasian grasslands. Sci. Total Environ. 2020, 741, 140204. [Google Scholar] [CrossRef]
  16. Knapp, A.K.; Ciais, P.; Smith, M.D. Reconciling inconsistencies in precipitation–productivity relationships: Implications for climate change. New Phytol. 2017, 214, 41–47. [Google Scholar] [CrossRef]
  17. Liu, X.; Lai, Q.; Yin, S.; Bao, Y.; Qing, S.; Bayarsaikhan, S.; Bu, L.; Mei, L.; Li, Z.; Niu, J.; et al. Exploring grassland ecosystem water use efficiency using indicators of precipitation and soil moisture across the Mongolian Plateau. Ecol. Indic. 2022, 142, 109207. [Google Scholar] [CrossRef]
  18. Hu, Z.; Guirui, Y.; Jiangwen, F.; Huaping, Z.; Shaoqiang, W.; Shenggong, L. Precipitation-use efficiency along a 4500-km grassland transect. Glob. Ecol. Biogeogr. 2010, 19, 842–851. [Google Scholar] [CrossRef]
  19. Zhang, T.; Chen, Z.; Zhang, W.; Jiao, C.; Yang, M.; Wang, Q.; Han, L.; Fu, Z.; Sun, Z.; Li, W.; et al. Long-term trend and interannual variability of precipitation-use efficiency in Eurasian grasslands. Ecol. Indic. 2021, 130, 108091. [Google Scholar] [CrossRef]
  20. Zhou, T.; Liu, M.; Sun, J.; Li, Y.; Shi, P.; Tsunekawa, A.; Zhou, H.; Yi, S.; Xue, X. The patterns and mechanisms of precipitation use efficiency in alpine grasslands on the Tibetan Plateau. Agric. Ecosyst. Environ. 2020, 292, 106833. [Google Scholar] [CrossRef]
  21. Jiang, Y.; Zhang, Y.; Zhu, J.; Tao, J.; Zhang, T.; Xi, Y. Effects of community structure on precipitation-use efficiency of grasslands in northern Tibet. J. Veg. Sci. 2017, 28, 281–290. [Google Scholar] [CrossRef]
  22. Deng, L.; Wang, K.; Li, J.; Zhao, G.; Shangguan, Z. Effect of soil moisture and atmospheric humidity on both plant productivity and diversity of native grasslands across the Loess Plateau, China. Ecol. Eng. 2016, 94, 525–531. [Google Scholar] [CrossRef]
  23. Wang, K.; Li, J.; Shangguan, Z. Biomass Components and Environmental Controls in Ningxia Grasslands. J. Integr. Agric. 2012, 11, 2079–2087. [Google Scholar] [CrossRef]
  24. Editorial Committee of Flora of China, Chinese Academy of Sciences. Flora of China; Science Press: Beijing, China, 2004. [Google Scholar]
  25. Bai, Y.; Wu, J.; Xing, Q.; Pan, Q.; Huang, J.; Yang, D.; Han, X. Primary production and rain use efficiency across a precipitation gradient on the Mongolia Plateau. Ecology 2008, 89, 2140–2153. [Google Scholar] [CrossRef]
  26. Jia, X.; Xie, B.; Shao, M.a.; Zhao, C. Primary Productivity and Precipitation-Use Efficiency in Temperate Grassland in the Loess Plateau of China. PLoS ONE 2015, 10, e0135490. [Google Scholar] [CrossRef]
  27. Liu, Z.; Shao, M.a.; Wang, Y. Effect of environmental factors on regional soil organic carbon stocks across the Loess Plateau region, China. Agric. Ecosyst. Environ. 2011, 142, 184–194. [Google Scholar] [CrossRef]
  28. Wang, K.; Deng, L.; Ren, Z.; Li, J.; Shangguan, Z. Grazing exclusion significantly improves grassland ecosystem C and N pools in a desert steppe of Northwest China. Catena 2016, 137, 441–448. [Google Scholar] [CrossRef]
  29. Zhang, C.; Lu, D.; Chen, X.; Zhang, Y.; Maisupova, B.; Tao, Y. The spatiotemporal patterns of vegetation coverage and biomass of the temperate deserts in Central Asia and their relationships with climate controls. Remote Sens. Environ. 2016, 175, 271–281. [Google Scholar] [CrossRef]
  30. Huxman, T.E.; Smith, M.D.; Fay, P.A.; Knapp, A.K.; Shaw, M.R.; Loik, M.E.; Smith, S.D.; Tissue, D.T.; Zak, J.C.; Weltzin, J.F.; et al. Convergence across biomes to a common rain-use efficiency. Nature 2004, 429, 651–654. [Google Scholar] [CrossRef]
  31. Yang, Z.; Collins, S.L.; Bixby, R.J.; Song, H.; Wang, D.; Xiao, R. A meta-analysis of primary productivity and rain use efficiency in terrestrial grassland ecosystems. Land Degrad. Dev. 2021, 32, 842–850. [Google Scholar] [CrossRef]
  32. Yang, Y.; Fang, J.; Fay, P.A.; Bell, J.E.; Ji, C. Rain use efficiency across a precipitation gradient on the Tibetan Plateau. Geophys. Res. Lett. 2010, 37, 78–82. [Google Scholar] [CrossRef]
  33. Paruelo, J.M.; Lauenroth, W.K.; Burke, I.C.; Sala, O.E. Grassland Precipitation-Use Efficiency Varies Across a Resource Gradient. Ecosystems 1999, 2, 64–68. [Google Scholar] [CrossRef]
  34. Liu, X.; Feng, X.; Fu, B. Changes in global terrestrial ecosystem water use efficiency are closely related to soil moisture. Sci. Total Environ. 2020, 698, 134165. [Google Scholar] [CrossRef]
  35. Xia, J.; Niu, S.; Ciais, P.; Janssens, I.A.; Chen, J.; Ammann, C.; Arain, A.; Blanken, P.D.; Cescatti, A.; Bonal, D.; et al. Joint control of terrestrial gross primary productivity by plant phenology and physiology. Proc. Natl. Acad. Sci. USA 2015, 112, 2788–2793. [Google Scholar] [CrossRef]
  36. Wang, Q.; Zhao, X.; Chen, L.; Yang, Q.; Chen, S.; Zhang, W. Global synthesis of temperature sensitivity of soil organic carbon decomposition: Latitudinal patterns and mechanisms. Funct. Ecol. 2019, 33, 514–523. [Google Scholar] [CrossRef]
  37. Wu, W.; Sun, R.; Liu, L.; Liu, X.; Yu, H.; Ma, Q.; Qi, M.; Li, L.; Li, Y.; Zhou, G.; et al. Precipitation consistently promotes, but temperature inversely drives, biomass production in temperate vs. alpine grasslands. Agric. For. Meteorol. 2023, 329, 109277. [Google Scholar] [CrossRef]
  38. Del Grosso, S.; Parton, W.; Stohlgren, T.; Zheng, D.; Bachelet, D.; Prince, S.; Hibbard, K.; Olson, R. Global potential net primary production predicted from vegetation class, precipitation, and temperature. Ecology 2008, 89, 2117–2126. [Google Scholar] [CrossRef]
  39. Gaitán, J.J.; Oliva, G.E.; Bran, D.E.; Maestre, F.T.; Aguiar, M.R.; Jobbágy, E.G.; Buono, G.G.; Ferrante, D.; Nakamatsu, V.B.; Ciari, G.; et al. Vegetation structure is as important as climate for explaining ecosystem function across Patagonian rangelands. J. Ecol. 2014, 102, 1419–1428. [Google Scholar] [CrossRef]
  40. Shi, P.; Li, P.; Li, Z.; Sun, J.; Wang, D.; Min, Z. Effects of grass vegetation coverage and position on runoff and sediment yields on the slope of Loess Plateau, China. Agric. Water Manag. 2022, 259, 107231. [Google Scholar] [CrossRef]
  41. Zhang, Y.; Wang, K.; Wang, J.; Liu, C.; Shangguan, Z. Changes in soil water holding capacity and water availability following vegetation restoration on the Chinese Loess Plateau. Sci. Rep. 2021, 11, 9692. [Google Scholar] [CrossRef]
  42. Wagg, C.; Roscher, C.; Weigelt, A.; Vogel, A.; Ebeling, A.; de Luca, E.; Roeder, A.; Kleinspehn, C.; Temperton, V.M.; Meyer, S.T.; et al. Biodiversity–stability relationships strengthen over time in a long-term grassland experiment. Nat. Commun. 2022, 13, 7752. [Google Scholar] [CrossRef]
  43. Vermeire, L.T.; Heitschmidt, R.K.; Rinella, M.J. Primary Productivity and Precipitation-Use Efficiency in Mixed-Grass Prairie: A Comparison of Northern and Southern US Sites. Rangel. Ecol. Manag. 2009, 62, 230–239. [Google Scholar] [CrossRef]
Figure 1. Sampling sites of natural grasslands on the Loess Plateau of China. Note: MG, meadow grassland; TG, temperate grassland; and DG, desert grassland. More details of rainfall station information are supplied in Table S2.
Agronomy 13 02296 g001
Figure 2. The above-ground net primary productivity (ANPP) in MG, TG, and DG grassland. Note: MG, meadow grassland; TG, temperate grassland, and DG, desert grassland. The lower limit of the box represents the 25th percentile, the upper limit represents the 75th percentile, the solid lines and dotted lines within the box mark the median and mean values, and the whiskers (error bars) below and above the box indicate the 10th and 90th percentiles. The dots represent outlier values. Different lowercase letters above the bars indicate significant differences among the three grassland types (p < 0.05).
Agronomy 13 02296 g002
Figure 3. Grassland community coverage (A), height (B), species richness (R) (C), Shannon–Wiener diversity index (H) (D), evenness (E) (E), and below-ground biomass (BGB) (F) in MG, TG, and DG grassland. NS means nonsignificant (p > 0.05). The lower limit of the box represents the 25th percentile, the upper limit represents the 75th percentile, the solid lines and dotted lines within the box mark the median and mean values, and the whiskers (error bars) below and above the box indicate the 10th and 90th percentiles. The dots represent outlier values. Different lowercase letters above the bars indicate significant differences among the three grassland types (p < 0.05).
Agronomy 13 02296 g003
Figure 4. Precipitation-use efficiency (PUE) in MG, TG, and DG grassland. Note: MG, meadow grassland; TG, temperate grassland; and DG, desert grassland. The lower limit of the box represents the 25th percentile, the upper limit represents the 75th percentile, the solid lines and dotted lines within the box mark the median and mean values, and the whiskers (error bars) below and above the box indicate the 10th and 90th percentiles. The dots represent outlier values. Different lowercase letters above the bars indicate significant differences among the three grassland types (p < 0.05).
Agronomy 13 02296 g004
Figure 5. Spatial relationship between precipitation-use efficiency (PUE), above-ground net primary productivity (ANPP) and mean annual precipitation (MAP), mean annual temperature (MAT), and humid index (HI) in the whole Loess Plateau, China. The ANPP and PUE of the grassland in the Chinese Loess Plateau did not show a significant increase trend with the increase in MAT (A,B). The best-fitting models with statistical significance (p < 0.05) were ANPP = 11.128 × HI − 97.716 (C); ANPP = 0.5905 × MAP − 78.277 (D); PUE = 0.2585 × ln (HI) − 0.4242 (E); and PUE = 0.2333 × ln (MAP) − 1.0132 (F). Note: MG, meadow grassland; TG, temperate grassland, and DG, desert grassland. NS means nonsignificant (p > 0.05).
Agronomy 13 02296 g005
Figure 6. Spatial relationship between precipitation-use efficiency (PUE) and grassland community coverage (A), height (B), species richness (R) (C), Shannon–Wiener diversity index (H) (D), evenness (E) (E) and belowground biomass (BGB) (F) in the whole Loess Plateau, China. The best-fitting models with statistical significance (p < 0.05) were PUE = 0.2634 + 0.0074 × exp (0.0440 × coverage) (A); PUE = 0.4680 × (1 − exp(−0.0466 × height) (B); PUE = −0.5680 + 0.9860 × (1 − exp(−0.4185 × R) (C); PUE = 0.2451 + 4.0947 × exp(−4.3952 × E) (E); and PUE = 0.014 × (BGB)0.513 (F). Note: MG, meadow grassland; TG, temperate grassland; and DG, desert grassland. NS means nonsignificant (p > 0.05).
Agronomy 13 02296 g006
Figure 7. Path analysis on the factors’ impact on PUE. Note: The solid line and dashed line represent significant or insignificant direct or indirect effects of factors on PUE, respectively; *, **, and *** indicate that the standardized path coefficients were significant at the levels of p < 0.05, p < 0.01, and p < 0.001, respectively.
Agronomy 13 02296 g007
Table 1. Variations in ANPP, BGB, grassland community coverage, height, richness index (R), Shannon–Wiener diversity index (H), evenness index (E), and precipitation-use efficiency (PUE) in the Loess Plateau, China.
nMeanSEMinMax95% CISig. (p)
ANPP (g m−2 yr−1)81143.2911.0713.90414.26(121.26, 165.31)<0.0001 **
BGB (g m−2)81634.7753.2669.562158.06(528.79, 740.76)<0.0001 **
Coverage (%)8145.722.525.3399.60(40.70, 50.74)<0.0001 **
Height (cm)8140.712.835.20111.67(35.08, 46.34)<0.0001 **
Richness index(R)818.160.322.0015.33(7.53, 8.80)<0.0001 **
Shannon–Wiener diversity index (H)811.680.050.623.02(1.58, 1.77)<0.0001 **
Evenness index (E)810.840.010.481.11(0.82, 0.86)<0.0001 **
Precipitation-use efficiency (PUE) (g m−2 mm−1)810.360.020.060.96(0.32, 0.40)<0.0001 **
Note: ** indicates that the difference was significant among the 81 sampling sites (p < 0.01).
Table 2. Stepwise regression to detect factors determining PUE.
ModelUnstandardized
Coefficients
Standardized CoefficientsSig. (p)VIFInterpretation Ratio (%)
BStd. ErrorBetat
(Constant)−0.0450.052/−0.8750.384//
BGB (x1)0.00020.00010.4444.9300.000 ***1.8954.3
Coverage (x2)0.0030.0010.3234.5710.000 ***1.168.7
E (x3)0.0710.0260.2062.7850.007 ***1.272.5
HI (x4)0.0050.0020.1652.1110.038 *1.432.0
EquationyPUE = 0.0002x 1 + 0.003x 2 + 0.071x 3 + 0.005x 4 − 0.0450.0000 ***/67.5
Note: * means significant at p < 0.05, *** means significant at p < 0.001.
Disclaimer/Publisher’s Note: The statements, opinions and data contained in all publications are solely those of the individual author(s) and contributor(s) and not of MDPI and/or the editor(s). MDPI and/or the editor(s) disclaim responsibility for any injury to people or property resulting from any ideas, methods, instructions or products referred to in the content.

