


Swine Manure Reduces Nitrous Oxide Emissions from Acidic Red Soil Due to Mineral N Immobilization and Alleviated Acidification
 ,
,  , ,
, ,
Abstract
:1. Introduction
2. Materials and Methods
2.1. Experimental Materials
2.2. Experimental Design and Incubation Procedure
2.3. Gas Sampling and Analysis
2.4. Soil Sampling and Analysis
2.5. Data Analysis
3. Results
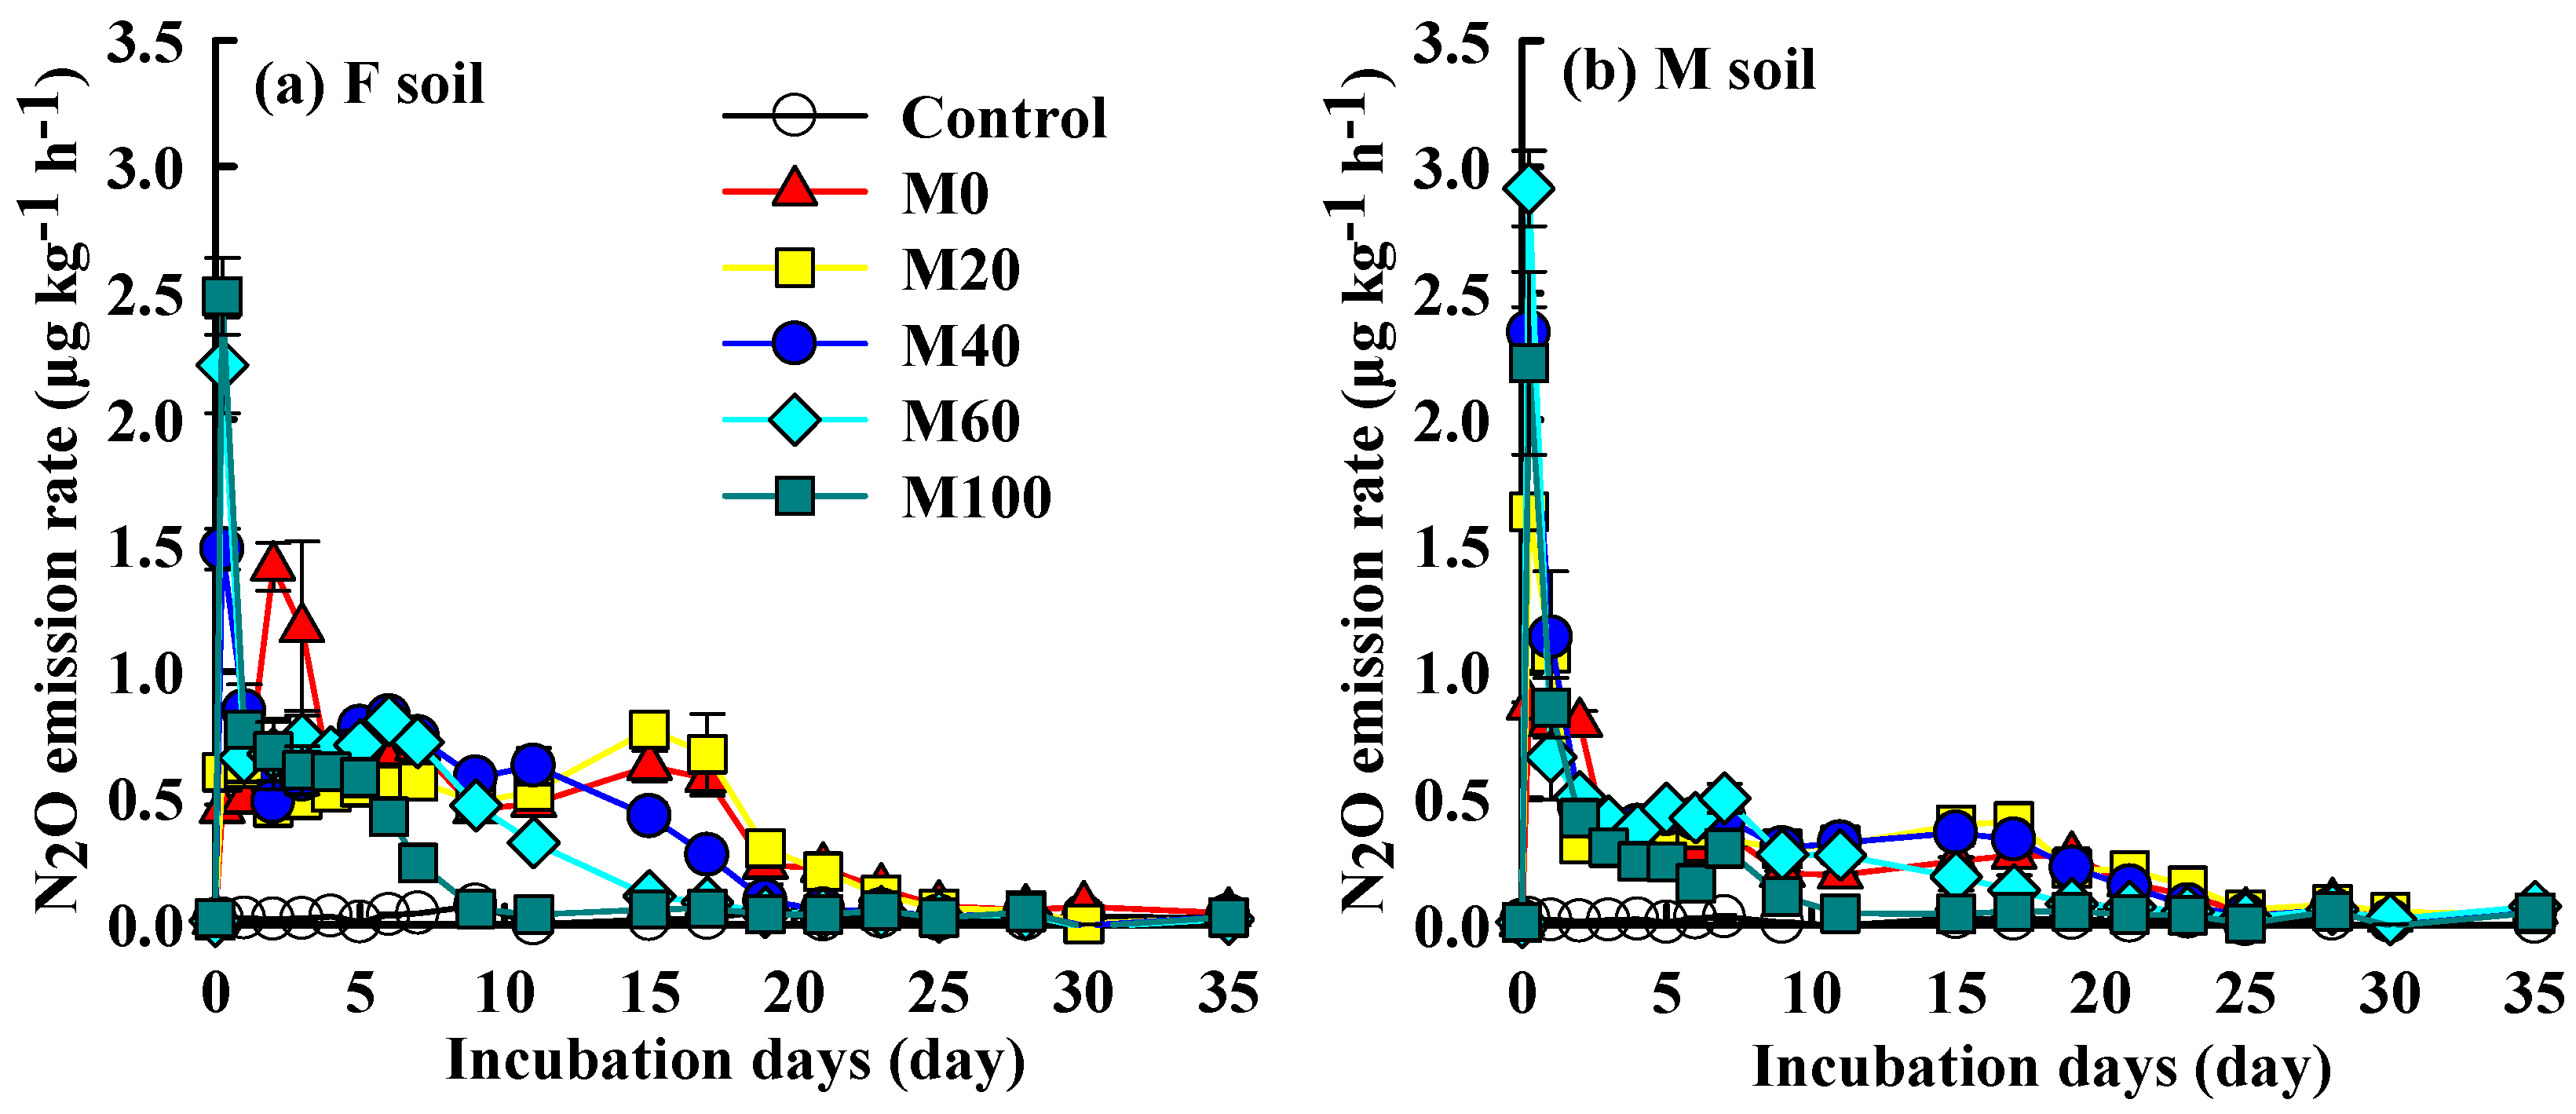
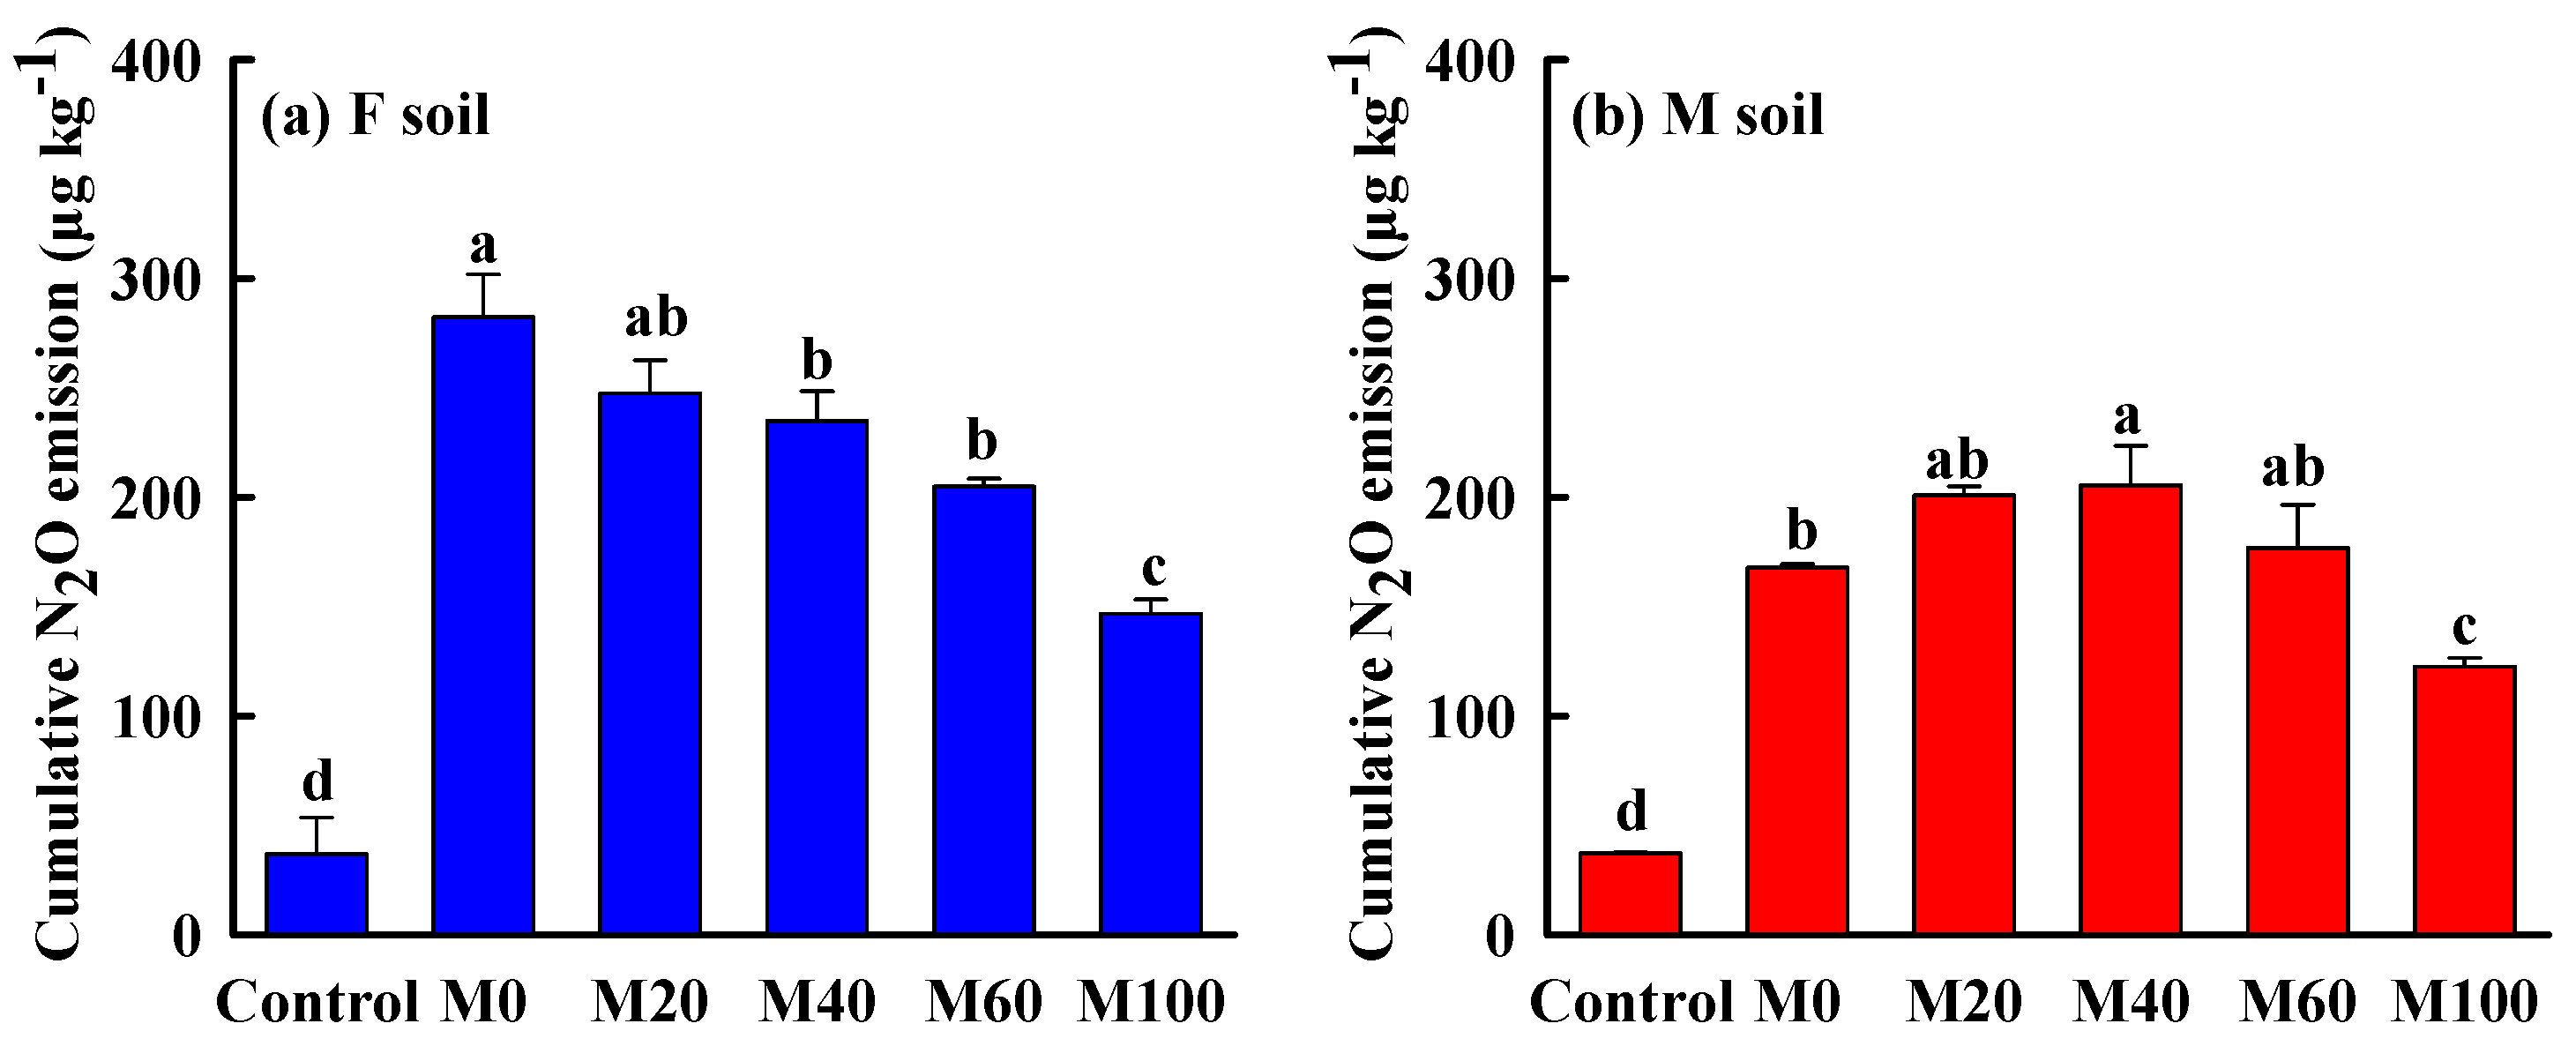
3.1. N2O Emission
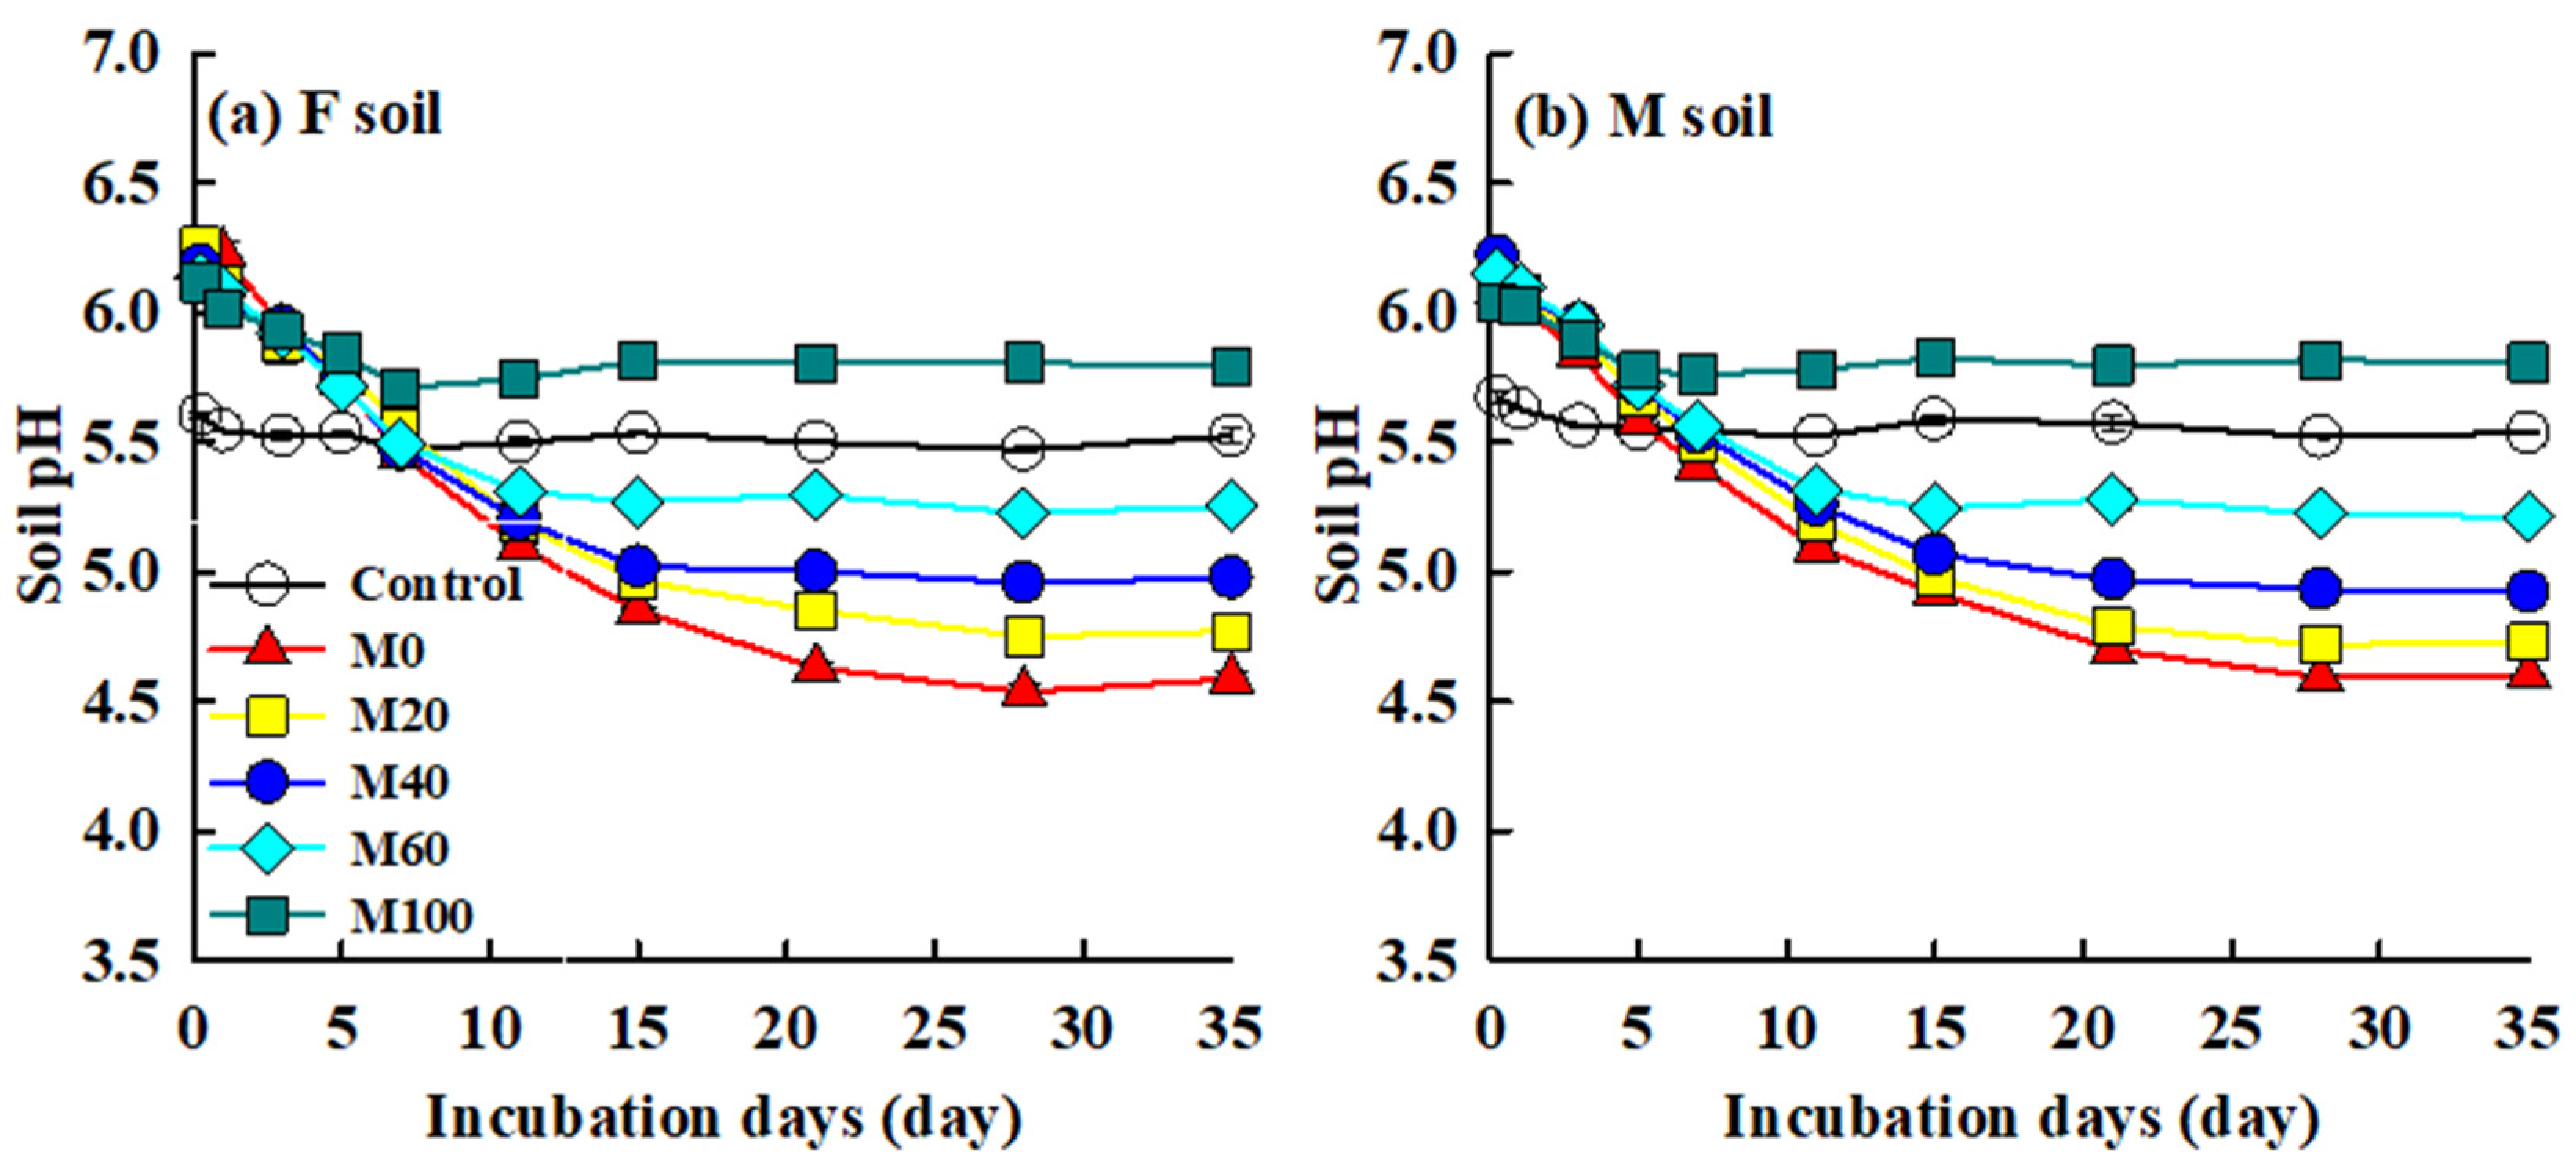
3.2. Soil pH Change
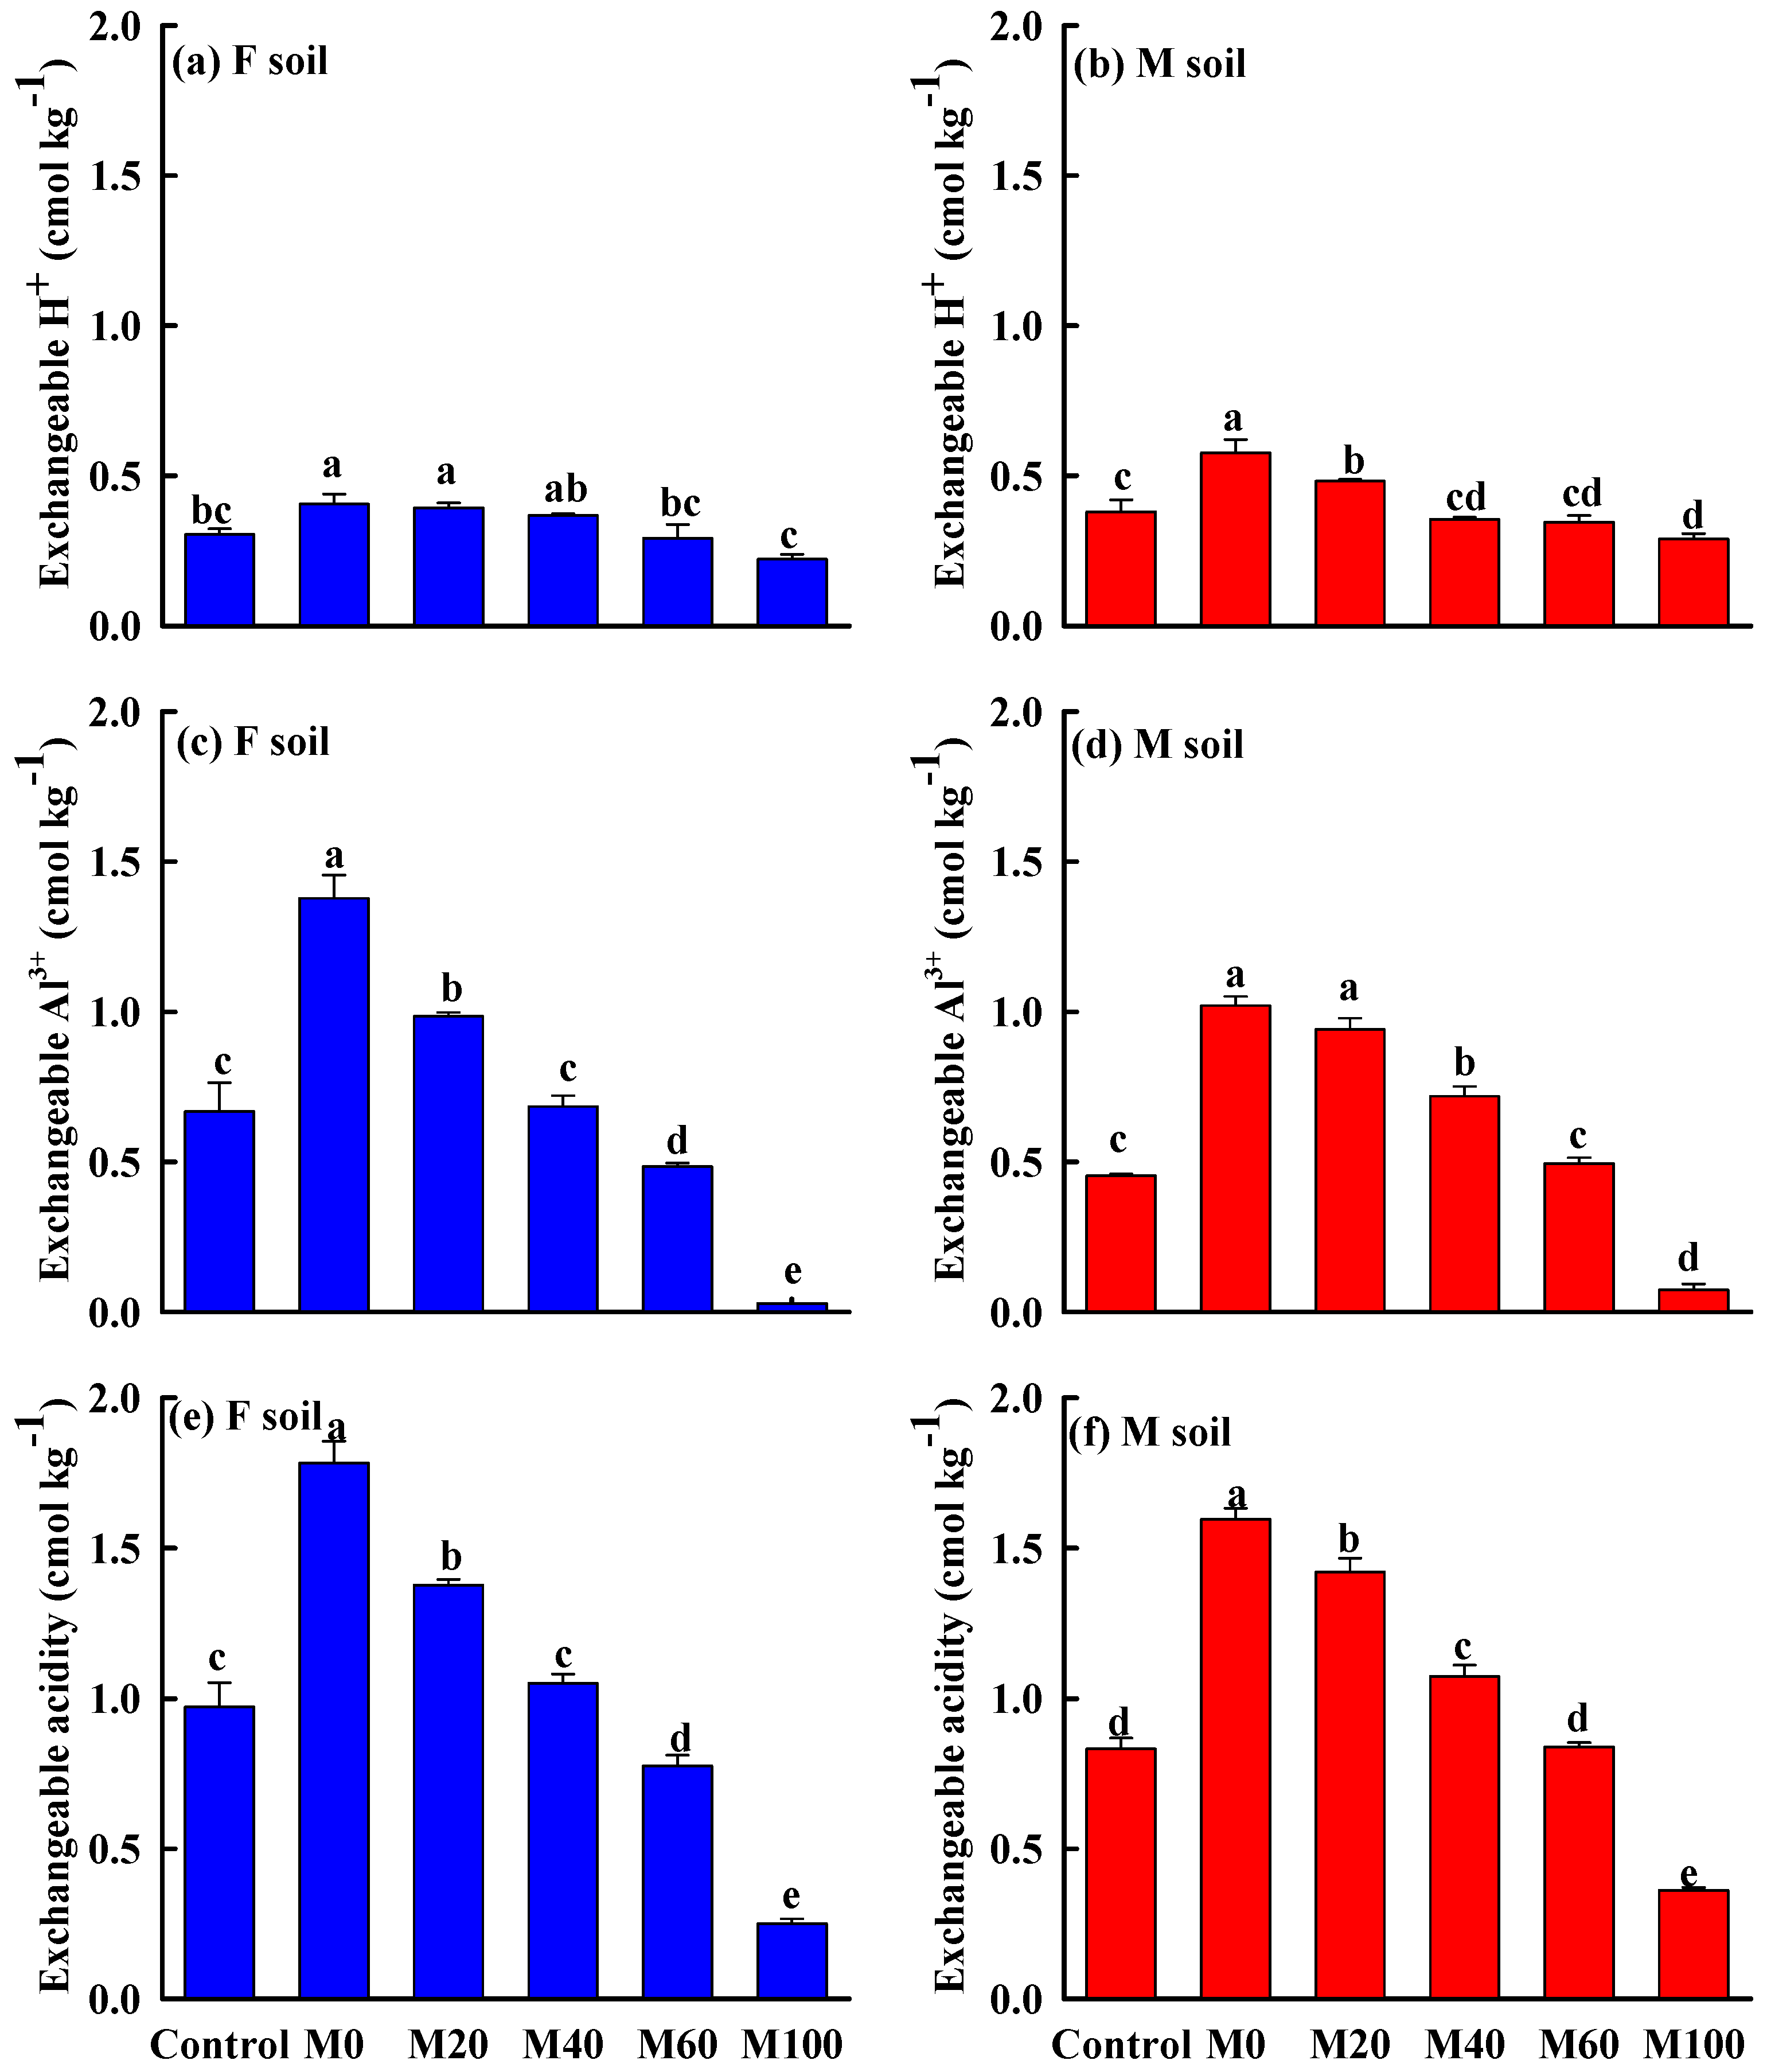
3.3. Soil Exchangeable Acidity
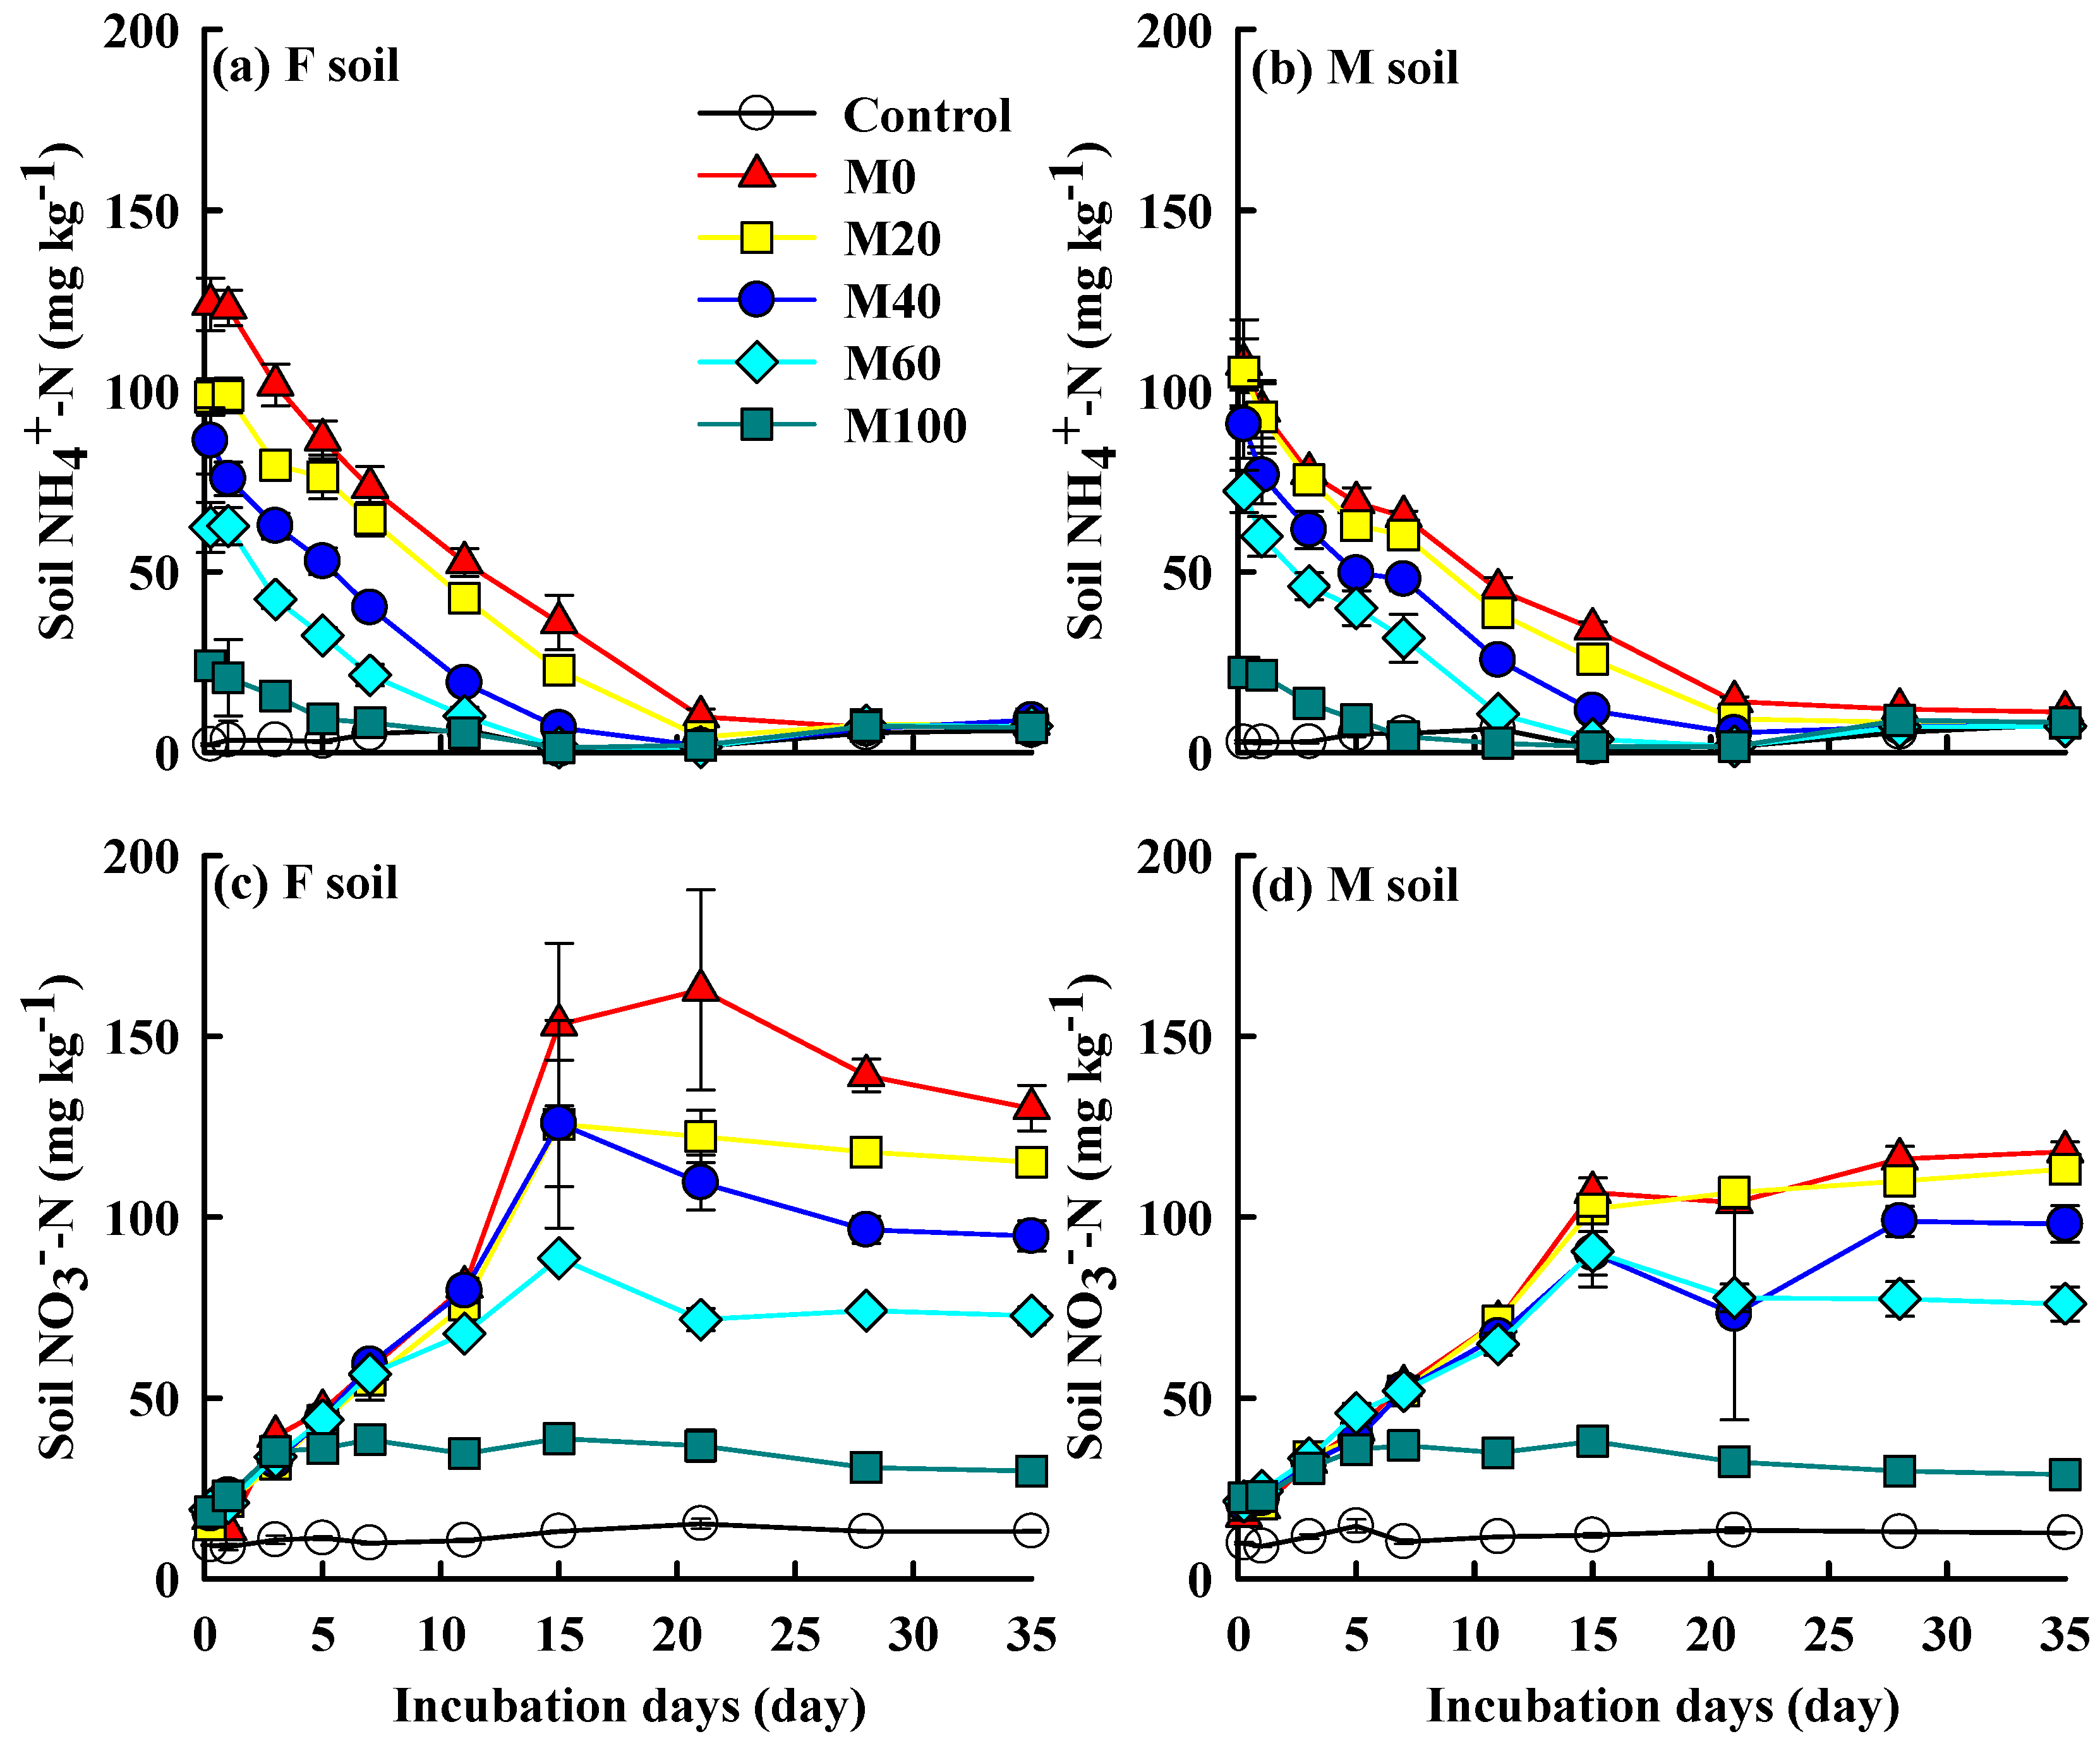
3.4. Soil Mineral Nitrogen Change
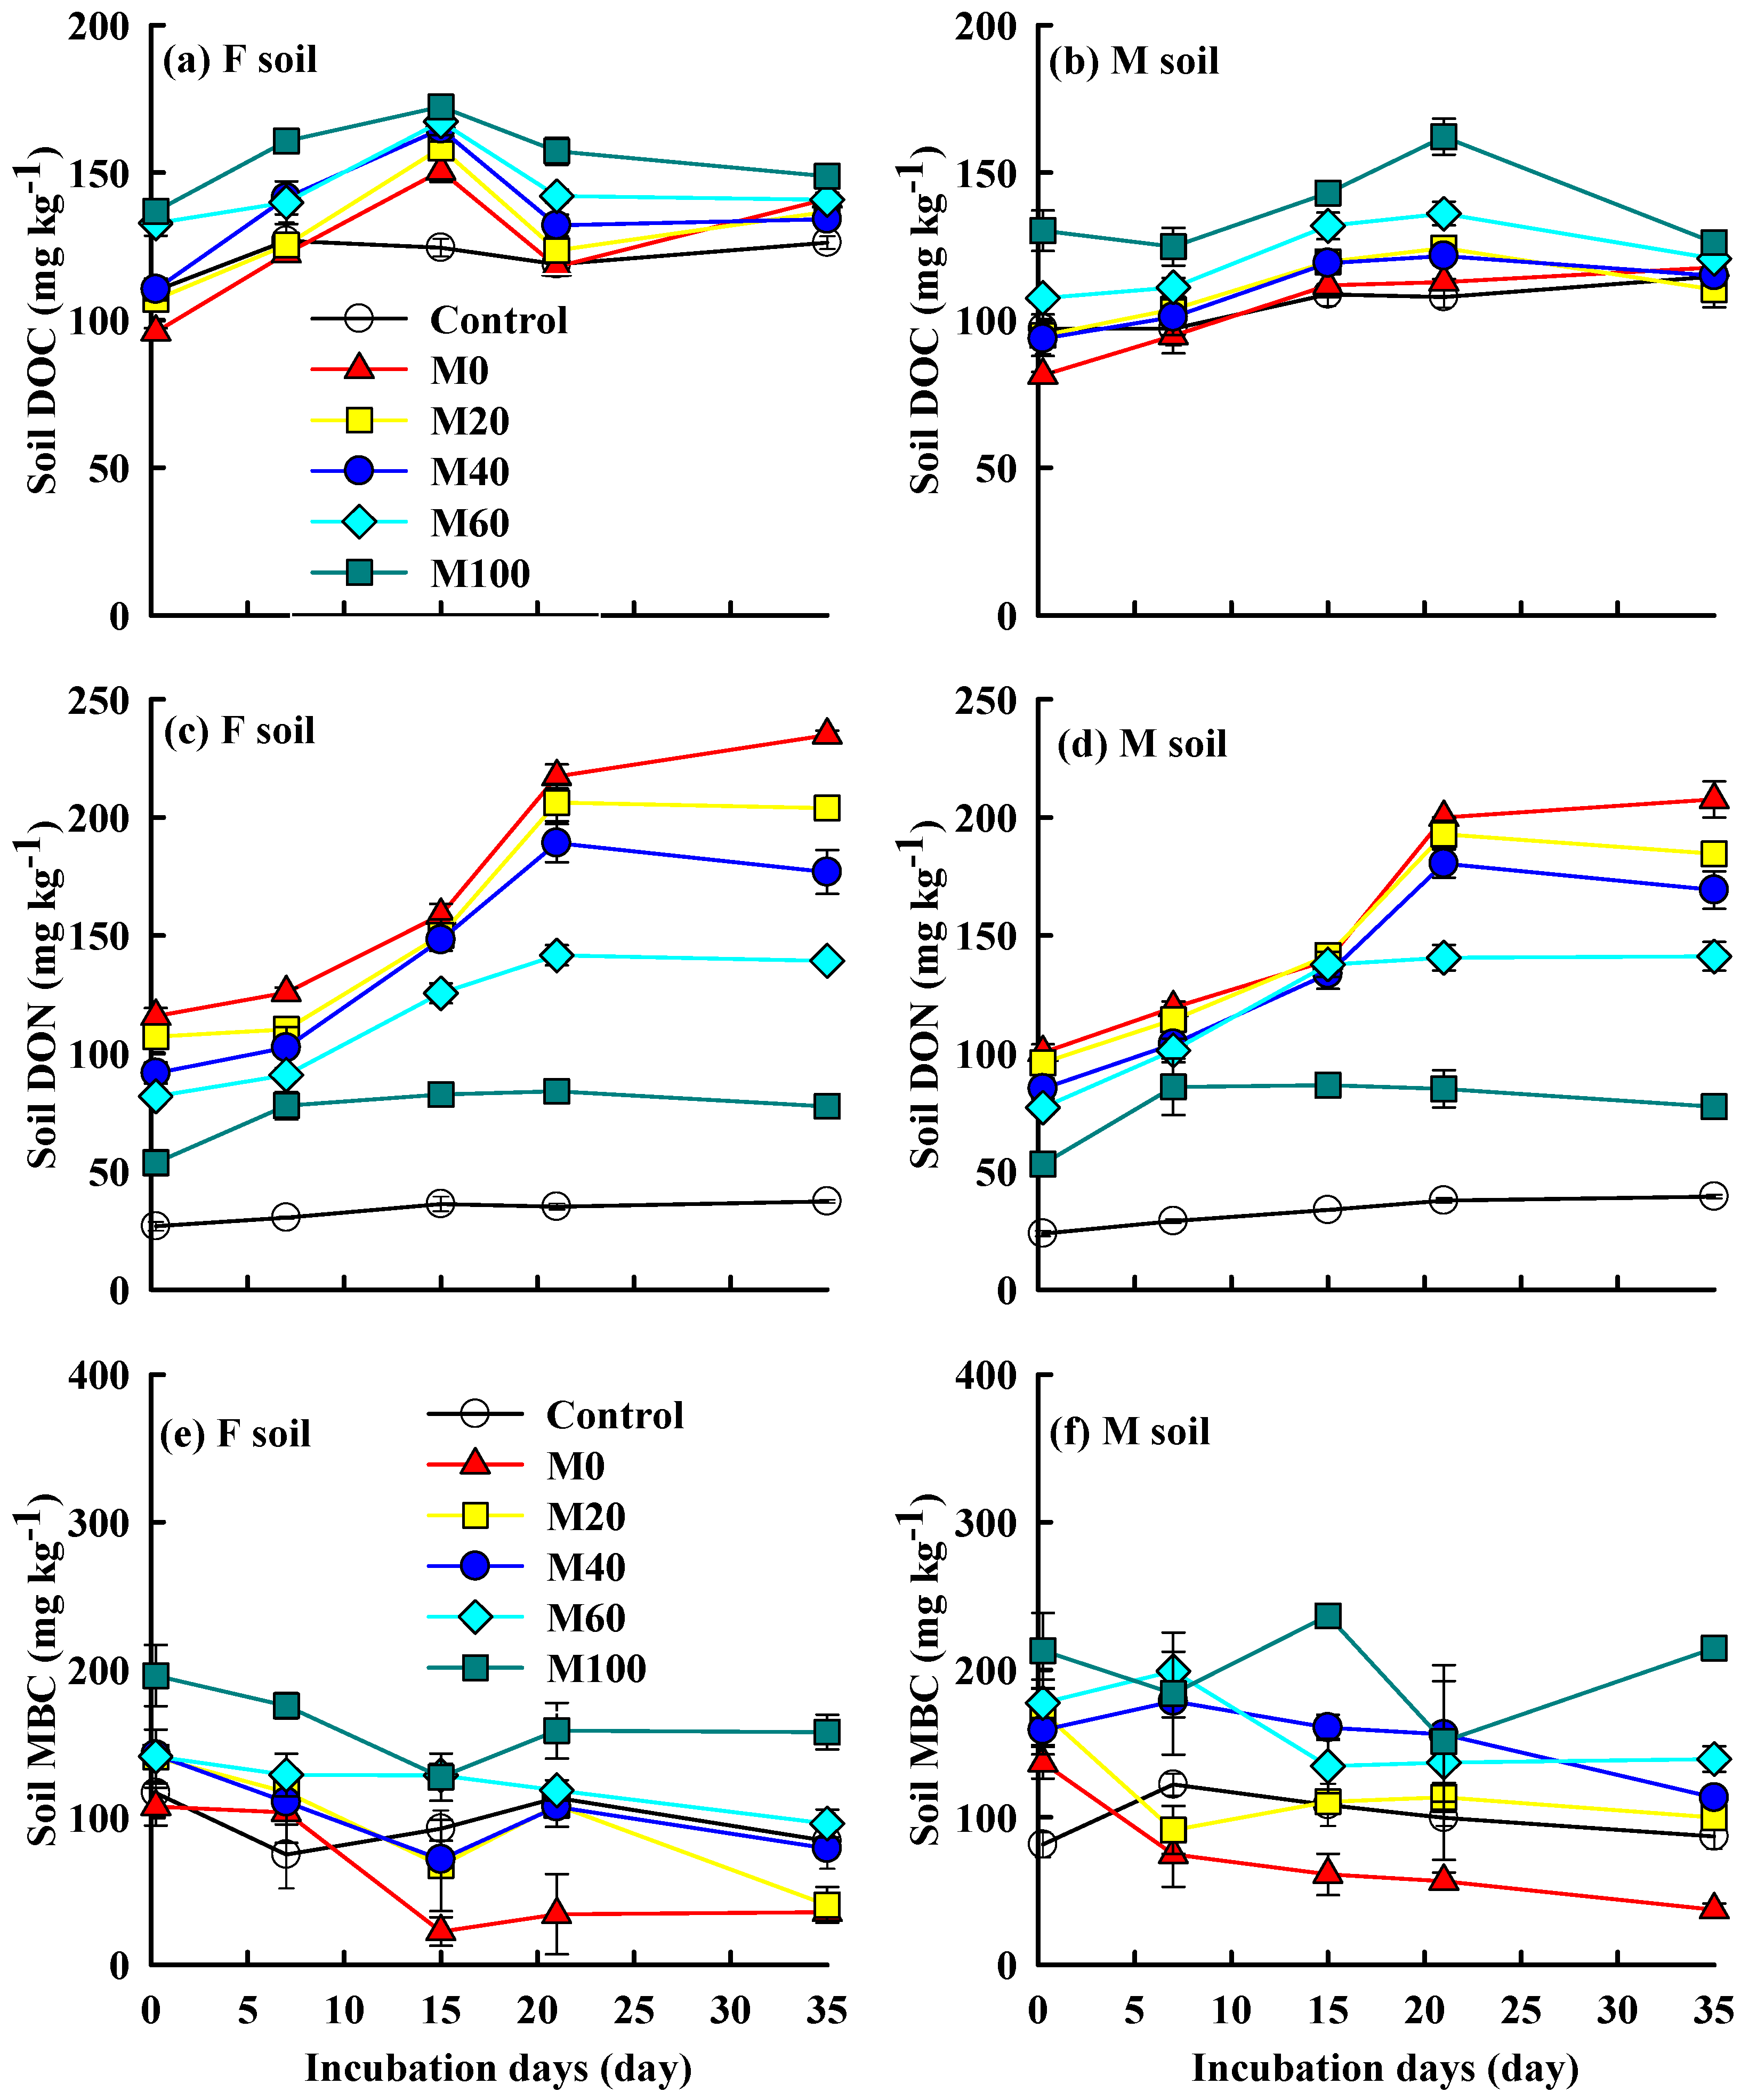
3.5. Soil Dissolved Organic Carbon and Nitrogen, and Microbial Biomass Carbon
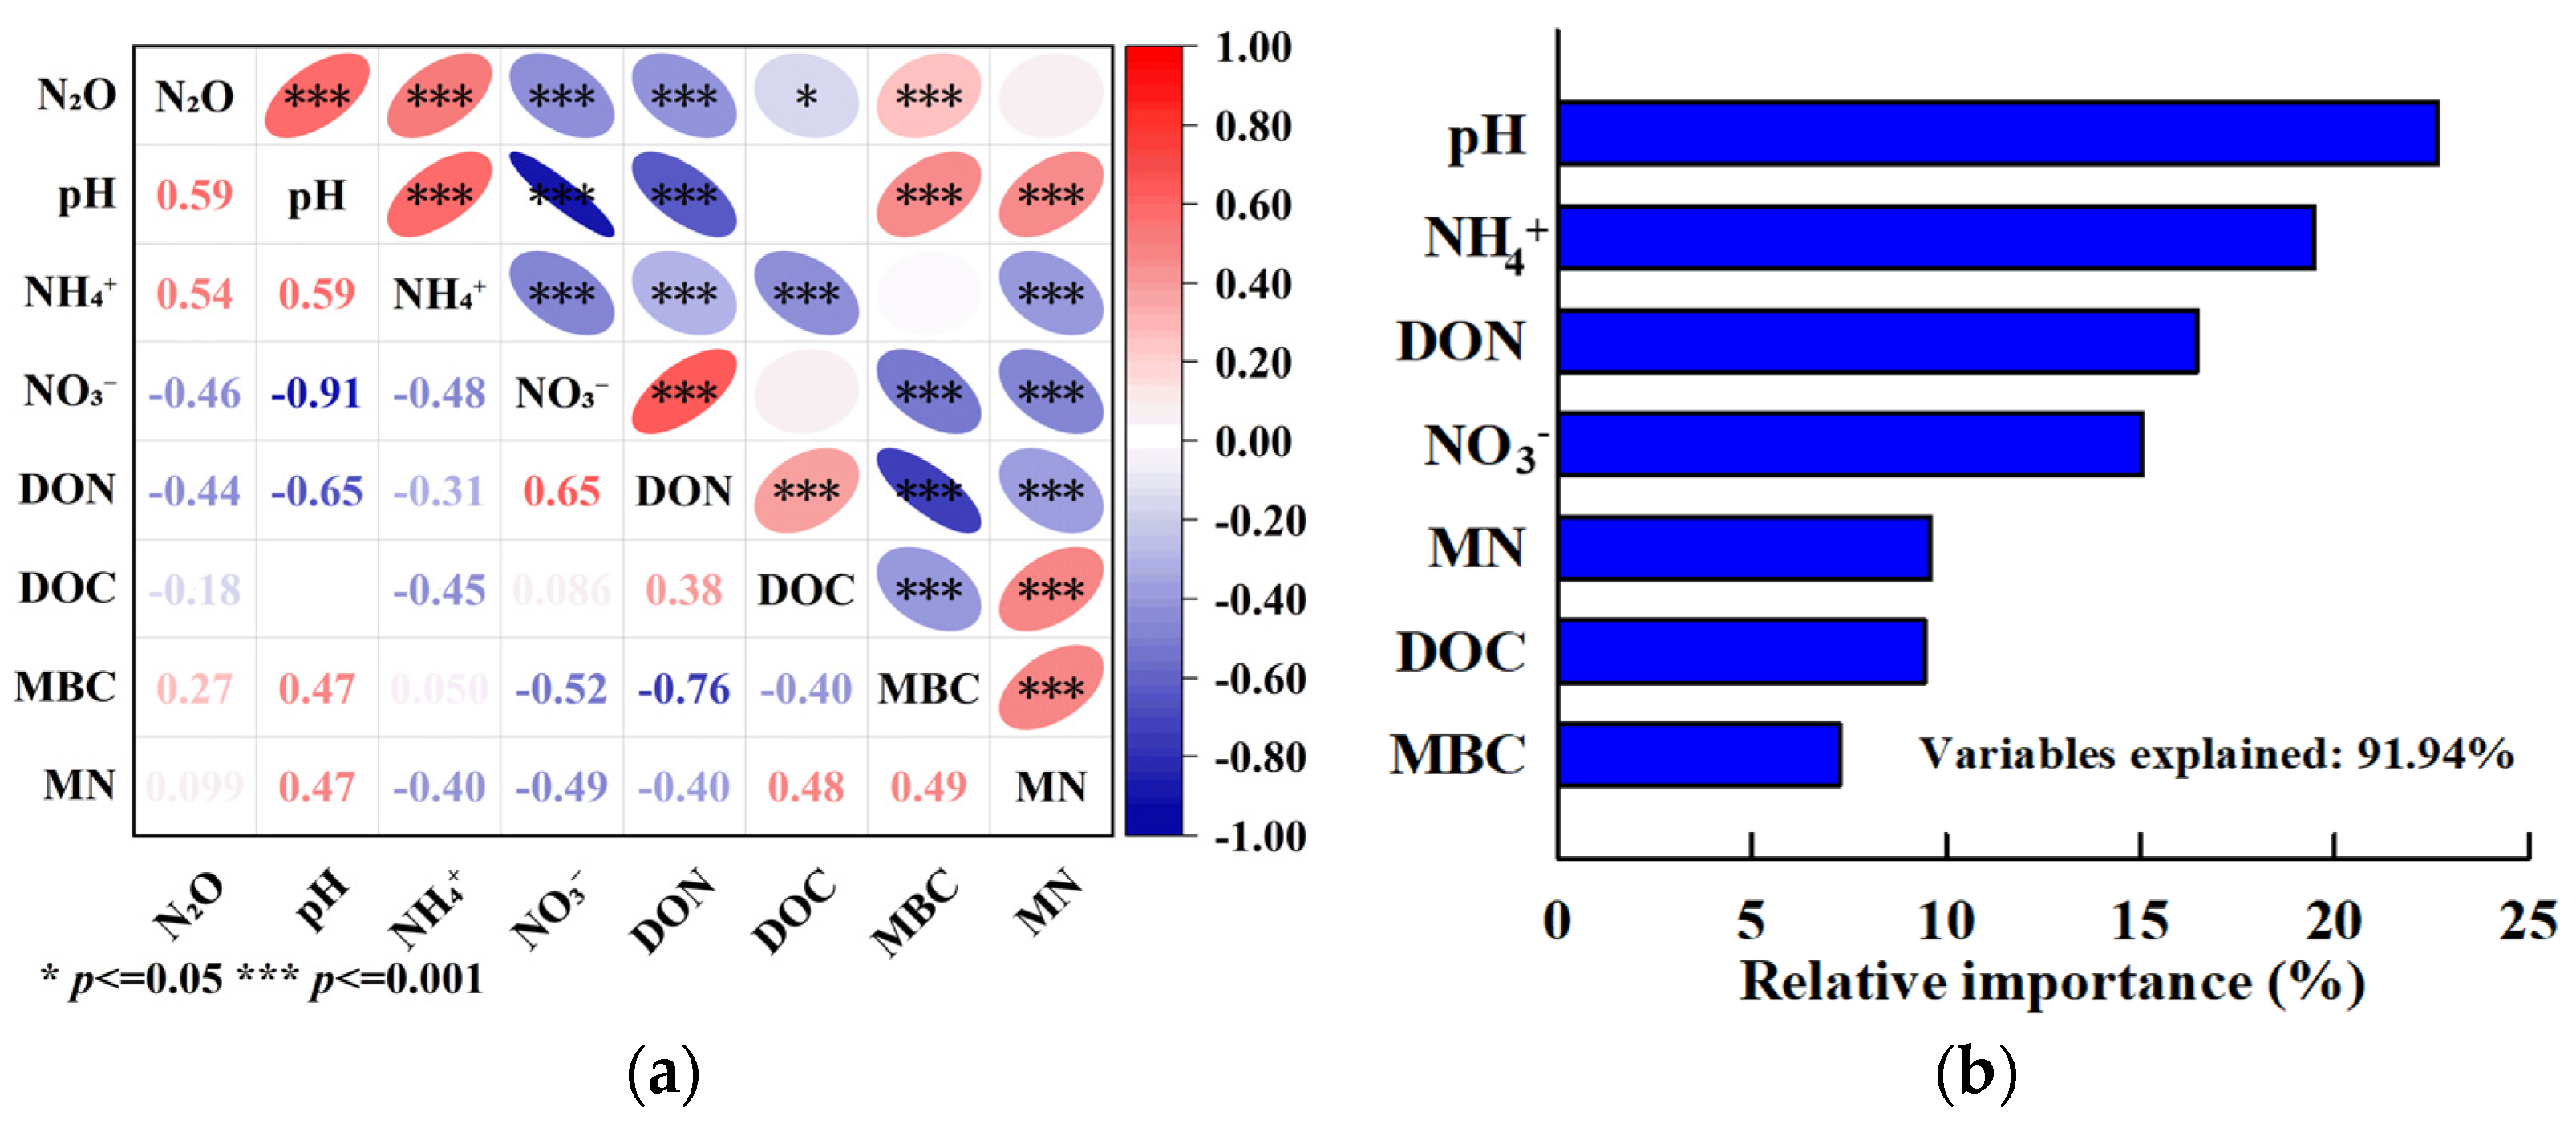
3.6. Relationship between N2O Emission and Soil Properties
4. Discussion
4.1. Difference in N2O Emmision between the Two Soils
4.2. Partial Chemical N Replacement by Swine Manure Mitigating Red Soil N2O Emission
5. Conclusions
Author Contributions
Funding
Data Availability Statement
Conflicts of Interest
References
- IPCC. Climate Change 2021: The Physical Science Basis. Contribution of Working Group I to the Sixth Assessment Report of the Intergovernmental Panel on Climate Change; Masson-Delmotte, V., Zhai, P., Pirani, A., Connors, S.L., Péan, C., Berger, S., Caud, N., Chen, Y., Goldfarb, L., Gomis, M.I., Eds.; Cambridge University Press: Cambridge, UK; New York, NY, USA, 2021. [Google Scholar]
- Tian, H.; Yang, J.; Xu, R.; Lu, C.; Canadell, J.G.; Davidson, E.A.; Jackson, R.B.; Arneth, A.; Chang, J.; Ciais, P. Global soil nitrous oxide emissions since the preindustrial era estimated by an ensemble of terrestrial biosphere models: Magnitude, attribution, and uncertainty. Glob. Chang. Biol. 2019, 25, 640–659. [Google Scholar] [CrossRef] [PubMed]
- Wang, Y.J.; Guo, J.H.; Vogt, R.D.; Mulder, J.; Wang, J.G.; Zhang, X.S. Soil pH as the chief modifier for regional nitrous oxide emissions: New evidence and implications for global estimates and mitigation. Glob. Chang. Biol. 2018, 24, 617–626. [Google Scholar] [CrossRef] [PubMed]
- Wang, J.; Huang, Q.; Li, Y.; Tu, X.S.; Chen, Z.X.; Elrys, A.S.; Cheng, Y.; Ma, L.F. A shift from nitrification to denitrification dominated N2O emission in an acidic soil following organic amendment. Biol. Fertil. Soils 2023, 59, 117–122. [Google Scholar] [CrossRef]
- Guo, J.H.; Liu, X.J.; Zhang, Y.; Shen, J.L.; Han, W.X.; Zhang, W.F.; Christie, P.; Goulding, K.W.T.; Vitousek, P.M.; Zhang, F.S. Significant acidification in major Chinese croplands. Science 2010, 327, 1008–1010. [Google Scholar] [CrossRef]
- Cai, Z.J.; Wang, B.R.; Xu, M.G.; Zhang, H.M.; He, X.H.; Zhang, L.; Gao, S. Intensified soil acidification from chemical N fertilization and prevention by manure in an 18-year field experiment in the red soil of southern China. J. Soils Sediments 2015, 15, 260–270. [Google Scholar] [CrossRef]
- Cai, Z.J.; Xu, M.G.; Wang, B.R.; Zhang, L.; Wen, S.L.; Gao, S.D. Effectiveness of crop straws, and swine manure in ameliorating acidic red soils: A laboratory study. J. Soils Sediments 2018, 18, 2893–2903. [Google Scholar] [CrossRef]
- Cai, Z.J.; Wang, B.R.; Zhang, L.; Wen, S.L.; Xu, M.G.; Misselbrook, T.H.; Carswell, A.M.; Gao, S.D. Striking a balance between N sources: Mitigating soil acidification and accumulation of phosphorous and heavy metals from manure. Sci. Total Environ. 2021, 754, 142189. [Google Scholar] [CrossRef]
- Velthof, G.L.; Kuikman, P.J.; Oenema, O. Nitrous oxide emission from animal manures applied to soil under controlled conditions. Biol. Fertil. Soils 2003, 37, 221–230. [Google Scholar] [CrossRef]
- Zhou, M.H.; Zhu, B.; Wang, S.J.; Zhu, X.Y.; Vereecken, H.; Brüggemann, N. Stimulation of N2O emission by manure application to agricultural soils may largely offset carbon benefits: A global meta-analysis. Glob. Chang. Biol. 2017, 23, 4068–4083. [Google Scholar] [CrossRef]
- Šimek, M.; Cooper, J.E. The influence of soil pH on denitrification: Progress towards the understanding of this interaction over the last 50 years. Eur. J. Soil Sci. 2002, 53, 345–354. [Google Scholar] [CrossRef]
- Baggs, E.M.; Smales, C.L.; Bateman, E.J. Changing pH shifts the microbial source as well as the magnitude of N2O emission from soil. Biol. Fertil. Soils 2010, 46, 793–805. [Google Scholar] [CrossRef]
- Blum, J.M.; Su, Q.X.; Ma, Y.J.; Valverde-Perez, B.; Domingo-Felez, C.; Jensen, M.M.; Smets, B.F. The pH dependency of N-converting enzymatic processes, pathways and microbes: Effect on net N2O production. Environ. Microbiol. 2018, 20, 1623–1640. [Google Scholar] [CrossRef]
- Saggar, S.; Jha, N.; Deslippe, J.; Bolan, N.S.; Luo, J.; Giltrap, D.L.; Kim, D.-G.; Zaman, M.; Tillman, R.W. Denitrification and N2O:N2 production in temperate grasslands: Processes, measurements, modelling and mitigating negative impacts. Sci. Total Environ. 2013, 465, 173–195. [Google Scholar] [CrossRef] [PubMed]
- Cheng, Y.; Zhang, H.M.; Chen, Z.X.; Wang, J.; Cai, Z.J.; Sun, N.; Wang, S.Q.; Zhang, J.B.; Chang, S.X.; Xu, M.G.; et al. Contrasting effects of different pH-raising materials on N2O emissions in acidic upland soils. Eur. J. Soil Sci. 2021, 72, 432–445. [Google Scholar] [CrossRef]
- Cannavo, P.; Richaume, A.; Lafolie, F. Fate of nitrogen and carbon in the vadose zone: In situ and laboratory measurements of seasonal variations in aerobic respiratory and denitrifying activities. Soil Biol. Biochem. 2003, 36, 463–478. [Google Scholar] [CrossRef]
- Li, Y.Q.; Tang, J.W.; Che, S.G.; Wen, Y.C.; Sun, W.Y.; Zhao, B.Q. Effect of Organic and Inorganic Fertilizer on the Emission of CO2 and N2O from the Summer Maize Field in the North China Plain. Sci. Agric. Sin. 2015, 48, 4381–4389. [Google Scholar]
- Ding, W.X.; Luo, J.F.; Li, J.; Yu, H.Y.; Fan, J.L.; Liu, D.Y. Effect of long-term compost and inorganic fertilizer application on background N2O and fertilizer-induced N2O emissions from an intensively cultivated soil. Sci. Total Environ. 2013, 465, 115–124. [Google Scholar] [CrossRef]
- Chu, H.Y.; Fujii, T.; Morioto, S.; Lin, X.G.; Yagi, K. Population size and specific nitrification potential of soil ammonia-oxidizing bacteria under long-term fertilizer management. Soil Biol. Biochem. 2008, 40, 1960–1963. [Google Scholar] [CrossRef]
- Aamer, M.; Chattha, M.B.; Mahmood, A.; Naqve, M.; Hassan, M.U.; Shaaban, M.; Rasul, F.; Batool, M.; Rasheed, A.; Tang, H.Y.; et al. Rice Residue-Based Biochar Mitigates N2O Emission from Acid Red Soil. Agronomy 2021, 11, 2462. [Google Scholar] [CrossRef]
- Zhang, W.F.; Cao, G.X.; Li, X.L.; Zhang, H.Y.; Wang, C.; Liu, Q.Q.; Chen, X.P.; Cui, Z.L.; Shen, J.B.; Jiang, R.F.; et al. Closing yield gaps in China by empowering smallholder farmers. Nature 2016, 537, 671–674. [Google Scholar] [CrossRef] [PubMed]
- Vance, E.D.; Brookes, P.C.; Jenkinson, D.S. An extraction method for measuring soil microbial C. Soil Biol. Biochem. 1987, 19, 159–164. [Google Scholar] [CrossRef]
- Jones, D.; Willett, V. Experimental evaluation of methods to quantify dissolved organic nitrogen (DON) and dissolved organic carbon (DOC) in soil. Soil Biol. Biochem. 2006, 38, 991–999. [Google Scholar] [CrossRef]
- Norman, A.G. Methods of Soil Analysis. Part 2 Chemical and Microbiological Properties; Agronomy Monographs; Soil Science Society of America, Inc.: Madison, WI, USA, 1965. [Google Scholar]
- Sparks, D.L. Methods of Soil Analysis. Part 3 Chemical Methods; Soil Science Society of America, Inc.: Madison, WI, USA, 1996. [Google Scholar]
- Kong, D.L.; Jin, Y.G.; Yu, K.; Swaney, D.P.; Liu, S.W.; Zou, J.W. Low N2O emissions from wheat in a wheat-rice double cropping system due to manure substitution are associated with changes in the abundance of functional microbes. Agric. Ecosyst. Environ. 2021, 311, 107318. [Google Scholar] [CrossRef]
- Xia, L.L.; Lam, S.K.; Yan, X.Y.; Chen, D.L. How does recycling of livestock manure in agroecosystems affect crop productivity, reactive nitrogen losses, and soil carbon balance? Environ. Sci. Technol. 2017, 51, 7450–7457. [Google Scholar] [CrossRef]
- Zhang, X.Y.; Fang, Q.C.; Zhang, T.; Ma, W.Q.; Velthof, G.; Hou, Y.; Oenema, O.; Zhang, F.S. Benefits and trade-offs of replacing synthetic fertilizers by animal manures in crop production in China: A meta-analysis. Glob. Chang. Biol. 2020, 26, 888–900. [Google Scholar] [CrossRef] [PubMed]
- Shang, Z.Y.; Abdalla, M.; Xia, L.L.; Zhou, F.; Sun, W.J.; Smith, P. Can cropland management practices lower net greenhouse emissions without compromising yield? Glob. Chang. Biol. 2021, 27, 4657–4670. [Google Scholar] [CrossRef] [PubMed]
- Bhattacharyya, P.; Nayak, A.K.; Mohanty, S.; Tripathi, R.; Shahid, M.; Kumar, A.; Raja, R.; Panda, B.B.; Roy, K.S.; Neogi, S.; et al. Greenhouse gas emission in relation to labile soil C, N pools and functional microbial diversity as influenced by 39 years long-term fertilizer management in tropical rice. Soil Till. Res. 2013, 129, 93–105. [Google Scholar] [CrossRef]
- Yao, C.C.; Wu, X.W.; Bai, H.; Gu, J.X. Nitrous oxide emission and grain yield in Chinese winter wheat–summer maize rotation: A meta-analysis. Agronomy 2022, 12, 2305. [Google Scholar] [CrossRef]
- Zhang, G.B.; Song, K.F.; Miao, X.; Huang, Q.; Ma, J.; Gong, H.; Zhang, Y.; Paustian, K.; Yan, X.Y.; Xu, H. Nitrous oxide emissions, ammonia volatilization, and grain-heavy metal levels during the wheat season: Effect of partial organic substitution for chemical fertilizer. Agric. Ecosyst. Environ. 2021, 311, 107340. [Google Scholar] [CrossRef]
- Huang, Y.; Zou, J.W.; Zheng, X.H.; Wang, Y.S.; Xu, X.K. Nitrous oxide emissions as influenced by amendment of plant residues with different C:N ratios. Soil Biol. Biochem. 2004, 36, 973–981. [Google Scholar] [CrossRef]
- Duan, P.P.; Zhang, Q.Q.; Zhang, X.; Xiong, Z.Q. Mechanisms of mitigating nitrous oxide emissions from vegetable soil varied with manure, biochar and nitrification inhibitors. Agric. For. Meteorol. 2019, 278, 107672. [Google Scholar] [CrossRef]
- Wang, J.; Zhu, B.; Zhang, J.B.; Müller, C.; Cai, Z.C. Mechanisms of soil N dynamics following long-term application of organic fertilizers to subtropical rain-fed purple soil in China. Soil Biol. Biochem. 2015, 91, 222–231. [Google Scholar] [CrossRef]
- Abalos, D.; Sanz-Cobena, A.; Garcia-Torres, L.; Van Groenigen, J.W.; Vallejo, A. Role of maize stover incorporation on nitrogen oxide emissions in a non-irrigated Mediterranean barley field. Plant Soil 2013, 364, 357–371. [Google Scholar] [CrossRef]
- Xia, L.L.; Lam, S.K.; Wolf, B.; Kiese, R.; Chen, D.L.; Butterbach-Bahl, K. Trade-offs between soil carbon sequestration and reactive nitrogen losses under straw return in global agroecosystems. Glob. Chang. Biol. 2018, 24, 5919–5932. [Google Scholar] [CrossRef] [PubMed]
- Qu, Z.; Wang, J.; Almøy, T.; Bakken, L.R. Excessive use of nitrogen in Chinese agriculture results in high N2O/(N2O+N2) product ratio of denitrification, primarily due to acidification of the soils. Glob. Chang. Biol. 2014, 20, 1685–1698. [Google Scholar] [CrossRef]
- Zhang, L.C.; Zhang, X.Y.; Gao, Q.; Yan, L. Nitrogen application effect on maize yield, NH3, and N2O emissions in Northeast China by meta-analysis. Agronomy 2023, 13, 1479. [Google Scholar] [CrossRef]
- Shaaban, M.; Wu, Y.P.; Khalid, M.S.; Peng, Q.A.; Xu, X.Y.; Wu, L.; Younas, A.; Bashir, S.; Mo, Y.L.; Lin, S.; et al. Reduction in soil N2O emissions by pH manipulation and enhanced nosZ gene transcription under different water regimes. Environ. Pollut. 2018, 235, 625–631. [Google Scholar] [CrossRef]
- Xie, Z.; Roux, X.L.; Wang, C.P.; Gu, Z.K.; An, M.; Nan, H.Y.; Chen, B.Z.; Li, F.; Liu, Y.J.; Du, G.Z.; et al. Identifying response groups of soil nitrifiers and denitrifiers to grazing and associated soil environmental drivers in Tibetan alpine meadows. Soil Biol. Biochem. 2014, 77, 89–99. [Google Scholar] [CrossRef]
- Ji, C.; Han, Z.Q.; Zheng, F.W.; Wu, S.; Wang, J.Y.; Wang, J.D.; Zhang, H.; Zhang, Y.C.; Liu, S.W.; Li, S.Q.; et al. Biochar reduced soil nitrous oxide emissions through suppressing fungal denitrification and affecting fungal community assembly in a subtropical tea plantation. Agric. Ecosyst. Environ. 2022, 326, 107784. [Google Scholar] [CrossRef]
- Rousk, J.; Bååth, E.; Brookes, P.C.; Lauber, C.L.; Lozupone, C.; Caporaso, J.G.; Knight, R.; Fierer, N. Soil bacterial and fungal communities across a pH gradient in an arable soil. ISME J. 2010, 4, 1340–1351. [Google Scholar] [CrossRef]


| Materials | pH | NH4+-N (mg kg−1) | NO3−-N (mg kg−1) | AN (mg kg−1) | DON (mg kg−1) | TN (g kg−1) | DOC (mg kg−1) | TOC (g kg−1) | C/N | MBC (mg kg−1) | AP (mg kg−1) | TP (g kg−1) | AK (mg kg−1) | TK (g kg−1) | BD (g cm−3) |
|---|---|---|---|---|---|---|---|---|---|---|---|---|---|---|---|
| F Soil | 5.60 | 2.22 | 9.27 | 68.48 | 26.80 | 0.94 | 109.94 | 8.20 | 8.72 | 116.43 | 14.26 | 0.91 | 121.76 | 13.30 | 1.26 |
| M Soil | 5.67 | 2.88 | 9.78 | 74.91 | 23.70 | 0.96 | 97.06 | 9.41 | 9.80 | 81.47 | 117.35 | 2.10 | 225.69 | 13.40 | 1.40 |
| Manure | 8.77 | 448.30 | 645.24 | – | – | 16.48 | – | 356.68 | 21.64 | – | – | 13.41 | – | 13.92 | – |
Disclaimer/Publisher’s Note: The statements, opinions and data contained in all publications are solely those of the individual author(s) and contributor(s) and not of MDPI and/or the editor(s). MDPI and/or the editor(s) disclaim responsibility for any injury to people or property resulting from any ideas, methods, instructions or products referred to in the content. |
© 2023 by the authors. Licensee MDPI, Basel, Switzerland. This article is an open access article distributed under the terms and conditions of the Creative Commons Attribution (CC BY) license (https://creativecommons.org/licenses/by/4.0/).
Share and Cite
Zhang, L.; Ren, T.; Li, J.; Adare, K.; Daba, N.A.; Alam, M.A.; Wen, S.; Zhang, H. Swine Manure Reduces Nitrous Oxide Emissions from Acidic Red Soil Due to Mineral N Immobilization and Alleviated Acidification. Agronomy 2023, 13, 2201. https://doi.org/10.3390/agronomy13092201
Zhang L, Ren T, Li J, Adare K, Daba NA, Alam MA, Wen S, Zhang H. Swine Manure Reduces Nitrous Oxide Emissions from Acidic Red Soil Due to Mineral N Immobilization and Alleviated Acidification. Agronomy. 2023; 13(9):2201. https://doi.org/10.3390/agronomy13092201
Chicago/Turabian StyleZhang, Lu, Tusheng Ren, Jiwen Li, Kiya Adare, Nano Alemu Daba, Md Ashraful Alam, Shilin Wen, and Huimin Zhang. 2023. "Swine Manure Reduces Nitrous Oxide Emissions from Acidic Red Soil Due to Mineral N Immobilization and Alleviated Acidification" Agronomy 13, no. 9: 2201. https://doi.org/10.3390/agronomy13092201