Article

Monitoring of Soil Nutrient Levels by an EC Sensor during Spring Onion (Allium fistulosum) Cultivation under Different Fertilizer Treatments

1
Department of Environmental and Biological Chemistry, Chungbuk National University, Cheongju 28644, Republic of Korea
2
Soil and Fertilizer Division, National Institute of Agricultural Sciences, Rural Development Administration, Wanju 55365, Republic of Korea
3
Department of Crop Science, Chungbuk National University, Cheongju 28644, Republic of Korea
*
Author to whom correspondence should be addressed.
Agronomy 2023, 13(8), 2156; https://doi.org/10.3390/agronomy13082156
Submission received: 25 July 2023 / Revised: 8 August 2023 / Accepted: 15 August 2023 / Published: 17 August 2023

Abstract

:
Balanced nutrients are essential for healthy plant growth, but there is no sensor available to monitor essential nutrients such as N and K. Electrical conductivity (EC) is one of the key parameters that could be adopted to monitor nutrient contents because soil EC is influenced by the available nutrients. Therefore, the main objective of this study was to examine the effects of different basal fertilizers, including inorganic, organic, and compost fertilizers, and the application ratio of basal and additional fertilizers on nutrient contents with an EC sensor. The applied basal and additional fertilizer ratios were N 30:70, K 40:60, and N 20:80, K 20:80, respectively, for each fertilizer treatment. The results showed that the EC sensor value was positively associated with water content. The soil EC response increased with inorganic fertilizer and fertigation, and it was positively correlated with soluble nutrients and exchangeable ammonium. The correlation coefficients between sensor EC and soluble nutrients, nitrate, and ammonium nitrogen were 0.87, 0.86, and 0.65, respectively. The principal component analysis (PCA) also elucidated that inorganic fertilizer was positively associated with sensor EC, soluble Na, Ca, Mg, and nitrate among variables. This work suggests that soil available nutrients, especially N, could be monitored with an EC sensor, and the soil nutrient status could be regulated to promote better plant growth.

1. Introduction

Crop development and productivity are hampered without sufficient nutrients, but 60% of cultivated soils globally have issues with insufficient or excess mineral nutrients that restrain growth [1]. Stunted roots and leaves, brown or yellow patches on leaves, and decreased yields are all signs of nutritional deficiencies in crops. There are two main challenges in the agriculture sector: Farmers face productivity issues in the agricultural sector of developing countries; and climate change, pollution, and pest infestations pose the farmers’ second obstacle because they significantly harm crops [2]. Spring onion is a valuable crop as it possesses therapeutic properties due to the presence of various bioactive compounds, like vitamins C and A, flavonoids, and quercetin [3]. For the optimum yield, spring onions with their shallow, branching root structure need a profound supply of nitrogen (N), phosphorus (P), and potassium (K) [4]. The worldwide population growth will necessitate a greater than 70% increase in food production [5]. As a result, the farmers’ preferred strategy for successfully raising yield is the prolonged use of agrochemicals and nutrient fertilizers [6]. This has worsened because of ongoing agricultural practices without adequate knowledge [7]. Chemical and organic fertilizers have both positive and negative effects on plants and soil. Chemical fertilizers are readily absorbed by plants, are often affordable, and have high nutritional levels. However, excess usage of fertilizers can lead to a variety of issues, including nutrient loss, ground and surface water contamination, eutrophication, acidification or basification of the soil, and declines in beneficial microbial populations [8].
A balanced nutrient supply and increased physicochemical (porosity, soil organic carbon, water-holding capacity) and biological properties of the soil (soil respiration and enzyme activity) can be achieved by organic manure [9]. It is now commonly accepted that organic residues, like crop leftovers, animal manure, or compost, are essential sources of agricultural fertilizer that can be used to boost agricultural yield and soil health. Nevertheless, the adequate quantity of basal fertilizer may not be enough when plants are in different growth phases, which results in several symptoms, like reduced plant growth, decreased chlorophyll content, browned leaves, and curled leaf tips [10]. Therefore, the application of fertilizer at various phases of plant growth needs to be considered. However, applying fertilizers without monitoring soil nutrients could severely affect the plant, soil, and surrounding environment in conventional farming [11].
Excess nutrients are not necessarily beneficial for crop yield. Previously, it was reported that cucumber yield rose with increasing fertilizer rate up to a threshold, but it started to decline once the usage was beyond the threshold [12]. Therefore, balanced nutrients are essential for optimum plant growth, which can be accomplished with smart-farming technology [13]. The agricultural sector needs to adopt high-tech technologies to meet the food demand while reducing the detrimental impact on the environment caused by over and inappropriate fertilization management [6,14]. One of the sectors where the number of smart-sensor technology has grown prevalently is agriculture [15]. This technology enables farmers to reduce resource input and increase crop yield by providing accurate nutrient information [16]. The yield of bitter gourd was enhanced by providing a sufficient amount of fertilizers with smart-farming technology compared to conventional farming [17]. Ma et al., demonstrated that wheat yield was enhanced under frost conditions by applying an appropriate amount of potassium (K) [18]. Similarly, adequate N fertilizer treatment also encourages flower bud differentiation, speeds up fruit ripening, and raises crop yield [19].
Therefore, over the last few decades, developing countries have taken the initiative to integrate information technology into agriculture to monitor real-time nutrients [20]. Different techniques are available to measure soil nutrients, including the random grid sample, visible near-infrared spectroscopy (Vis–NIR), attenuated total reflectance (ATR) spectroscopy, Raman, and electrochemical sensor-ion selective electrode (ISE) and ion-selective field effect transistor (ISFET) [16]. One of the key difficulties that must be considered while adopting smart systems for agriculture is the shortage of energy resources [21]. As a result, both data collection and management typically use compact, low-power consumption smart devices. Similarly, security systems can be implemented in precision agriculture that deal with sensitive data to prevent unauthorized parties from accessing the obtained data. In addition, sensors are not available to directly monitor soil essential nutrients such as N and K. Instead, the EC sensor can be used to monitor available nutrients in soil indirectly because a higher EC denotes a higher number of ions in the soil solution [22]. However, in order to properly monitor soil nutrient status, it is crucial to identify the variables that influence sensor EC.
Therefore, the main objective of this study is to evaluate the possibility of employing an EC sensor to monitor the nutrient status of different fertilizers applied to soil and factors related to EC sensor values. The physicochemical characteristics of the soils treated with various fertilizers were assessed in this study. Additionally, principal component analysis (PCA) was performed to evaluate the relationship among variables.

2. Materials and Methods

2.1. Fertilizer Treatment of Spring Onion Field

The experimental site was located in Mungwang-myeon, Goesan-gun, Republic of Korea (Figure S1). Before planting spring onions (Allium fistulosum), the soil was sampled and tested for soil texture, pH, electrical conductivity (EC), and available nutrients. The soil texture was analyzed using a micropipette method, and the pH and EC of the soil were measured using pH and EC electrodes (Orion Star A215, ThermoFisher Scientific, Waltham, MA, USA), respectively. The available nutrients were analyzed using inductively coupled plasma optical emission spectroscopy (ICP–OES, Avio 500, Perkin Elmer, Waltham, MA, USA) after extracting 2 g of soil with 20 mL 1 M ammonium acetate (NH4OAC) solution for 30 min. The analyzed soil was silt loam, and the initial pH and EC were 4.9 and 0.8 dS/m, respectively. According to the soil test results, the recommended dose of CaCO3·MgCO3 (300 kg/10a) and manure compost (460 kg/10a) was added to the experimental area. The experimental area was divided into six different parts (3 × 4 m in each part), and different basal fertilizers were applied on 15 April 2021 as inorganic, organic (mixed oilcake, N-P2O5-K2O = 4-2-1%), and manure compost (N-P2O5-K2O = 1.8-1.9-1.3%). The recommended doses of K, P2O5, and K2O were 15.2, 3.0, and 13.7 kg/10a, respectively (Table S1) [23]. Phosphate was supplied uniformly as basal fertilizer with organic or manure compost and supplemented with fused phosphate. The spring onion seedlings were transplanted on 23 April 2021 and cultivated by applying additional fertilizer with an automatic fertigation system to supply N and K as urea and KCl, respectively. During the spring onion cultivation, the water potential was set at −33 kPa for irrigation control. The water potential was controlled by the mean value of two soil water potential sensors (Teros 21, Meter Group, Pullman, WA, USA) connected to a datalogger (CR1000, Campbell Scientific, Logan, UT, USA) in the experimental area. For each basal fertilizer treatment, the applied basal and additional fertilizer ratios were N 30:70, K 40:60, and N 20:80, K 20:80, respectively (Table S1). Additional fertigation (five times) was supplied 30 days after transplanting (DAT) and every two weeks from June to July 2021 [23].

2.2. Monitoring of Soil EC Using a Sensor

During the cultivation, an EC sensor (Teros 12, Meter Group, Pullman, WA, USA) was inserted into each soil with a different fertilizer treatment to monitor the water content and changes in the soil bulk EC. The soil sensor was buried approximately 10 cm from the soil surface between two spring onions in a furrow in the middle of the treated plot. The soil sensors were connected to a data logger (Zn6, Meter Group, Pullman, WA, USA), and the water content, soil temperature, and bulk EC were recorded every 15 min from 28 June to 5 August 2021. For correlation analysis, the sensor was calibrated for 20% water content because the sensor EC linearly increased with the water content in the soil.

2.3. Analysis of Soil Chemical Properties

Spring onion plants were harvested on 6 August 2021 (105 DAT), and the soils were collected to a 10 cm depth from the different fertilizer-treated plots at 32 DAT, 66 DAT, and 102 DAT. The composite soil samples were mixed properly and air-dried at room temperature for 2 days. After air drying, the soil was passed through a 2 mm stainless steel sieve and stored in an airtight polythene bag until further use. For analyzing pH and EC, 5 g of soil was placed into a 50 mL conical centrifuge tube with 25 mL of distilled water and shaken at 120 rpm for 30 min, and the pH and EC of the supernatant were measured using pH and EC electrodes, respectively. The water-soluble soil nutrient contents were determined with ICP–OES after extracting 5 g soil with 25 mL distilled water in a 50 mL conical centrifuge tube at 120 rpm for 30 min. The available nutrient concentrations in the soil were analyzed with ICP–OES after extracting 2 g of soil with 20 mL 1 M ammonium acetate solution for 30 min. The exchangeable ammonium nitrogen (NH4+-N) and nitrate nitrogen (NO3-N) in the soil were extracted with 2 M KCl and analyzed using the indophenol-blue method and vanadium (III) reduction method, respectively, using a microplate photometer (MultiskanTM FC, ThermoFisher Scientific, Waltham, MA, USA).

2.4. Statistical Analysis

The statistical analysis of the experimental data was performed using Statistical Packages for Social Sciences (SPSS Statistics 27, IBM, Armonk, NY, USA). Analysis of variance (ANOVA) followed by Duncan’s multiple range test was used for mean comparison among the treatment groups at p-value < 0.05. The correlation analysis among the soil properties under different fertilizer treatments and principal component analysis (PCA) was conducted using XLSTAT software (2022, Lumivero, Denver, CO, USA).

3. Results and Discussion

3.1. Effect of Different Basal Fertilizers on Soil Chemical Properties

The soil pH was moderately affected by the treatment of various basal fertilizers (Table 1). The results revealed that the soil applied with organic fertilizer (N80, K80) exhibited a lower pH, but a lower amount of basal compost (N80, K80) showed a relatively higher pH (Table 1). The release of a hydrogen ion from the quick degradation of biomass by microbial flora may be the cause of the lower soil pH following the application of organic fertilizer. According to earlier studies, the initial soil pH decreased from 6.4 to 4.6 with the application of organic fertilizer and quick degradation of the biomass into dissolved organic acids [24]. The soil pH decreased as organic fertilizer was applied more frequently or in a higher dose, which is analogous to prior studies [25]. Another cause of the reduction of the soil pH could also be the rapid nitrification of NH4-N in the soil [26]. The pH was inversely related to the nitrate concentration because nitrification releases protons and reduces soil pH (Table 2) [27].
The EC response of the soil treated with various fertilizers varied in accordance with the type of basal fertilizer and dose. The average EC of the inorganic fertilizer-treated soil was relatively higher than that of the other treatments. The increase in soil EC might be attributed to the easy release of nutrients from the applied fertilizers [28]. Compared with organic fertilizer, the soil treated with compost fertilizer exhibited a greater EC response, possibly due to the greater amount of organic matter present in the compost [29]. Earlier findings demonstrated that the EC response is strongly associated with the amount of organic matter present in compost and manure [29]. The EC response of compost was augmented as the dose of basal fertilizer application increased (Table 1). Manure compost has several soluble salts, including Mg, Ca, and HCO3, which lead to an increased EC [30,31]. A similar result was also noticed by Lakshmi, who found that soil treated with farmyard manure (FYM) had a larger EC response than the inorganic-treatment group because FYM released more electrolytes [32].
The amount of nitrate in the soil was substantially higher after a high amount of compost application (compost (N70, K60)) over the other treatment groups, and it was highly correlated to the soil EC (Table 1). The higher nitrate concentration in the soil treated with compost might be a result of greater mineralization of N by microbial activity. A previous study also reported that applying organic manure raised soil nitrate levels, which is identical to our findings [33,34]. Similarly, Wang et al., described that the nitrate concentration in the soil profile of a vegetable field increased substantially because of excessive manure application [35].
Although several processes, including plant uptake, soil organisms, atmospheric N2 fixation, mineralization, deposition, volatilization, and denitrification, affect nitrate levels in the soil, nitrate concentration was related to the soil EC (Table 1) [36]. These results suggested that a high nitrate content in the compost-fertilized soil could be one of the factors contributing to a rise in the soil EC. Exchangeable K, Ca, and Mg contents showed a similar trend to EC and nitrate in relation to different fertilizer treatments. A higher amount of the basal fertilizer treatment showed higher exchangeable cations, and compost fertilizer elucidated relatively higher exchangeable cations than the other basal fertilizers (Table 1).
After two times of fertigation (66 DAT), the inorganic fertilizer-treated plot showed higher water-soluble nutrients; however, exchangeable nutrients did not show consistent results according to the different fertilizer applications (Tables S2 and S3). The EC, nitrate, and water-soluble nutrients increased with increasing additional fertilizers except for compost (Table S2). In the case of compost treatment as the basal fertilizer, an increased ratio of additional fertilizer did not affect the soluble nutrients, which could be related to the adsorption of cations on organic matter. According to Shin et al., the functional groups present on the surface of organic matter contributed to the greater adsorption of cations [37]. The bonding forces between the surface charge of the cations and the functional groups of the organic matter formed organo-mineral interactions [38]. The soluble nutrient concentrations decreased after five times of fertigation (102 DAT), while the exchangeable nutrients increased after fertigation (Tables S2 and S3). The yield of spring onion was not significantly affected by the different types of basal fertilizer and fertigation ratio, but nitrogen uptake by spring onion was decreased with an increasing fertigation ratio, signifying that N uptake depends on the N concentration in the soil at the early stage of plant growth [23,39].

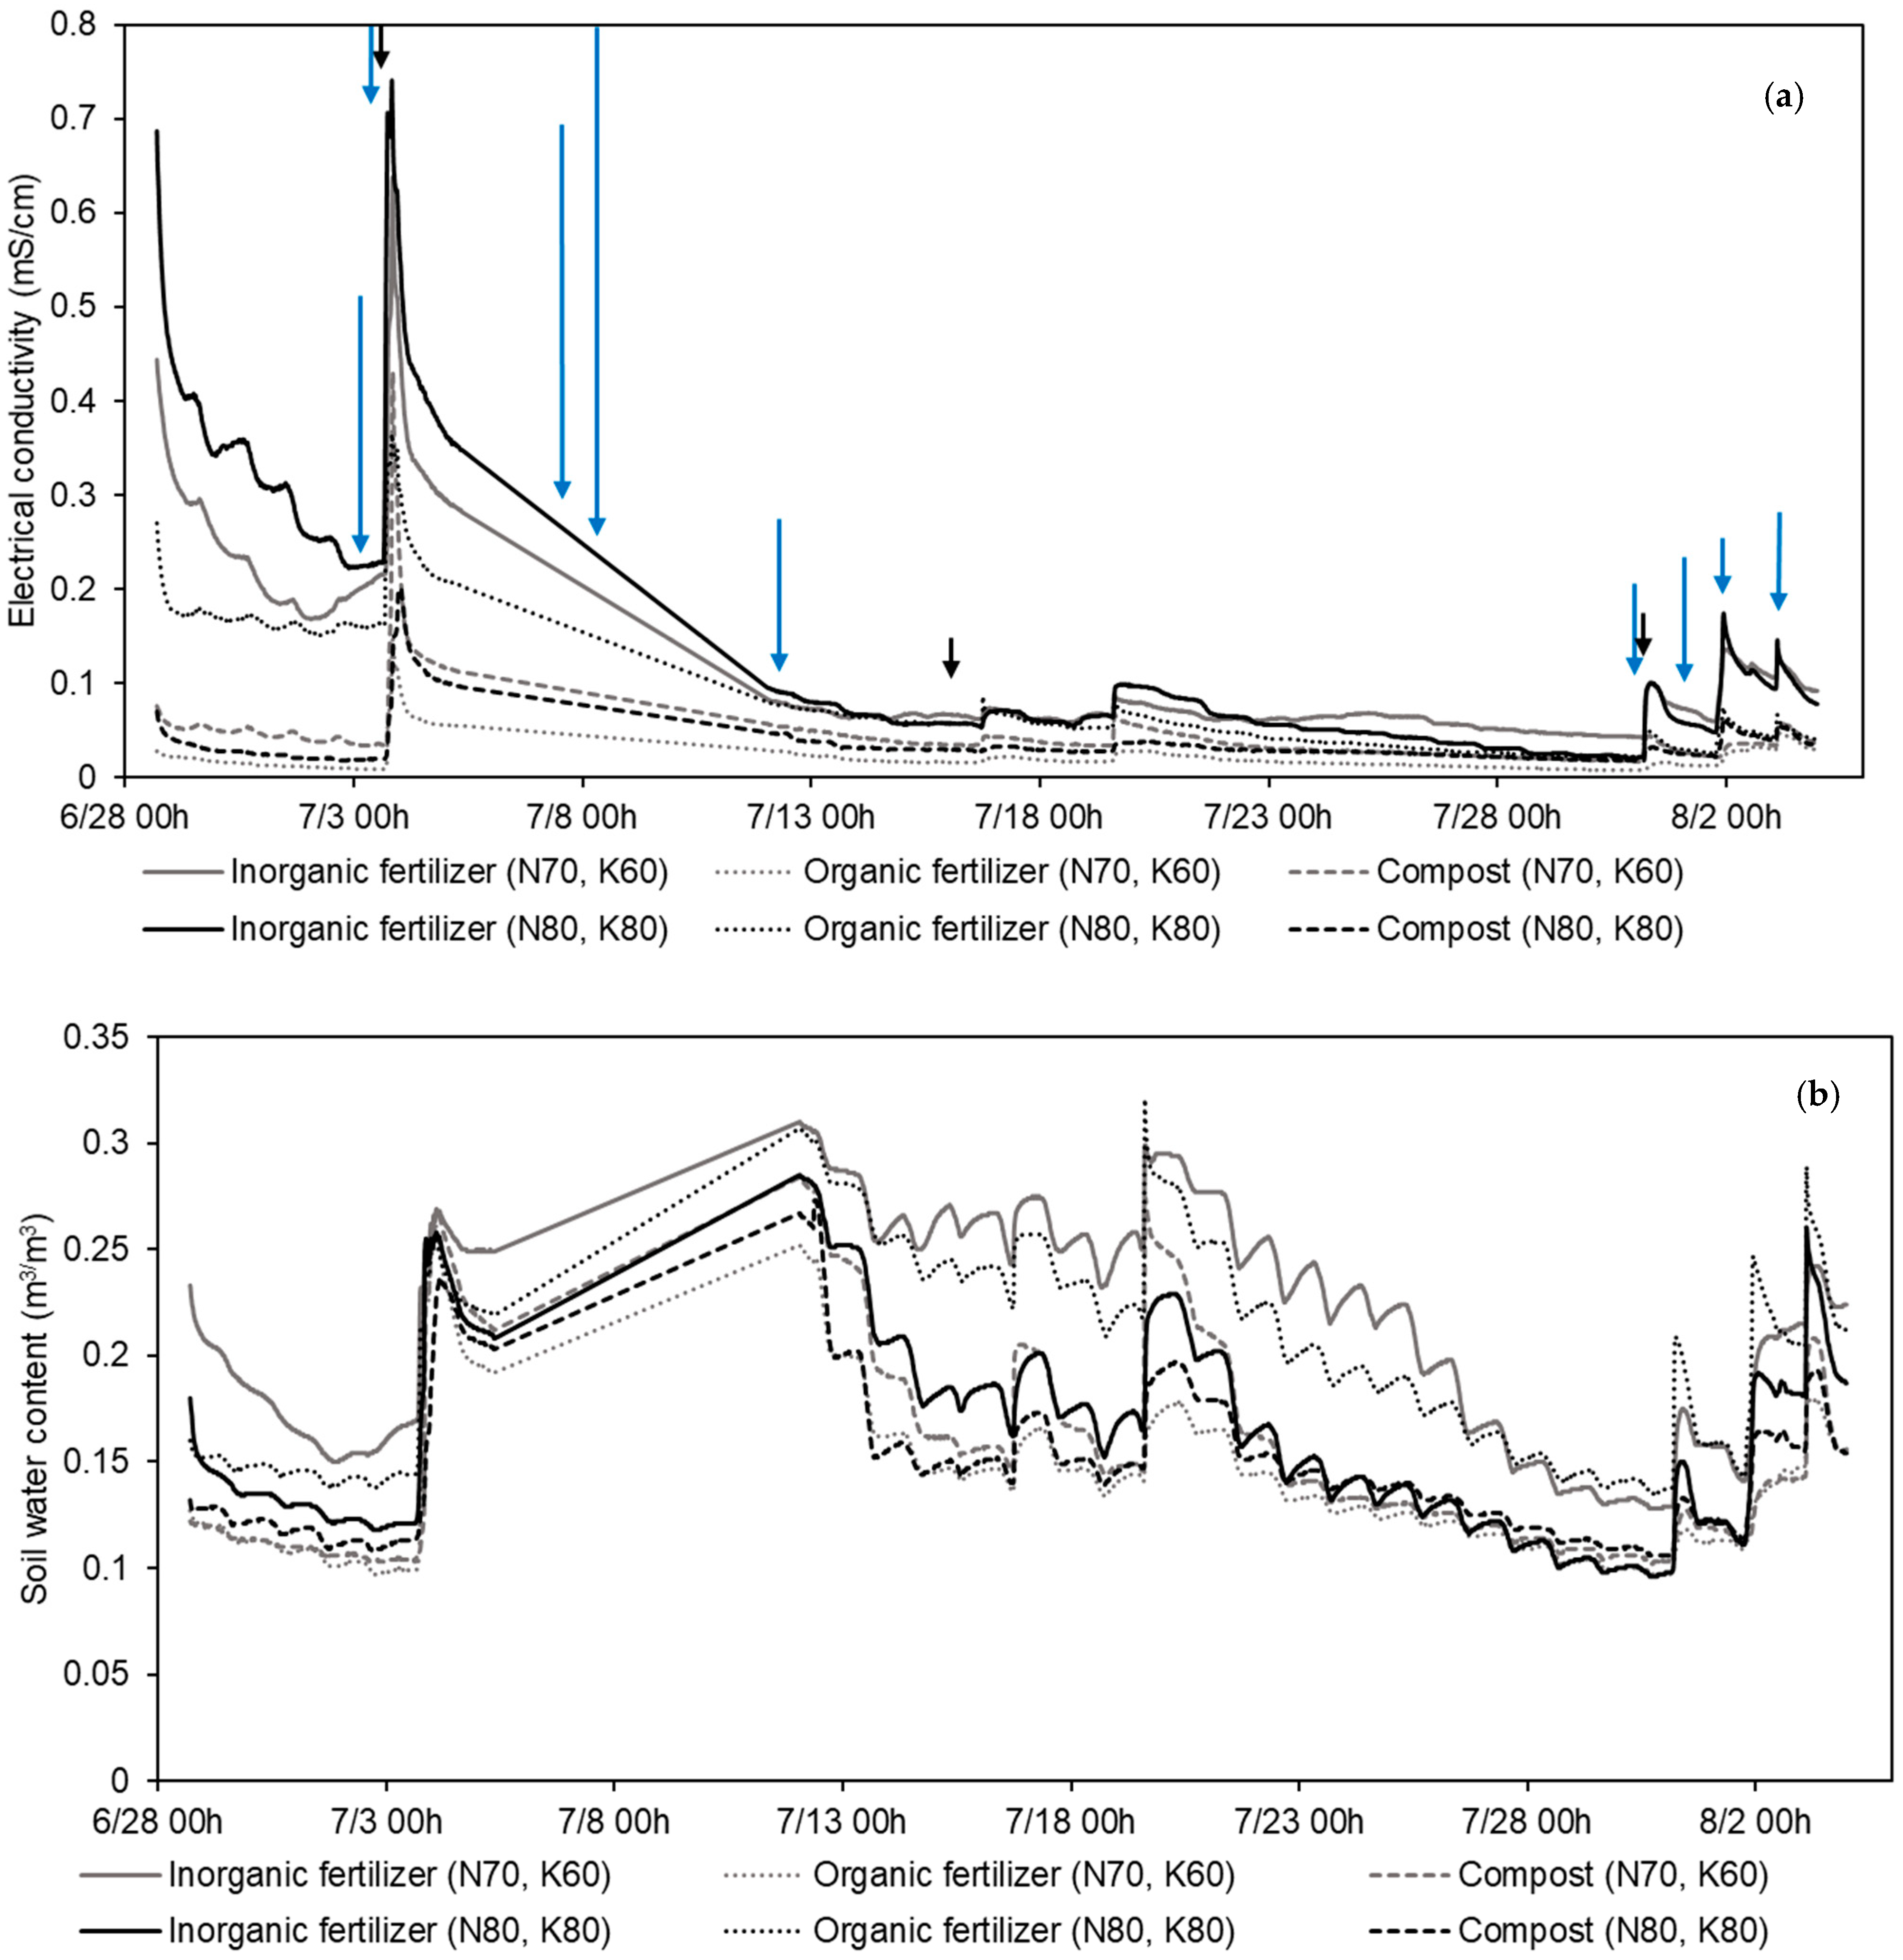
3.2. Monitoring of Sensor EC

The soil EC increased as fertilizer and water were added to the soil (Figure 1a). In this work, according to the soil water potential, water was provided by an automatic system, and the water content increased with irrigation and fertigation (Figure 1b). Water facilitates the ion liberation process and raises the EC response [40], which is concordant with our results. Ions transport electrons, and the number of ions available or capable of transporting electrons affects EC. Vitz et al., reported that the soluble ions that exist in the water contribute to the passage of electrons from one electrode to another [41].
Inorganic fertilizer and a higher fertigation ratio exhibited the highest EC followed by compost and organic fertilizer (Figure 1a). The soil treated with inorganic fertilizer with a higher ratio of additional fertilizer (N80, K80) showed a greater EC response than the other treatment groups, which might be explained by the easy solubilization of inorganic fertilizers in water relative to the other fertilizers. Ozlu and Kumar reported a similar outcome, showing that soil EC was increased by 33% while applying the inorganic fertilizer compared to manure [31].
The EC monitoring data were initially different among the treatments, but the difference was not significant after maturing spring onion. Lee et al., observed that, after 14 days of tomato plantation, the plants started to grow rapidly, and the EC dropped quickly, suggesting that EC was directly related to the amount of available ions and plant growth [42]. However, the solubility of nutrients is highly influenced by the pH factor [43]. Therefore, the pH, amount of soil organic matter, and chemical properties of the fertilizer could be responsible for the availability of a higher amount of nutrients in the soil with the addition of inorganic fertilizer.

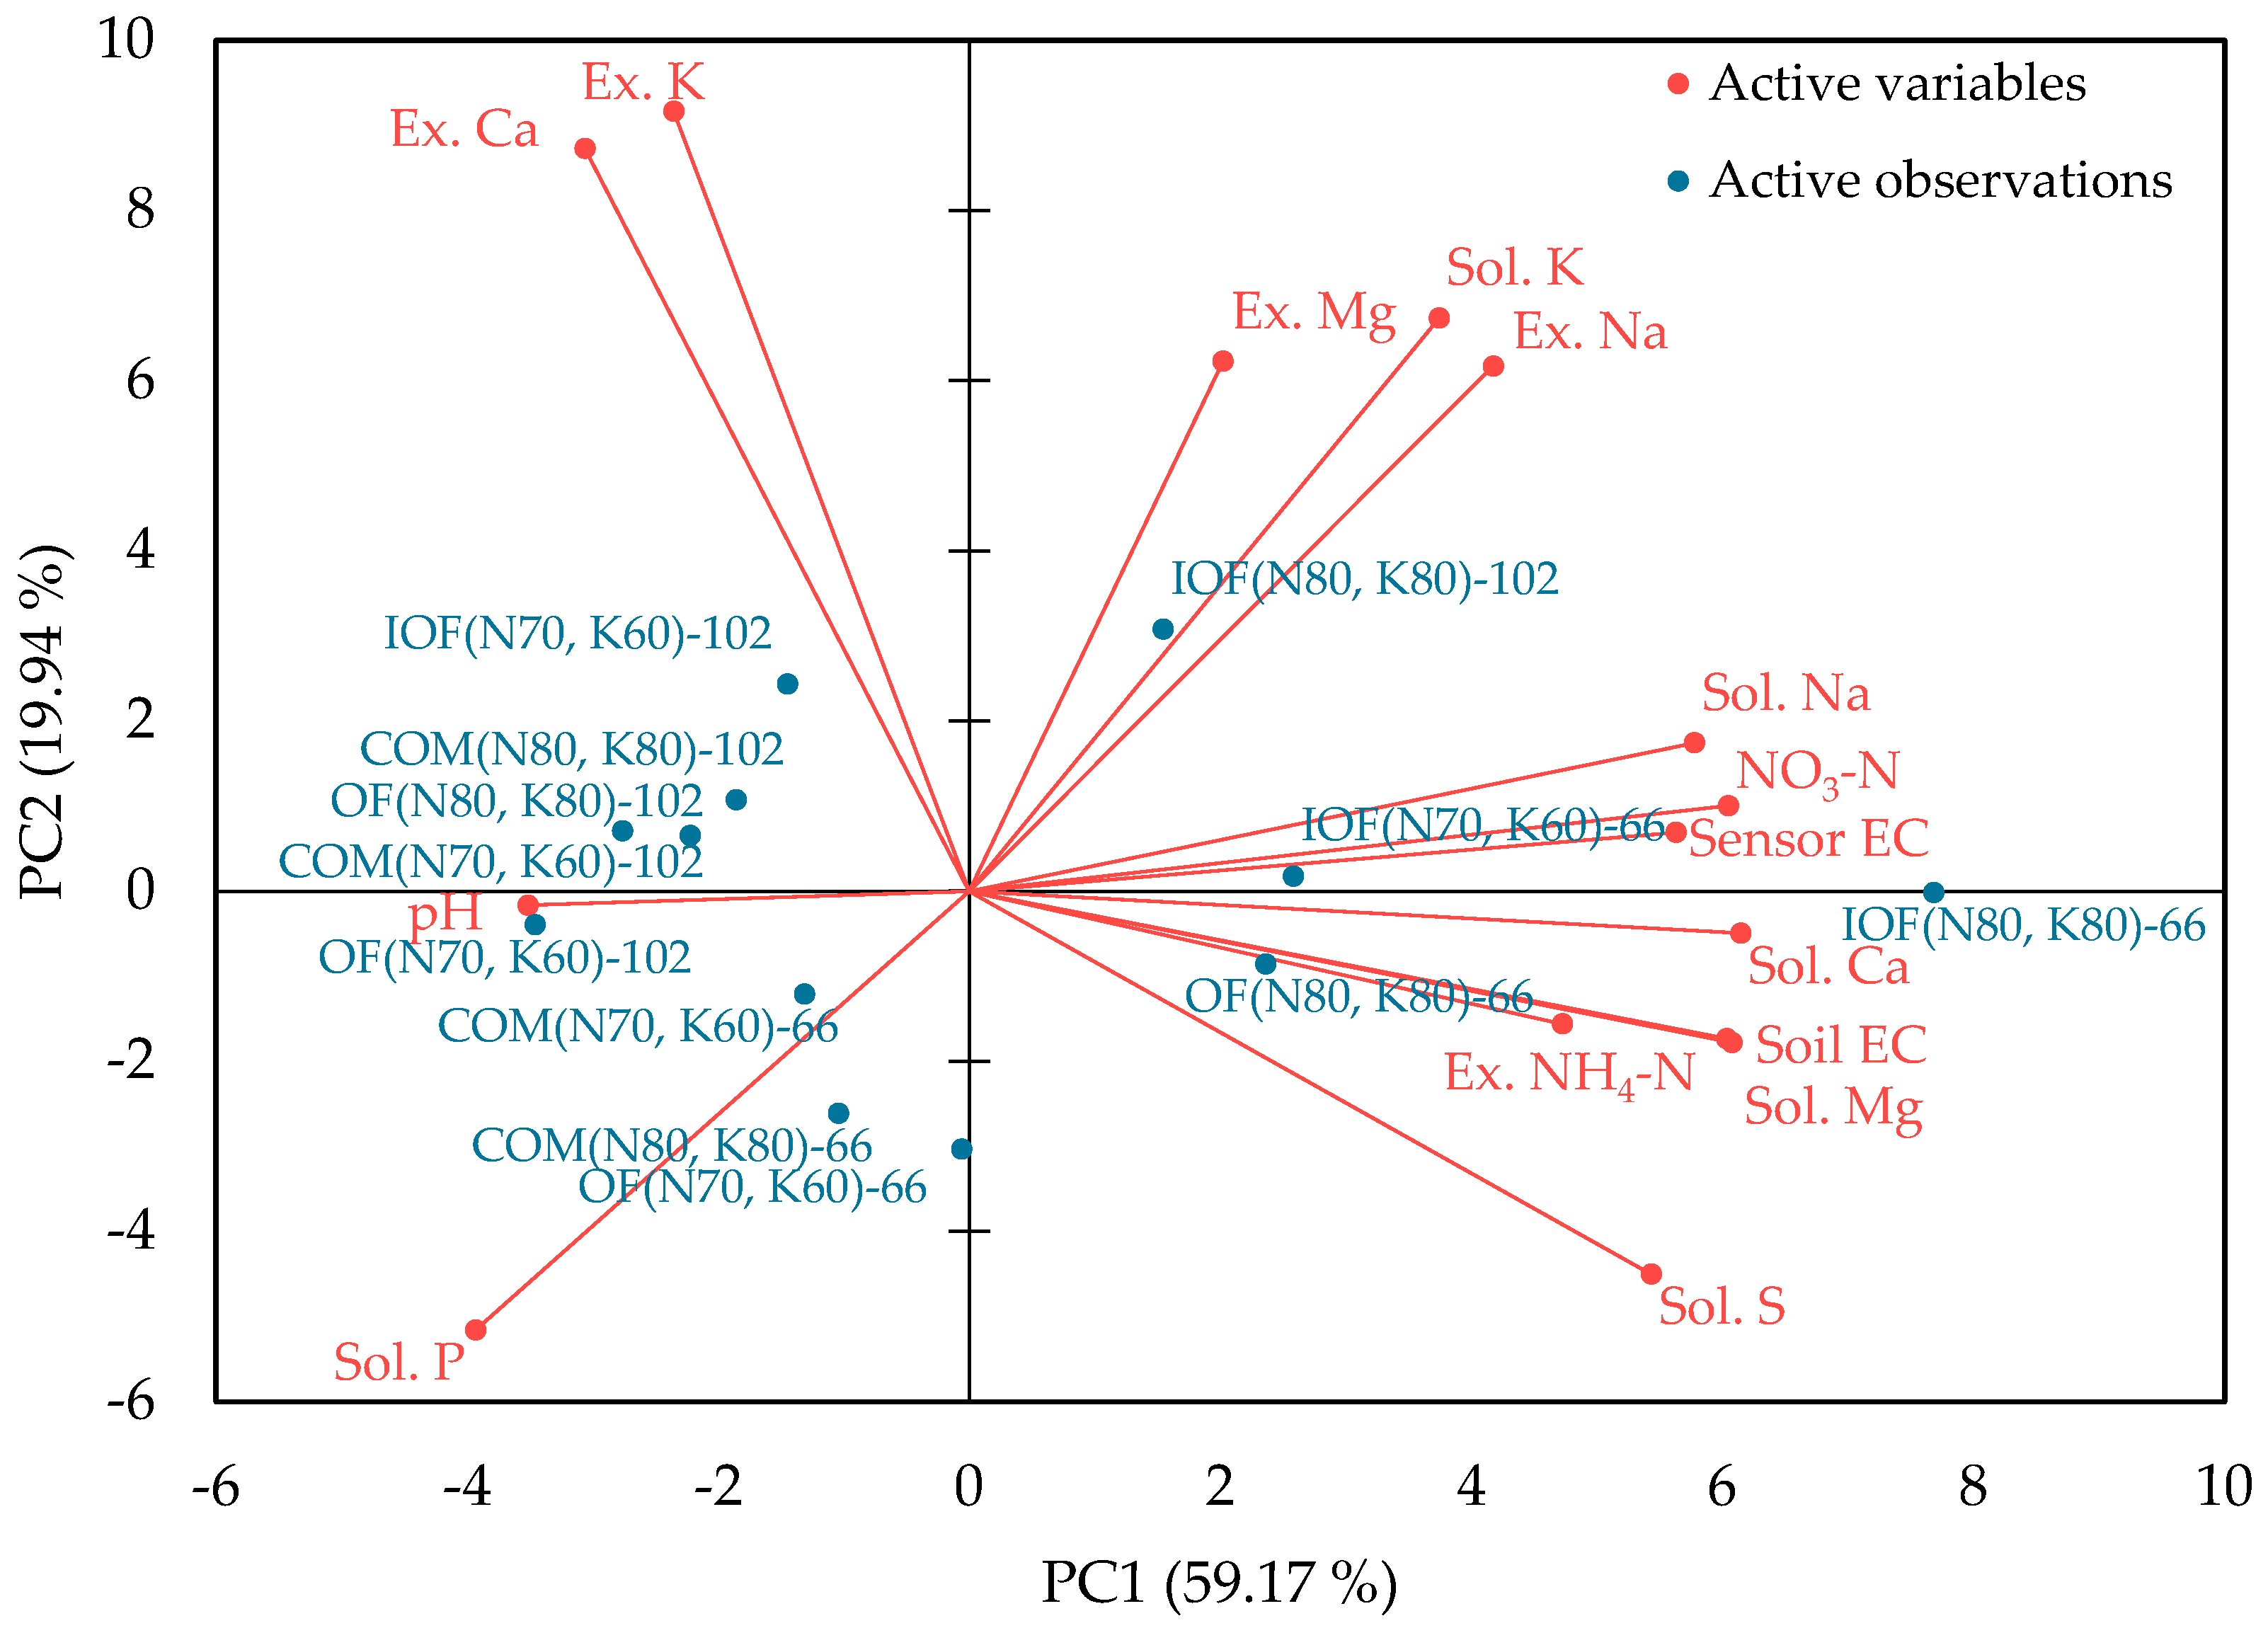
3.3. Correlation of Sensor EC Value and Elemental Contents of Different Fertilized Soils

Various fertilizers were applied in the soil to test if the sensor EC could correlate with the soil available nutrients. The correlation analysis revealed a positive correlation of the sensor EC with the water-extracted EC values and showed a strong positive association with all the water-soluble elements except phosphorous (p < 0.05) (Table 2). A poor correlation between the EC and P could be due to the immobilization of P in the soil into insoluble compounds like calcium–phosphate minerals [44]. Park and Sung described a correlation study of EC and soil elements that exhibited a positive association with all elements excluding P [45]. Similar findings had also been found by Mazur et al., showing a positive correlation of EC with macronutrients except P [46].
Although fertigation supplied only N and K, other available nutrients such as Ca and Mg also increased because of the cation exchange reaction. Water-soluble Ca and Mg were highly correlated with nitrate and exchangeable ammonium (NH4+). Therefore, the sum of the water-soluble nutrients was also highly correlated with the sensor EC (Table 2). However, the correlation between the extracted EC, sensor EC, and exchangeable element contents did not show a strong correlation except NH4+ (Table 2). The K did not exhibit a substantial correlation with EC, which could be because K is a mobile nutrient that was exponentially absorbed by the plant [47]. An adequate amount of Ca is favorable for higher K uptake by roots, which could be another reason [48]. However, the dose of fertilizer application, plant species, and irrigation all have an impact on the amount of nutrients in the top layer of soil [49]. Principal component analysis was performed with averaged sensor EC values of the sampling day and chemical properties analyzed for different fertilizer-treated soils, and the projections of the cases with two principal components were imaged in Figure 2. PC1 and PC2 accounted for 59.17% and 19.94% of the total variation, respectively. The sensor EC was strongly associated with nitrate and soluble Ca and Na and negatively related to the soil pH. PC1 was strongly associated with soluble nutrients, while PC2 was related to exchangeable nutrients (Table 3 and Figure 2). The application of inorganic fertilizers was substantially correlated with sensor EC, soluble Na, Ca, Mg, and nitrate among the variables.
Overall, this study revealed that the amounts of soluble nutrients and N had a significant impact on the variations in EC response and were positively correlated with the sensor EC values. The results imply a strong correlation between the extracted values of elemental contents and the sensor EC values, suggesting that EC sensors can be used to monitor soil nutrients, particularly N. Measuring soil EC could be a valuable indicator for determining available N and a key marker for determining soil fertility [50]. However, the EC sensor technology has several limitations because various factors, such as temperature, cropping, irrigation systems, land usage, and fertilizers, have varying effects on soil EC. For example, in the case of temperature, the mobility of ions under electrostatic potential rises with temperature and eventually enhances the EC response [51]. However, the mobility of ions progressively slows down and begins to idle at a lower or cooler temperature of the water or soil, which reduces their activity and ultimately lowers the soil EC [52]. Therefore, different factors should be considered when applying soil EC sensors for monitoring nutrient levels in other types of soil.

4. Conclusions

An EC sensor was successfully implemented in the field for monitoring soil nutrients. Compared to the other fertilizer groups, the inorganic fertilizer raised the soil EC response in this study, which was also represented by an EC sensor value, and showed a strong positive correlation with soluble nutrient contents. Therefore, monitoring EC values using soil sensors could be used to estimate the amount of fertilizer needed in the field. It was also found that the fertilizer application rate, soil moisture, and pH significantly affect the EC response. Overall, this research demonstrated that soil nutrients, particularly N, greatly affect the EC sensor response, suggesting that EC sensor technology could be prominently adopted for monitoring soil nutrients to promote crop development and reduce the probable risk of environmental pollution. Future work will be conducted on monitoring soil nutrients from various localities with an EC sensor and their correlation according to the soil texture.

Supplementary Materials

The following supporting information can be downloaded at: https://www.mdpi.com/article/10.3390/agronomy13082156/s1, Supplementary Material Figure S1. Location map of the experimental site, atmospheric temperature, and precipitation during spring onion cultivation. Supplementary Material Table S1: Amount of applied fertilizer for different spring onion cultivation plots. Supplementary Material Table S2: pH, EC, and water-soluble element concentrations (cmolc/kg) of different fertilizer-applied soils. Supplementary Material Table S3: Exchangeable ammonium and ammonium acetate extractable element concentrations (cmolc/kg).

Author Contributions

Conceptualization, J.H.P.; methodology, G.D.V.; software, Y.J.S., H.N.K. and J.H.P.; validation, J.H.P.; formal analysis, G.D.V.; investigation, G.D.V. and J.H.P.; data curation, G.D.V.; writing—original draft preparation, G.D.V.; writing—review and editing, Y.L. and J.S.; visualization, G.D.V.; supervision, J.H.P.; funding acquisition, J.H.P. All authors have read and agreed to the published version of the manuscript.

Funding

This research was funded by the “Cooperative Research Program for Agriculture Science & Technology Development (Project No. PJ0156352021)” Rural Development Administration, Republic of Korea.

Data Availability Statement

Data supporting the findings of this study are available within the article and Supplementary Materials.

Conflicts of Interest

The authors declare no conflict of interest.

References

  1. Cakmak, I. Plant Nutrition Research: Priorities to Meet Human Needs for Food in Sustainable Ways. Plant Soil 2002, 247, 3–24. [Google Scholar] [CrossRef]
  2. Akhtar, M.N.; Shaikh, A.J.; Khan, A.; Awais, H.; Bakar, E.A.; Othman, A.R. Smart Sensing with Edge Computing in Precision Agriculture for Soil Assessment and Heavy Metal Monitoring: A Review. Agriculture 2021, 11, 475. [Google Scholar] [CrossRef]
  3. Ramesh, C.K.; Rashmi, T.S.; Kavya, B.K.; Manjula, K.; Meghana, M. Spring onion (leaves of Allium cepa): As green antioxidants. Int. J. Creat. Res. Thoughts 2018, 6, 2320–2882. [Google Scholar]
  4. Khokhar, K.M. Mineral Nutrient Management for Onion Bulb Crops—A Review. J. Hortic. Sci. Biotechnol. 2019, 94, 703–717. [Google Scholar] [CrossRef]
  5. Godfray, H.C.J.; Beddington, J.R.; Crute, I.R.; Haddad, L.; Lawrence, D.; Muir, J.F.; Pretty, J.; Robinson, S.; Thomas, S.M.; Toulmin, C. Food Security: The Challenge of Feeding 9 Billion People. Science 2010, 327, 812–818. [Google Scholar] [CrossRef] [PubMed]
  6. Zhang, W. Global Pesticide Use: Profile, Trend, Cost/Benefit and More. Proc. Int. Acad. Ecol. Environ. Sci. 2018, 8, 1. [Google Scholar]
  7. Kimani, S.K.; Nandwa, S.; Mugendi, D.; Obanyi, S.N.; Ojiem, J.; Murwira, H.K.; Bationo, B.A. Principles of Integrated Soil Fertility Management. In Soil Fertility Management in Africa: A Regional Perspective; Academy Science Publishers (ASP); Centro Internacional de Agricultura Tropical (CIAT); Tropical Soil Biology and Fertility (TSBF): Nairobi, Kenya, 2003. [Google Scholar]
  8. Wu, L.; Jiang, Y.; Zhao, F.; He, X.; Liu, H.; Yu, K. Increased Organic Fertilizer Application and Reduced Chemical Fertilizer Application Affect the Soil Properties and Bacterial Communities of Grape Rhizosphere Soil. Sci. Rep. 2020, 10, 9568. [Google Scholar] [CrossRef]
  9. Han, S.H.; An, J.Y.; Hwang, J.; Kim, S.B.; Park, B.B. The Effects of Organic Manure and Chemical Fertilizer on the Growth and Nutrient Concentrations of Yellow Poplar (Liriodendron tulipifera Lin.) in a Nursery System. For. Sci. Technol. 2016, 12, 137–143. [Google Scholar] [CrossRef]
  10. Morgan, J.B.; Connolly, E.L. Plant-Soil Interactions: Nutrient Uptake. Nat. Educ. Knowl. 2013, 4, 2. [Google Scholar]
  11. Philippine Statistics Authority (PSA). Highlights of the 2010 Census-Based Population Projections; 2016-090; Philippine Statistics Authority (PSA): Diliman Quezon City, Philippines, 2016.
  12. Qu, F.; Jiang, J.; Xu, J.; Liu, T.; Hu, X. Drip Irrigation and Fertilization Improve Yield, Uptake of Nitrogen, and Water-Nitrogen Use Efficiency in Cucumbers Grown in Substrate Bags. Plant Soil Environ. 2019, 65, 328–335. [Google Scholar] [CrossRef]
  13. Praharaj, C.S.; Bandyopadhyay, K.K.; Sankaranarayanan, K. Integrated Nutrient Management Strategies for Increasing Cotton Productivity; Central Institute for Cotton Research, Regional Station: Coimbatore, India, 2007. [Google Scholar]
  14. Willett, W.; Rockström, J.; Loken, B.; Springmann, M.; Lang, T.; Vermeulen, S.; Garnett, T.; Tilman, D.; DeClerck, F.; Wood, A.; et al. Food in the Anthropocene: The EAT–Lancet Commission on Healthy Diets from Sustainable Food Systems. Lancet 2019, 393, 447–492. [Google Scholar] [CrossRef] [PubMed]
  15. Shi, X.; An, X.; Zhao, Q.; Liu, H.; Xia, L.; Sun, X.; Guo, Y. State-of-the-Art Internet of Things in Protected Agriculture. Sensors 2019, 19, 1833. [Google Scholar] [CrossRef] [PubMed]
  16. Burton, L.; Jayachandran, K.; Bhansali, S. Review—The “Real-Time” Revolution for In Situ Soil Nutrient Sensing. J. Electrochem. Soc. 2020, 167, 037569. [Google Scholar] [CrossRef]
  17. Zhang, B.; Li, M.; Li, Q.; Cao, J.; Zhang, C.; Zhang, F.; Song, Z.; Chen, X. Accumulation and Distribution Characteristics of Biomass and Nitrogen in Bitter Gourd (Momordica charantia L.) under Different Fertilization Strategies. J. Sci. Food Agric. 2018, 98, 2681–2688. [Google Scholar] [CrossRef] [PubMed]
  18. Ma, Q.; Bell, R.; Biddulph, B. Potassium Application Alleviates Grain Sterility and Increases Yield of Wheat (Triticum Aestivum) in Frost-Prone Mediterranean-Type Climate. Plant Soil 2019, 434, 203–216. [Google Scholar] [CrossRef]
  19. Raese, J.T.; Drake, S.R.; Curry, E.A. Nitrogen Fertilizer Influences Fruit Quality, Soil Nutrients and Cover Crops, Leaf Color and Nitrogen Content, Biennial Bearing and Cold Hardiness of “Golden Delicious”. J. Plant Nutr. 2007, 30, 1585–1604. [Google Scholar] [CrossRef]
  20. Ishida, K.; Shikata, H.; Terao, K.; Takao, H.; Kobayashi, T.; Kataoka, I.; Shimokawa, F. Microsensor Device for Simultaneously Measuring Moisture Nutrient Substance Dynamics in Plants. In Proceedings of the IEEE Sensors, Montreal, QC, Canada, 27–30 October 2019. [Google Scholar] [CrossRef]
  21. García, L.; Parra, L.; Jimenez, J.M.; Parra, M.; Lloret, J.; Mauri, P.V.; Lorenz, P. Deployment Strategies of Soil Monitoring WSN for Precision Agriculture Irrigation Scheduling in Rural Areas. Sensors 2021, 21, 1693. [Google Scholar] [CrossRef]
  22. Othaman, N.N.C.; Isa, M.N.M.; Hussin, R.; Ismail, R.C.; Naziri, S.Z.M.; Murad, S.A.Z.; Harun, A.; Ahmad, M.I. Development of Soil Electrical Conductivity (EC) Sensing System in Paddy Field. J. Phys. Conf. Ser. 2021, 1755, 012005. [Google Scholar] [CrossRef]
  23. Lee, Y.; Sung, J.; Song, Y.; Kim, Y.; Hyun, B.; Kang, S.-S. The Effects on Nutrients Uptake and Soil Chemical Properties According to Fertigation Ratio of Green Onion (Allium fistulosum L.) in Open Field. Korean J. Soil Sci. Fertil. 2022, 55, 113–120. [Google Scholar] [CrossRef]
  24. Anda, M.; Syed Omar, S.R.; Shamshuddin, J.; Fauziah, C.I. Changes in Properties of Composting Rice Husk and Their Effects on Soil and Cocoa Growth. Commun. Soil Sci. Plant Anal. 2008, 39, 2221–2249. [Google Scholar] [CrossRef]
  25. Chang, C.; Sommerfeldt, T.G.; Entz, T. Rates of Soil Chemical Changes with Eleven Annual Applications of Cattle Feedlot Manure. Can. J. Soil Sci. 1990, 70, 673–681. [Google Scholar] [CrossRef]
  26. Eghball, B. Soil Properties as Influenced by Phosphorus- and Nitrogen-Based Manure and Compost Applications. Agron. J. 2002, 94, 128–135. [Google Scholar] [CrossRef]
  27. Souza, J.L.B.; Antonangelo, J.A.; Zhang, H.; Reed, V.; Finch, B.; Arnall, B. Impact of Long-Term Fertilization in No-till on the Stratification of Soil Acidity and Related Parameters. Soil Tillage Res. 2023, 228, 105624. [Google Scholar] [CrossRef]
  28. do Carmo, D.L.; de Lima, L.B.; Silva, C.A. Soil Fertility and Electrical Conductivity Affected by Organic Waste Rates and Nutrient Inputs. Rev. Bras. Cienc. Solo 2016, 40, e0150152. [Google Scholar] [CrossRef]
  29. Walker, D.J.; Bernal, M.P. The Effects of Olive Mill Waste Compost and Poultry Manure on the Availability and Plant Uptake of Nutrients in a Highly Saline Soil. Bioresour. Technol. 2008, 99, 396–403. [Google Scholar] [CrossRef] [PubMed]
  30. Wong, J.W.C.; Ma, K.K.; Fang, K.M.; Cheung, C. Utilization of a Manure Compost for Organic Farming in Hong Kong. Bioresour. Technol. 1999, 67, 43–46. [Google Scholar] [CrossRef]
  31. Ozlu, E.; Kumar, S. Response of Soil Organic Carbon, PH, Electrical Conductivity, and Water Stable Aggregates to Long-Term Annual Manure and Inorganic Fertilizer. Soil Sci. Soc. Am. J. 2018, 82, 1243–1251. [Google Scholar] [CrossRef]
  32. Lakshmi, P.V. Evaluation of Soil Fertility and Quality Characters of Paddy Varieties. Master’s Thesis, Andhra Pradesh Agricultural University (APAU), Hyderabad, India, 1991. [Google Scholar]
  33. Ogundijo, D.; Adetunji, M.; Azeez, J.; Arowolo, T.; Olla, N.; Adekunle, A. Influence of Organic and Inorganic Fertilizers on Soil Chemical Properties and Nutrient Changes in an Alfisol of South Western Nigeria. Int. J. Plant Soil Sci. 2015, 7, 329–337. [Google Scholar] [CrossRef]
  34. Magdoff, F.; Es, H.V. What Is Organic Matter and Why Is It So Important—SARE, 4th ed.; Sustainable Agriculture Research and Education: College Park, MD, USA, 2021. [Google Scholar]
  35. Wang, L.H.; Zhao, X.; Wang, X. Effect of co-application of organic and nitrogen fertilizer on nitrate content of cucumber and soil in greenhouse. Chin. J. Soil Sci. 2006, 14, 103–106. [Google Scholar]
  36. Schimel, J.P.; Bennett, J. Nitrogen Mineralization: Challenges of a Changing Paradigm. Ecology 2004, 85, 591–602. [Google Scholar] [CrossRef]
  37. Shin, D.H.; Ko, Y.G.; Choi, U.S.; Kim, W.N. Design of High Efficiency Chelate Fibers with an Amine Group to Remove Heavy Metal Ions and PH-Related FT-IR Analysis. Ind. Eng. Chem. Res. 2004, 43, 2060–2066. [Google Scholar] [CrossRef]
  38. Grimaldi, M.; Schroth, G.; Teixeira, W.G.; Huwe, B. Soil Structure. In Trees, Crops and Soil Fertility: Concepts and Research Methods; CABI Publishing: Wallingford, UK, 2002; pp. 191–208. [Google Scholar] [CrossRef]
  39. Geisseler, D.; Ortiz, R.S.; Diaz, J. Nitrogen Nutrition and Fertilization of Onions (Allium cepa L.)—A Literature Review. Sci. Hortic. 2022, 291, 110591. [Google Scholar] [CrossRef]
  40. Othaman, N.N.C.; Isa, M.N.M.; Ismail, R.C.; Ahmad, M.I.; Hui, C.K. Factors That Affect Soil Electrical Conductivity (EC) Based System for Smart Farming Application. In AIP Conference Proceedings of the 2nd International Conference on Applied Photonics and Electronics 2019 (InCAPE 2019), Putrajaya, Malaysia, 22 August 2019; AIP Publishing: Melville, NY, USA, 2020; Volume 2203, p. 020055. [Google Scholar] [CrossRef]
  41. Vitz, E.D.; Moore, J.W.; Shorb, J.; Prat-Resina, X.; Wendorff, T.; Hahn, A. 11.2: Ions in Solution (Electrolytes)—Chemistry LibreTexts. In ChemPRIME; University of Wisconsin: Madison, WI, USA, 2022. [Google Scholar]
  42. Lee, J.Y.; Rahman, A.; Azam, H.; Kim, H.S.; Kwon, M.J. Characterizing Nutrient Uptake Kinetics for Efficient Crop Production during Solanum lycopersicum var. Cerasiforme Alef. Growth in a Closed Indoor Hydroponic System. PLoS ONE 2017, 12, e0177041. [Google Scholar] [CrossRef] [PubMed]
  43. Hue, N.V. Correcting Soil Acidity of a Highly Weathered Ultisol with Chicken Manure and Sewage Sludge. Commun. Soil Sci. Plant Anal. 1992, 23, 241–264. [Google Scholar] [CrossRef]
  44. Carreira, J.A.; Viñegla, B.; Lajtha, K. Secondary CaCO3 and Precipitation of P-Ca Compounds Control the Retention of Soil P in Arid Ecosystems. J. Arid Environ. 2006, 64, 460–473. [Google Scholar] [CrossRef]
  45. Park, J.H.; Sung, J. Comparison of Various EC Sensors for Monitoring Soil Temperature, Water Content, and EC, and Its Relation to Ion Contents in Agricultural Soils. J. Soil Groundw. Environ. 2021, 26, 157–164. [Google Scholar] [CrossRef]
  46. Mazur, P.; Gozdowski, D.; Wnuk, A. Relationships between Soil Electrical Conductivity and Sentinel-2-Derived NDVI with PH and Content of Selected Nutrients. Agronomy 2022, 12, 354. [Google Scholar] [CrossRef]
  47. Ozkan, C.F.; Anac, D.; Eryuce, N.; Demİrtas, E.L.; Asrİ, F.Ö.; Guven, D.; Sİmsek, M.; Arİ, N. Effect of Different Potassium and Sulfur Fertilizers on Onion (Allium cepa L.) Yield and Quality. Electron. Int. Fertil. Corresp. 2018, 53, 16–24. [Google Scholar]
  48. Adams, P. Mineral Nutrition. In The Tomato Crop: A Scientific Basis for Improvement; Springer: Dordrecht, The Netherlands, 1986; pp. 281–334. [Google Scholar] [CrossRef]
  49. Zotarelli, L.; Dukes, M.D.; Scholberg, J.M.S.; Muñoz-Carpena, R.; Icerman, J. Tomato Nitrogen Accumulation and Fertilizer Use Efficiency on a Sandy Soil, as Affected by Nitrogen Rate and Irrigation Scheduling. Agric. Water Manag. 2009, 96, 1247–1258. [Google Scholar] [CrossRef]
  50. Gajda, A.; Doran, J.W.; Kettler, T.; Wienhold, B.; Pikul, J.L.; Cambardella, C.A. Soil quality evaluations of alternative and conventional management systems in the Great Plains. In Assessment Methods for Soil Carbon; CRC Press: Boca Raton, FL, USA, 2000; pp. 381–400. [Google Scholar]
  51. Visconti, F.; de Paz, J.M. Electrical Conductivity Measurements in Agriculture: The Assessment of Soil Salinity. New Trends Dev. Metrol. 2016, 1, 99–126. [Google Scholar] [CrossRef]
  52. Bai, W.; Kong, L.; Guo, A. Effects of Physical Properties on Electrical Conductivity of Compacted Lateritic Soil. J. Rock Mech. Geotech. Eng. 2013, 5, 406–411. [Google Scholar] [CrossRef]
Figure 1. Effect of different fertilizers on soil EC response (a); the water content of different fertilized soil (b). Black arrows indicate fertigation treatment, and blue arrows indicate precipitation. The length of the blue arrows is related to the amount of precipitation.
Agronomy 13 02156 g001
Figure 2. Biplot of the principal component analysis for sensor EC, pH, and water−soluble and exchangeable elements of different fertilizer−treated soils. (IOF: inorganic fertilizer, OF: organic fertilizer, COM: compost, 66: sampled at 66 DAT, 102: sampled at 102 DAT).
Agronomy 13 02156 g002
Table 1. Chemical properties of the soil applied with different fertilizers.
pHEC
(mS/cm)
NO3-N
(mg/kg)
Ex. K
(mg/kg)
Ex. Ca
(mg/kg)
Ex. Mg
(mg/kg)
Inorganic fertilizer
(N70, K60)
5.64 ± 0.05 ab1.15 ± 0.04 c32.7 ± 5.2 b0.81 ± 0.01 b5.53 ± 0.02 b1.91 ± 0.01 a
Organic fertilizer
(N70, K60)
5.51 ± 0.23 bc0.8 ± 0.01 d19.7 ± 5 c0.65 ± 0.02 c5.23 ± 0.02 c1.67 ± 0.01 b
Compost
(N70, K60)
5.44 ± 0.04 c1.67 ± 0.06 a56.2 ± 7.7 a1.28 ± 0.00 a5.97 ± 0.07 a1.92 ± 0.03 a
Inorganic fertilizer
(N80, K80)
5.50 ± 0.06 abc1.36 ± 0.03 b31.2 ± 4.9 b0.64 ± 0.01 c4.5 ± 0.09 d1.55 ± 0.01 c
Organic fertilizer
(N80, K80)
5.39 ± 0.04 c0.77 ± 0.01 d39.6 ± 2.5 b0.45 ± 0.01 d4.23 ± 0.07 e1.36 ± 0.01 d
Compost
(N80, K80)
5.73 ± 0.01 a0.66 ± 0.01 e20.3 ± 1.5 c0.33 ± 0.02 e4.52 ± 0.05 d1.43 ± 0.01 d
The different letters indicate a statistically significant difference in the same column at p < 0.05.
Table 2. Correlation matrix of sensor EC value, pH, soil EC (1:5 (soil:water extract)), soluble elements, and exchangeable elements.
VariablesSensor ECpHSoil ECSol. CaSol. KSol. MgSol. NaSol. PSol. SNO3NSum of Sol. NutrientsEx. CaEx. KEx. MgEx. NaEx. NH4NSum of Ex. Nutrients
Sensor EC1
pH−0.3071
Soil EC0.927−0.4311
Sol. Ca0.883−0.4960.9721
Sol. K0.582−0.3050.5120.5591
Sol. Mg0.858−0.6030.9720.9740.4871
Sol. Na0.918−0.4170.8850.9010.6470.8441
Sol. P−0.6390.430−0.519−0.599−0.552−0.572−0.6531
Sol. S0.703−0.5590.9060.8880.3210.9340.693−0.2641
NO3-N0.855−0.5120.9210.9770.6030.9370.911−0.7140.8041
Sum of sol. nutrients0.868−0.5510.9720.9930.5920.9840.887−0.5810.9110.9681
Ex. Ca−0.3750.265−0.598−0.5100.201−0.601−0.375−0.102−0.759−0.412−0.5251
Ex. K−0.3180.072−0.514−0.4160.302−0.485−0.299−0.169−0.650−0.298−0.4110.9321
Ex. Mg0.3020.1110.2430.3450.5010.1840.426−0.2740.0450.4240.3060.2450.2911
Ex. Na0.597−0.5760.5110.5990.7620.5310.798−0.6370.3470.6770.6080.0770.1920.4771
Ex. NH4-N0.645−0.4510.7760.8000.3140.8020.537−0.3150.7980.7250.794−0.358−0.2490.2370.2691
Sum of ex. nutrients−0.2810.199−0.494−0.3900.308−0.494−0.264−0.171−0.671−0.281−0.4050.9800.9620.3980.185−0.2401
Values in bold indicate a significant correlation at the p-value < 0.05.
Table 3. Principal component loadings and variance explained with the first three principal components.
PC1PC2PC3
Sensor EC0.9060.0640.175
pH−0.566−0.0150.763
Soil EC0.971−0.1620.119
Sol. Ca0.989−0.0460.078
Sol. K0.6020.6290.029
Sol. Mg0.978−0.166−0.069
Sol. Na0.9290.1630.117
Sol. P−0.633−0.4820.216
Sol. S0.874−0.421−0.053
NO3-N0.9730.0940.048
Ex. Ca−0.4930.816−0.039
Ex. K−0.3790.856−0.158
Ex. Mg0.3250.5820.579
Ex. Na0.6720.576−0.197
Ex. NH4-N0.760−0.1460.029
Eigenvalue8.8762.9921.105
Variability %59.17219.9437.369
Cumulative %59.17279.11686.485
The bold value indicates a loading >0.5.
Disclaimer/Publisher’s Note: The statements, opinions and data contained in all publications are solely those of the individual author(s) and contributor(s) and not of MDPI and/or the editor(s). MDPI and/or the editor(s) disclaim responsibility for any injury to people or property resulting from any ideas, methods, instructions or products referred to in the content.

