Article

Influence of Long-Term Soil Management Practices on Carbon Emissions from Corn (Zea mays L.) Production in Northeast Croatia

Department of General Agronomy, Division for Agroecology, Faculty of Agriculture, University of Zagreb, Svetosimunska cesta 25, 10000 Zagreb, Croatia
*
Author to whom correspondence should be addressed.
Agronomy 2023, 13(8), 2051; https://doi.org/10.3390/agronomy13082051
Submission received: 28 June 2023 / Revised: 21 July 2023 / Accepted: 25 July 2023 / Published: 2 August 2023
(This article belongs to the Special Issue Sustainable Circular Agricultural Food Production Systems)

Abstract

:
Sustainable management of agricultural resources is needed to meet people’s increasing demands for food, fiber and energy while maintaining the quality of the environment and protecting natural resources. With the rapid growth of agriculture and the mechanization of farming, the agricultural sector has become one of the main contributors to the increase in CO2 emissions and other greenhouse gases in the world. Therefore, the aim of this study was to determine the effect, dependence and correlations of CO2 in soil with native vegetation (presence/absence, corn yield) and climatic conditions (soil temperature and moisture) during three years of measurements under different management practices in a classical conventional agroecosystem. This research contains four different treatments: control treatment (CT), dolomite/organic fertilization (DOL/OF), mineral fertilization (MF) and black fallow (BF). During the investigated period, the average overall C-CO2 flux ranged from 7.98 kg ha−1 day−1 on bare soil to 16.26 kg ha−1 day−1 on soil treated with mineral fertilization. No statistically significant difference was observed among different fertilization treatments, except in 2013 and 2015 when comparing different fertilization treatments to bare soil. In all three years, there was a positive correlation between average C-CO2 fluxes and soil temperature. Additionally, in 2013 and 2017, there was a positive correlation between average C-CO2 fluxes and soil moisture, while a negative correlation was observed in 2015. Obtained values of crop yield ranged from 0.89 t ha−1 in the control treatment (in 2015) to 14.81 t ha−1 in the treatment with mineral fertilization (in 2017). Growing global concern about the effects of climate change calls for intensive research on the carbon cycle, and these results will contribute to the understanding of carbon transformation in different crops and soil management practices.

1. Introduction

In the era of unstoppable global population growth, associated with changes in patterns of consumption, certain demands arise. The main focus is not on the quantities of food, fiber and energy, but on the qualities. Therefore, the emphasis is on maintaining environmental quality to achieve sustainable goals, especially in agricultural production [1]. As the population increases, the standard of living also increases [2], as does the cumulative level of greenhouse gas (GHG) emissions [3,4,5]. The increasing emissions of GHG caused by human activities lead to their accumulation in the atmosphere and climate warming, resulting in changes in the atmosphere, land and oceans [6,7]. As a potential carbon sink, soil can be a key factor in addressing climate change. It is estimated that soils typically store about 1500 Pg of soil organic carbon in the 1 m depth profile (of which about 50% of this amount is estimated for the first 30 cm of soil depth) [8,9,10,11]. Exactly that topsoil or surface soil layer (0–30 cm) plays a crucial role in the cycling of greenhouse gases in the environment, precisely because organic substances accumulate in it the most, fine root turnover is greatest and microbiological activity is rich [12]. CO2 emissions in agriculture have various causes, such as (1) deforestation, (2) soil management, (3) fertilizer use and (4) energy consumption [13,14,15]. Reducing CO2 emissions through sequestration is of primary importance. The use of proper agricultural techniques maintains and increases the carbon content in the soil and plant material [16]. Thus, by applying good agricultural practices, carbon sequestration in the soil can be increased, thereby mitigating climate change [17,18,19,20]. Primarily, CO2 in the soil originates from two major sources: autotrophic respiration, which encompasses the respiration of plant roots and their associated mycorrhizal fungi, and heterotrophic respiration, which involves the respiration of microorganisms [21,22]. Furthermore, the microbial decomposition of organic matter, mineralization and respiration of soil and rhizosphere fauna contribute to the production of CO2 in the soil [23,24,25]. Mineralization occurs as a result of nitrogen application, which releases CO2 as a by-product. Decomposition of soil organic matter can lead to increased CO2 emission from the soil, because microorganisms rapidly degrade organic matter in the presence of excess nitrogen [26,27]. There are several factors that influence CO2 emissions related to corn production, such as land use change, different fertilizer application, machinery use, energy consumption and residue management [28,29,30,31]. For example, land use change, such as from forests or grasslands to cornfields, results in the release of CO2 stored in vegetation or soil [32]. Fertilizer application also increases greenhouse gas emissions from the production and transportation of these fertilizers, which contributes to CO2 emissions, mainly through fossil fuel combustion [33,34]. The same phenomenon occurs during decomposition of crop residues, especially in corn fields, where large amounts of post-harvest residues remain on the surface [35]. It is important to emphasize that management practices (fertilization, irrigation and/or tillage) can lead to increased CO2 uptake. Temperature is also an important factor in controlling the major processes in the C cycle [36], with increasing temperature accelerating organic matter decomposition, oxidation, microbial activity and C mineralization processes, leading to increased C-CO2 emission from the soil [37]. Soil moisture also affects CO2 production, distribution and microbial activity [38].
This paper evaluates the effect of different soil management in corn cultivation on CO2 emissions in three consecutive years with different fertilization. There are some specific objectives of this study: (1) to investigate the effects of soil temperature and moisture on the overall CO2 flux in corn fields in a conventional agroecosystem, (2) to compare and evaluate the effects of mineral, organic, dolomite and no fertilization application on CO2 emission and, finally, (3) to explore the potential of organic fertilizer and dolomite application in reducing CO2 emissions.

2. Materials and Methods

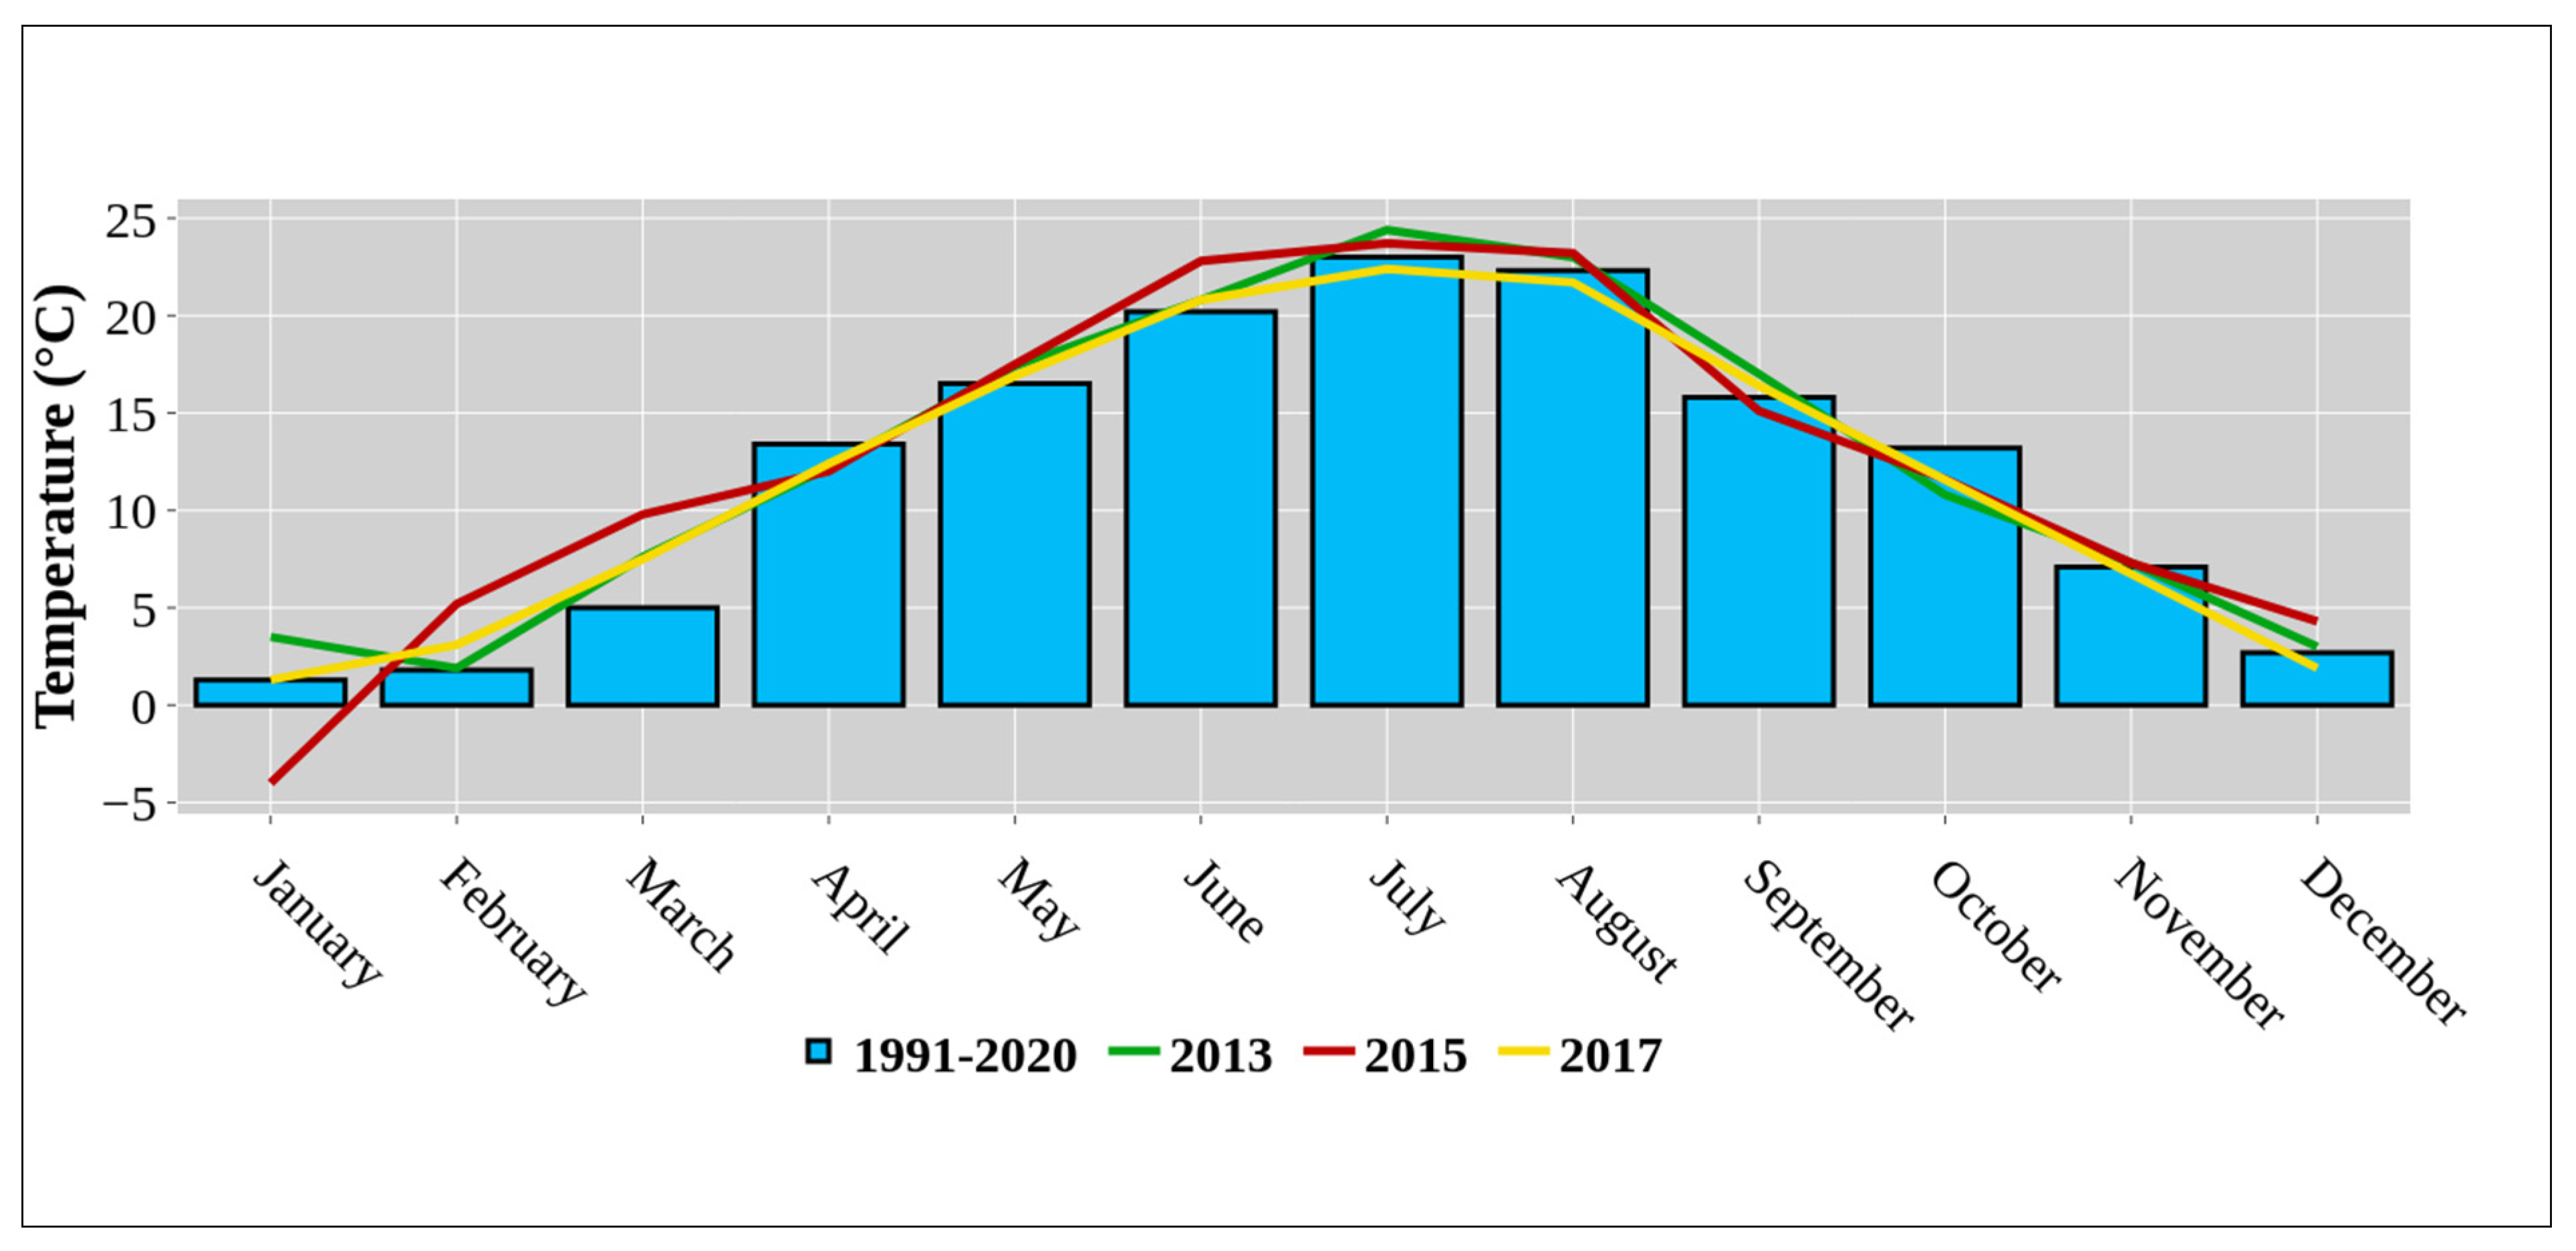
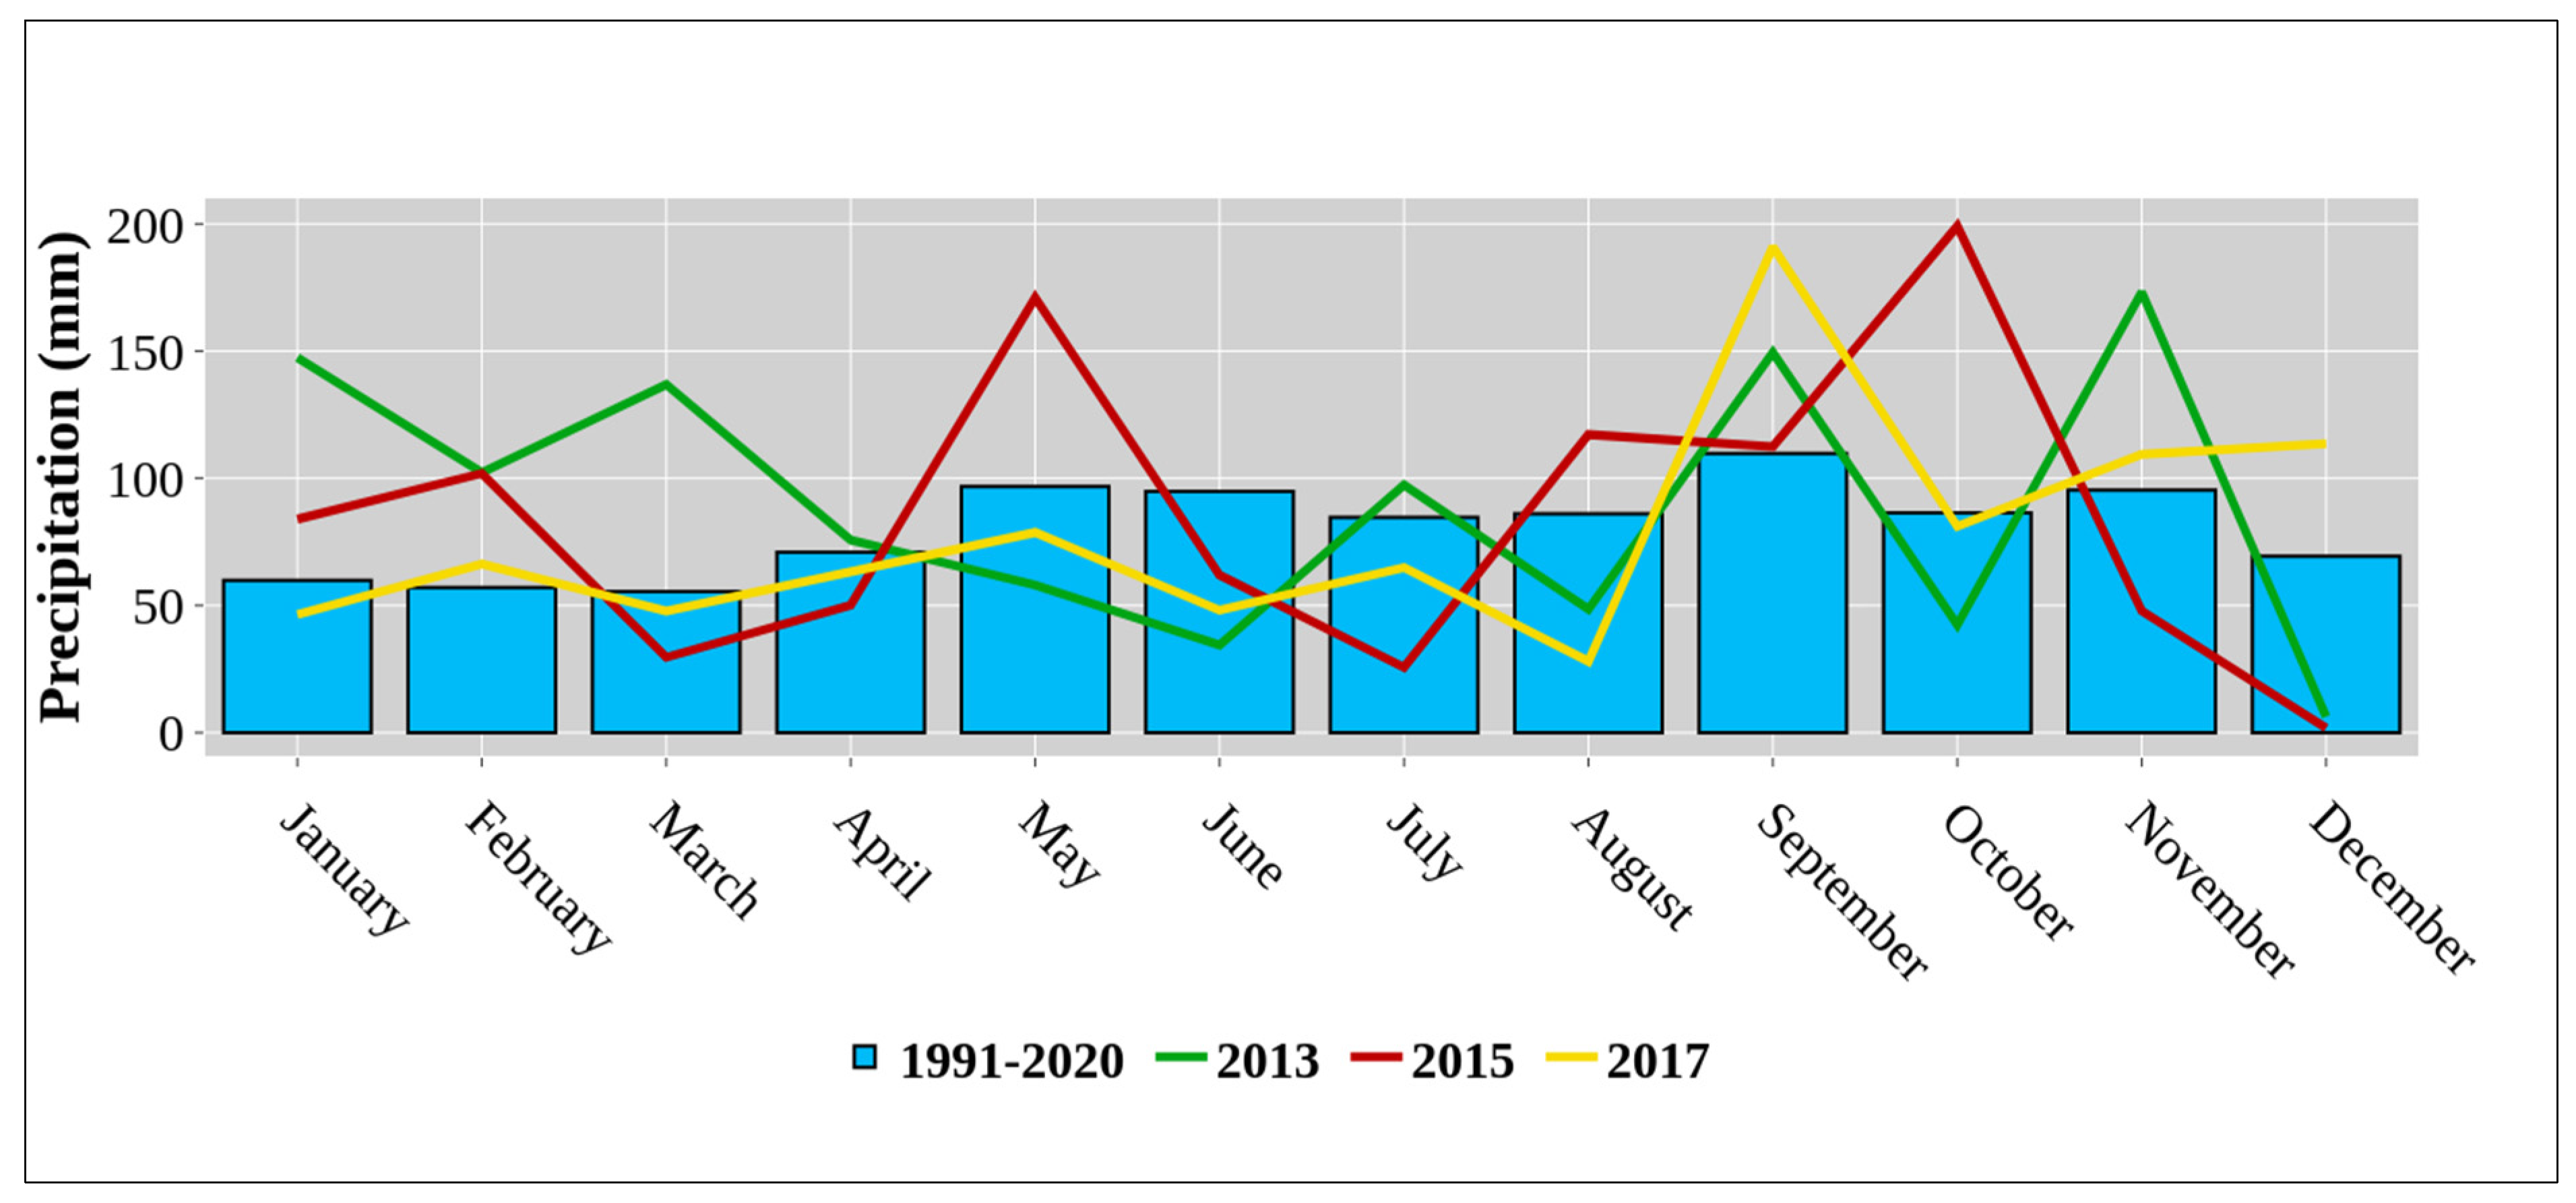
2.1. Study Site and Climate

The study field is located in Northeast Croatia, in Popovaca (N 45°33′21.42″, E 16° 31′44.62″). The soil type in the experimental field was classified as district Stagnosol [39]. General soil information can be found in Table 1.
Average annual temperature (°C) and average annual rainfall (mm) throughout the reference period (1991–2020) and study period (2013, 2015, 2017) are presented in Figure 1 and Figure 2, respectively. The climate at this research site is temperate continental, classified as “Cfwbx” according to the Köppen climate classification [40]. In the studied year (2013), the average precipitation was 1071.9 mm, ranging from a minimum of 6.3 mm in December to a maximum of 173.0 mm in November. The average annual temperature was 11.9 °C, with January the coldest at 1.3 °C and July the warmest at 23.0 °C. In 2015, average rainfall was 1002.5 mm, with a range from a minimum of 1.8 mm in December to a maximum of 199.1 mm in October. The average annual temperature was 12.4 °C, with February the coldest at 1.9 °C and July the warmest at 24.4 °C. In 2017, average precipitation was 938.6 mm, with a range from a minimum of 28.0 mm in August to a maximum of 191.0 mm in September. The average annual temperature was 12.4 °C, with January the coldest at −4.0 °C and July the warmest at 23.7 °C. The average annual air temperature of the 2015 and 2017 growing seasons was 0.5 °C higher compared to the reference period (1991–2020) and to the studied year 2013. However, average annual precipitation varied between years, with values above (2013 and 2015) and below (2017) the reference period average of 958.8 mm.

2.2. Experimental Design

The trial field was initially established in 1996 with the aim of determining optimal fertilization techniques under existing conditions. The goal was to find approaches that could increase crop yields without harming the environment, especially water resources. After 15 years, the scope of the experimental field was expanded to include studies measuring soil C-CO2 flux. The experimental treatments on the trial field had a size of 30 × 130 m2, including blank spaces. The distance between treatments was 2 m on each side, as well as between the four replicates. Regarding fertilization, four treatments were studied: (I) control treatment—no fertilization (CT); (II) 250 kg N ha−1 + P + K + dolomite (in 2013) (DOL); organic fertilization—250 kg N ha−1 + P + K + 40 t ha−1 of solid farmyard mixed manure (in 2015 and 2017) (OT); (III) 300 kg N ha−1 + P + K (MF); (IV) black fallow—no vegetation (BF). In the OF and MF treatments, fertilization with phosphorus and potassium was uniform, with application rates of 120 kg ha−1 for P and 180 kg ha−1 for K. In the studied years (2013, 2015, 2017), corn (Zea mays L.) was grown as a cover crop on the experimental field. Table 2 provides information on the growing year, sowing date, harvest date, fertilization and crop protection for the corn in the experimental field in each year of the study.

2.3. Laboratory Work

The following procedures were performed to determine the chemical properties of the soil at the experimental site. Soil sampling was performed in the topsoil layer, at a soil depth of 0–30 cm, using an Eijkelkamp soil probe. Average soil samples were obtained by combining four replicates from each treatment. Laboratory determinations including air-drying, homogenization and sieving (<2 mm) were performed according to the protocol HRN ISO 11464 [41]. Soil pH was measured using the electrometric method in a 1:5 (w/v) ratio with the Beckman pH-meter Φ72 in an H2O and KCl suspension according to the modified HRN ISO 10390 protocol [42]. The organic matter content of the soil samples was determined using the sulfochromic oxidation method, which involves wet combustion [43]. Available phosphorus and potassium were extracted by ammonium lactate solution and determined by spectrophotometric and flame photometric methods, according to the respective protocols [44,45]. Soil texture was determined by a sieving and sedimentation method after dispersion with sodium pyrophosphate (Na4P2O7,c = 0.4 M) according to HRN ISO 11277:2004 protocol [46]. Soil color (in dry condition) was determined according to the Munsell soil color chart.

2.4. Soil CO2 Concentration Measurement

Measurements of soil CO2 concentration were made six times in each investigated year (2013, 2015 and 2017). Measurements were made in the following months: April, June, July, August, September and October. They were performed in three replicates in all treatments. The in situ closed static chamber method was used to measure soil CO2 concentrations [36]. The chambers were made of lightproof metal material, and they consist of two parts: frames (25 cm in diameter) and caps fitted with a gas sampling port. The circular frames were inserted about 10 cm into the soil at the beginning of measurements. Before closing the chamber, the initial CO2 concentrations were measured. By closing the chamber on the soil surface, the accumulation of CO2 emitted from the soil was performed. After an incubation period of 30 min, the CO2 concentration in ppm was measured using a portable infrared CO2 detector (GasAlertMicro5 IR, 2011). Soil CO2 flux was calculated according to the authors [47,48], based on the increase in CO2 concentration over time using the following equation:
FCO2 = [M × p × V × (c2 − c1)]/[R × T × A × (t2 − t1)]
where FCO2 is the soil CO2 efflux (kg ha−1 day−1), M is the molar mass of the CO2 (kg mol−1), p is the air pressure (Pa), V is the chamber volume (m3), c1 is the CO2 concentration at the beginning of the measurement (µmol−1), c2 is the CO2 concentration at the end of the measurement (µmol−1), R is the gas constant (J mol−1 K−1), T is the air temperature (K), A is the chamber surface (m2) and t2 − t1 is the incubation period (day).

2.5. Measurements of Agro-Ecological Factors

For each measurement of soil CO2 concentration, air parameters, including temperature (°C), relative humidity (%) and pressure (hPa), were measured using Testo 511 and Testo 610 instruments (2011) at a height of about 0.5 m above the soil surface. Soil parameters, including temperature (°C), moisture (%) and electrical conductivity (mS/m), were measured using the IMKO HD2—probe Trime, Pico64 (2011). The rod sensor Pico64 is a combination and integration of probe and electronics. Two probes were pushed 10 cm into the soil next to each chamber at the time of CO2 concentration measurement, after which the measurement required approximately 4 to 5 s.

2.6. Statistical Analysis

SAS 9.1. statistical software (SAS Inst. Inc., 2002–2004, Cary, NC, USA) was used for data analyses. Variability between the years for each treatment and variability between the same treatments for different years were analyzed with an analysis of variance (ANOVA) and tested with a post hoc (Fisher) t-test. The significance level for all analyses was 5%. The linear relationship between C-CO2 emission and certain agro-ecological parameters such as soil temperature and soil moisture at 10 cm depth was investigated using regression analysis. The analysis was performed separately for each of the three years (2013, 2015 and 2017), from April to October.

3. Results

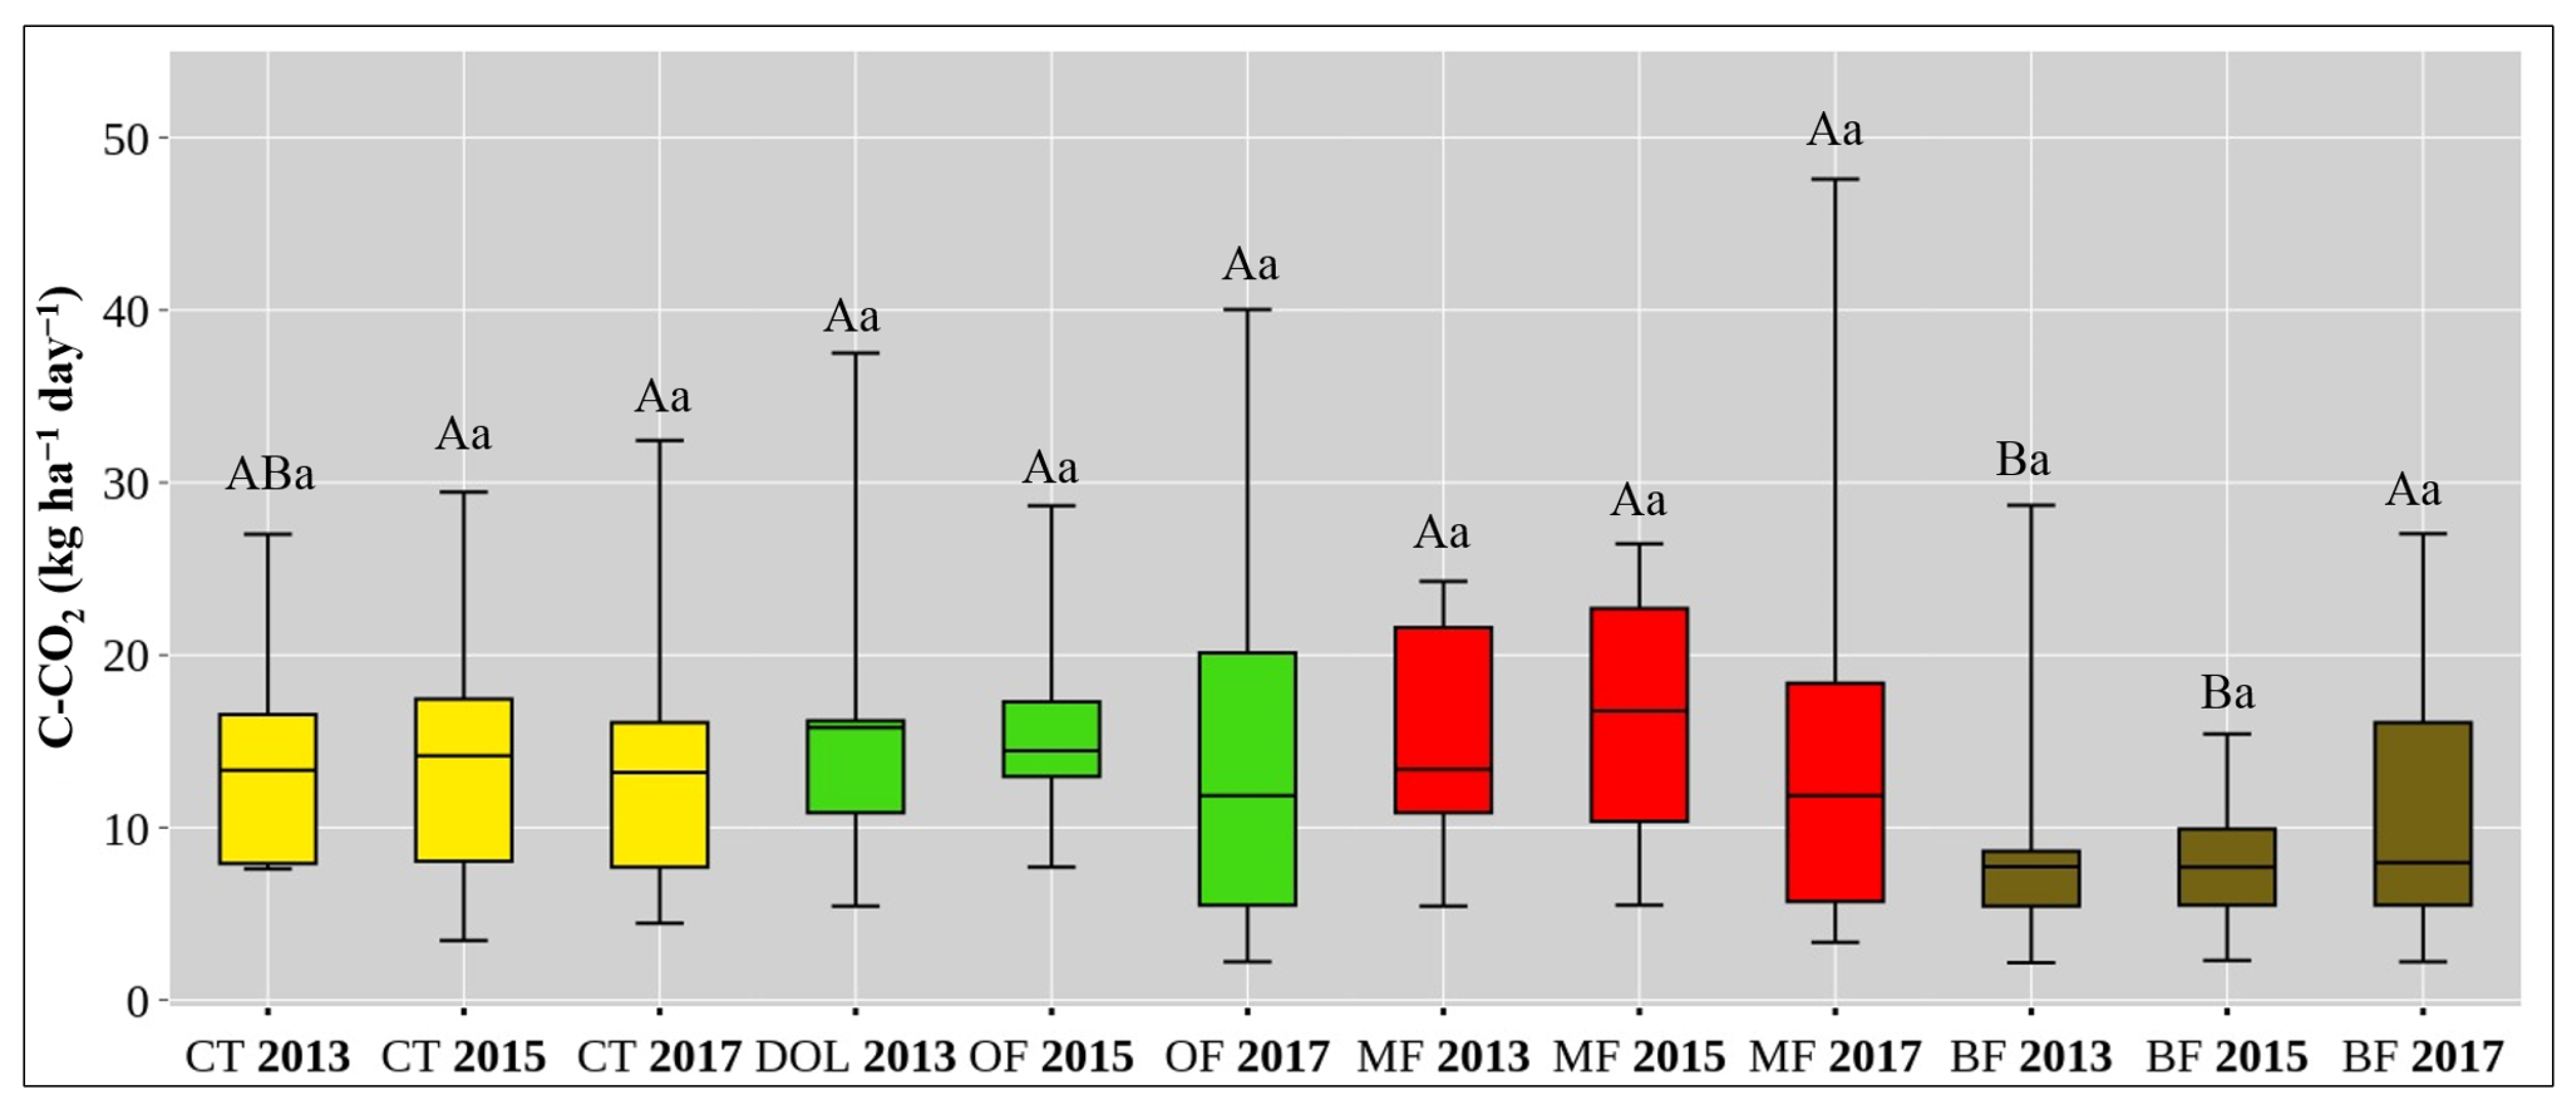
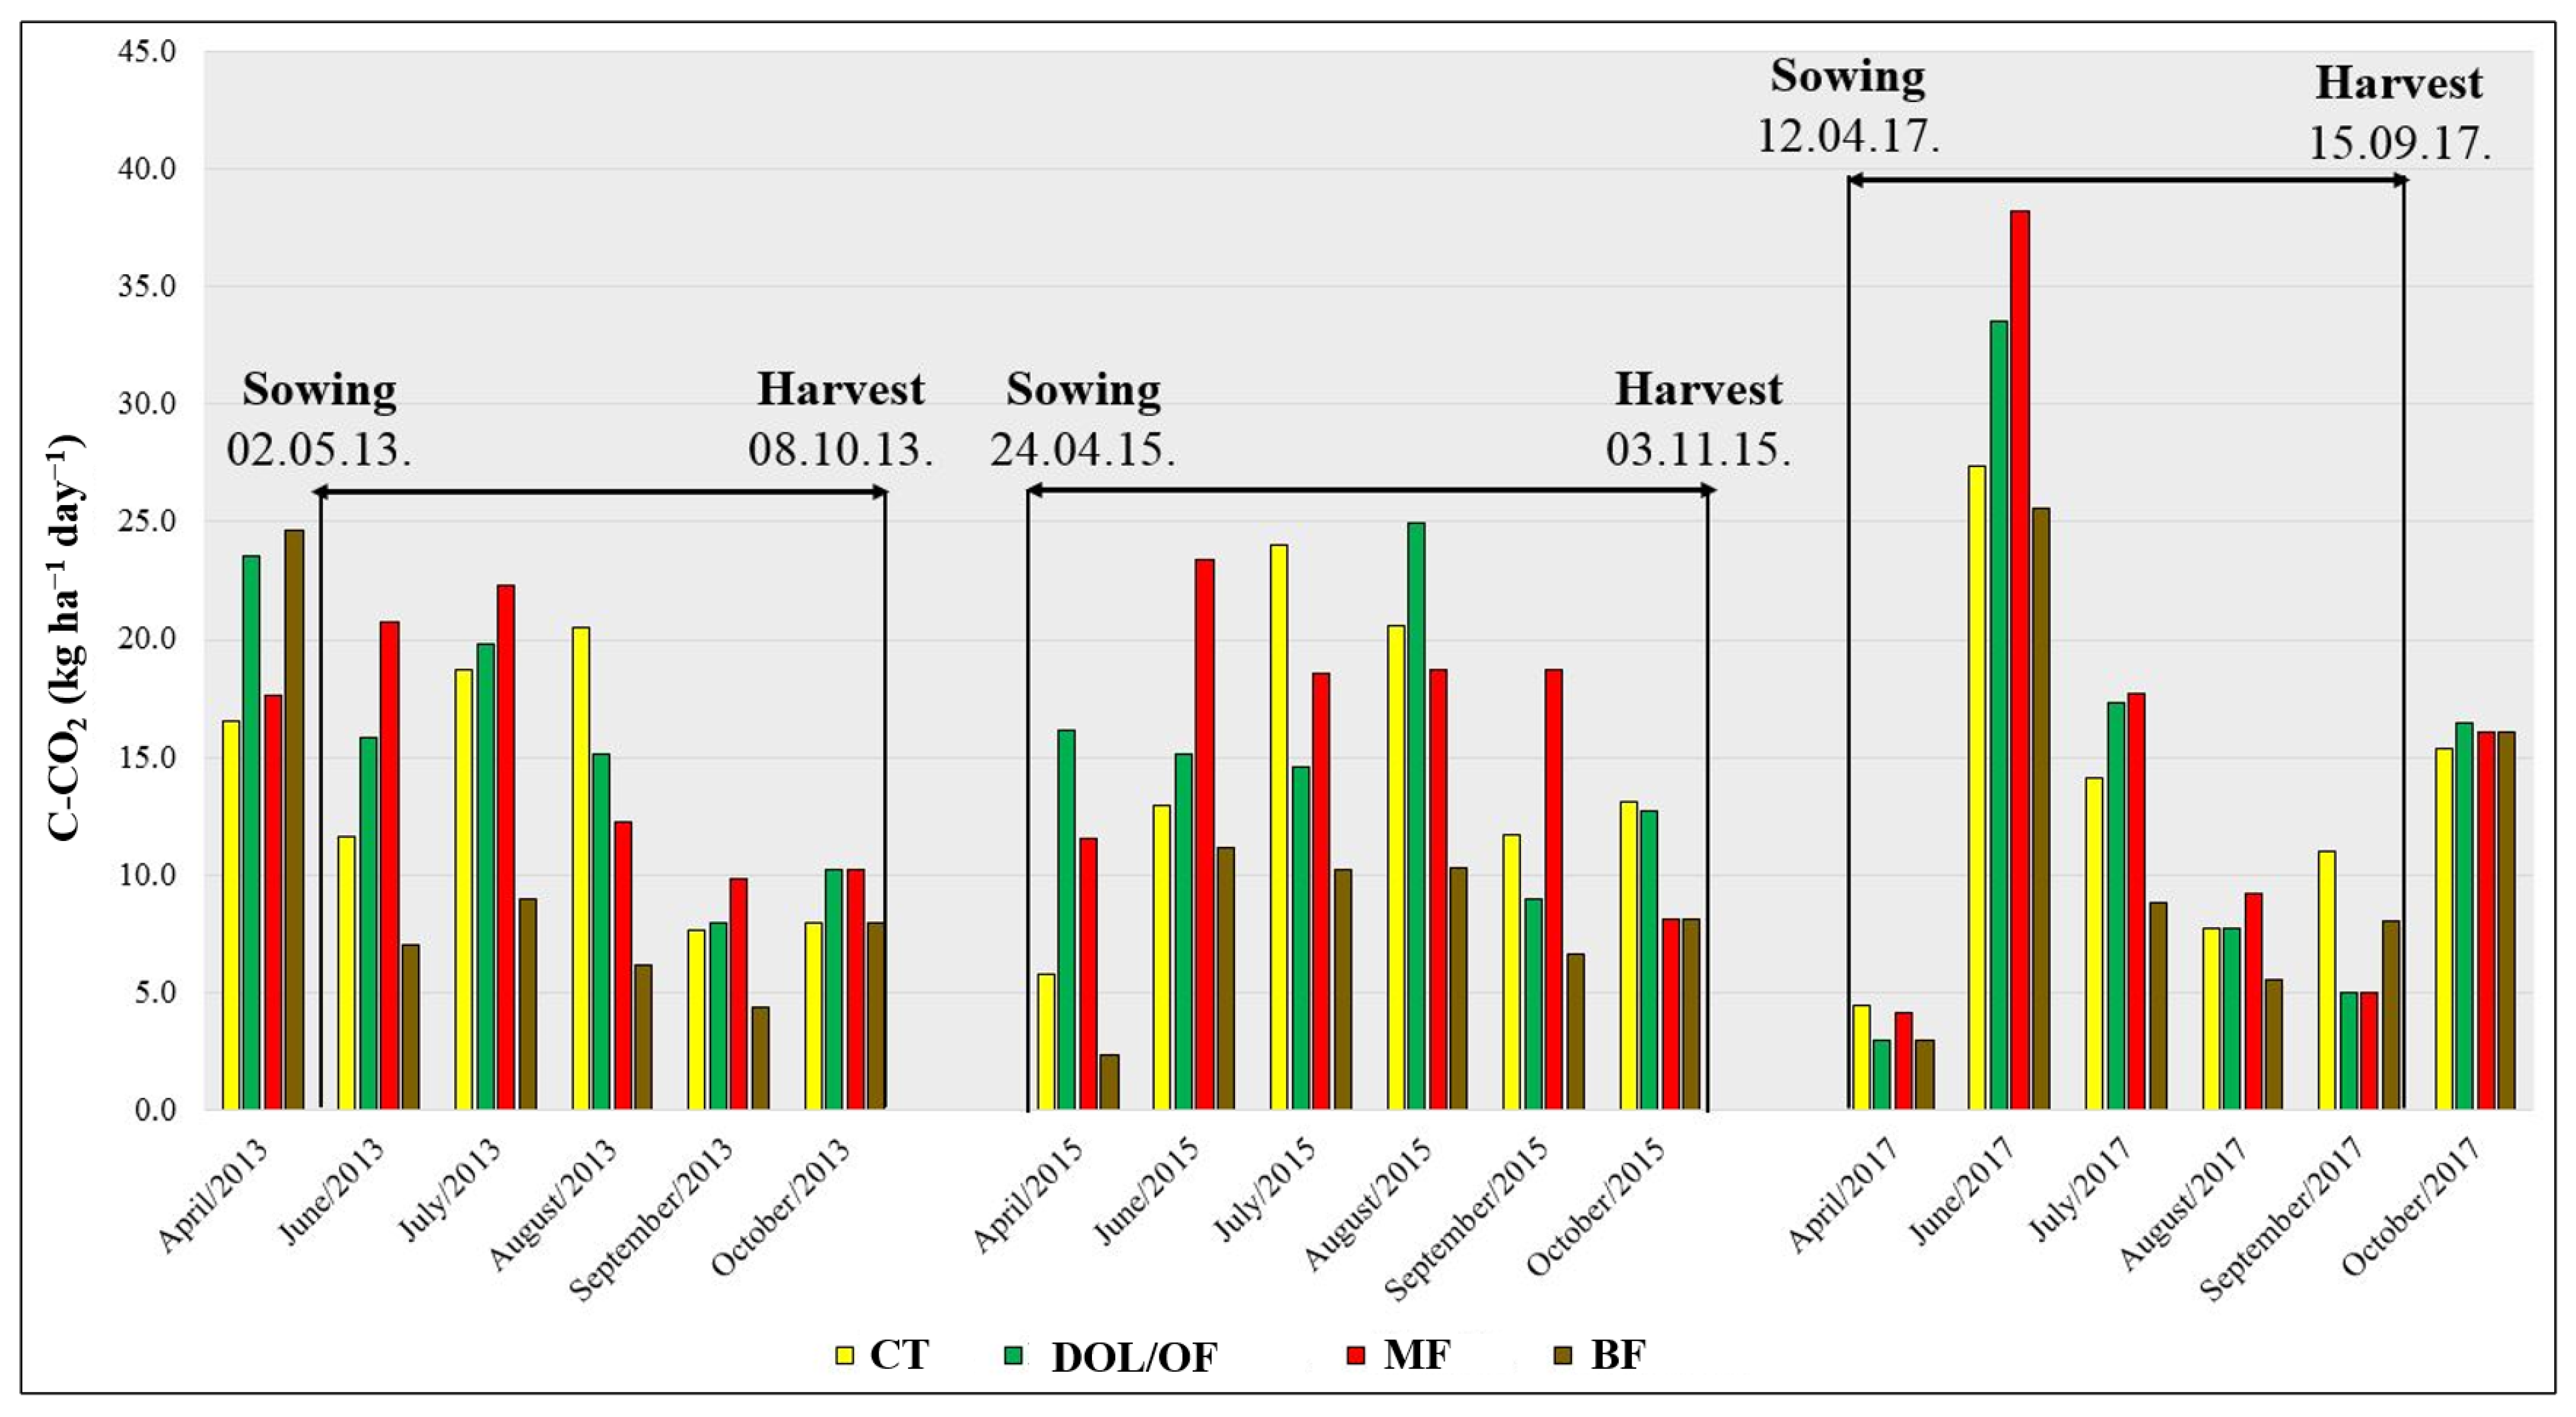
3.1. Soil C-CO2 Emissions under Different Soil Management

Figure 3 shows the results of soil C-CO2 emissions between four different fertilizer treatments for three years. In 2013, statistically significant differences were found between DOL and BF, with DOL having a C-CO2 value of 15.40 kg ha−1 day−1 compared to BF with a value of 9.84 kg ha−1 day−1. Similar differences were found between the MF and BF treatments, with the CO2 values of the MF treatment (15.48 kg ha−1 day−1) not differing from those of the DOL treatment. However, no significant difference was found for the other treatments. In 2015, significant differences were found between CT and BF, OF and BF, and MF and BF. The values obtained were as follows: BF—7.98 kg ha−1 day−1; CT—14.47 kg ha−1 day−1; OF—15.22 kg ha−1 day−1; MF—16.26 kg ha−1 day−1. The studied year 2017 showed no significant difference between the four treatments. The observed values ranged from 11.16 kg ha−1 day−1 in BF to 15.03 kg ha−1 day−1 in MF treatment.
No significant differences were observed in the CT among the years of the study. The same pattern was observed in the DOL and OF treatments, where lower values were observed in 2015 and higher values in 2013 and 2017. There were also no significant differences in MF treatment between the studied periods, but higher values were observed in 2017 and 2013. Finally, lower C-CO2 emissions were observed for BF in 2015 than in 2013 and 2017, but without statistically significant differences (Figure 3).
Figure 4 shows the results of average daily soil C-CO2 emissions between the four different fertilizer treatments for three years. In 2013, average daily soil C-CO2 flux ranged from 4.35 kg ha−1 day−1 to 24.64 kg ha−1 day−1. Obtained emissions in 2015 were from 2.30 kg ha−1 day−1 to 24.98 kg ha−1 day−1. In 2017, average daily emissions ranged from 2.97 kg ha−1 day−1 to 38.22 kg ha−1 day−1.

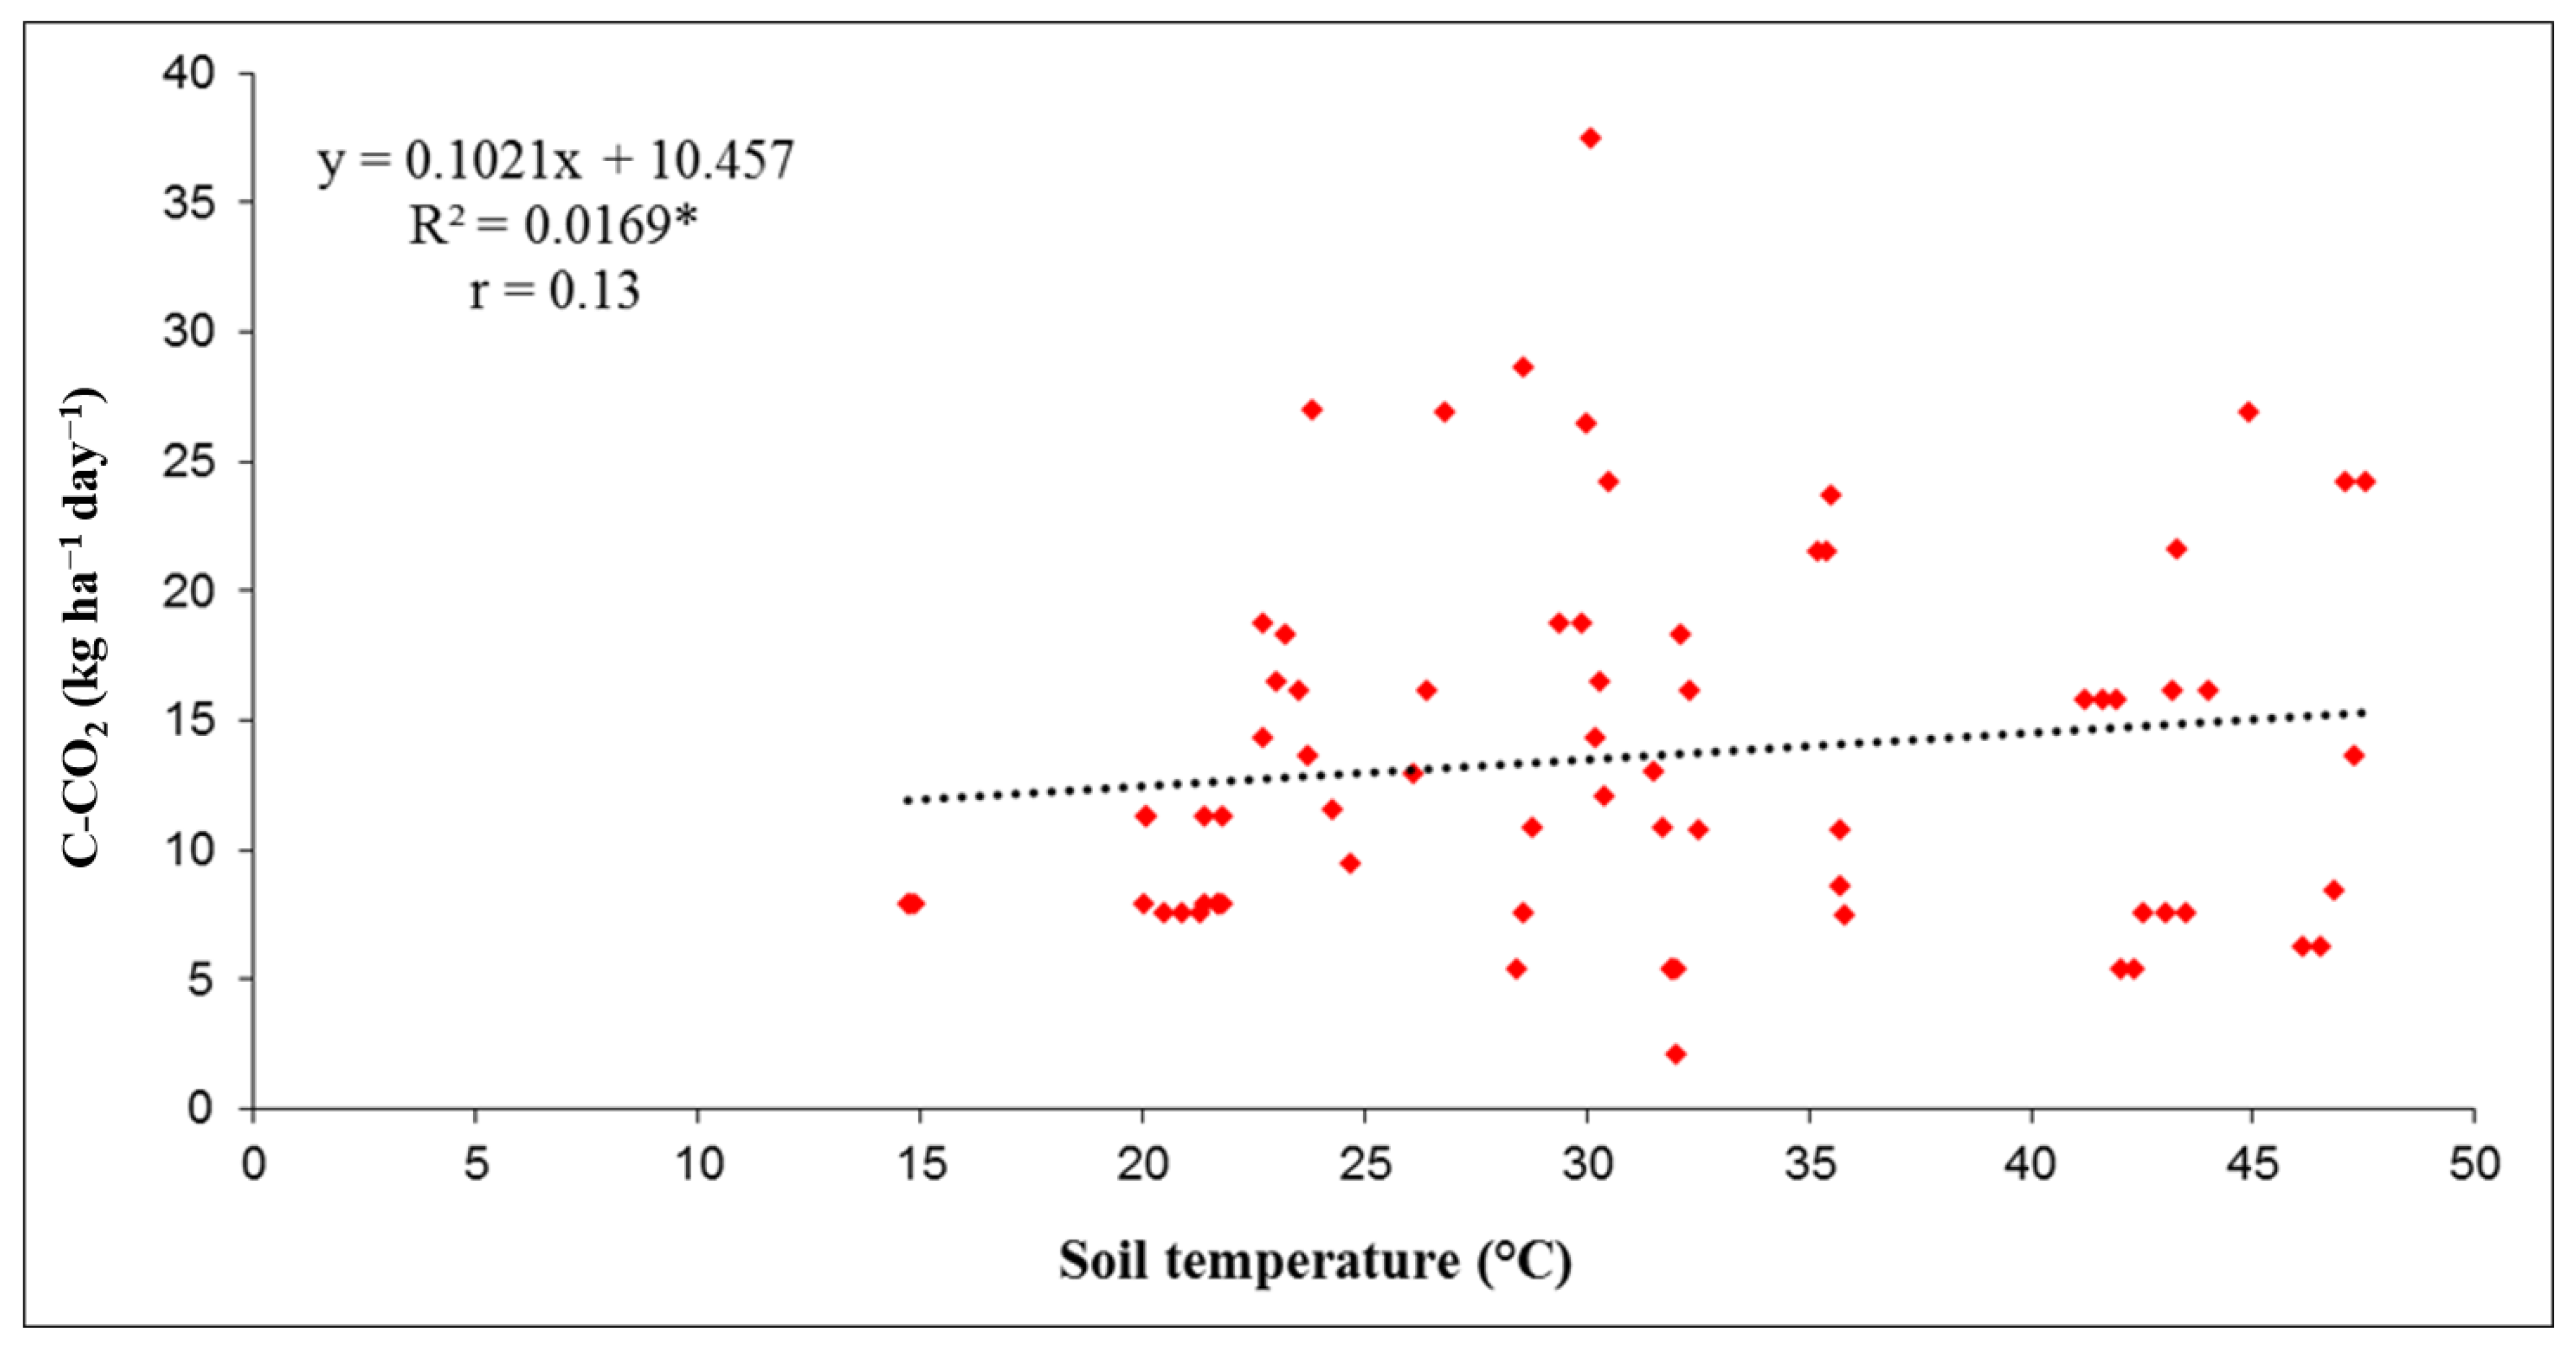
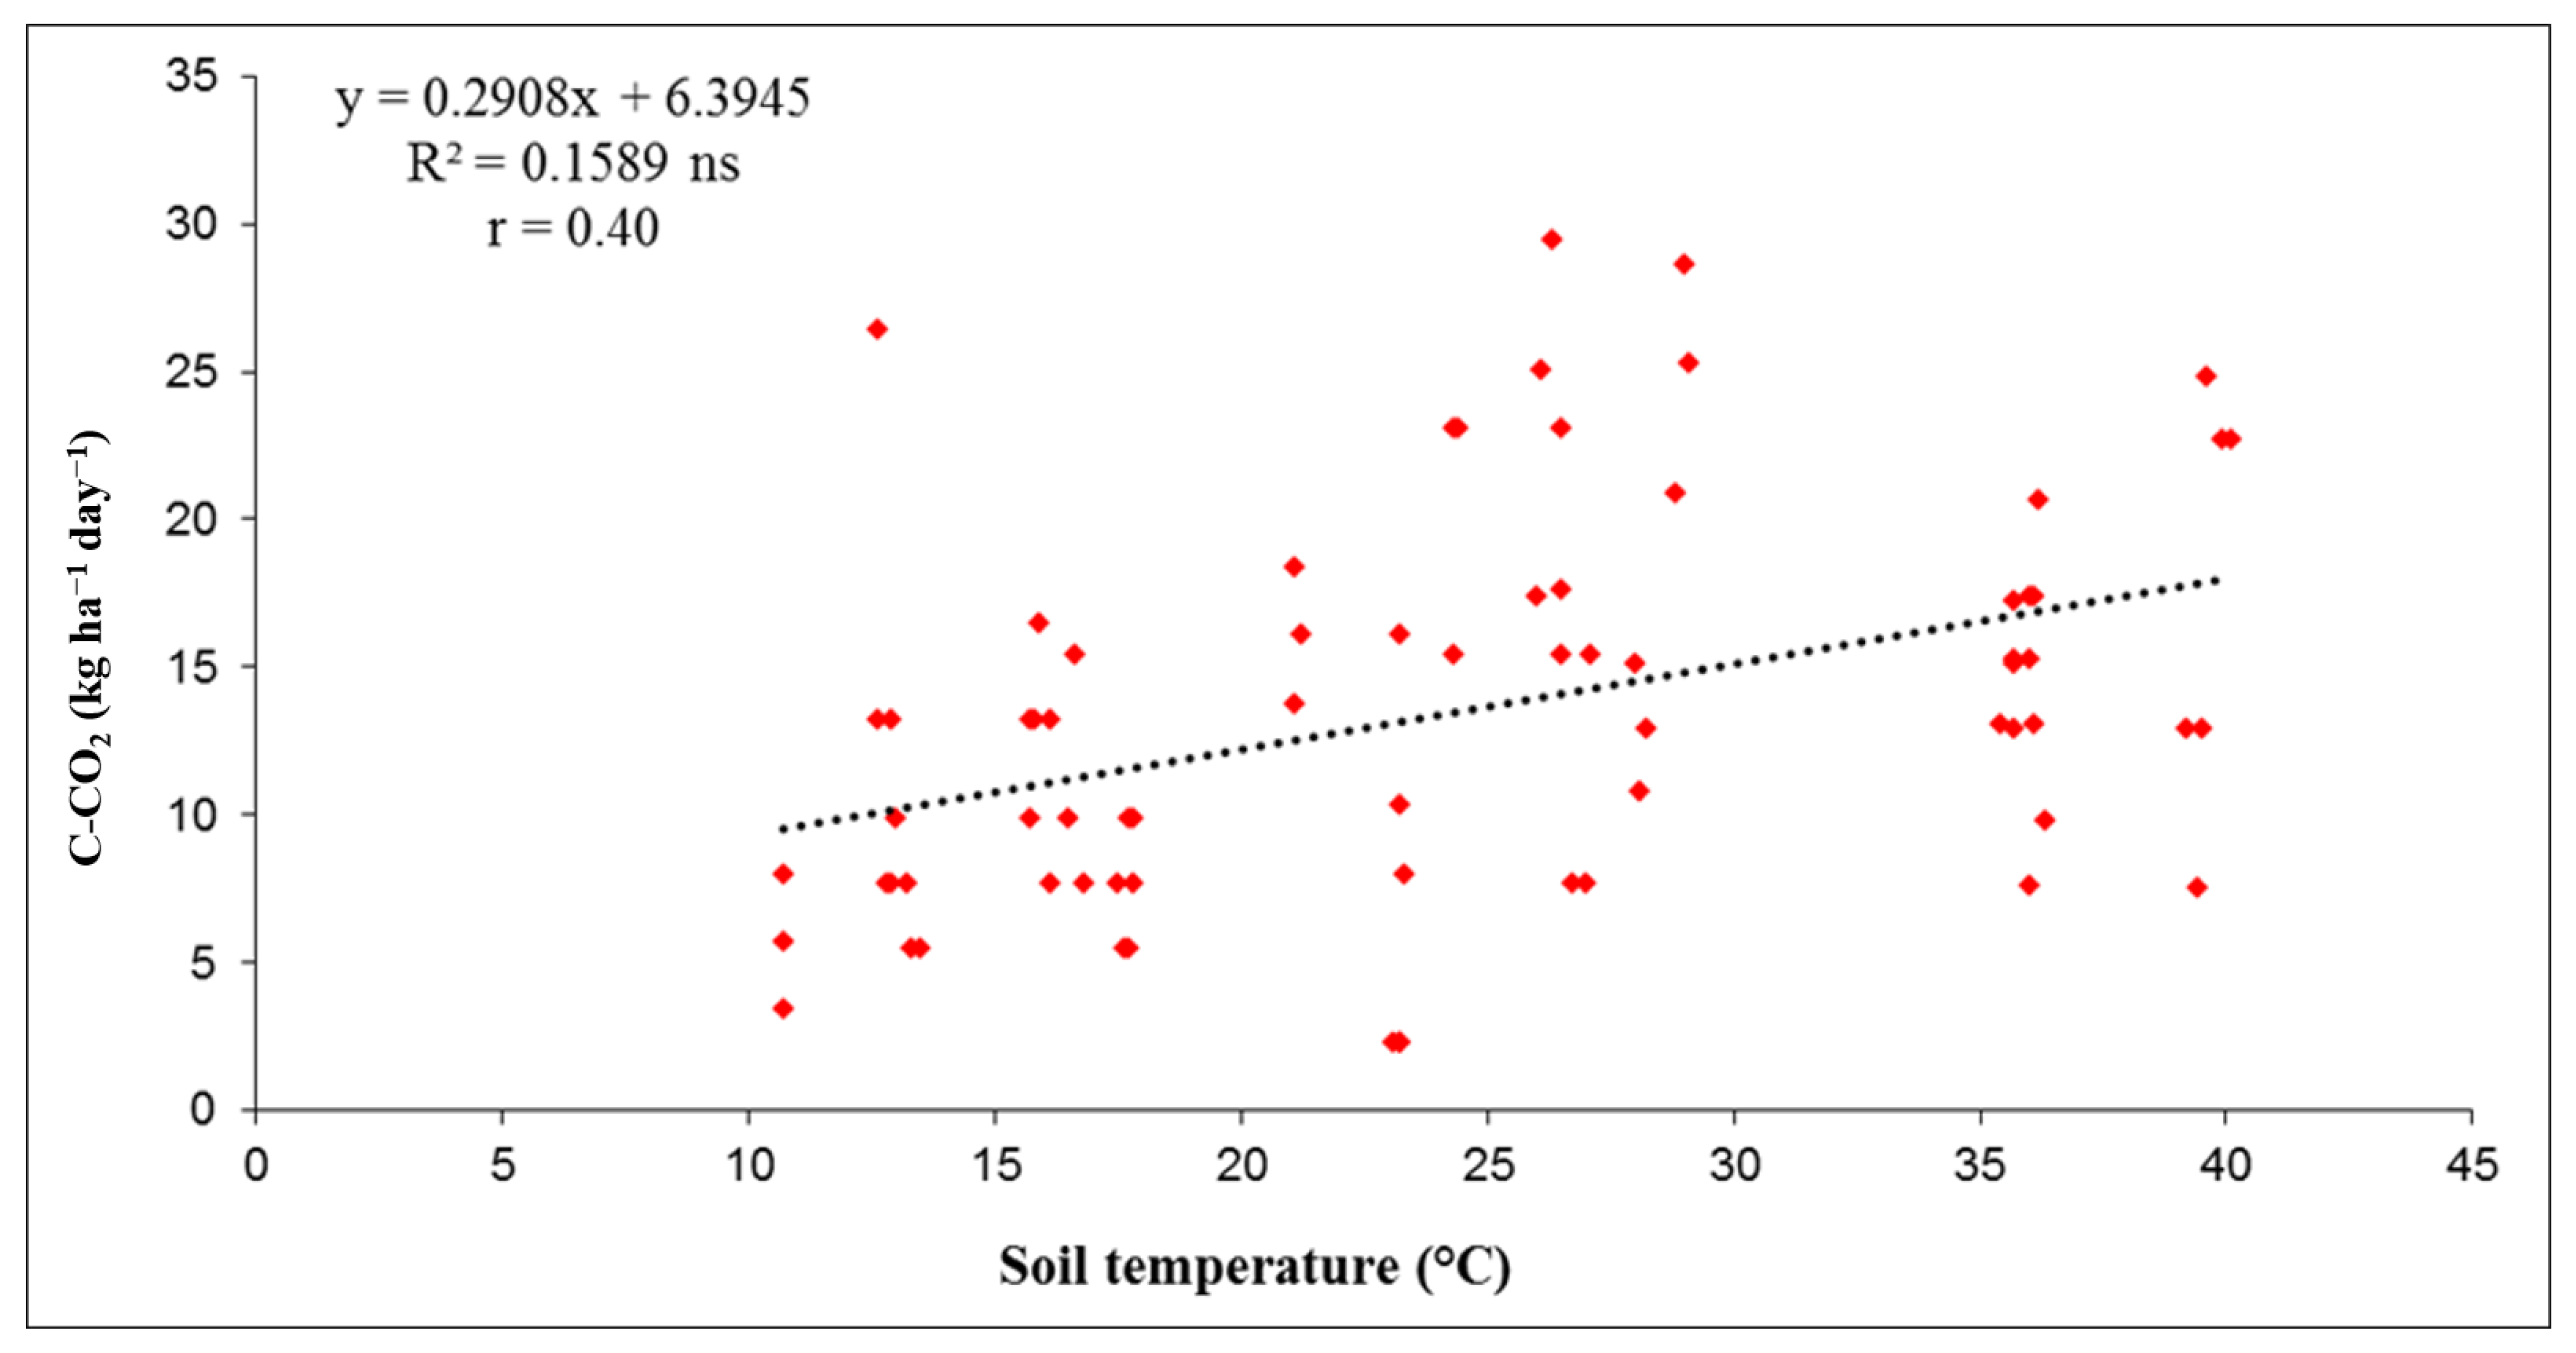
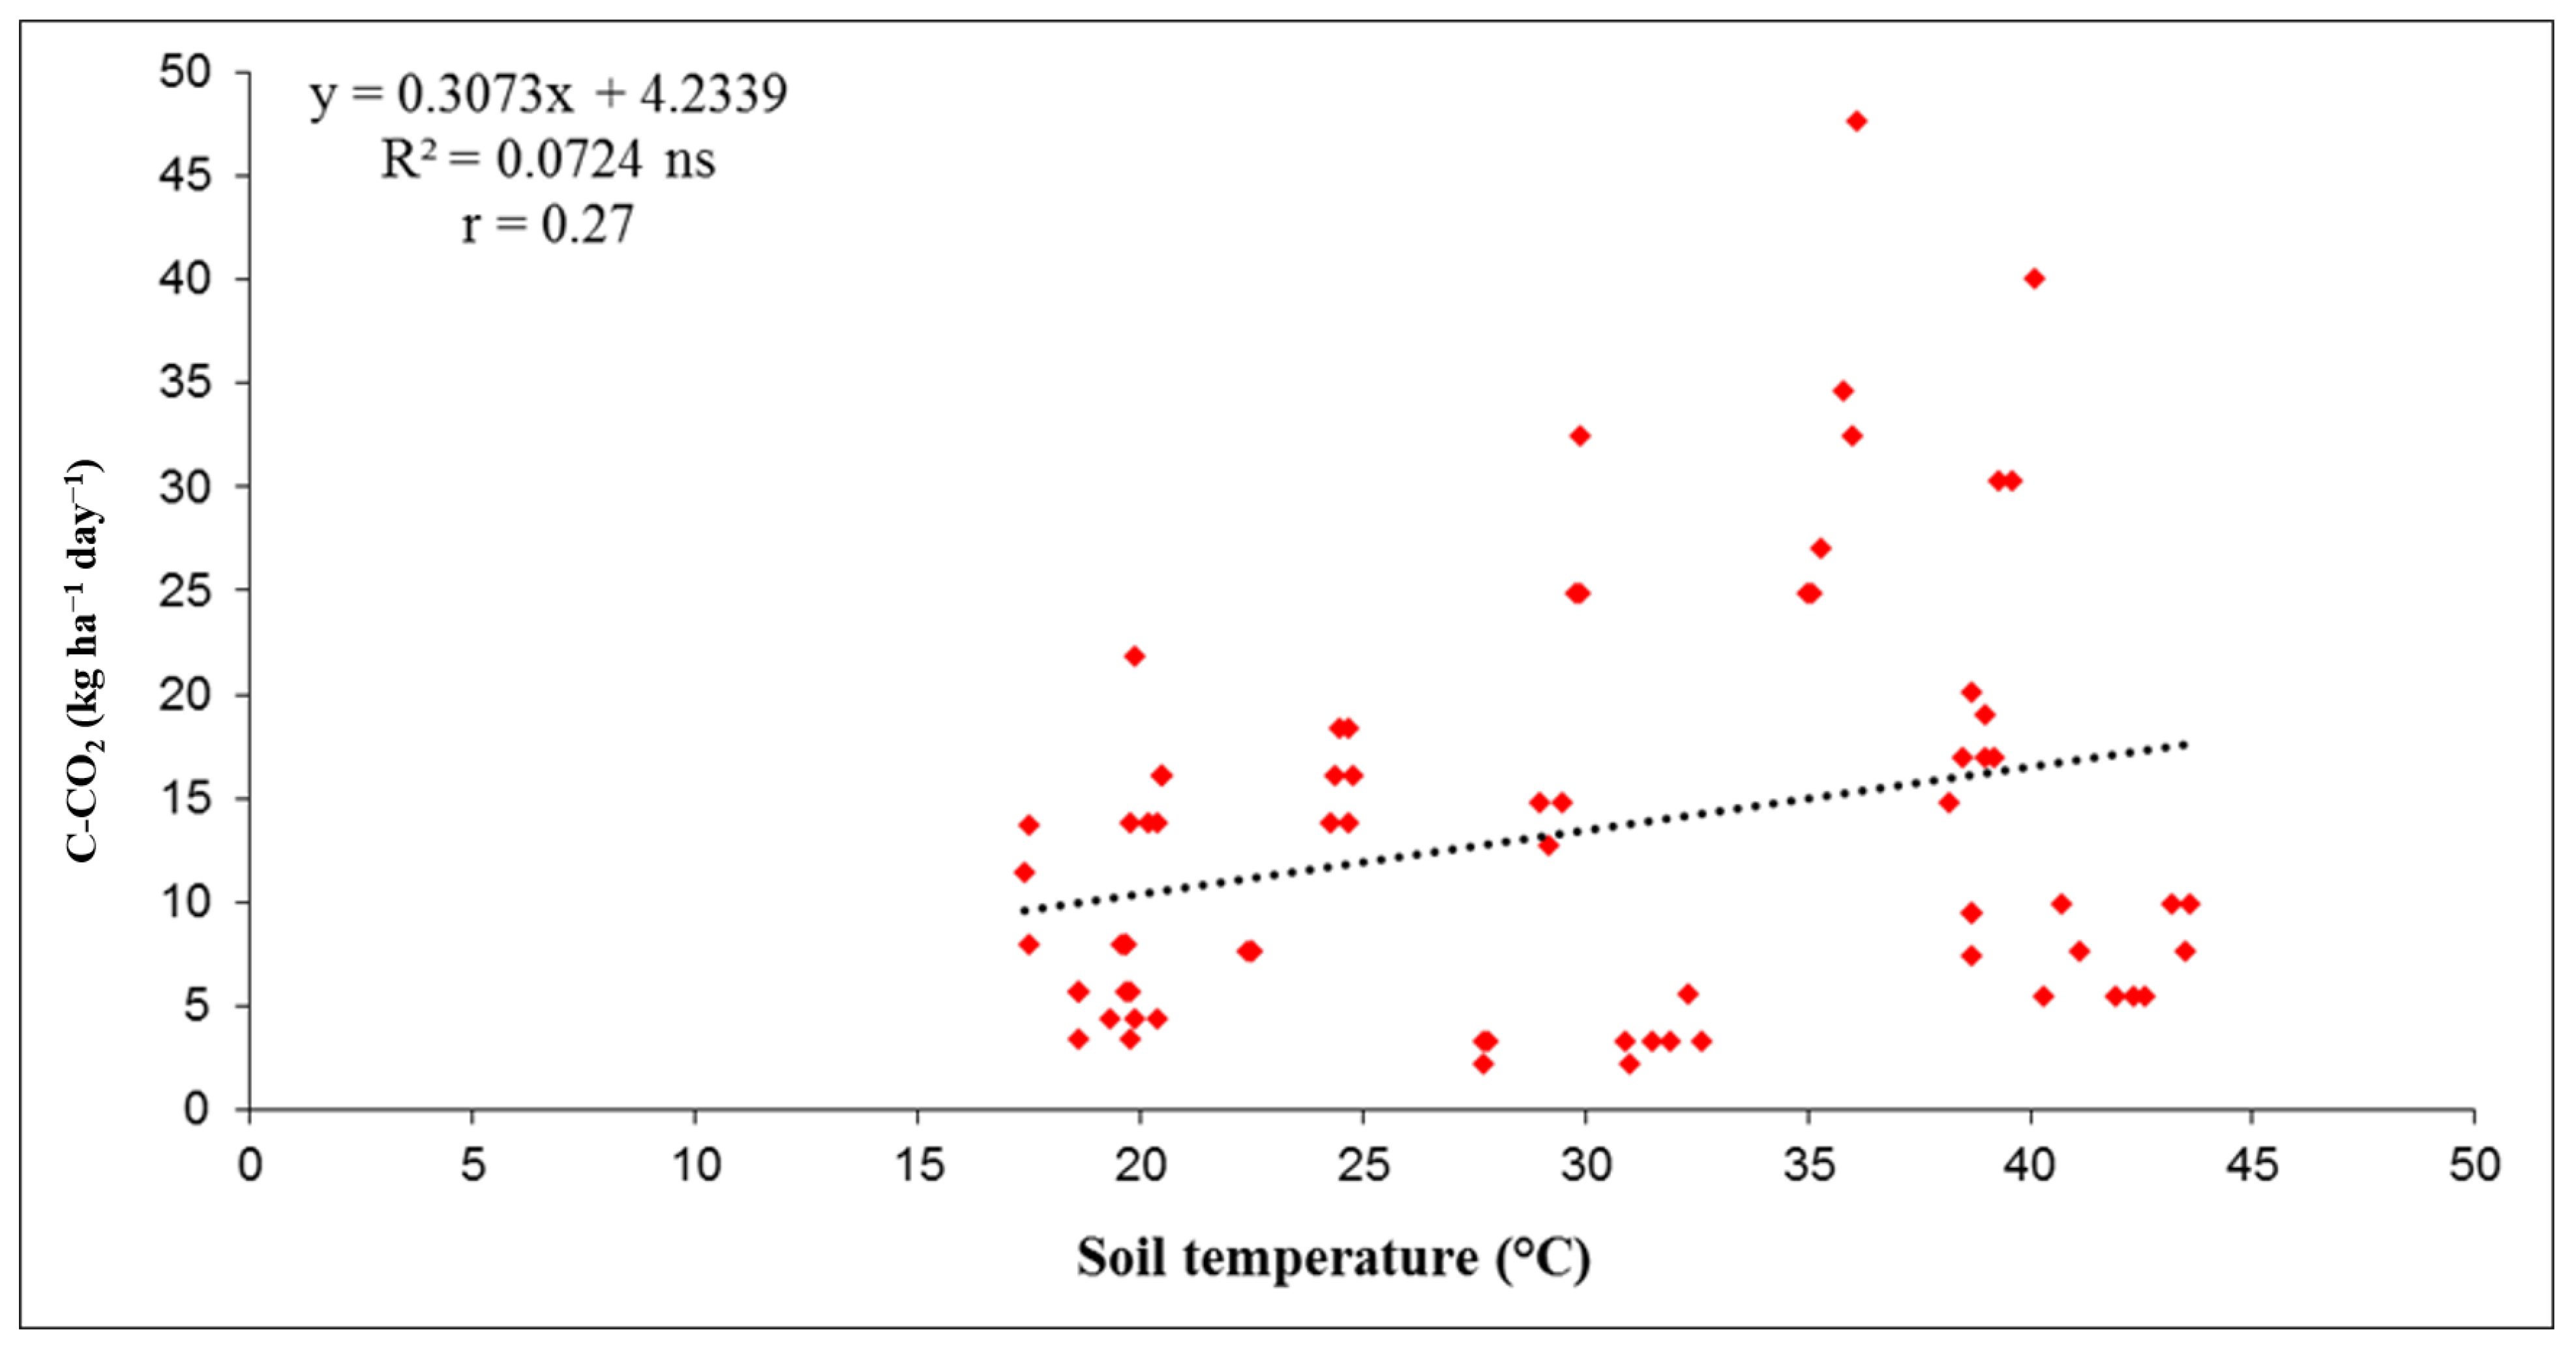
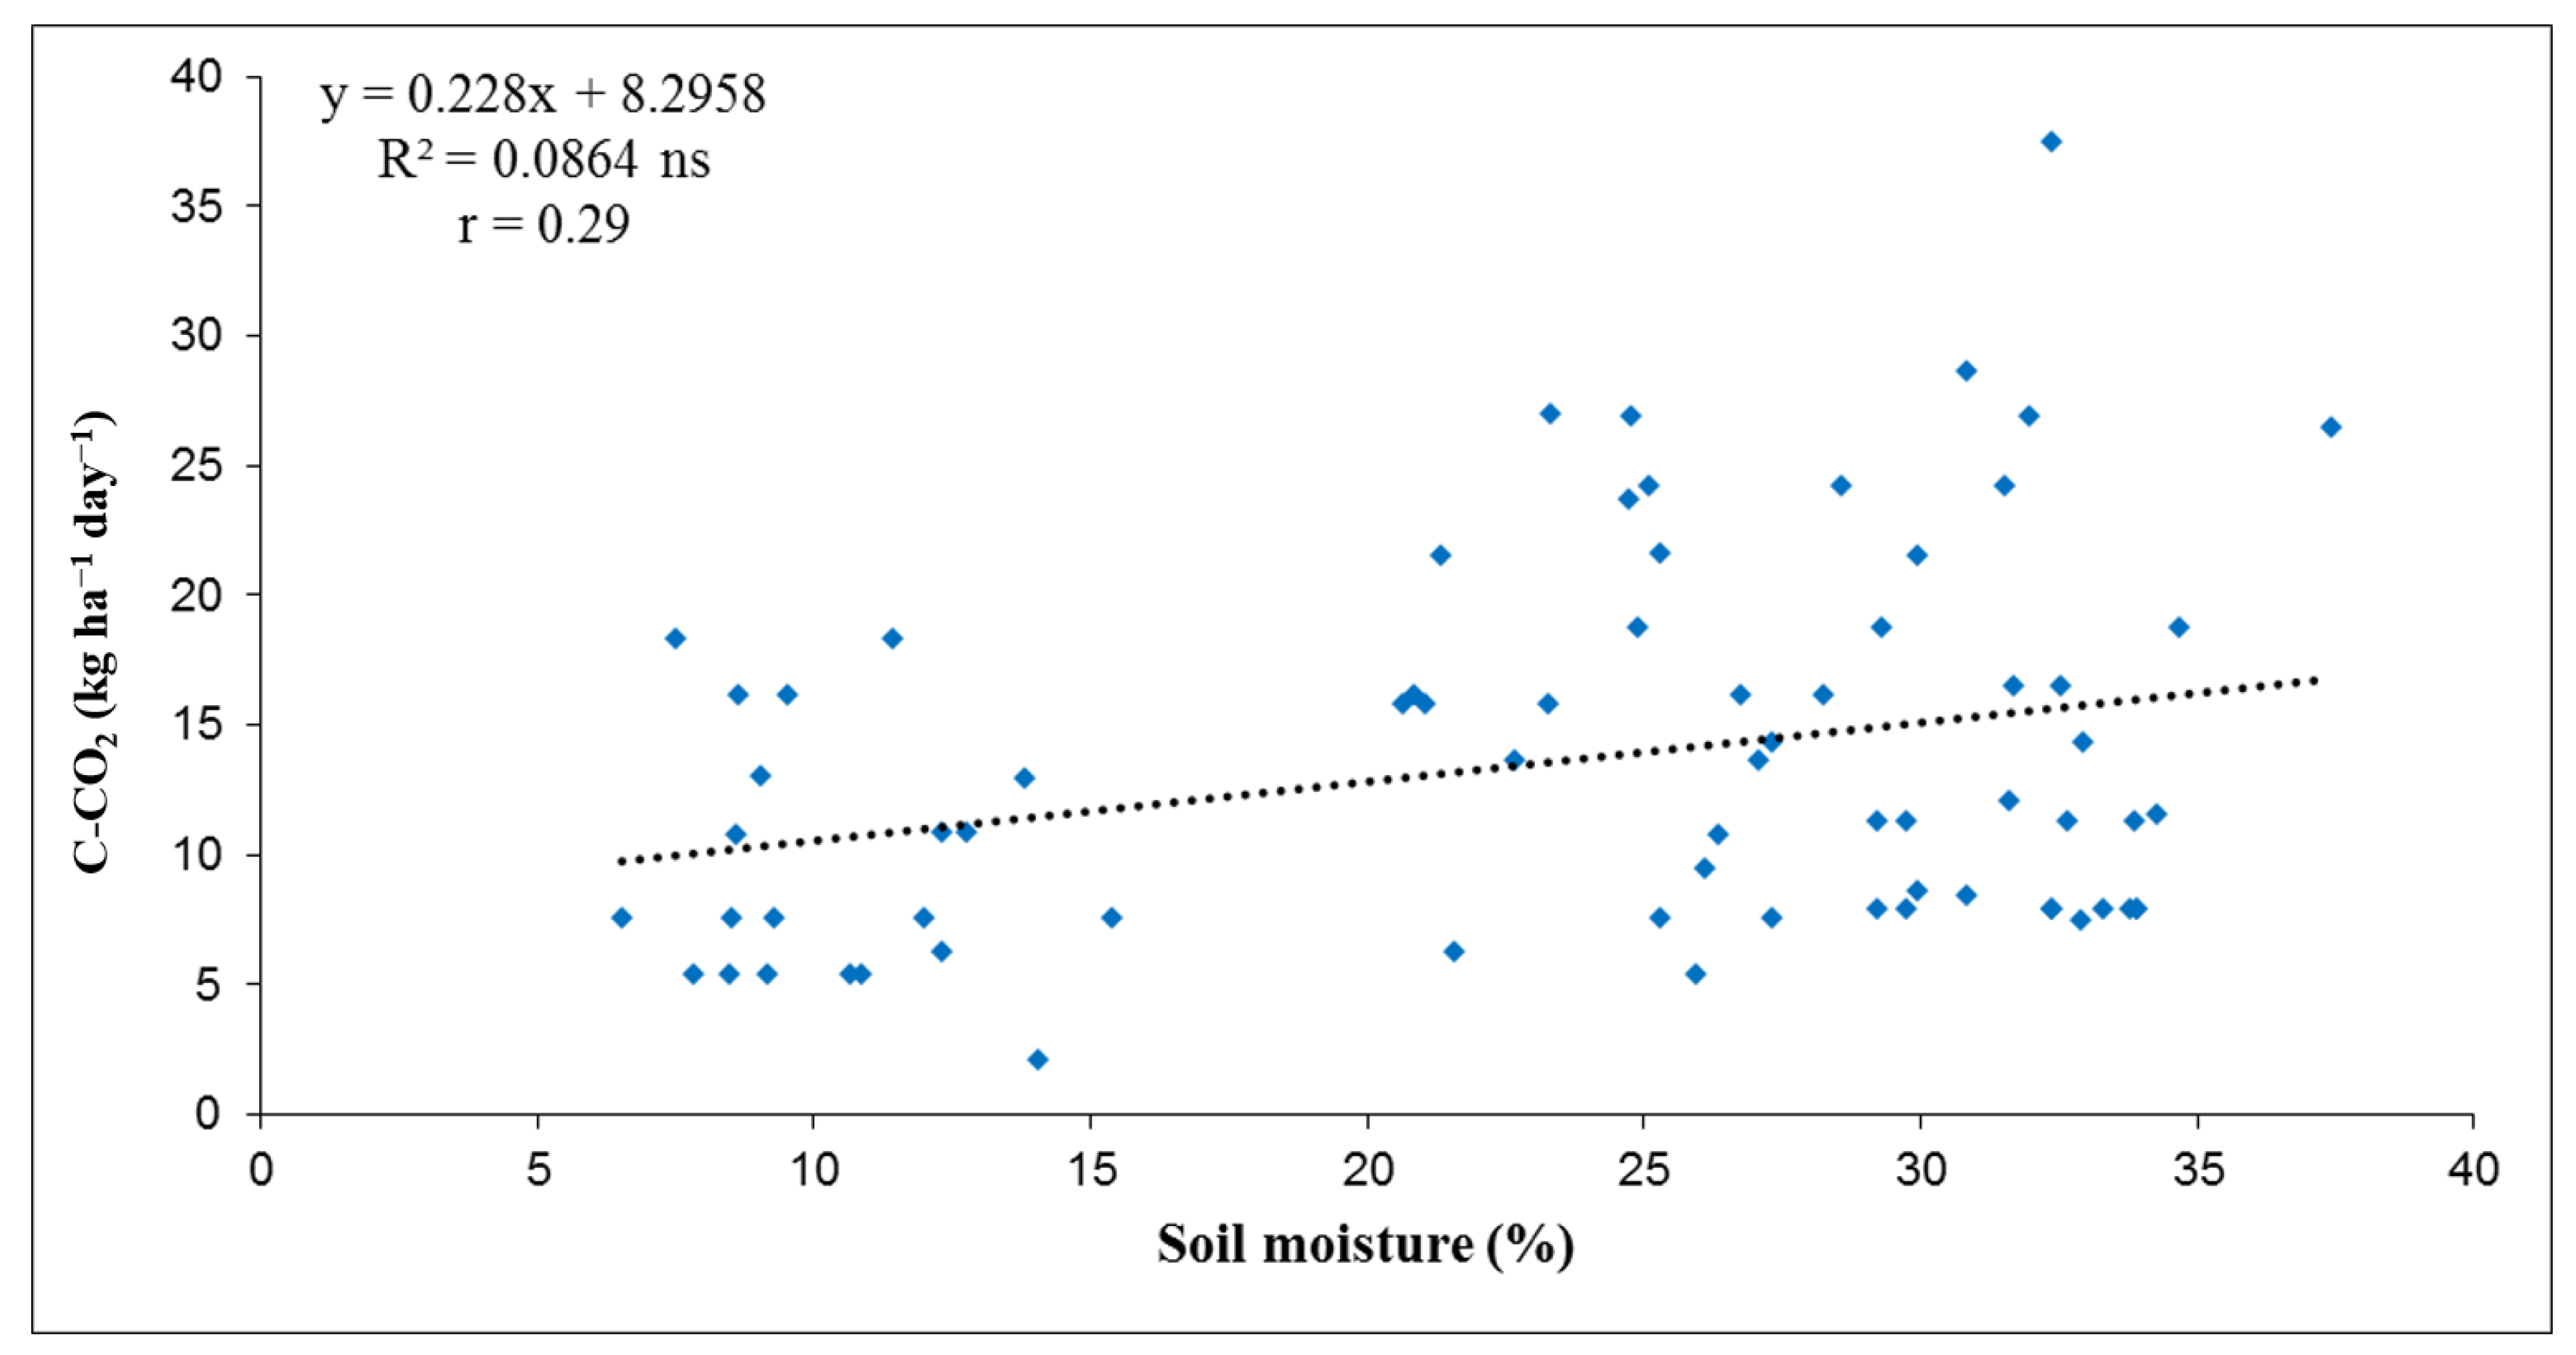
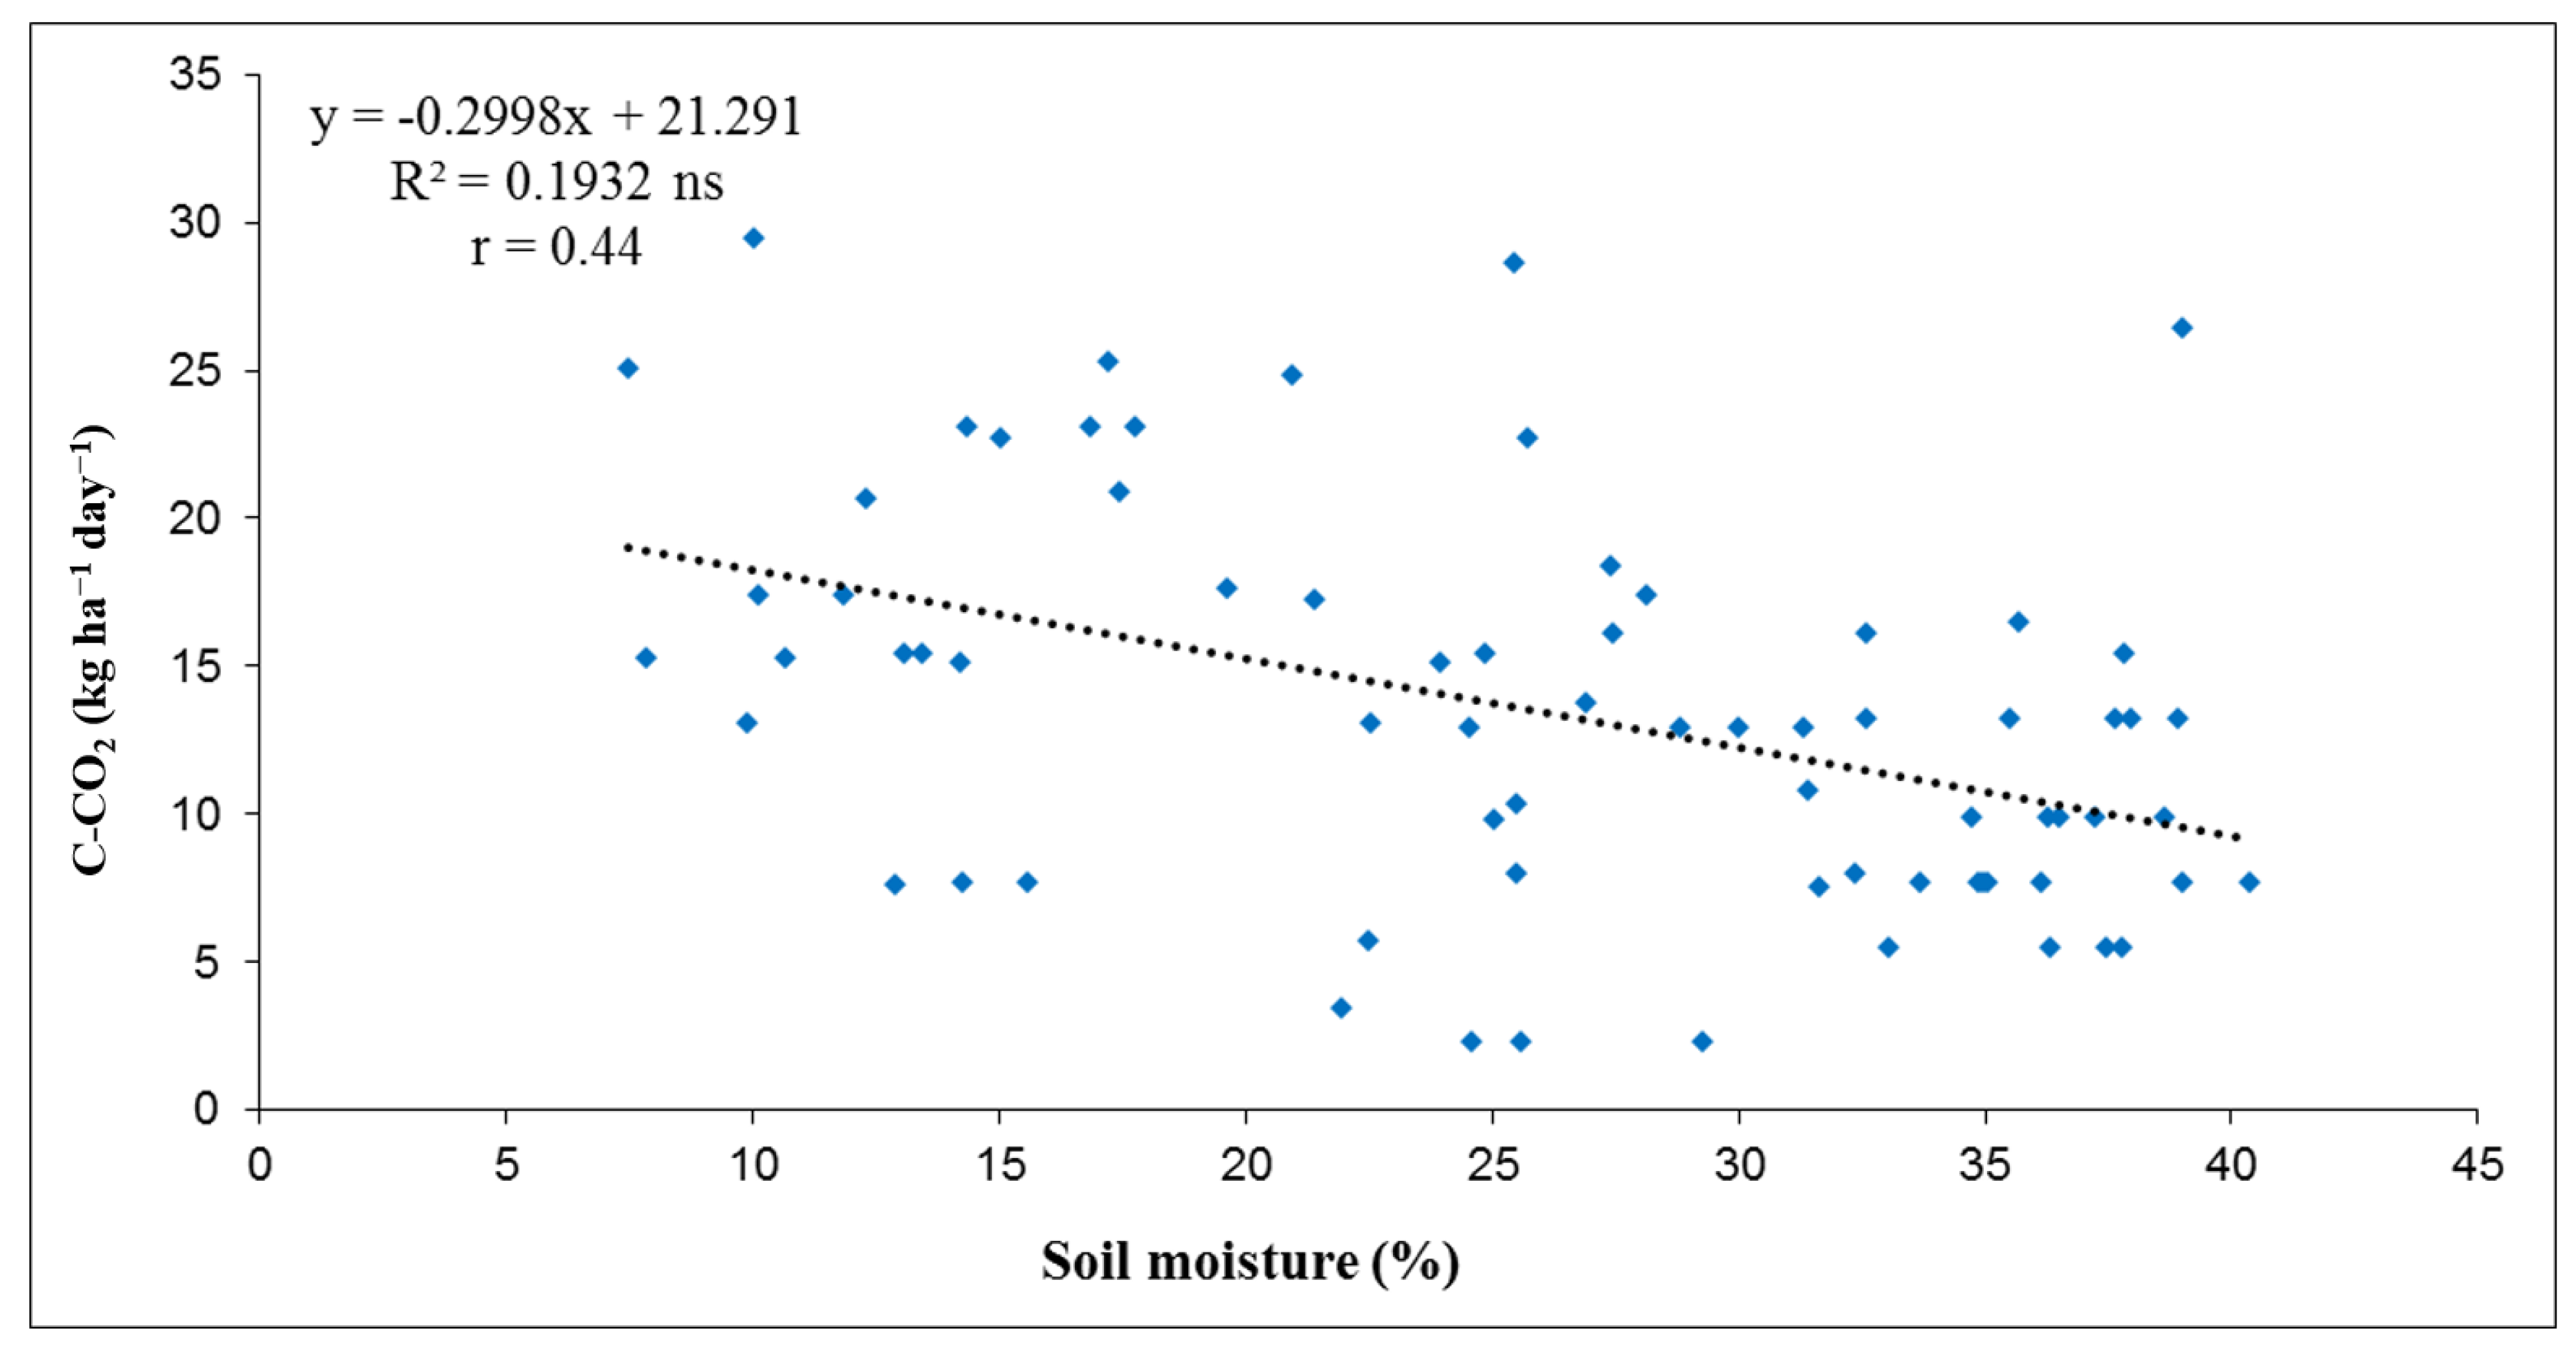
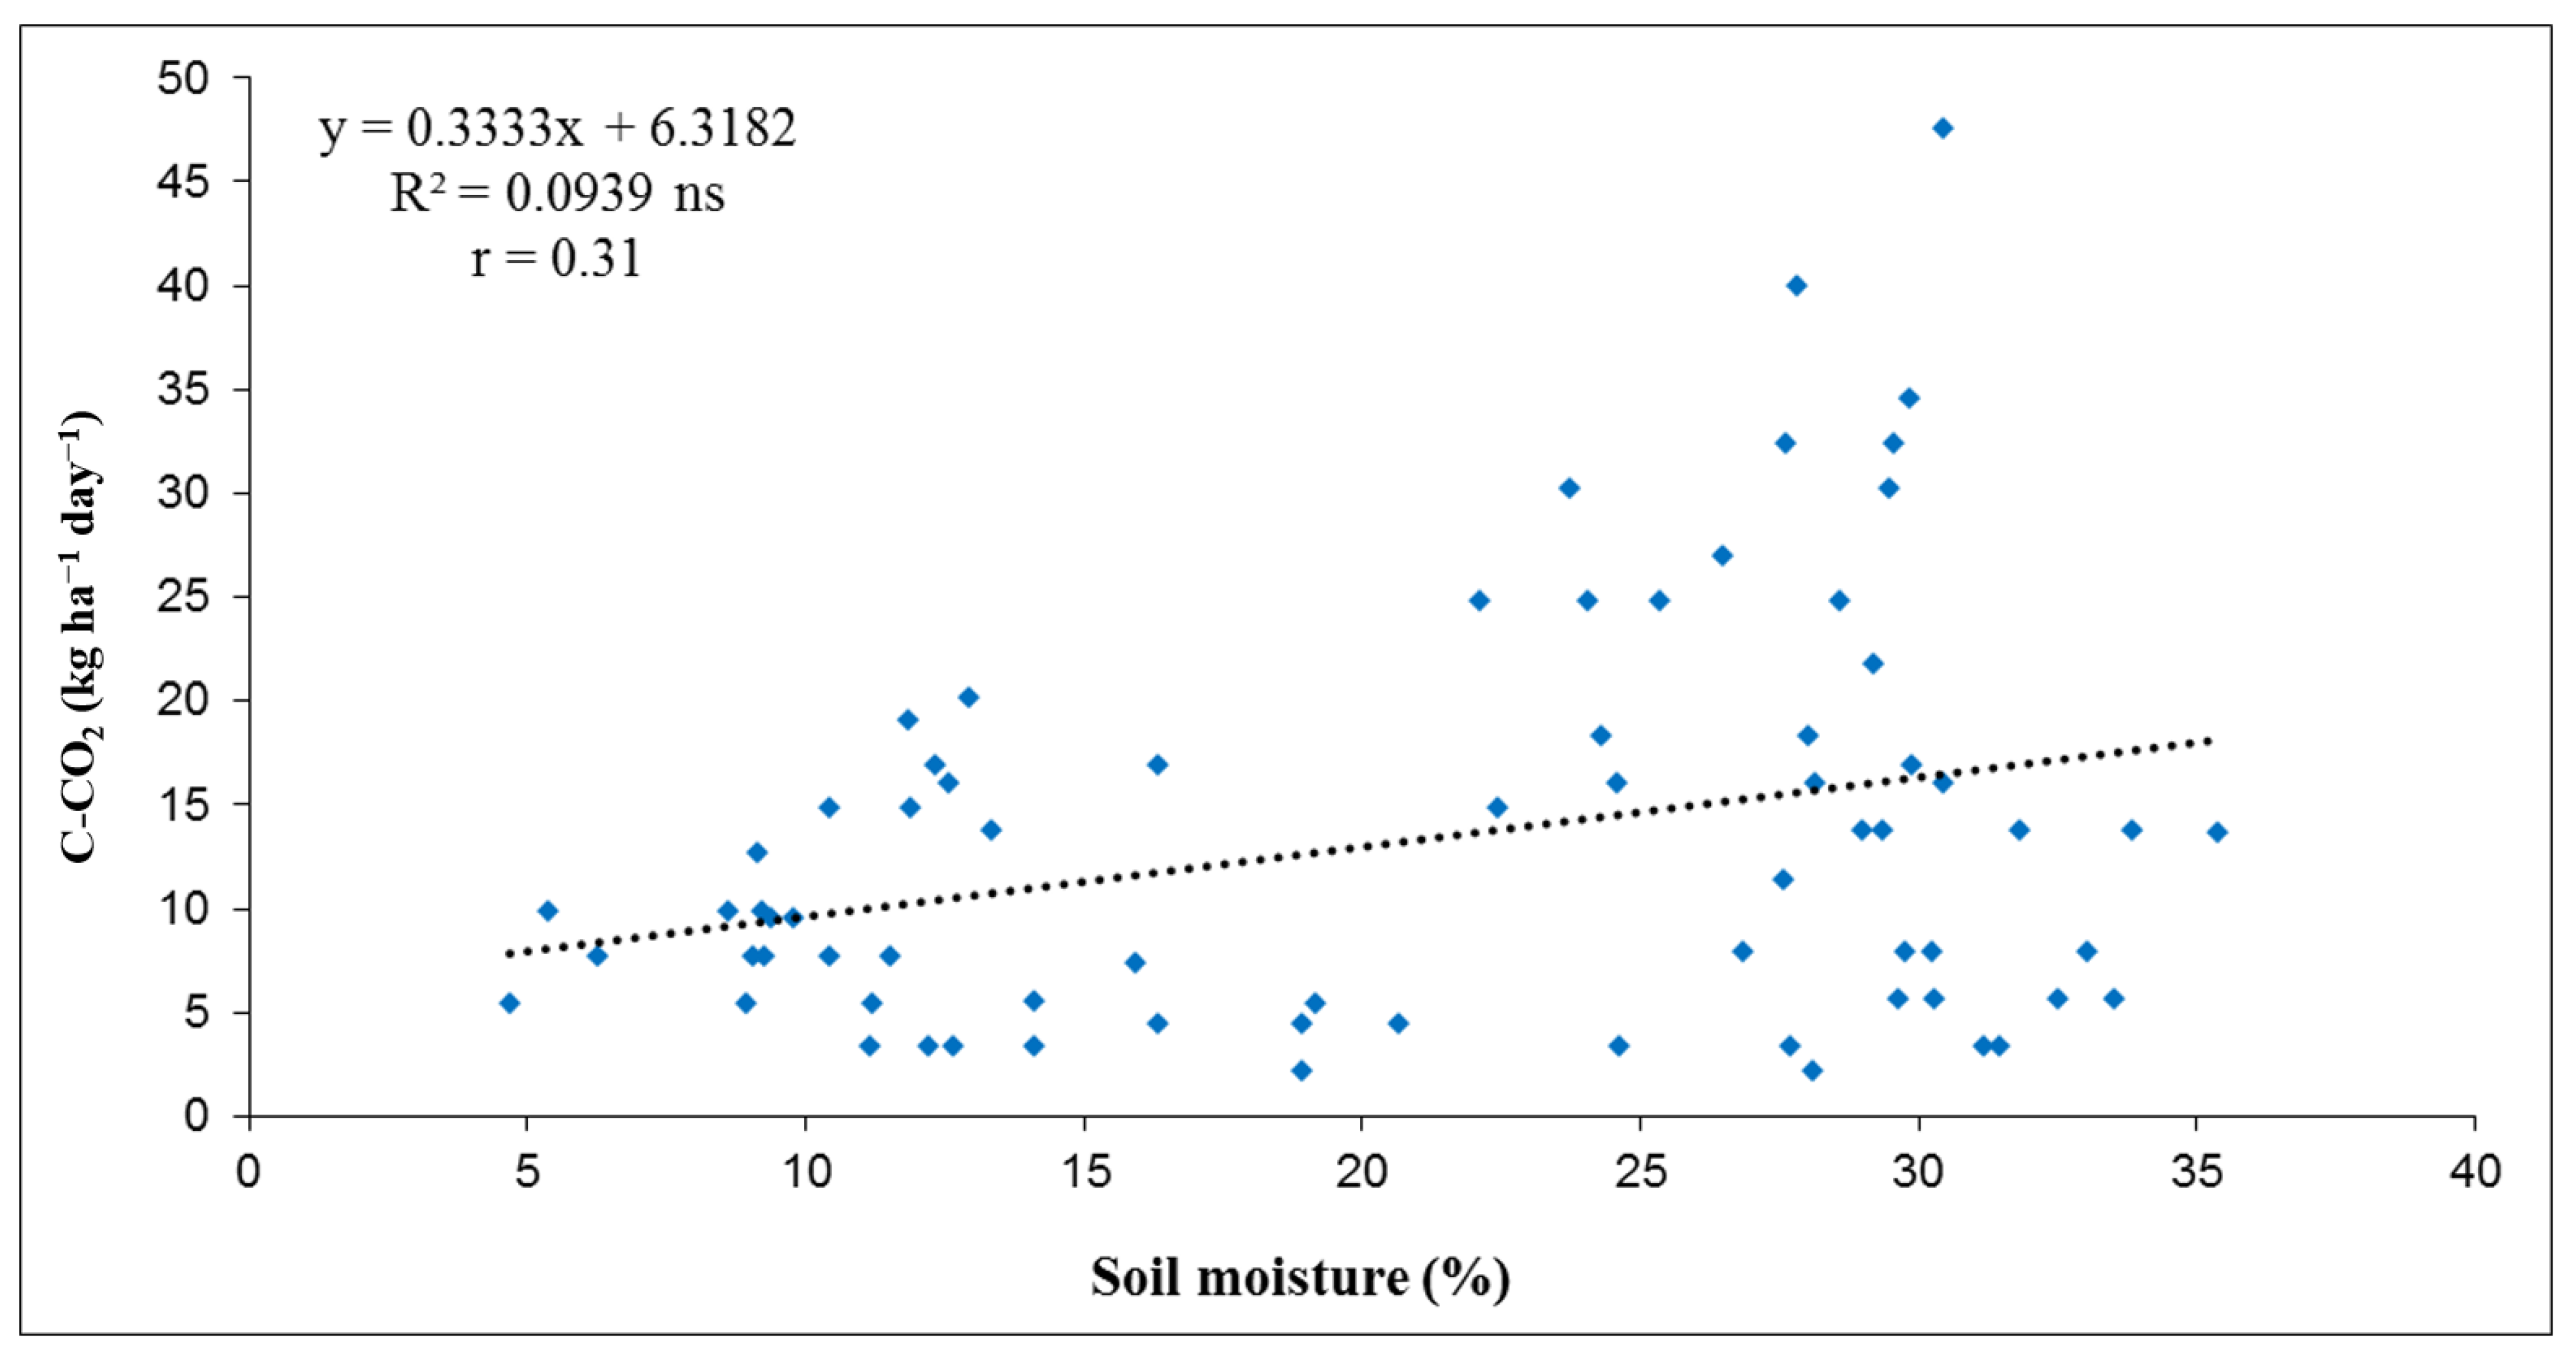
3.2. Relation of Soil C-CO2 Emissions with Soil Temperature and Soil Moisture
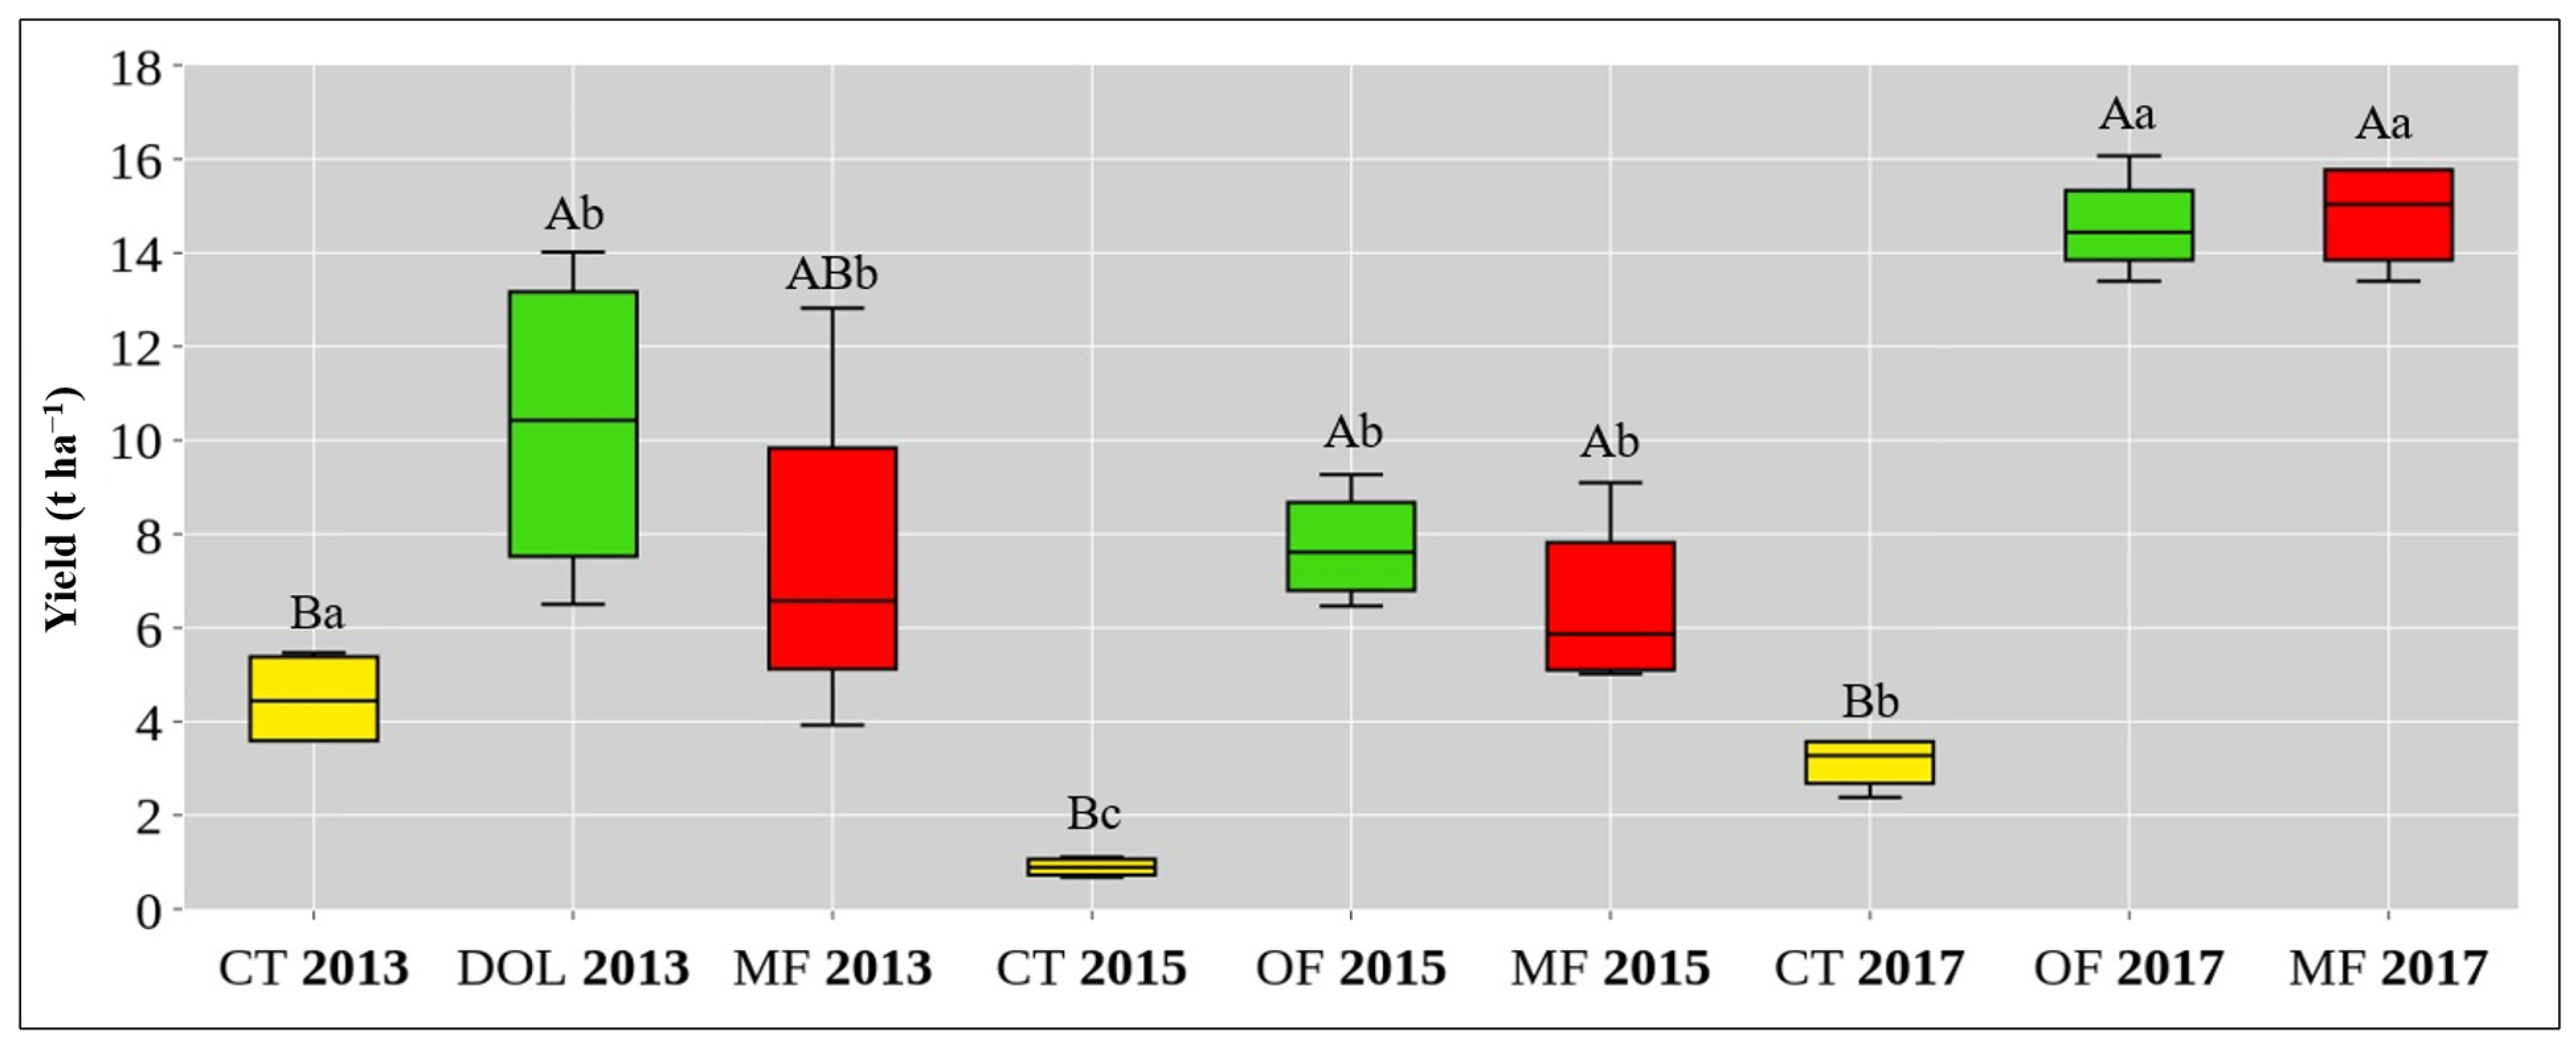
The dependence of soil C-CO2 emissions on soil temperature at 10 cm was determined by regression analysis for the three years studied. The data in Figure 5, Figure 6 and Figure 7 show that the correlation coefficients (r) were low in each year, indicating that the dependence between soil C-CO2 emissions and soil temperature (at 10 cm depth) was very weak in 2013 (r = 0.13), and weak in 2015 and 2017 (r = 0.40 and r = 0.27, respectively). In 2013, the linear regression by coefficient of determination (R2) values showed that only 1.7% of C-CO2 emissions depended on soil temperature. In 2015, the R2 value of 0.1589 showed that 15.9% of C-CO2 emissions from soil depended on soil temperature, while this value was 7.2% in 2017. Overall, the results showed that soil temperature had a weak but positive influence on C-CO2 emissions from soil during the three-year period. The correlations between C-CO2 emissions and soil temperature are shown graphically in Figure 5, Figure 6 and Figure 7.
The dependence of soil C-CO2 emissions on soil moisture at 10 cm depth for the three years studied was also determined by regression analysis. The values of correlation coefficients (r) presented in Figure 8, Figure 9 and Figure 10 show that the dependence between soil C-CO2 emissions and soil moisture (at 10 cm depth) was weakly positive in 2013 (r = 0.29) and 2017 (r = 0.31), but moderate negative in 2015 (r = 0.44). In 2013, the linear regression by R2 value showed that 8.64% of C-CO2 emissions depended on soil moisture. In 2017, the R2 value of 0.0938 showed that 9.38% of soil C-CO2 emissions depended on soil moisture. In general, the results showed that soil moisture had an influence on soil C-CO2 emissions, except in 2015. The correlations between C-CO2 emissions and soil moisture are shown graphically in Figure 8, Figure 9 and Figure 10.

3.3. Crop Yield

Figure 11 shows the results of corn (Zea mays L.) yield according to the investigated treatments for three years. Yield is shown for three treatments (CT, DOL/OF and MF). Yield was not determined for the BF treatment because it was a tillage treatment without seeding. In 2013, statistically significant differences were found between the CT (4.49 t ha−1) and DOL (10.34 t ha−1) treatments, while the MF treatment (7.48 t ha−1) was not significantly different from these two treatments. In 2015, significant differences were found between CT (0.89 t ha−1) and OF (7.74 t ha−1), and CT and MF (6.46 t ha−1). However, no significant difference was found between OF and MF. The same statistical differences were found in 2017 between CT (3.13 t ha−1) and OF (14.58 t ha−1), between and CT and MF (14.81 t ha−1). No significant difference was found between the observed rate of OF and MF.
Significant differences were observed between experimental years in CT, ranging from 0.89 t ha−1 to 4.49 t ha−1. DOL/OF was significantly different between 2013 (10.34 t ha−1) and 2017 (14.58 t ha−1) as well as 2015 (7.74 t ha−1) and 2017. The same pattern was observed for MF, where lower values were recorded in 2015 (6.46 t ha−1) and 2013 (7.48 t ha−1), while higher values were recorded in 2017 (14.81 t ha−1) (Figure 11).

4. Discussion

The results of this study indicate that different soil management practices affect soil C-CO2 emissions. Depending on fertilizer application, changes between overall CO2 movements were observed in the three years investigated. Although CT showed no statistical differences compared to DOL/OF, MF and BF (except in 2015), some changes in recorded emissions are evident (Figure 3). Nitrogen fertilization increased CO2 fluxes compared to no N fertilization (CT and BF), probably as a result of increased root respiration due to increased microbial activity. Although no statistically significant difference was found between DOL/OF and MF, the MF treatment recorded higher values in all three years (Figure 3). The opposite results were obtained by [49], where the application of organic liquid fertilizer significantly increased CO2 emissions from the soil compared to conventional fertilizer (urea). Similar studies also found lower emissions for mineral fertilized soils [50,51]. Comparable to this study, higher emissions were also found with mineral fertilization [52]. In general, some authors have confirmed that fertilizer addition affects fluxes of GHG from the soil [53,54,55].
Although there were no statistical differences between the three years in the CT, changes in the values are visible (Figure 3). For example, the values of C-CO2 emissions in 2015 were 1.04 and 1.08 times higher than in 2013 and 2017, respectively. Similarly, the results for the DOL/OF treatment showed 0.18 and 1.11 times higher C-CO2 emissions in 2013 than in 2015 and 2017, respectively. The application of dolomite in 2013 resulted in higher emissions compared to the other two years when organic fertilizer was applied. These results are consistent with [56], where dolomite increased cumulative CO2 emissions. Although dolomite is thought to improve soil conditions, which may lead to increased microbial respiration and release of organic carbon as CO2 [57], the reported results show considerable variability [58,59]. In this research, changes in rate were also observed in the MF treatment, where emissions in 2015 were 1.05 and 1.08 times higher than in 2013 and 2017, respectively. On BF, the C-CO2 rate in 2017 was up to 1.13 and 1.39 times higher than in 2013 and 2015, respectively (Figure 3). As mentioned earlier, between the three studied years, no significant differences were noted on the BF treatment due to similar treatment procedures on that plots. Similar findings were found in [60]. As shown in Figure 3, lower values of C-CO2 were recorded when compared to other treatments because of lack of surface cover, fertilization absence and lack of soil disturbance, since this treatment had not been subjected to any additional fertilization and tillage or crop cultivation [61,62,63].
The rate of soil respiration is often positively correlated with soil temperature [64,65]. This correlation can be attributed to the favorable conditions that higher temperatures create for the growth and activity of soil microorganisms. As a result, these conditions stimulate the release of carbon dioxide from the soil [66]. In this research, the recorded average overall soil temperature was 31.10 °C in 2013, 24.37 °C in 2015 and 29.63 °C in 2017. The lowest value of average monthly soil temperature was recorded in April 2015 at 10.70 °C, while the highest value was recorded in June 2013 (47.51 °C). The results observed in this study show a weak positive correlation between soil temperature and C-CO2 (Figure 5, Figure 6 and Figure 7). According to several authors, the relationship between soil temperature and CO2 emissions is very complex [67,68]. Therefore, the results obtained in the context of weak correlation may possibly be attributed to different temperature optima appropriate for different activities of individual microbial groups [69,70]. Moreover, in soils with organic matter more resistant to decomposition, the temperature sensitivity of decomposition may be reduced, resulting in minimal changes in CO2 emissions [71]. Similar results with a weak positive correlation between soil temperature and C-CO2 were found by several authors [72,73,74].
Soil moisture is also recognized as one of the most important environmental factors affecting soil respiration, whether through direct effects on roots and microbial activity or indirect effects on soil physical and chemical properties [75]. In this research, the recorded average overall soil moisture was 23.41% in 2013, 26.06% in 2015 and 21.06% in 2017. The lowest value of average monthly soil moisture was recorded in August 2017 and was 4.68%, while the highest value was recorded in October 2015 (40.38%). The results of this study are consistent with those of several authors who found a positive correlation [76,77] and a negative correlation [78,79] between soil moisture and CO2 emissions. In 2015, when a negative correlation was found (Figure 9), higher soil temperatures coincided with lower soil moisture, which limits microbial activity and thus reduces organic matter decomposition and subsequent CO2 emissions. These two environmental characteristics tend to change simultaneously [80]. Also, a possible explanation of the negative correlation between C-CO2 emissions and soil moisture can lie in the excessive soil moisture, which has a negative consequence in which anaerobic conditions could affect microbial respiration, thus leading to potentially lower CO2 emissions from the soil [79,81].
In this research, all three years followed the same pattern on CT treatment and recorded the lowest yield. These findings can be attributed to the lack of fertilization. Similar findings were found in several research studies [82,83]. The DOL and OF treatments had lower values in the year 2015 when compared to 2013 and 2017, probably because of high manure application. This can lead to nutrient imbalance and nitrogen depression, thus affecting maize growth [84]. Also, it is well-known that nutrients from manure release to soil slowly throughout a three-year period [85], so in 2017 when the yield on that treatment was the highest, this was because of higher nutrient availability for maize growth. And finally, the MF treatment had no significant differences throughout the studied period. This can be explained through nutrient stability and availability due to consistent mineral fertilization through the years [86].
It is known that soil respiration is also influenced by the presence of vegetation and increased crop yield. According to [87], the presence of powerful plant roots surrounded by a community of microorganisms plays an important role in promoting high soil respiration rates. In this research, in 2013 and 2015, C-CO2 emissions increased with increasing yield (Figure 11). Similar results were obtained by several authors [12,88]. Although a much higher yield was recorded in 2017 than in 2013 and 2015, C-CO2 emissions were the lowest (Figure 11). This result can be related to [89], where the mentioned authors explain that despite abundant vegetation, less carbon is available for release as C-CO2 emissions through soil respiration when plants use CO2 efficiently for biomass production. In addition, carbon retention in plant biomass can also reduce C-CO2 emissions [90].

5. Conclusions

This study shows that different management practices have an impact on soil C-CO2 emissions. In 2013 and 2015, a statistically significant difference was found between different fertilization treatments compared to bare soil, while in 2017 the values were not significantly different. In conclusion, the results indicate that different fertilization treatments affect soil C-CO2 emissions. For example, the DOL and MF treatments generally had higher emissions than the BF treatment, while soil emissions remained constant over time in the CT. Temporal variations occurred for the OF treatment, as well as for the MF treatment in 2013 and 2017, where higher emissions were observed. Average C-CO2 fluxes were positively correlated with soil temperature in all three years and positively correlated with soil moisture in 2013 and 2017, while negative correlation was observed in 2015. Crop yield varied in treatments and studied periods, so due to lack of any kind of fertilization, the yield increase was absent in the control treatment compared to fertilized ones. The differences observed in all treatments were influenced by the presence of corn vegetation, with emissions increasing in parallel with crop development. Even though this study showed different results, it needs to be mentioned that application of dolomite and manure did not provide expected results in the means of reducing the CO2 emissions, since their application enhanced microorganism activity, thus increasing respiration. These results show the importance of considering different fertilization practices and their impact on soil CO2 emissions in the context of agricultural and environmental management.

Author Contributions

Conceptualization, M.G.; methodology, M.G., D.B. and Z.Z; software, M.G. and Z.Z.; validation, Z.Z.; formal analysis, M.G.; investigation, M.G., D.B. and Z.Z.; data curation, Z.Z.; writing—original draft preparation, M.G.; writing—review and editing, M.G. and Z.Z.; visualization, M.G.; supervision, M.G. and Z.Z. All authors have read and agreed to the published version of the manuscript.

Funding

this research is funded by Environmental Protection and Energy Efficiency Fund.

Data Availability Statement

Not applicable.

Conflicts of Interest

The authors declare no conflict of interest.

References

  1. Umesha, S.; Manukumar, H.M.; Chandrasekhar, B. Sustainable agriculture and food security. In Biotechnology for Sustainable Agriculture; Woodhead Publishing: Shaxton, UK, 2018; pp. 67–92. [Google Scholar]
  2. Angelakis, A.N.; Vuorinen, H.S.; Nikolaidis, C.; Juuti, P.S.; Katko, T.S.; Juuti, R.P.; Zhang, J.; Samonis, G. Water quality and life expectancy: Parallel courses in time. Water 2021, 13, 752. [Google Scholar] [CrossRef]
  3. Satterthwaite, D. The implications of population growth and urbanization for climate change. Environ. Urban. 2009, 21, 545–567. [Google Scholar] [CrossRef] [Green Version]
  4. Riahi, K.; Rao, S.; Krey, V.; Cho, C.; Chirkov, V.; Fischer, G.; Kindermann, G.; Nakicenovic, N.; Rafaj, P. RCP 8.5—A scenario of comparatively high greenhouse gas emissions. Clim. Change 2011, 109, 33–57. [Google Scholar] [CrossRef] [Green Version]
  5. Mora, C.; Spirandelli, D.; Franklin, E.C.; Lynham, J.; Kantar, M.B.; Miles, W.; Smith, C.Z.; Freel, K.; Moy, J.; Louis, L.V.; et al. Broad threat to humanity from cumulative climate hazards intensified by greenhouse gas emissions. Nat. Clim. Change 2018, 8, 1062–1071. [Google Scholar] [CrossRef]
  6. Ramanathan, V.; Feng, Y. Air pollution, greenhouse gases and climate change: Global and regional perspectives. Atmos. Environ. 2009, 43, 37–50. [Google Scholar] [CrossRef]
  7. Adedeji, O. Global climate change. J. Geosci. Environ. Prot. 2014, 2, 114–122. [Google Scholar] [CrossRef]
  8. Stockmann, U.; Adams, M.A.; Crawford, J.W.; Field, D.J.; Henakaarchchi, N.; Jenkins, M.; Minasny, B.; Mcbratney, A.B.; Courcelles, V.D.R.D.; Singh, K.; et al. The knowns, known unknowns and unknowns of sequestration of soil organic carbon. Agric. Ecosyst. Environ. 2013, 164, 80–99. [Google Scholar] [CrossRef]
  9. Scharlemann, J.; Tanner, E.; Hiederer, R.; Kapos, V. Global soil carbon: Understanding and managing the largest terrestrial carbon pool. Carbon Manag. 2014, 14, 81–91. [Google Scholar] [CrossRef]
  10. FAO. Food and Agriculture Organisation of the United Nations. 2015 Publications; FAO: Rome, Italy, 2015. [Google Scholar]
  11. Plaza, C.; Zaccone, C.; Sawicka, K.; Méndez, A.M.; Tarquis, A.; Gascó, G.; Heuvelink, G.B.M.; Schuur, E.A.G.; Maestre, F.T. Soil resources and element stocks in drylands to face global issues. Sci. Rep. 2018, 8, 13788. [Google Scholar] [CrossRef] [Green Version]
  12. Schlesinger, W.H.; Andrews, J.A. Soil respiration and the global carbon cycle. Biogeochemistry 2000, 48, 7–20. [Google Scholar] [CrossRef]
  13. Carlsson-Kanyama, A. Climate change and dietary choices—How can emissions of greenhouse gases from food consumption be reduced? Food Policy 1998, 23, 277–293. [Google Scholar] [CrossRef]
  14. Blanco, H.; Lal, R. Principles of Soil Conservation and Management, 1st ed.; Springer: New York, NY, USA, 2008; p. 617. [Google Scholar]
  15. Canadell, J.G.; Schulze, E.D. Global potential of biospheric carbon management for climate mitigation. Nat. Commun. 2014, 5, 5282. [Google Scholar] [CrossRef] [PubMed] [Green Version]
  16. Bilandzija, D.; Zgorelec, Z.; Kisic, I. Influence of Tillage Practices and Crop Type on Soil CO2 Emissions. Sustainability 2016, 8, 90–91. [Google Scholar] [CrossRef] [Green Version]
  17. Lal, R. Agricultural activities and the global carbon cycle. Nutr. Cycl. Agroecosyst. 2004, 70, 103–116. [Google Scholar] [CrossRef]
  18. Mäder, P.; Fliessbach, A.; Dubois, D. Soil Fertility and Biodiversity in Organic Farming Science. Science 2002, 296, 1694–1697. [Google Scholar] [CrossRef] [Green Version]
  19. Fließach, A.; Oberholzer, H.R.; Gunst, L.; Mäder, P. Soil organic matter and biological soil quality indicators after 21 years of organic and conventional farming. Agric. Ecosyst. Environ. 2007, 118, 273–284. [Google Scholar] [CrossRef]
  20. Bilandzija, D. Emisija Ugljikovog Dioksida pri Različitim Načinima Obrade Tla. Ph.D. Thesis, Faculty of Agriculture University of Zagreb, Zagreb, Croatia, 2015. [Google Scholar]
  21. Metcalfe, D.B.; Meir, P.; Aragaõ, L.E.O.C.; da Costa, A.C.L.; Braga, A.; Goncalves, P.H.L.; de Athaydes, J.; de Almeida, S.S.; Williams, M. Factors controlling spatio-temporal variation in carbon dioxide efflux from surface litter, roots, and soil organic matter at four rain forest sites in the eastern Amazon. J. Geophys. Res. Biogeosci. 2007, 112, 1–9. [Google Scholar] [CrossRef] [Green Version]
  22. Moyano, F.; Kutsch, W.L.; Schulze, E.D. Response of mycorrhizal, rhizosphere and soil basal respiration to temperature and photosynthesis in a barley field. Soil Biol. Biochem. 2007, 39, 843–853. [Google Scholar] [CrossRef]
  23. Nannipieri, P.; Ascher, J.; Ceccherini, M.T.; Landi, L.; Pietramellara, G.; Renella, G. Microbial diversity and soil functions. Eur. J. Soil Sci. 2003, 68, 655–670. [Google Scholar] [CrossRef]
  24. Kuzyakov, Y. Sources of CO2 efflux from soil and review of partitioning methods. Soil Biol. Biochem. 2006, 38, 425–448. [Google Scholar] [CrossRef]
  25. Zgorelec, Z.; Blazinkov, M.; Mesic, M.; Bilandzija, D.; Percin, A.; Sestak, I.; Cacic, M. Gospodarenje Tlom i Klimatske Promjene. Report. 2017. Available online: https://www.agr.unizg.hr/en/project/528/Gospodarenje+tlom+i+klimatske+promjene (accessed on 25 June 2023).
  26. Kirschbaum, M.U. Will changes in soil organic carbon act as a positive or negative feedback on global warming? Biogeochemistry 2000, 48, 21–51. [Google Scholar] [CrossRef]
  27. Trumbore, S. Age of soil organic matter and soil respiration: Radiocarbon constraints on belowground C dynamics. Ecol. Appl. 2000, 10, 399–411. [Google Scholar] [CrossRef]
  28. Houghton, R.A.; House, J.I.; Pongratz, J.; Van Der Werf, G.R.; Defries, R.S.; Hansen, M.C.; Le Quéré, C.; Ramankutty, N. Carbon emissions from land use and land-cover change. Biogeosciences 2012, 9, 5125–5142. [Google Scholar] [CrossRef] [Green Version]
  29. Zhang, W.F.; Dou, Z.X.; He, P.; Ju, X.T.; Powlson, D.; Chadwick, D.; Norse, D.; Lu, Y.L.; Zhang, Y.; Wu, L.; et al. New technologies reduce greenhouse gas emissions from nitrogenous fertilizer in China. Proc. Natl. Acad. Sci. USA 2013, 110, 8375–8380. [Google Scholar] [CrossRef]
  30. Guo, L.; Song, Y.; Zhao, S.; Tang, M.; Guo, Y.; Su, M.; Li, H. Dynamic Linkage between Aging, Mechanizations and Carbon Emissions from Agricultural Production. Int. J. Environ. Res. Public Health 2022, 19, 6191. [Google Scholar] [CrossRef]
  31. Battaglia, M.L.; Thomason, W.E.; Fike, J.H.; Evanylo, G.K.; Stewart, R.D.; Gross, C.D.; Seleiman, M.F.; Babur, E.; Sadeghpour, A.; Harrison, M.T. Corn and wheat residue management effects on greenhouse gas emissions in the mid-Atlantic USA. Land 2022, 11, 846. [Google Scholar] [CrossRef]
  32. Searchinger, T.; Heimlich, R.; Houghton, R.A.; Dong, F.; Elobeid, A.; Fabiosa, J.; Tokgoz, S.; Hayes, D.J.; Yu, T.H. Use of US croplands for biofuels increases greenhouse gases through emissions from land-use change. Science 2008, 319, 1238–1240. [Google Scholar] [CrossRef]
  33. Zhang, X.B.; Xu, M.G.; Sun, N.; Wang, X.J.; Wu, L.; Wang, B.R.; Li, D.C. How do environmental factors and different fertilizer strategies affect soil CO2 emission and carbon sequestration in the upland soils of southern China? Appl. Soil Ecol. 2013, 72, 109–118. [Google Scholar] [CrossRef]
  34. Nikièma, P.; Rothstein, D.E.; Min, D.H.; Kapp, C.J. Nitrogen fertilization of switchgrass increases biomass yield and improves net greenhouse gas balance in northern Michigan, USA. Biomass Bioenergy 2011, 35, 4356–4367. [Google Scholar] [CrossRef]
  35. Escobar, L.F.; Amado, T.J.C.; Bayer, C.; Chavez, L.F.; Zanatta, J.A.; Fiorin, J.E. Postharvest nitrous oxide emissions from a subtropical oxisol as influenced by summer crop residues and their management. Rev. Bras. Ciênc. Solo 2010, 34, 507–516. [Google Scholar] [CrossRef] [Green Version]
  36. Bilandzija, D.; Zgorelec, Z.; Kisic, I. The influence of agroclimatic factors on soil CO2 emissions. Coll. Antropol. 2014, 38, 77–83. [Google Scholar]
  37. Jabro, J.D.; Sainju, U.; Stevens, W.B.; Evans, R.G. Carbon Dioxide Flux as Affected by Tillage and Irrigation in Soil Converted from Perennial Forages to Annual Crops. J. Environ. Manag. 2008, 88, 1478–1484. [Google Scholar] [CrossRef] [PubMed]
  38. Lou, Y.; Li, Z.; Zhang, T. Carbon Dioxide Flux in a Subtropical Agricultural Soil of China. Water Air Soil Pollut. 2003, 149, 281–293. [Google Scholar] [CrossRef]
  39. WRB. World Reference Base for Soil Resources 2014, Update 2015: International Soil Classification System for Naming Soils and Creating Legends for Soil Maps; World Soil Resources Reports No. 106; FAO: Rome, Italy, 2014; pp. 150–200. [Google Scholar]
  40. Kottek, M.; Grieser, J.; Beck, C.; Rudolf, B.; Rubel, F. World map of the Köppen-Geiger climate classification updated. Meteorol. Z. 2006, 15, 259–263. [Google Scholar] [CrossRef]
  41. HRN ISO11464; Soil Quality—Pre-Treatment of Samples for Physico-Chemical Analysis. International Organization for Standardization: Geneva, Switzerland, 2004.
  42. HRN ISO 10390; Soil Quality—Determination of pH. International Organization for Standardization: Geneva, Switzerland, 2005.
  43. HRN ISO 14235; Soil Quality—Determination of Organic Carbon by Sulfochromic Oxidation. International Organization for Standardization: Geneva, Switzerland, 2004.
  44. Egner, H.; Riehm, H.; Domingo, W.R. Studies on the Chemical Soil Analysis as a Basis for the Assessment of the Nutrient Status of Soils. K. Lantbruksakad. Ann. 1960, 26, 45–61. (In German) [Google Scholar]
  45. Mesic, M.; Percin, A.; Bogunovic, I.; Zgorelec, Z.; Gandjaeva, L. Environmental and Production Aspects of Maize Cultivation in Relation with the Different Time-applied Nitrogen. Columella 2017, 4, 181–186. [Google Scholar]
  46. HRN ISO 11277:2004; Soil Quality—Determination of Particle Size Distribution in Mineral Soil Material—Method by Sieving and Sedimentation. International Organization for Standardization: Geneva, Switzerland, 2004.
  47. Widen, W.; Lindroth, A. A Calibration System for Soil Carbon Dioxide-efflux Measurement Chambers: Description and Application. Soil Sci. Soc. Am. J. 2001, 67, 327–334. [Google Scholar] [CrossRef]
  48. Tóth, T.; Fórizs, I.; Kuti, L.; Wardell, J.L. Data on the elements of carbon cycle in a solonetz and solonchak soil. Cereal Res. Commun. 2005, 33, 133–136. [Google Scholar] [CrossRef]
  49. Verdi, L.; Mancini, M.; Napoli, M.; Vivoli, R.; Pardini, A.; Orlandini, S.; Marta, A.D. Soil carbon emissions from maize under different fertilization methods in an extremely dry summer in Italy. Ital. J. Agrometeorol. 2019, 2, 3–10. [Google Scholar]
  50. Mignon, S.; Maxim, A.; Opruia, C. Soil Respiration in Mineral and Organic Fertilized Soils During Springtime in a Potato Field. ProEnviron. Promediu 2011, 4, 316–319. [Google Scholar]
  51. Wilson, H.M.; Al-Kaisi, M.M. Crop rotation and nitrogen fertilization effect on soil CO2 emissions in central Iowa. Appl. Soil Ecol. 2008, 39, 264–270. [Google Scholar] [CrossRef]
  52. Zhang, L.H.; Shao, H.B.; Wang, B.C.; Zhang, L.W.; Qin, X.C. Effects of nitrogen and phosphorus on the production of carbon dioxide and nitrous oxide in salt-affected soils under different vegetation communities. Atmos. Environ. 2019, 204, 78–88. [Google Scholar] [CrossRef]
  53. Chen, D.; Li, Y.; Wang, C.; Fu, X.; Liu, X.; Shen, J.; Wang, Y.; Xiao, R.; Liu, D.L.; Wu, J. Measurement and modeling of nitrous and nitric oxide emissions from a tea field in subtropical central China. Nutr. Cycl. Agroecosyst. 2017, 1107, 157–173. [Google Scholar] [CrossRef]
  54. Liu, H.; Ding, Y.; Zhang, Q.; Liu, X.; Xu, J.; Li, Y.; Di, H. Heterotrophic nitrification and denitrification are the main sources of nitrous oxide in two paddy soils. Plant Soil 2018, 445, 39–53. [Google Scholar] [CrossRef]
  55. Wu, Y.; Li, Y.; Fu, X.; Shen, J.; Chen, D.; Wang, Y.; Liu, X.; Xiao, R.; Wei, W.; Wu, J. Effect of controlled-release fertilizer on N2O emissions and tea yield from a tea field in subtropical central China. Environ. Sci. Pollut. Res. 2018, 25, 25580–25590. [Google Scholar] [CrossRef]
  56. Oo, A.Z.; Sudo, S.; Akiyama, H.; Win, K.T.; Shibata, A.; Yamamoto, A.; Sano, T.; Hirono, Y. Effect of dolomite and biochar addition on N2O and CO2 emissions from acidic tea field soil. PLoS ONE 2018, 13, e0192235. [Google Scholar] [CrossRef] [Green Version]
  57. Fuentes, J.P.; Bezdicek, D.F.; Flury, M.; Albrecht, S.; Smith, J.L. Microbial activity affected by lime in a long-term no-till soil. Soil Tillage Res. 2006, 88, 123–131. [Google Scholar] [CrossRef]
  58. Valzano, F.; Murphy, B.; Greene, R. The long-term effects of lime (CaCO3), gypsum (CaSO4·2H2O), and tillage on the physical and chemical properties of a sodic red-brown earth. Soil Res. 2001, 39, 1307–1331. [Google Scholar] [CrossRef]
  59. Shaaban, M.; Wu, L.; Peng, Q.; Van Zwieten, L.; Chhajro, M.A.; Wu, Y.; Lin, S.; Ahmed, M.M.; Khalid, M.S.; Abid, M.; et al. Influence of ameliorating soil acidity with dolomite on the priming of soil C content and CO2 emission. Environ. Sci. Pollut. Res. 2017, 24, 9241–9250. [Google Scholar] [CrossRef] [PubMed]
  60. Galic, M.; Bilandzija, D.; Percin, A.; Sestak, I.; Mesic, M.; Blazinkov, M.; Zgorelec, Z. Effects of Agricultural Practices on Carbon Emission and Soil Health. J. Sustain. Dev. Energy Water Environ. Syst. 2019, 7, 539–552. [Google Scholar] [CrossRef]
  61. Galic, M.; Bilandzija, D.; Reis, I.; Zgorelec, Z. Soil fluxes of carbon dioxide in winter wheat (Triticum aestivum L.) agroecosystem. In Proceedings of the 57th Croatian and 17th International Symposium of Agriculture, Vodice, Croatia, 19–24 June 2022; pp. 691–696. [Google Scholar]
  62. Bogunovic, I.; Pereira, P.; Galic, M.; Bilandzija, D.; Kisic, I. Tillage system and farmyard manure impact on soil physical properties, CO2 emissions, and crop yield in an organic farm located in a Mediterranean environment (Croatia). Environ. Earth Sci. 2020, 79, 70. [Google Scholar] [CrossRef]
  63. Sosulski, T.; Stepien, W.; Was, A.; Szymanska, M. N2O and CO2 Emissions from Bare Soil: Effect of Fertilizer Management. Agriculture 2020, 10, 602. [Google Scholar] [CrossRef]
  64. Zhao, P.; Pumpanen, J.; Kang, S. Spatio-temporal variability and controls of soil respiration in a furrow-irrigated vineyard. Soil Tillage Res. 2020, 196, 104424. [Google Scholar] [CrossRef]
  65. Gao, X.; Zhao, N.; Lu, Y.; Han, X.; Yang, Z. Effects of Supplementary Irrigation on Soil Respiration of Millet Farmland in a Semi-Arid Region in China. Atmosphere 2020, 13, 1584. [Google Scholar] [CrossRef]
  66. Zhang, Y.; Liang, A.; Wang, Y.; Chen, X.; Zhang, S.; Jia, S.; Zhang, X.; Yang, X.; McLaughlin, N. Chapter 14—Climate change impacts on soil fertility in Chinese Mollisols. In Sustainable Crop Productivity and Quality Under Climate Change, 1st ed.; Academic Press: Cambridge, MA, USA, 2022; pp. 275–293. [Google Scholar]
  67. Yuste, J.C.; Baldocchi, D.D.; Gershenson, A.; Goldstein, A.; Misson, L.; Wong, S. Microbial soil respiration and its dependency on carbon inputs, soil temperature and moisture. Glob. Change Biol. 2007, 13, 2018–2035. [Google Scholar] [CrossRef] [Green Version]
  68. Vicentini, M.E.; Pinotti, C.R.; Yoshio Hirai, W.; de Moraes, M.L.T.; Montanari, R.; Filho, M.C.M.T.; Milori, D.M.B.P.; Junior, N.L.S.; Panosso, A.R. CO2 emission and its relation to soil temperature, moisture, and O2 absorption in the reforested areas of Cerrado biome, Central Brazil. Plant Soil 2019, 444, 193–211. [Google Scholar] [CrossRef]
  69. Warembourg, F.R.; Roumet, C.; Lafont, F. Differences in rhizosphere carbon partitioning among plant species of different families. Plant Soil 2003, 256, 347–357. [Google Scholar] [CrossRef]
  70. Garcia, C.; Roldan, A.; Hernandez, T. Ability of different plant species to promote microbiological processes in semiarid soil. Geoderma 2005, 124, 193–202. [Google Scholar] [CrossRef]
  71. Ryan, M.G.; Law, B.E. Interpreting, measuring, and modeling soil respiration. Biogeochemistry 2005, 73, 3–27. [Google Scholar] [CrossRef]
  72. Liang, J.I.N.; Chang-Yi, L.U.; Yong, Y.E.; Gong-Fu, Y.E. Soil respiration in a subtropical mangrove wetland in the Jiulong River Estuary, China. Pedosphere 2013, 23, 678–685. [Google Scholar]
  73. Chanda, A.; Akhand, A.; Manna, S.; Dutta, S.; Das, I.; Hazra, S.; Rao, K.H.; Dadhwal, V.K. Measuring daytime CO2 fluxes from the inter-tidal mangrove soils of Indian Sundarbans. Environ. Earth Sci. 2014, 72, 417–427. [Google Scholar] [CrossRef]
  74. Tomotsune, M.; Yoshitake, S.; Iimura, Y.; Kida, M.; Fujitake, N.; Koizumi, H.; Ohtsuka, T. Effects of soil temperature and tidal condition on variation in carbon dioxide flux from soil sediment in a subtropical mangrove forest. J. Trop. Ecol. 2018, 34, 268–275. [Google Scholar] [CrossRef]
  75. Raich, J.W.; Schlesinger, W.H. The global carbon dioxide flux in soil respiration and its relationship to vegetation and climate. Tellus 1992, 44, 81–99. [Google Scholar] [CrossRef] [Green Version]
  76. Hernandez-Ramirez, G.; Brouder, S.M.; Smith, D.R.; Van Scoyoc, G.E. Greenhouse gas fluxes in an Eastern corn belt soil: Weather, nitrogen source, and rotation. J. Environ. Qual. 2009, 38, 841–854. [Google Scholar] [CrossRef] [PubMed] [Green Version]
  77. Buragienė, S.; Šarauskis, E.; Romaneckas, K.; Adamavicienė, A.; Kriauciunienė, Z.; Avižienytė, D.; Marozas, V.; Naujokienė, V. Relationship between CO2 emissions and soil properties of differently tilled soils. Sci. Total Environ. 2019, 662, 786–795. [Google Scholar] [CrossRef] [PubMed]
  78. Ussiri, D.A.N.; Lal, R. Long-term tillage effects on soil carbon storage and carbon dioxide emissions in continuous corn cropping system from an alfisol in Ohio. Soil Tillage Res. 2009, 104, 39–47. [Google Scholar] [CrossRef]
  79. Wood, T.E.; Detto, M.; Silver, W.L. Sensitivity of Soil Respiration to Variability in Soil Moisture and Temperature in a Humid Tropical Forest. PLoS ONE 2013, 8, e80965. [Google Scholar] [CrossRef]
  80. Ding, W.; Yu, H.; Cai, Z.; Han, F.; Xu, Z. Responses of soil respiration to N fertilization in a loamy soil under maize cultivation. Geoderma 2010, 155, 381–389. [Google Scholar] [CrossRef]
  81. Conrad, R. Soil microorganisms as controllers of atmospheric trace gases (H2, CO, CH4, OCS, N2O, and NO). Microbiol. Rev. 1996, 60, 609–640. [Google Scholar] [CrossRef]
  82. Liu, Q.; Xu, H.; Mu, X.; Zhao, G.; Gao, P.; Sun, W. Effects of Different Fertilization Regimes on Crop Yield and Soil Water Use Efficiency of Millet and Soybean. Sustainability 2020, 12, 4125. [Google Scholar] [CrossRef]
  83. Mucheru-Muna, M.; Mugendi, D.; Kungu, J.; Mugwe, J.; Bationo, A. Effects of organic and mineral fertilizer inputs on maize yield and soil chemical properties in a maize cropping system in Meru South District, Kenya. Agrofor. Syst. 2007, 69, 189–197. [Google Scholar] [CrossRef]
  84. Van der Boom, F.; Magid, J.; Jensen, L.S. Long-term P and K fertilisation strategies and balances affect soil availability indices, crop yield depression risk and N use. Eur. J. Agron. 2017, 86, 12–23. [Google Scholar] [CrossRef]
  85. Iqbal, J.; Johnson, S.; Schmidt, A. Calculating the Value of Manure for Crop Production. In NebGuide; The Board of Regents of the University of Nebraska: Lincoln, NE, USA, 2021. [Google Scholar]
  86. Macholdt, J.; Piepho, H.P.; Honermeier, B. Mineral NPK and manure fertilisation affecting the yield stability of winter wheat: Results from a long-term field experiment. Eur. J. Agron. 2019, 102, 14–22. [Google Scholar] [CrossRef]
  87. Galic, M.; Zgorelec, Z.; Bilandzija, D. Soil carbon dioxide emissions in winter wheat vegetation influenced by agro-ecological factors and fertilization. In Proceedings of the 12th International Scientific/Proffesional Conference Agriculture in Nature and Environment Protection, Osijek, Croatia, 7–9 September 2019; pp. 181–187. [Google Scholar]
  88. Han, G.X.; Yang, L.Q.; Yu, J.B.; Wang, G.M.; Mao, P.L.; Gao, Y.J. Environmental Controls on Net Ecosystem CO2 Exchange Over a Reed (Phragmites Australis) Wetland in the Yellow River Delta, China. Estuaries Coasts 2012, 36, 401–413. [Google Scholar] [CrossRef]
  89. Joshi, J.; Amthor, J.S.; McCarty, D.R.; Messina, C.D.; Wilson, M.A.; Millar, H.; Hanson, A.D. Why cutting respiratory CO2 loss from crops is possible, practicable, and prudential. Mod. Agric. 2023, 1, 16–26. [Google Scholar] [CrossRef]
  90. Abdullahi, A.C.; Siwar, C.; Isma’il Shaharudin, M.; Anizan, I. Carbon Sequestration in Soils: The Opportunities and Challenges. In Carbon Capture, Utilization and Sequestration; Intech Open: Rijeka, Croatia, 2018. [Google Scholar]
Figure 1. Average annual temperature (°C) throughout the reference period (1991–2020) and study period (2013, 2015, 2017).
Agronomy 13 02051 g001
Figure 2. Average annual precipitation (mm) throughout the reference period (1991–2020) and study period (2013, 2015, 2017).
Agronomy 13 02051 g002
Figure 3. Average overall C-CO2 emissions per treatment during the investigated period. Upper hanging bar (max. value), lower hanging bar (min. value), upper box line (third quartile), line (median) and lower box line (first quartile). Different uppercase letters (A, B) represent significant differences between 4 treatments within each investigated year (p < 0.05). Different lowercase letters (a) represent significant differences between the same treatments for three investigated years (p < 0.05).
Agronomy 13 02051 g003
Figure 4. Average daily soil C-CO2 emissions (kg ha−1 day−1) during the investigated period.
Agronomy 13 02051 g004
Figure 5. Correlation between C-CO2 flux and soil temperature (°C) at 10 cm depth for investigated year 2013. (Level of statistical significance: *—p ≤ 0.05).
Agronomy 13 02051 g005
Figure 6. Correlation between C-CO2 flux and soil temperature (°C) at 10 cm depth for investigated year 2015. (Level of statistical significance: ns—not significant).
Agronomy 13 02051 g006
Figure 7. Correlation between C-CO2 flux and soil temperature (°C) at 10 cm depth for investigated year 2017. (Level of statistical significance: ns—not significant).
Agronomy 13 02051 g007
Figure 8. Correlation between C-CO2 flux and soil moisture (%) at 10 cm depth for investigated year 2013. (Level of statistical significance: ns—not significant).
Agronomy 13 02051 g008
Figure 9. Correlation between C-CO2 flux and soil moisture (%) at 10 cm depth for investigated year 2015. (Level of statistical significance: ns—not significant).
Agronomy 13 02051 g009
Figure 10. Correlation between C-CO2 flux and soil moisture (%) at 10 cm depth for investigated year 2017. (Level of statistical significance: ns—not significant).
Agronomy 13 02051 g010
Figure 11. Corn (Zea mays L.) yield according to the investigated treatments for three years. Upper hanging bar (max. value), lower hanging bar (min. value), upper box line (third quartile), line (median) and lower box line (first quartile). Different uppercase letters (A, B) represent significant differences between 3 treatments within each investigated year (p < 0.05). Different lowercase letters (a, b, c) represent significant differences between the same treatments for the three investigated years (p < 0.05).
Agronomy 13 02051 g011
Table 1. Soil properties of the study field.
Soil Layer (cm)0–30
Soil color (in dry condition)2.5Y 7/4
Organic matter (g kg−1)10.1
pH in H2O (1:2.5)5.74
pH in KCl (1:2.5)4.84
P2O5 (g kg−1)1.77
K2O (g kg−1)1.05
Clay (g kg−1)205
Fine silt (g kg−1)308
Coarse silt (g kg−1)485
Coarse sand (g kg−1)1.5
Texture classificationLoam
Table 2. Seeding time, harvest time, fertilization and plant protection during three vegetation years.
Vegetation YearSowing
Date
Harvest
Date
FertilizationCrop
Protection
20132 May 2013.8 October 2013.Basic f.—7 November 2012.
Supplement I—28 May 2013.
Supplement II—19 June 2013.
10 May 2013.
201524 April 2015.3 November 2015.Manure f.—21–22 November 2014.
P&K—2 November 2014.
Basic f.—3 March 2014.
Supplement—6 June 2015.
31 May 2015.
201712 April 2017.15 September 2017.Basic f., supplements I and II—5 June 2017.8 May 2017.
Disclaimer/Publisher’s Note: The statements, opinions and data contained in all publications are solely those of the individual author(s) and contributor(s) and not of MDPI and/or the editor(s). MDPI and/or the editor(s) disclaim responsibility for any injury to people or property resulting from any ideas, methods, instructions or products referred to in the content.

