Article

Identification of Water Layer Presence in Paddy Fields Using UAV-Based Visible and Thermal Infrared Imagery

1
State Key Laboratory of Water Resources Engineering and Management, Wuhan University, Wuhan 430072, China
2
Jiangxi Center Station of Irrigation Experiment, Nanchang 330201, China
*
Author to whom correspondence should be addressed.
Agronomy 2023, 13(7), 1932; https://doi.org/10.3390/agronomy13071932
Submission received: 6 June 2023 / Revised: 2 July 2023 / Accepted: 20 July 2023 / Published: 21 July 2023
(This article belongs to the Special Issue Water Saving in Irrigated Agriculture)

Abstract

:
The accurate identification of the water layer condition of paddy fields is a prerequisite for precise water management of paddy fields, which is important for the water-saving irrigation of rice. Until now, the study of unmanned aerial vehicle (UAV) remote sensing data to monitor the moisture condition of field crops has mostly focused on dry crops, and research on the water status of paddy fields has been relatively limited. In this study, visible and thermal infrared images of paddy fields at key growth stages were acquired using a UAV remote sensing platform, and three model input variables were constructed by extracting the color features and temperature features of each field, while K-nearest neighbor (KNN), support vector machine (SVM), random forest (RF), and logistic regression (LR) analysis methods were applied to establish a model for identifying the water layer presence in paddy fields. The results showed that KNN, SVM, and RF performed well in recognizing the presence of water layers in paddy fields; KNN had the best recognition accuracy (89.29%) via algorithm comparison and parameter preference. In terms of model input variables, using multisource remote sensing data led to better results than using thermal or visible images alone, and thermal data was more effective than visible data for identifying the water layer status of rice fields. This study provides a new paradigm for monitoring the water status of rice fields, which will be key to the precision irrigation of paddy fields in large regions in the future.

1. Introduction

The inefficient irrigation of paddy fields has resulted in water resource waste and exacerbated water shortage problems in China [1]. Rice is cultivated under continuous flooding conditions, which require large amounts of water. A water-saving method that has been developed for rice cultivation is the practice of alternate wetting and drying (AWD) irrigation, which is applied to the field a number of days after the disappearance of ponded water [2]. Therefore, monitoring ponded water status on a large scale in a timely and accurate manner is essential for irrigation decision making in paddy fields. However, manually observing the water layer condition of every rice field is extremely time consuming and labor intensive, and even more impractical for large regional farms. Remote sensing technology has been widely used for moisture information monitoring in cropland because of its high efficiency and accuracy [3,4,5].
Based on the platform sensing distance, remote sensing can be classified as follows: satellite remote sensing platforms, unmanned aerial vehicle (UAV) remote sensing platforms, and near-grounded remote sensing platforms. Satellite remote sensing platforms have been applied extensively to monitor crop moisture information [6,7,8], biomass [9], cover [10], evapotranspiration [11], and crop classification [12,13] in large areas. However, the data products derived from satellite remote sensing platforms suffer from excessive reliance on weather conditions. Moreover, both temporal and spatial resolutions of these data products are inadequate for meeting the operational demands of modern precision agriculture (field scale) [14,15]. The near-grounded remote sensing platform, employing portable sensors for farmland information retrieval, exhibits the advantages of timeliness and high resolution yet suffers from the limitation of spatial scale due to the reliance on independent point data [16]. The accurate, convenient, and flexible operation of UAV remote sensing does not suffer the disadvantages of ground remote sensing and satellite remote sensing platforms. UAVs can carry multiple types of sensors simultaneously, such as thermal infrared cameras, visible light, and multispectral and hyperspectral cameras, thus providing a new way to obtain crop canopy information quickly and accurately [17,18,19]. In recent years, UAV remote sensing has been widely used in cropland moisture information monitoring [20,21,22], providing key data for precision cropland management by establishing the relationship between crop canopy temperature and spectral information extracted from UAV-based platforms and farmland moisture conditions.
Canopy temperature is considered to be closely related to the moisture status of agricultural crops [23,24] and can be effectively used for monitoring the moisture information of croplands. Peng et al. [25] diagnosed rice water deficits by studying the variation pattern of canopy temperature differences. Bian et al. [26] assessed the water status of cotton based on the crop water stress index extracted from UAV images. Zhang et al. [27] used a UAV remote sensing platform to monitor soil moisture in field maize and showed that water-deficient crops have higher reflectance than healthy crops in the same growth period. The above studies showed that UAV remote sensing has great potential for monitoring the water status of field crops. The conditions of paddy fields during the reproductive period alternate frequently between wet and dry, and the water layer remains relatively thin even in the flooded irrigation model, making it more difficult to directly estimate the soil water content of rice or invert the depth of the water layer in paddy fields. Some studies have shown that the number of days of water breaks in paddy fields can be used as an indicator for rice drought forecasting [28]; this information is important for guiding rice irrigation decisions if the presence or absence of a water layer in paddy fields can be detected in a timely and accurate manner and combined with field moisture forecasting models.
The identification of water layers in paddy fields can be described as a “binary classification” problem. With the development of artificial intelligence, many researchers have used various machine-learning algorithms for classification tasks, including back propagation neural networks (BPNN) [29], random forests (RF) [30], support vector machines (SVM) [31,32], and K-nearest neighbor (KNN) [33]. However, each of these algorithms has its own advantages and disadvantages, and there is an urgent need to find an accurate and rapid method for assessing the paddy layer.
The objective of this study is to explore a systematical method for identifying rice paddy water information by utilizing multi-source UAV remote sensing data and machine-learning algorithms. To this end, in this study, we collected information on paddy water layer conditions and UAV remote sensing image data during the rice growth period, selected four classical machine-learning algorithms, combined multiple model input variables to test the effects of different input variables on the model accuracy, and compared and analyzed the applicability of different machine-learning algorithms to the water layer identification problem to achieve a fast and accurate identification of paddy water layer conditions to provide input for rice irrigation decision making.

2. Materials and Methods

Field experiments were conducted in Nanchang County, Jiangxi Province, China (Figure 1), in the Poyang Lake basin, which has a typical subtropical monsoon climate. The area has sufficient water and heat conditions, with an average annual sunshine of 1720 h, an average annual temperature between 17 and 18 °C, and an average annual precipitation of 1662.5 mm. The soil in the area is paddy soil with a clay loam texture and a saturated water content of 49% [34]. The rice cultivation pattern in the test area was a typical double-season rice.

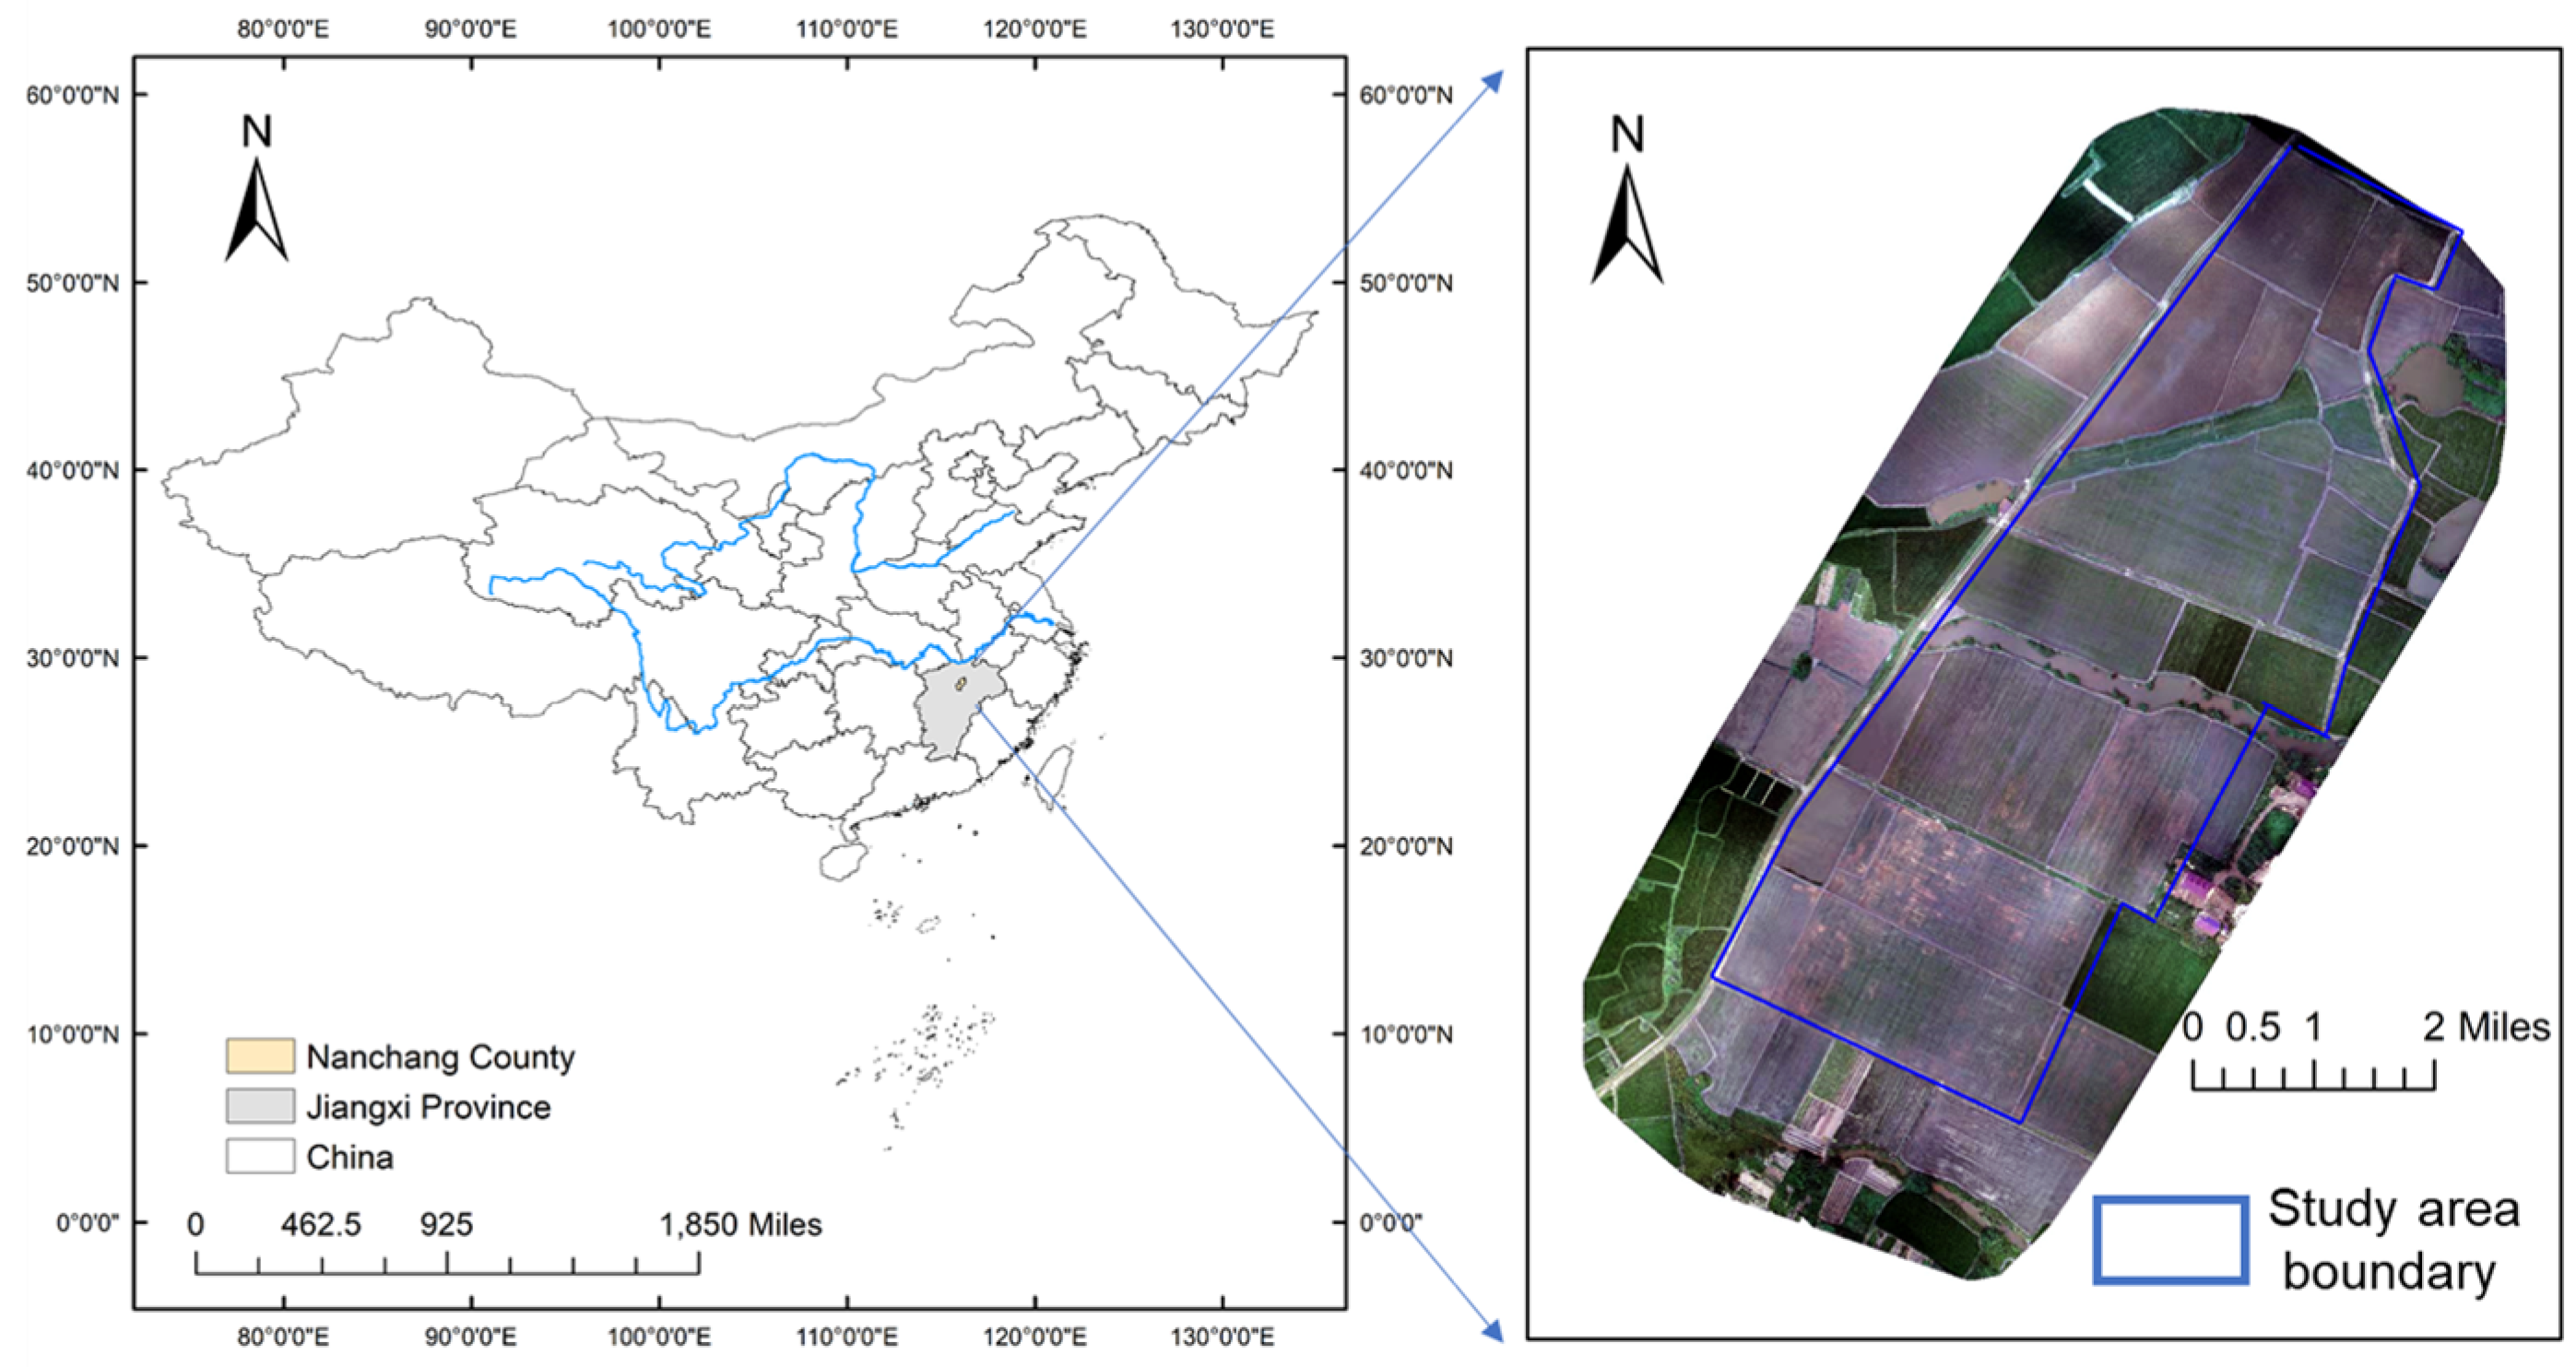
2.1. Experimental Design and Data Collection

2.1.1. Experimental Design

All the study areas were located on the farmland of local farmers, and the irrigation and agronomic management were conducted by them. The rice growth period was from late July to late October 2021, and the study area is 8.3 ha, with 24 fields. The irrigation methods were continuous flooding. Except for the mid-season drainage period and the last week before harvest, the field water level was controlled from 5 mm to 50 mm. Due to the insufficient supply of irrigation water, occasionally, there is no water layer in the rice fields.

2.1.2. UAV Thermal Infrared and Visible Imagery Acquisition

The UAV platform used is called DJI M600Pro, produced by Dajiang (Shenzhen Dajiang Innovation Technology Co., Ltd., Shenzhen, China), which is equipped with the DJI ZENMUSE XT 2 camera (Shenzhen Dajiang Innovation Technology Co., Ltd., Shenzhen, China) containing two sensors (Figure 2), the FLIR thermal imaging camera and the visible camera, and the main technical parameters of the ZENMUSE XT 2 are shown in Table 1.
The images were collected on smartphones using the UAV and ZENMUSE XT 2 camera with DJI Pilot. The weather during the remote sensing image acquisition was clear and windless, the acquisition time was 13:00 to 15:00 Beijing time, the UAV flight mode was according to the planned route, and the single flight time was approximately 45 min. When taking photos, the camera lens was 90° to the ground. The photo mode was equal in time interval, the image overlap rate was set to more than 80% on and between the main routes, and the flight altitude was set to 100 m after several test flights. A total of 16 flights were carried out during the whole growth season of rice, covering all the growth stages, and approximately 990 thermal and visible images were collected per flight.

2.2. Extraction of Feature Values Derived from UAV Images

2.2.1. Temperature Features

The temperature of each field during the experiment was extracted using FLIR Thermal studio v1.8.2, and the temperature feature was presented using the average temperature of every pixel in the interest, as shown in Equation (1).
Tem = i = 1 N T i N
where N was the total number of pixels in a paddy field image, and T i was the temperature of i t h   pixel in a paddy field image.
A reference whiteboard and blackboard were set up on the ground to calibrate the temperature of the thermal infrared images during flight. The temperatures of the blackboard and whiteboard were determined simultaneously using a handheld infrared thermometer during the collection of thermal infrared images with the UAV. To determine the temperatures of the black and white boards, the handheld thermal infrared thermometer scanned the white and black boards vertically, and each board was measured three times separately. The average value was used to summarize the temperature of the reference black and white boards for that test. Figure 3 shows the calibration equation used to establish the calibration relationship between the image temperature and the measured temperature, and the real temperature of the calibrated field can be obtained by substituting the temperature extracted from the thermal infrared image into the relationship equation.
Rice requires the presence of a water layer during the regreening stage, while paddy fields at the late tiller stage are generally treated with field sunning (without water layer). To analyze temperature features of paddy field under different water statuses, the typical days corresponding to the tillering stage (16 August 2021), the booting stage (3 September 2021), the heading stage (18 September 2021), and the milk-ripe stage (23 September 2021) were selected for this study.

2.2.2. Color Features

The steps for extracting the digital number (DN) of the red, green, blue (RGB) of the field are as follows: (1) load the visible image of the field using ENVI 5.1; (2) select “Compute Statistics” in the “Statistics” module in Toolbox (2) run the “Compute Statistics” function module in Toolbox in the middle of the field 1000 × 1000 pixels size of the field to calculate the average value of RGB-DN of the area.
Since chlorophyll is primarily associated with green plants, chlorophyll molecules absorb light at specific wavelengths (red and blue) with a reflection peak in the green channel. The G value, which represents the intensity of the green color, is greater than the R and B values. For the above reasons, red (r), green (g), blue (b), and excess green index (ExG) characteristics were extracted from visible images, and the above equations are shown in Equations. ExG has been widely used and cited in field water monitoring and crop growth evaluation [35,36].
r = R R + G + B
g = G R + G + B
b = B R + G + B
ExG = 2 × g r b

2.3. Machine-Learning Algorithms Used

In this study, KNN, SVM, RF, and LR were used to identify the rice paddy water layer, and the following is a description of the basic principles of the four machine-learning algorithms.
KNN is a widely used classification algorithm in data mining. It calculates the distance between an unknown sample and all known samples to determine its class. The K nearest samples with the closest distance are selected, and the unknown sample is classified based on the minority-voting rule [37].
SVM is a machine-learning method that minimizes structural risk. It can handle both linear and nonlinear barriers for efficient generalized classification. SVM is commonly used in image recognition and classification [38]. The accuracy of SVM is determined using the penalty coefficient c and the kernel function’s parameters gamma. In this study, we searched for the best parameters using cross-validation and grid search [39] to build a high-accuracy paddy field water layer recognition model.
RF is an integrated learning algorithm that combines bagging and decision tree algorithms. It has been applied in remote sensing technology [40]. The RF algorithm consists of three steps: constructing multiple training sets using bootstrap method, self-sampling the data, and constructing decision trees for new datasets. The mathematical model of random forest is formulated as follows:
f R F x = 1 N t = 0 T h x ; a t
where N is the number of regression tree models.
LR is a nonlinear statistical regression algorithm used for binary dependent variables. It predicts discrete values using a logit function based on known independent variables. LR provides a simple form, better interpretability, and fast training, allowing testing of multiple models in a short time [41].
The parameter variables of the four machine-learning algorithms are shown in Table 2. The default parameters were used for the LR algorithm parameters. To find the optimal hyperparameter value for model generalization performance, the hyperparameters of the other three algorithmic models were selected subjectively, and to achieve better model prediction, we used the grid search method with K-fold cross-validation to select better algorithmic parameters to improve the accuracy of the tested models. The above four machine-learning algorithms were conducted in Python 3.9 using Scikit-learn, a popular open-source library that provides various algorithms and tools for classification.

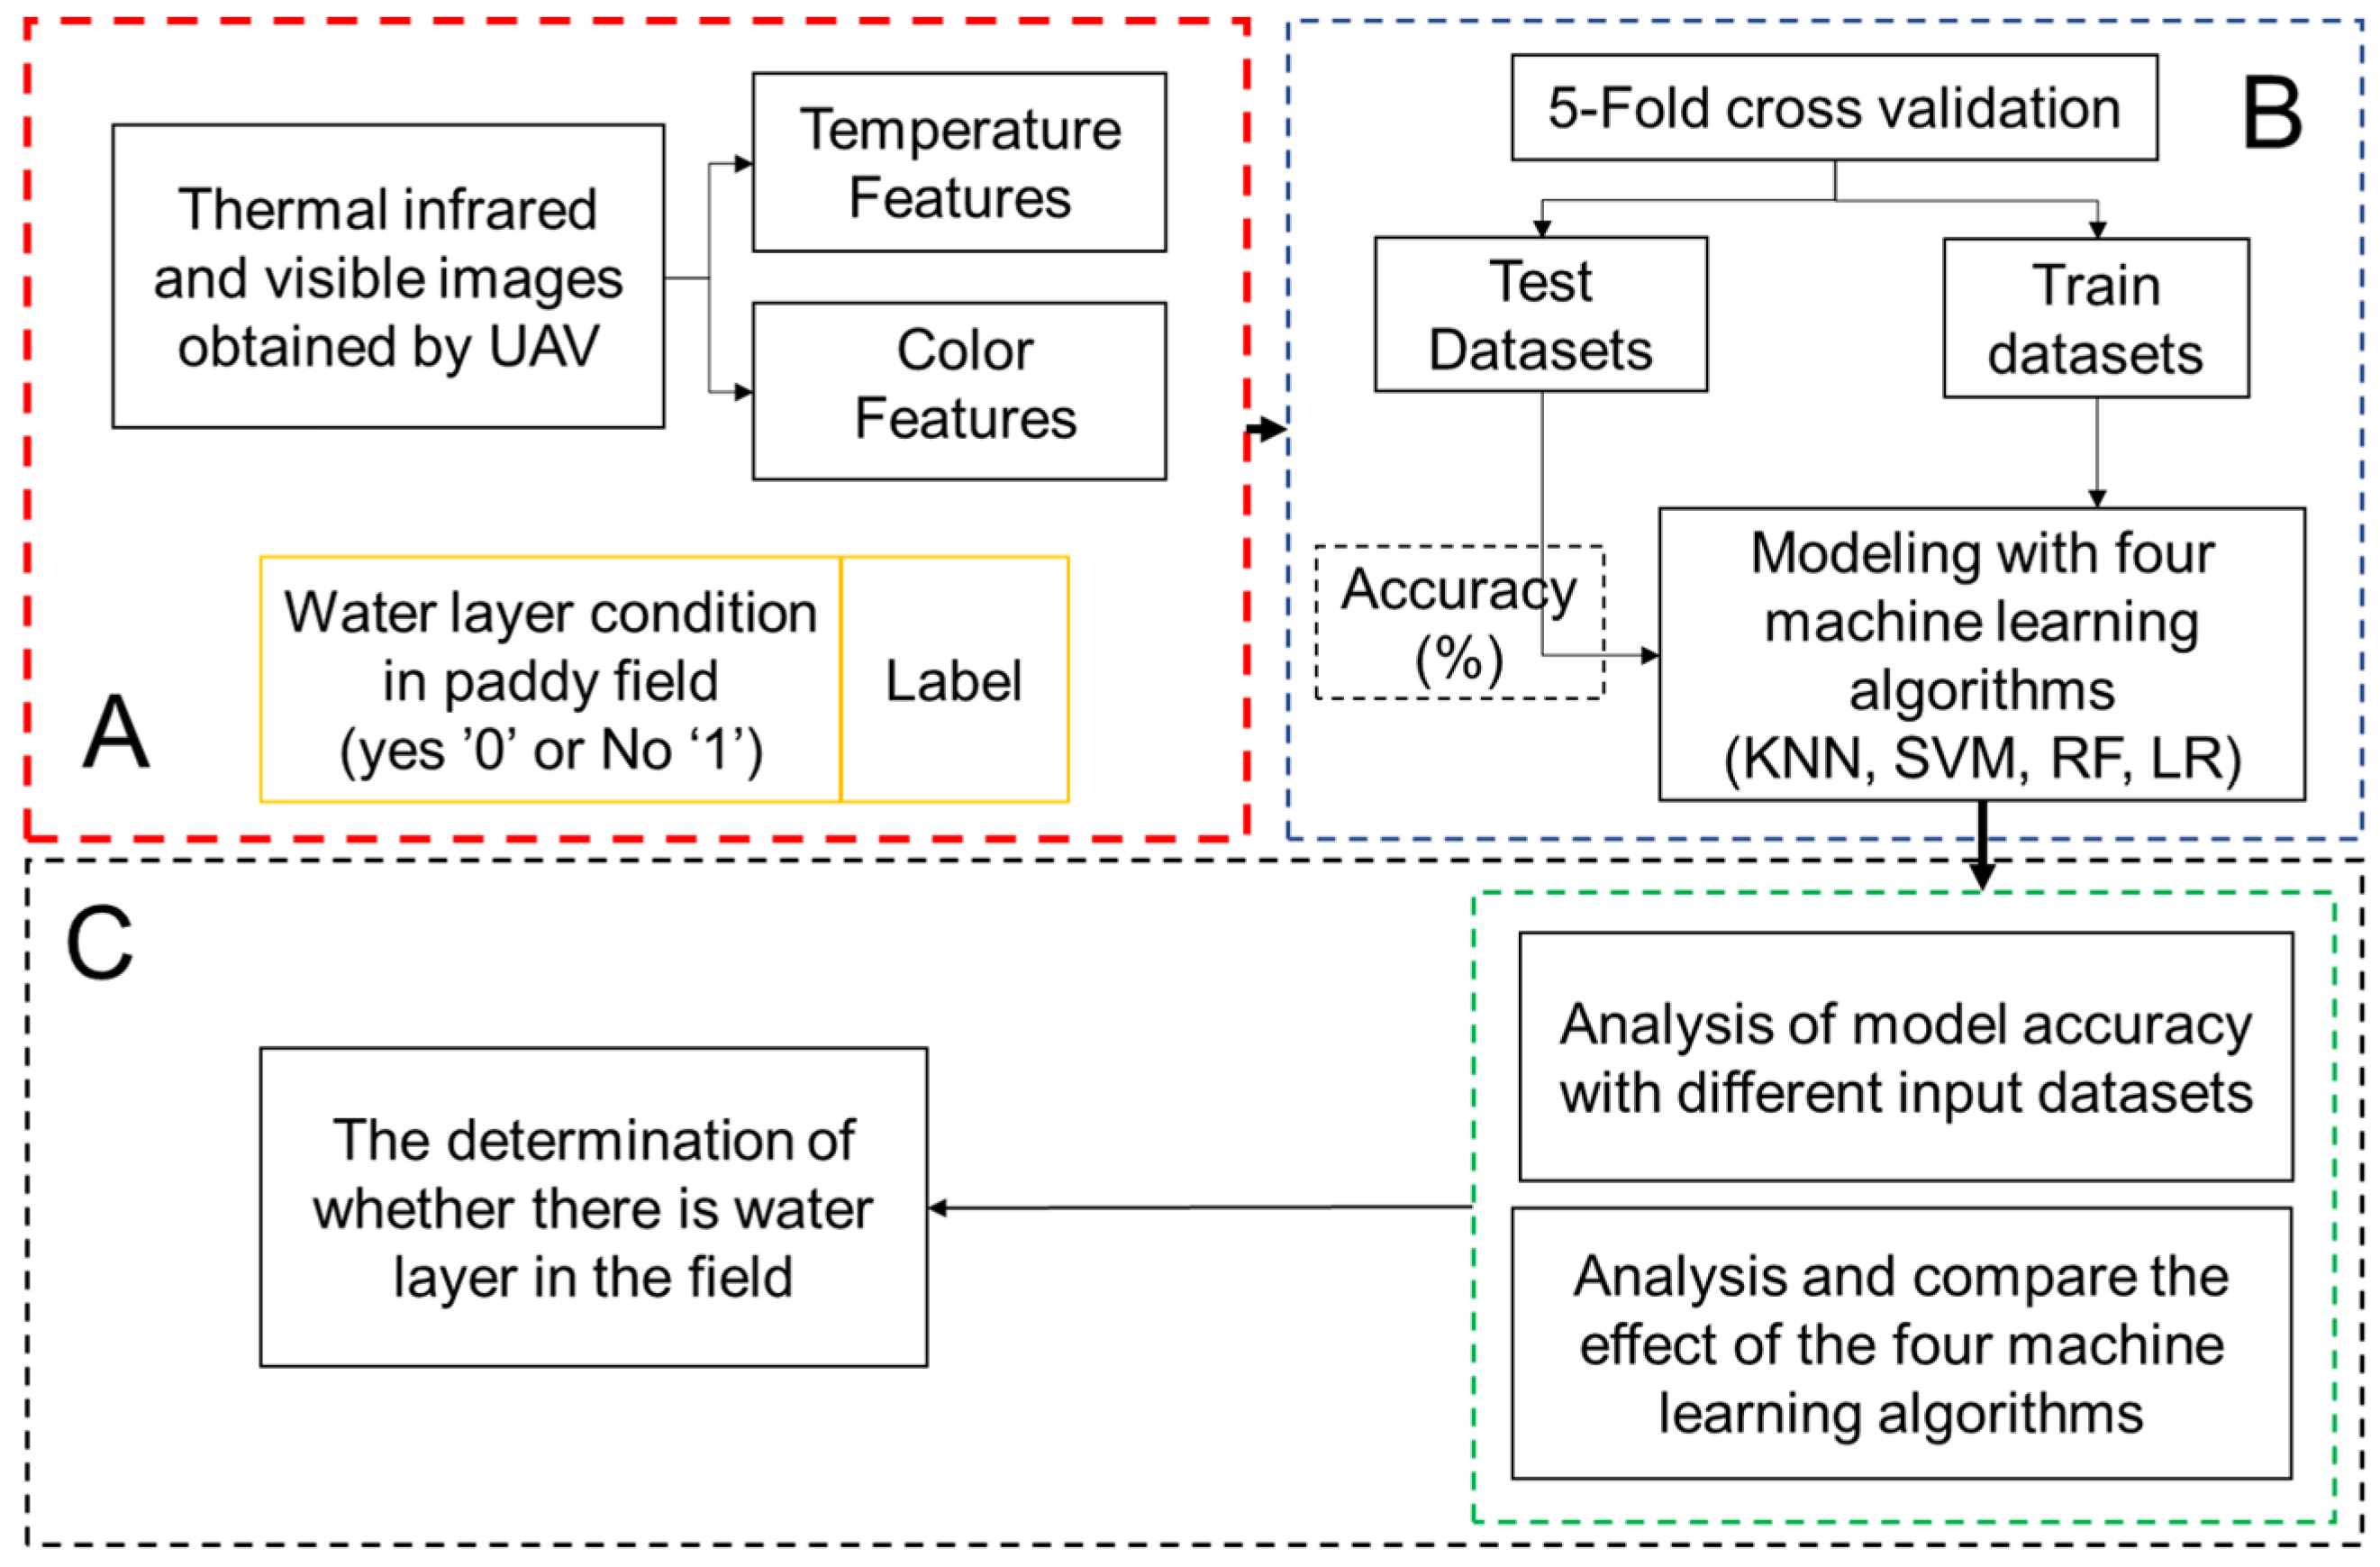
2.4. Construction of the Water Layer Identification Model and Performance Evaluation

2.4.1. Model Construction

To test the effect of the temperature and color features on the water layer identification model, the model input variables were divided into three groups, as shown in Table 3. G1 represents the temperature feature variables, G2 represents the color feature variables, and G3 represents all the variables.
Figure 4 shows the flow chart of the proposed method. This study is divided into three parts: (A) the collection and preprocessing of experimental data (water-layer fields are labeled “1” and no-water-layer fields are labeled “0”); (B) constructing the three sets of model input variables (as shown in Table 3) and water layer identification models based on four machine-learning algorithms (KNN, SVM, RF, and LR) using a 5-fold cross-validation method to analyze the training and validation sets while using Grid Search to optimize the parameters of the four machine-learning algorithms; (C) evaluation of model performance, considering different machine-learning algorithms with different sets of model input variables and identifying the model with the best recognition accuracy.

2.4.2. Model Performance Evaluation

Since the identification of water layers in paddy fields can be described as a “binary classification”, confusion matrix can be used to generate performance indicators for model evaluation, such as Accuracy, Recall, Precision, and f_score. Accuracy is a metric that quantifies the ability of a model to make correct predictions. It is computed by dividing the sum of accurately predicted instances (true positives and true negatives) by the total number of predictions (Equation (7)) [42].
Accuracy = T P + T N T P + T N + F N + F P  
According to Savoy et al. [43], Precision (Equation (8)) refers to the proportion of identifications that are correct, and Recall (Equation (9)) refers to the proportion of true positives identified correctly, and f_score (Equation (10)) is a harmonic mean that represents the balance the model’s sensitivity and precision.
Precision = T P T P + F P
Recall = T P T P + F N
f score = 2 × P r e c i s i o n × R e c a l l P r e c i s i o n + R e c a l l

3. Results and Discussion

3.1. Analysis of Temperature Features

Figure 5 shows box lines and normal plots of temperature distributions in paddy fields for the four key growing stages. When rice is in the pre-fertility period, the vegetation cover is less than 100%, and the acquired UAV thermal images are a mixture of soil background or water layer background and rice canopy. In addition, because the soil background temperature is higher than the water surface temperature in the same period and when there is no water layer in the early stage of crop fertility, if there is a water deficit at this time, the transpiration rate of rice decreases, and the leaf temperature also increases [44], When thermal images of rice fields without a water layer are acquired at noon, the extracted mixed image element temperature of fields without a water layer will be higher than that in the condition of a water layer. When the ground is completely covered by rice, the thermal infrared image is obtained only for the rice canopy layer, and the temperature of the rice field without a water layer is greater than that with a water layer because the transpiration rate of rice decreases at this time.
The typical days of the four fertility periods have different degrees of crossover in temperature distributions, and it is difficult to use a temperature threshold to determine the presence of a water layer in a paddy field during a specific growth stage.

3.2. Analysis of Color Features

Figure 6 shows the color features of visible images of the with-water-layer and no-water-layer paddy fields at different key stages of rice growth, including the tillering, booting, heading, and milk-ripe stages.
In the four key growth stages of rice, the fields without and with a water layer showed similar variability in the color features, and the values of color features in the no-water-layer fields were all higher than those in the with-water-layer fields. This is because water is a necessary substance for plant photosynthesis, and sufficient water can maintain the normal physiological activities of plants, thereby increasing the greenness and reflectance of plant leaves. In contrast, water-deficient plants will experience physiological drought, leading to leaf dehydration and yellowing and reducing reflectance. Therefore, the DN of the visible spectral range in the rice canopy with a water-layer field is higher [45]. The ExG index has been used to describe the color features of green plants [46]. Our results showed that the no-water-layer field had a larger ExG value than the with-water-layer field, suggesting that ExG could be a useful index for recognizing the status of the water layer in paddy fields.
However, we found that the R, G, B, and ExG of with-water-layer and no-water-layer paddy fields were different to some extent with overlapping areas, which may cause inevitable recognition errors.
Studies have shown that rice is more sensitive to water demand during the booting and heading stages [47]. As shown in Figure 6, the color features of the rice canopy are more responsive to water in the visible region. Compared with RGB color features, ExG can be used to distinguish the field water state more effectively. However, when the rice entered the milk ripening stage, the sensitivity of rice to water decreased, the response of the color features of the rice canopy decreased in the water layer, and the difference in the four-color features was not obvious.
After the above analysis, either the temperature data of paddy fields extracted based on thermal images or the DN data of RGB of paddy fields extracted based on visible cameras respond to the corresponding law according to the water layer state of paddy fields, providing theoretical support for the identification of the water layer of paddy fields.

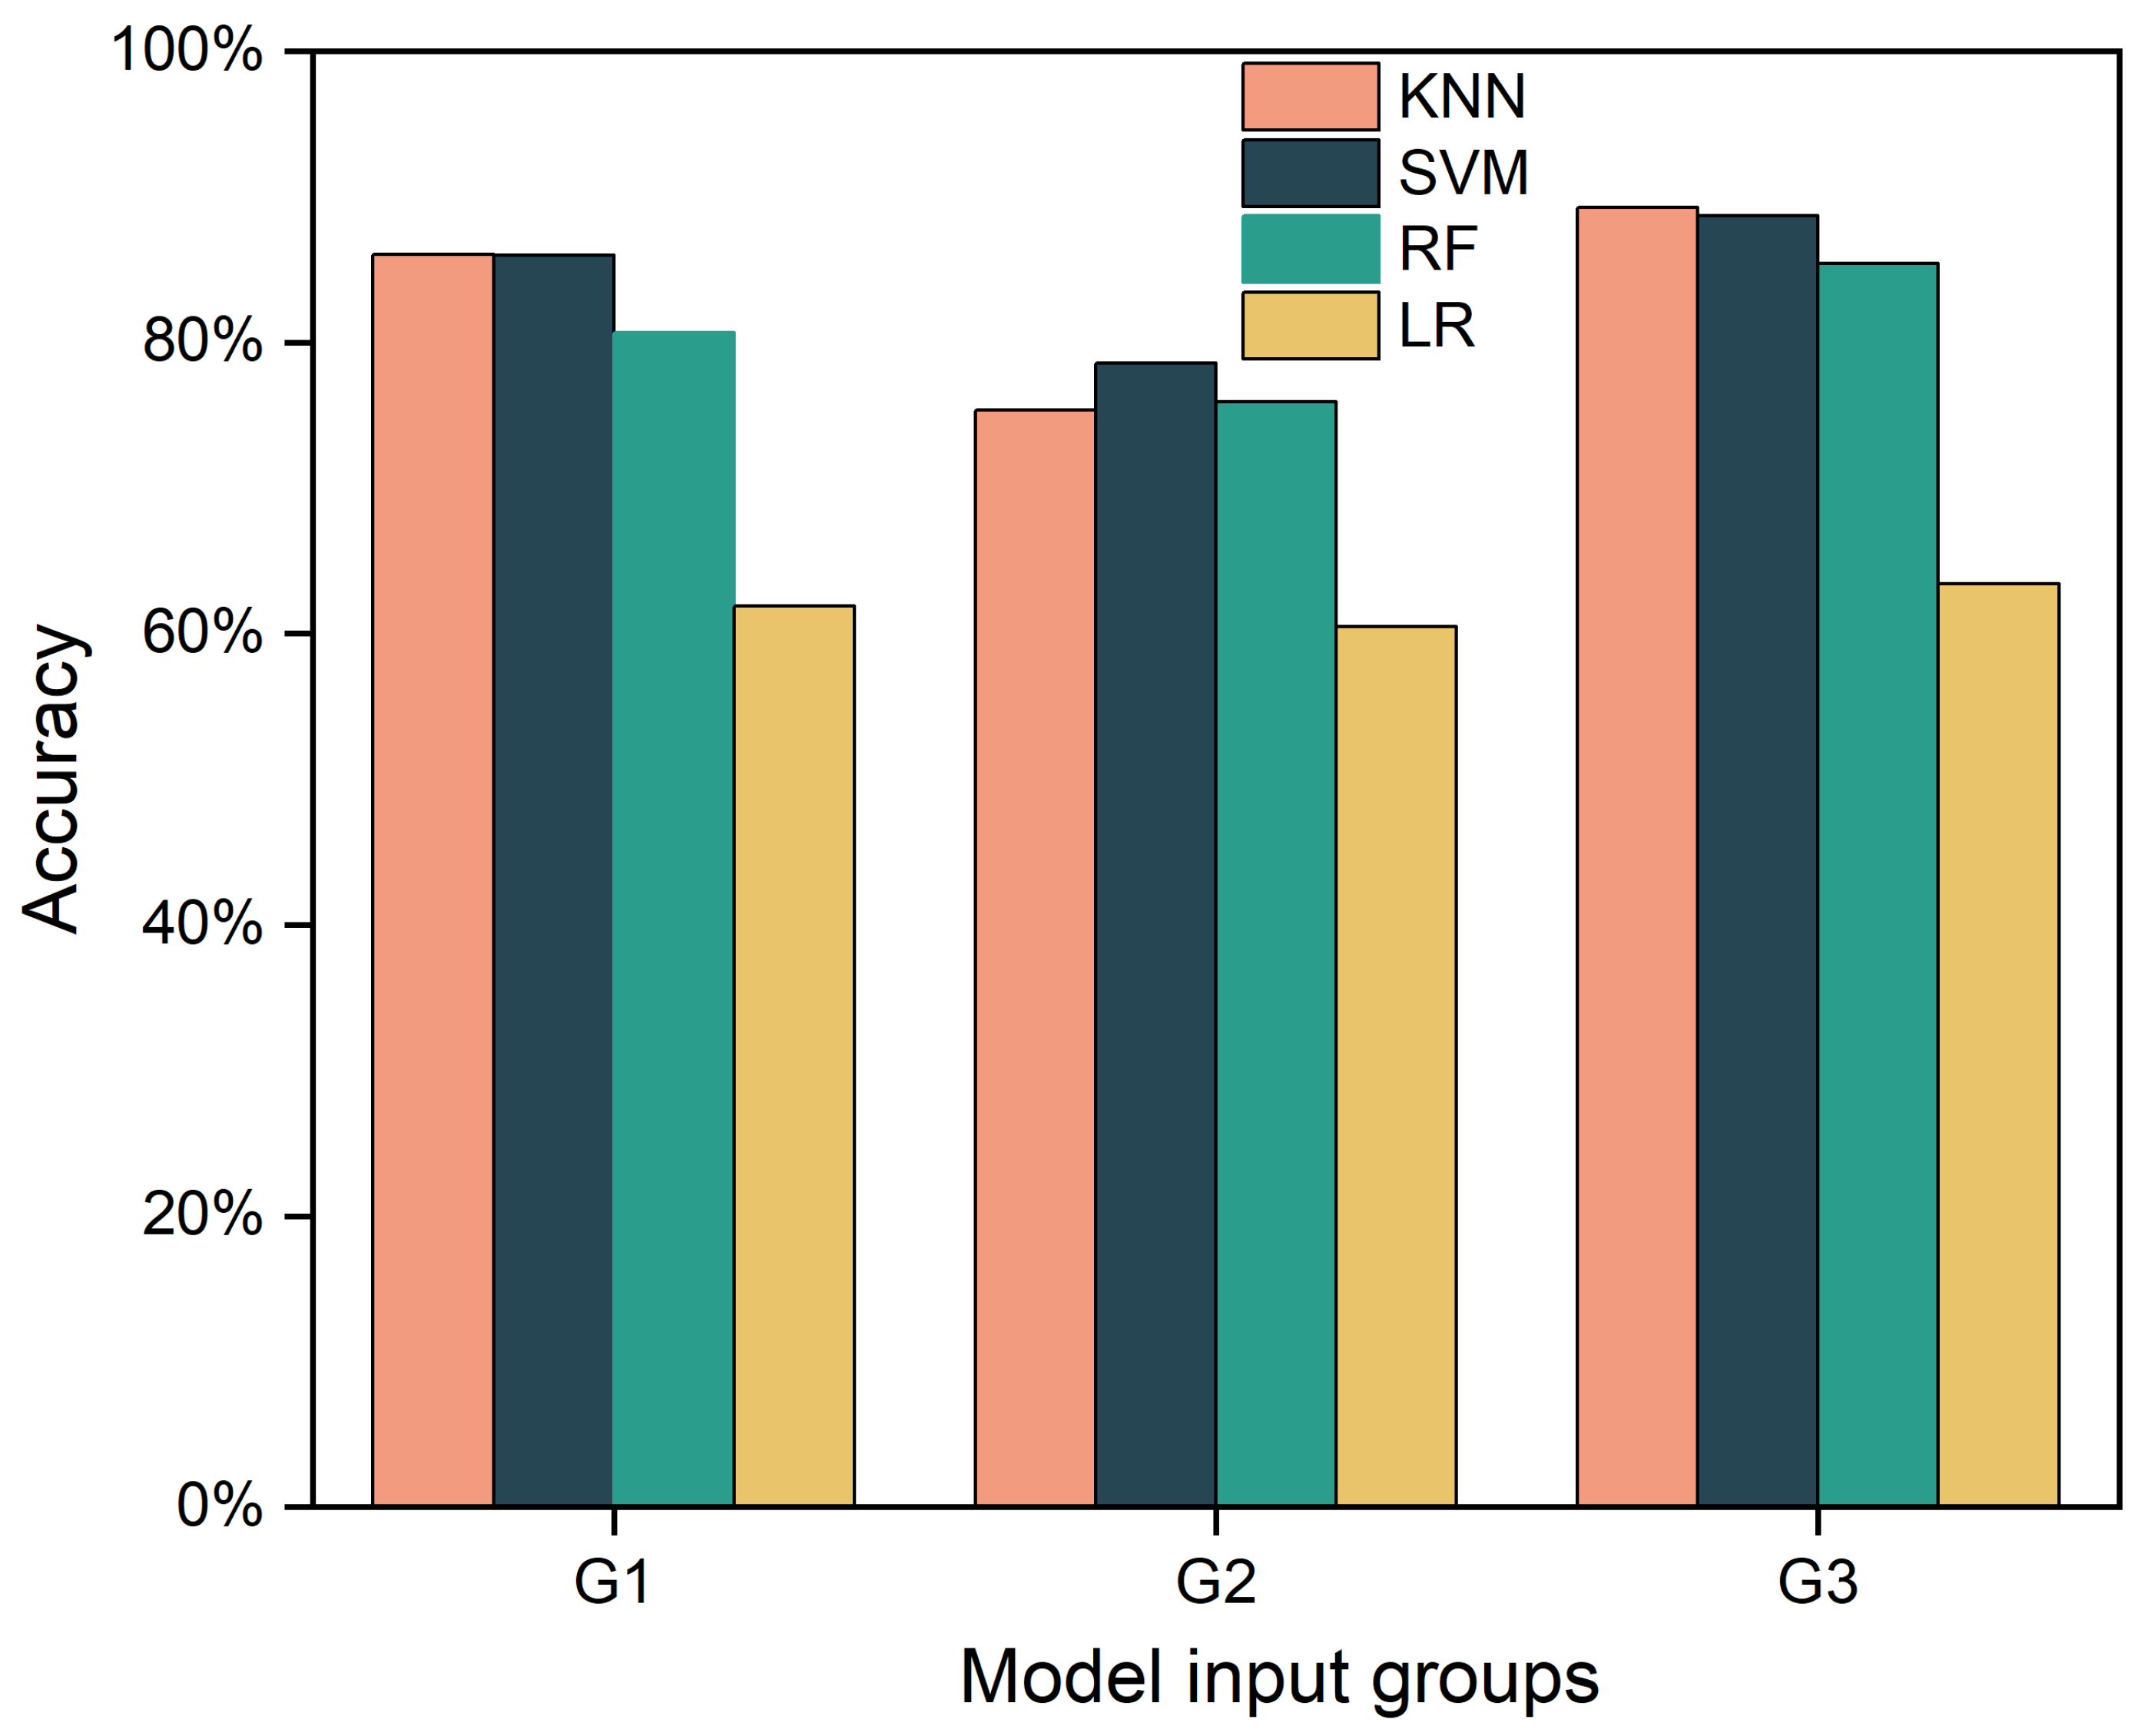
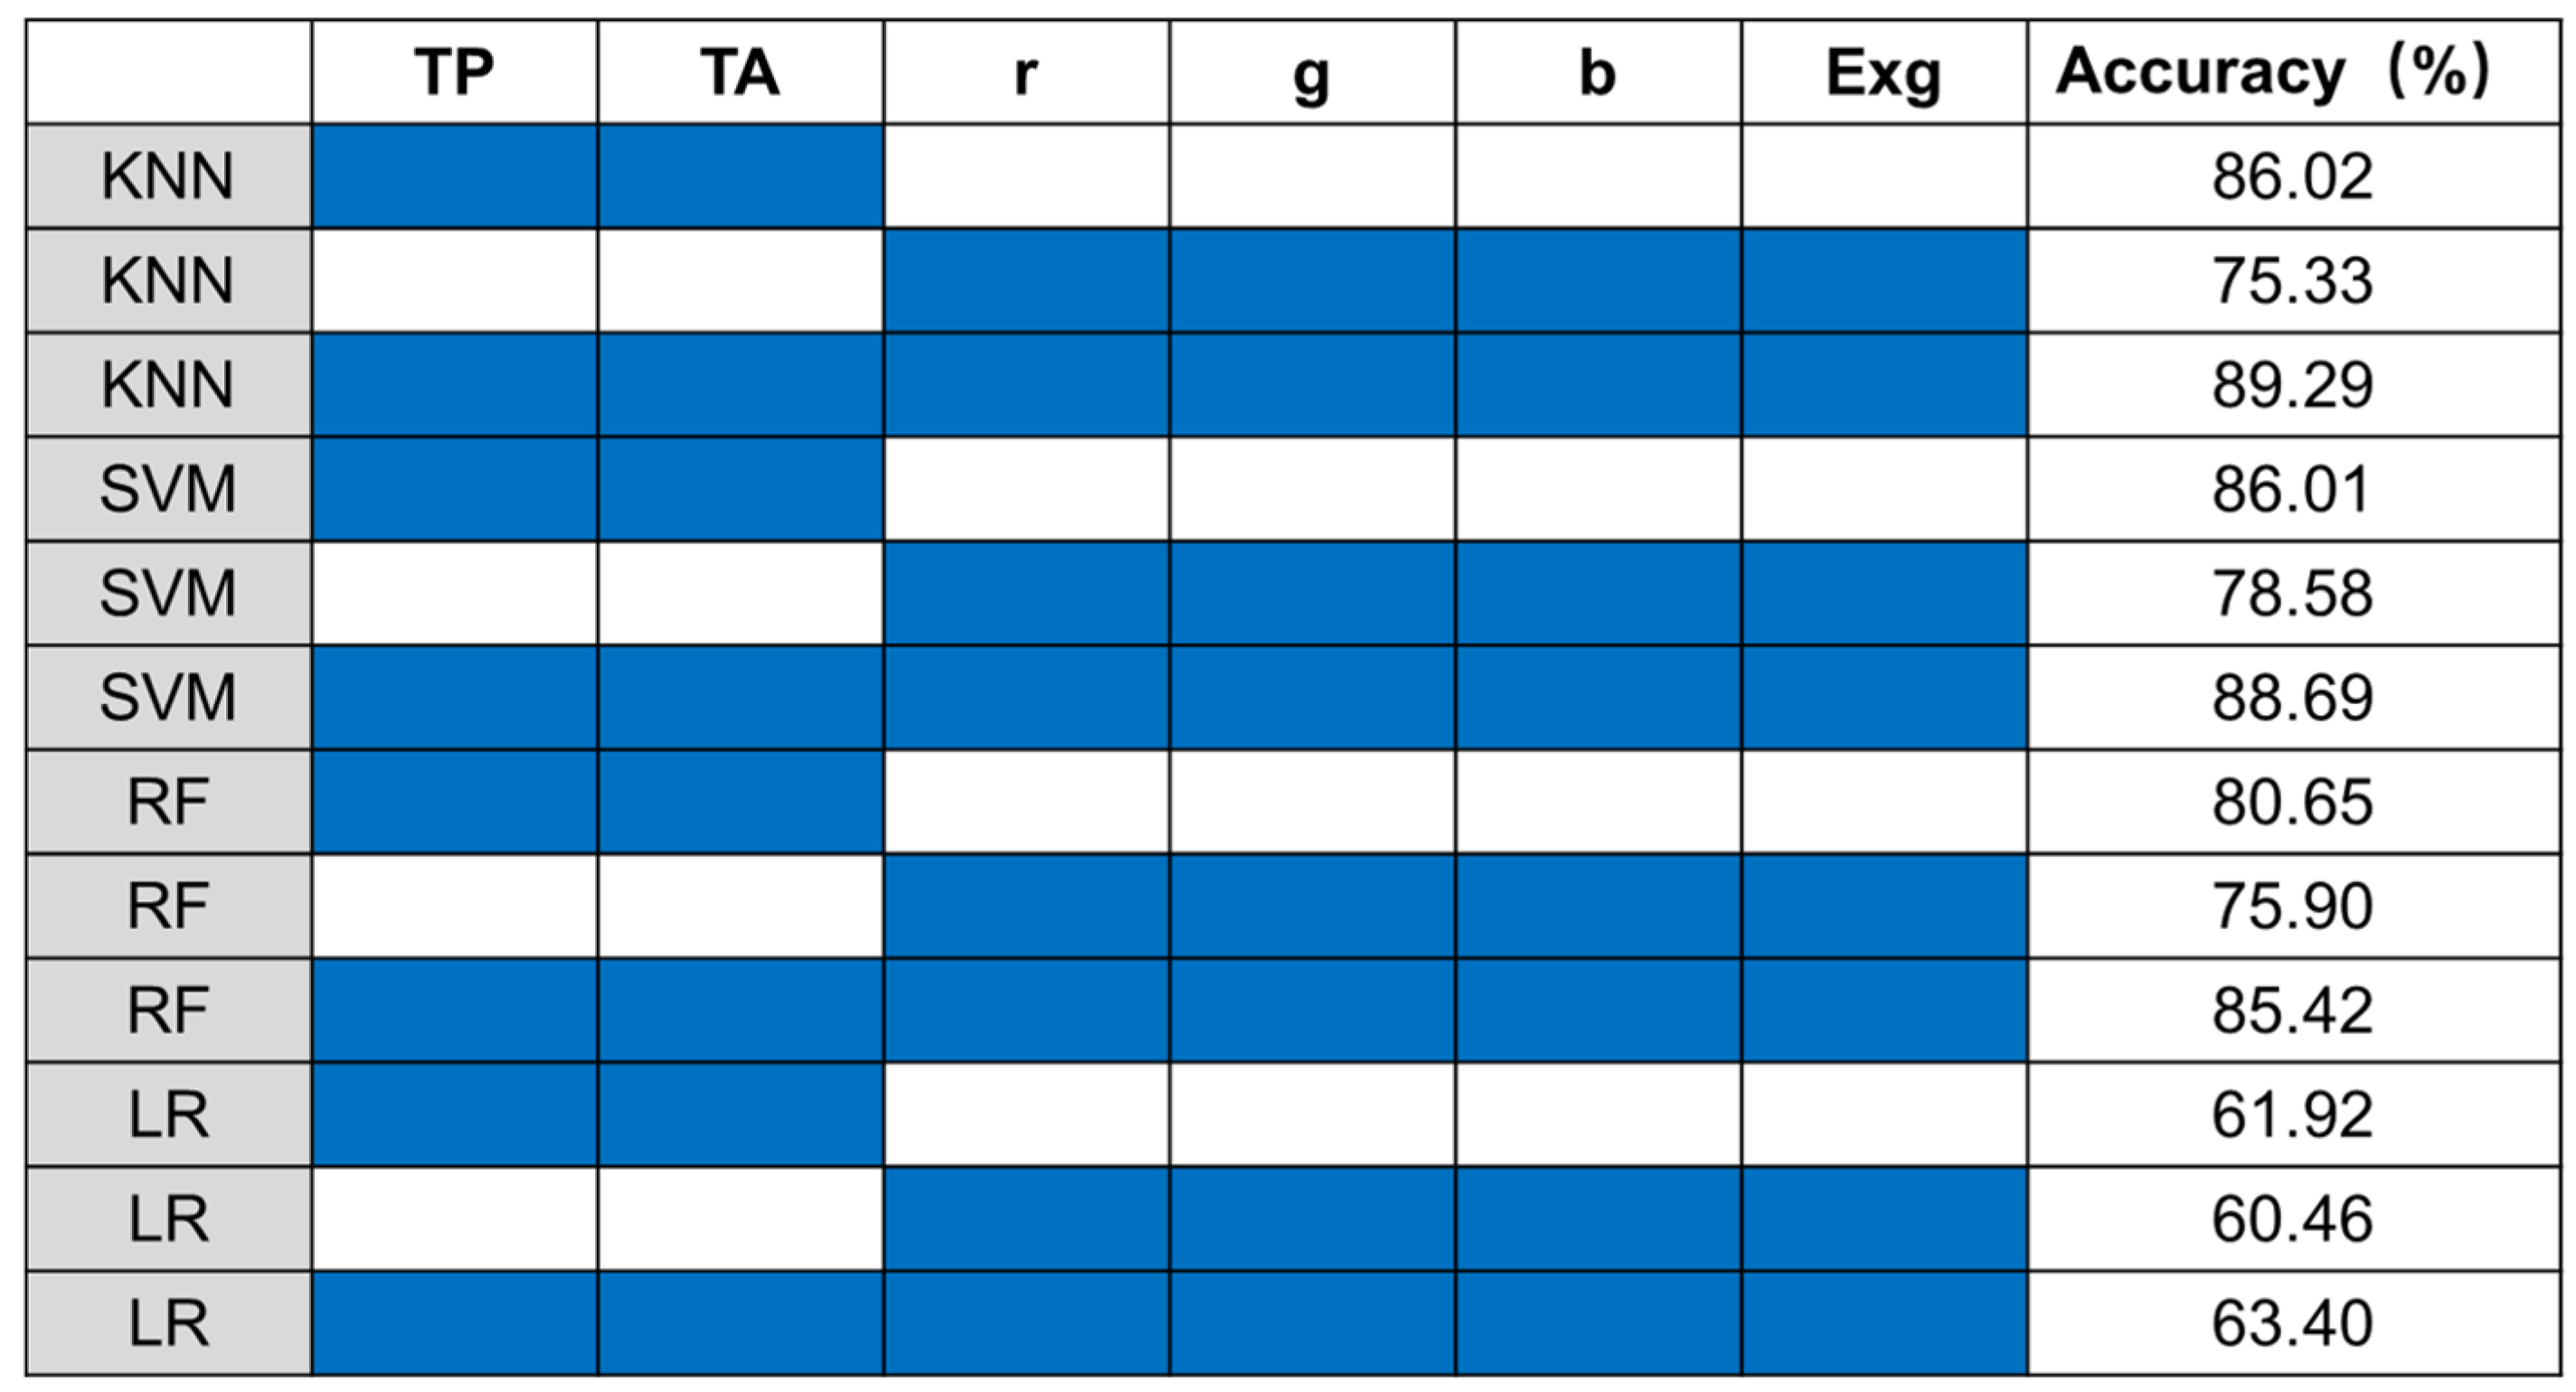
3.3. Comparative Analysis of Rice Paddy Water Layer Identification Models

The three variable groups delineated in Section 2.4 were used as model input variables to build a model based on KNN, SVM, RF, and LR algorithms for rice paddy water layer identification and to validate the model for accuracy.

3.3.1. Water Layer Identification Model Based on KNN

During the KNN model testing, the parameter search was performed for the hyperparameters K in the range of (1100) using the grid search method with five-fold cross-validation, and the tuning is shown in Figure 7.
As seen from Figure 7, the model recognition accuracy based on the three variable groups in the range of (1100) showed a trend of rapidly increasing and then decreasing for all the parameters K. In the parameter search process, the highest accuracy of the KNN model constructed using the three model input variable groups was 86.02%, 75.33%, and 89.29%, which were achieved at k = 11, 1, and 7, respectively; meanwhile, the accuracy of this algorithm was very sensitive to the change in the parameter K. The three algorithms’ accuracy rates basically showed similar trends with the variation of K for different sets of input variables.

3.3.2. Water Layer Identification Model Based on SVM

During SVM model testing, the grid search method was used to set the parameters of the SVM algorithm, combined with five-fold cross-validation. The kernel function was used with the “rbf” function with two key parameters and a range of (0, 10), and the parameter search process is shown in Figure 8.
In the parameter search process, the SVM models constructed based on G1, G2, and G3 achieved the highest accuracy rates of 86.01%, 78.58%, and 88.69% when the values of the parameters were (9.8, 6.7), (9.8, 6.4), and (2.5, 8.1), respectively. The use of the “rbf” kernel function instead of nonlinear mapping in high-dimensional space led to satisfactory accuracy based on all three model input variables, indicating that the SVM algorithm can better handle small sample data while maintaining good “robustness”.

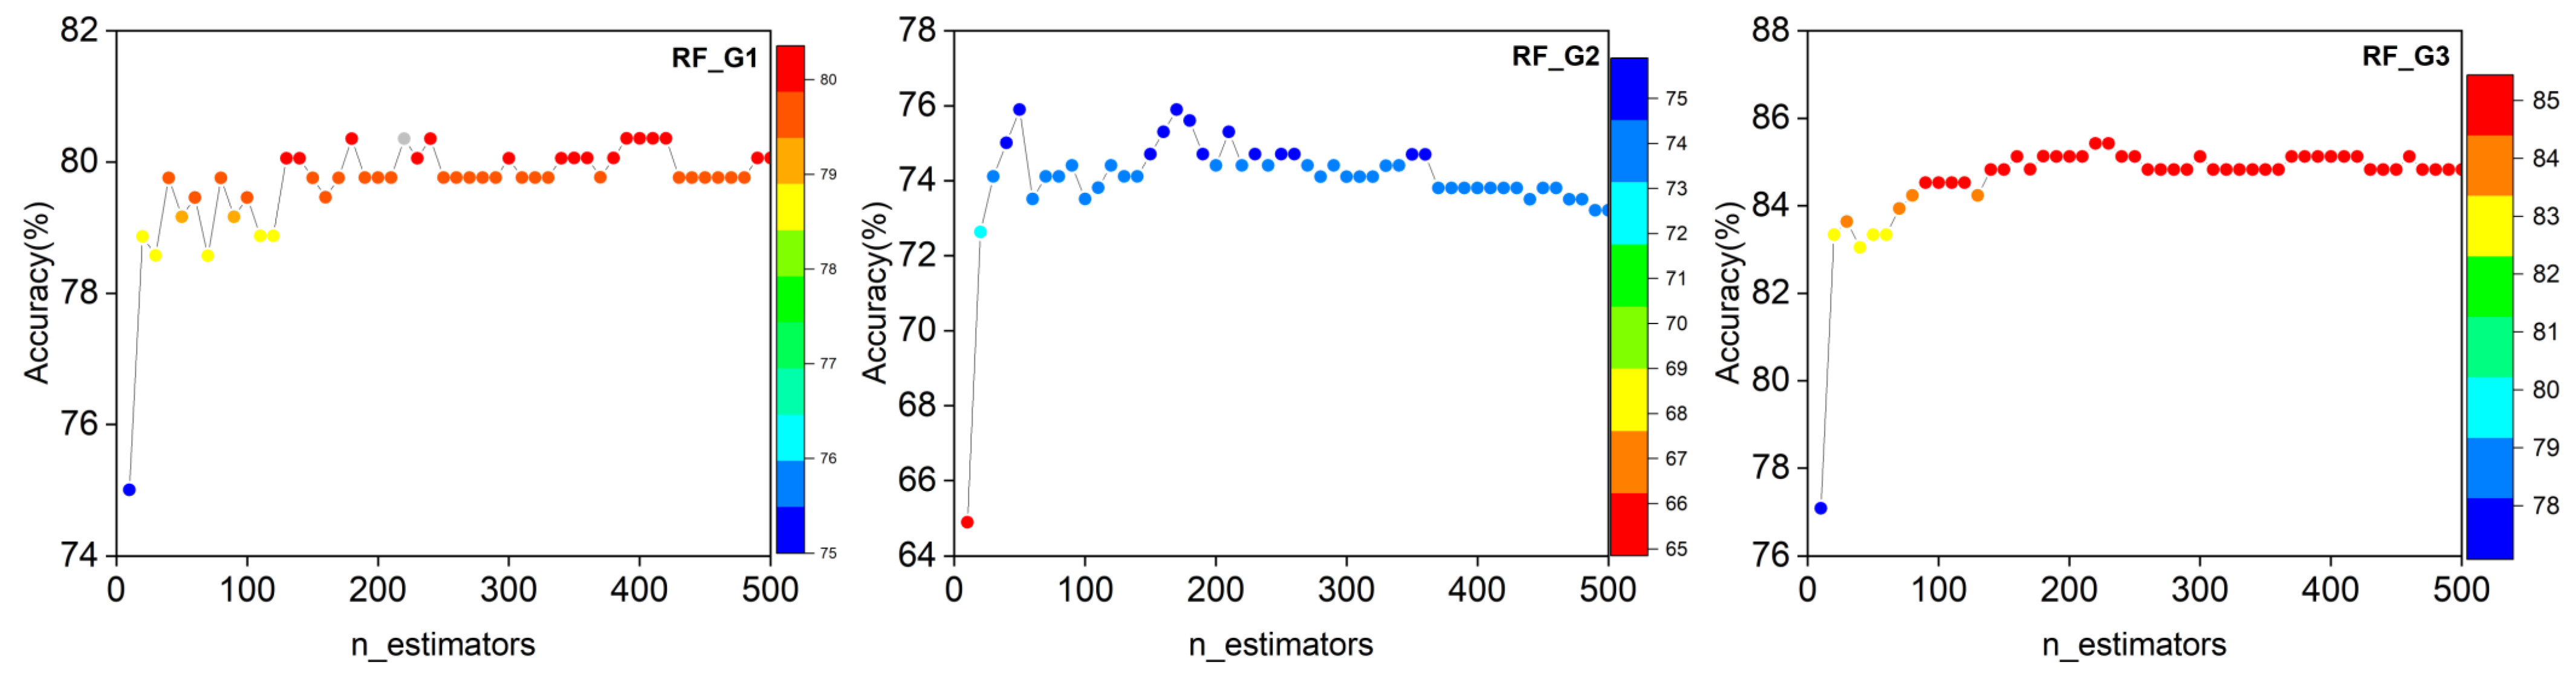
3.3.3. Water Layer Identification Model Based on RF

During RF model testing, the number of decision trees in the range of n_estimators (1, 500) was used for parameter optimization using the grid search method with five-fold cross-validation, and the optimization process is shown in Figure 9.
In the parameter search process, the highest accuracies of the RF models constructed based on G1, G2, and G3 were 80.65%, 75.90%, and 85.42%, respectively, when the parameter n_estimators were taken as 220, 170, and 215, respectively. In the parameter search process, the accuracy of water layer identification showed a trend of first improving; then, the trend of the accuracy change based on the three model input variable groups was basically the same.

3.3.4. Water Layer Identification Model Based on LR

During model testing, the highest accuracy of the LR model constructed with the three model input variable sets was 61.92%, 60.46%, and 63.40%, using the default parameters for the model parameters. Compared with the other three algorithmic models, this model had the lowest accuracy, although it was faster in training, consumed less memory, and was simple and easy to understand. Studies have shown that rice canopy temperature and color features have a complex relationship with paddy water content [48,49]; the decision surface of logistics is linear, and it is difficult to subclassify and fit the true distribution of the data, so the LR algorithm does not show significant advantages for paddy water layer identification.
From the parameter search process, most of the above models were able to achieve a more desirable recognition accuracy. The model accuracy is sensitive to the choice of parameters, so it is necessary to adjust the model parameters for optimization, and the K-fold cross-validation combined with the grid search method used in this study can be effectively applied to the parameter optimization process.
After parameter optimization of the model, Table 4 showed the confusion matrix generated for evaluating rice paddy water layer identification models. The evaluation of identification of the paddy water layer using KNN showed 1%, 4%, and 26% greater accuracy compared to the other three algorithms, respectively, demonstrating its higher ability to distinguish water layer status. Among the four machine-learning algorithm models, the Recall values of the no-water layer are consistently higher than those of the with-water layer, while the Precision exhibits the opposite trend. This suggests that these four models are more inclined to correctly identify the no water layer in the recognition of paddy field water status. Such characteristics align with our application scenario, as we may be more concerned with the identification of the non-water layer. When there is no water layer present in the paddy field, it is highly likely that the field needs irrigation. Therefore, the current results are consistent with the interests of paddy irrigation.
Another indicator that confirms the superiority of the KNN is the f_score (Table 5), in which its value is the highest among the four machine-learning algorithms, showing an improved balance between recall and precision.
Furthermore, as seen from Table 5, the f_score for “no water layer” is lower than the f_score for “with water layer” in all four algorithms, which may be due to the imbalance in sample sizes. This is because there is a significantly larger amount of data collected for fields with water layers [50]. Taking KNN as an example, if a category has a larger sample size, it will have more neighbors among the k nearest elements, making it easier to classify non-water layer fields as water layer class. In a previous study, Lu et al. [51] used the KNN to distinguish leaf types. Due to a larger sample size of asymptomatic leaves compared to healthy and symptomatic leaves in their study, the results were more likely to classify “healthy leaves” or “symptomatic leaves” as “asymptomatic leaves”. Saleem et al. [52] conducted a study for plant classification using different classifier machine-learning algorithms such as KNN, SVM, decision tree, and naïve Bayes, and the KNN performed best in the final results, which is similar to the result of this study.

3.4. Evaluation of Model Algorithms and Analysis of Optimal Combination of Input Variables

Twelve models constructed based on four machine-learning algorithms and three model input variable sets were evaluated for accuracy, as shown in Figure 10. Comparing the four machine-learning algorithms, we found that the recognition accuracy of the other three machine-learning algorithms was higher, except for the LR model, which had poorer recognition accuracy, indicating the feasibility of machine-learning algorithms in recognizing the water layer of rice fields. The recognition accuracies of the KNN and SVM algorithms were closer, the SVM model accuracy was higher than that of KNN when G2 was used as the model input variable, and the KNN model accuracy was slightly higher than that of SVM. The RF model using the integrated algorithm also achieved better results, with slightly lower accuracy than SVM and KNN.
To visually assess the effects of different model combinations on model accuracy, the model accuracy for different combinations of model input variables was plotted, as shown in Figure 11. Regardless of the machine-learning algorithm applied, the model accuracy was highest in the group using multisource remote sensing data combined with atmospheric temperature (G3), followed by paddy field temperature and atmospheric temperature (Group G1). The accuracy of all four models was lower in Group G2, which does not use the element of paddy field temperature, indicating that adding RGB data to the model input elements can improve the accuracy of water layer identification. In the early stage of rice fertility, the coverage is less than 100%, and when there is a water layer in the field, the remote sensing image obtained has a mixed image element of the water layer and rice canopy, and some studies have shown that bare soil has higher reflectivity than water body, and the water deficit plants have higher reflectivity than healthy plant canopy in the same growth period [53]. Thus, the information on RGB of rice fields at any stage of rice fertility can provide valid information for water layer identification. Using the G2 group of input variables without paddy temperature data, the model was less effective for water layer identification. Comparing the three groups of variables, we found that the addition of RGB data can improve the model accuracy, but the paddy temperature information was the more important factor for water layer identification.

3.5. Limitations, Uncertainties, and Perspective

This research focuses on the identification of water layer presence in paddy fields and the computational potential of different machine-learning algorithms. The remote sensing monitoring of paddy field water information is still severely lacking on a global scale, Xu et al. [24] diagnosed crop water stress of rice using an infra-red thermal imager; Luan et al. [44] improved the performance in rice water deficit diagnosis with canopy temperature spatial distribution information measured using thermal imagery. Although the above-mentioned research can provide guidance for paddy field irrigation, the monitoring scale is greatly constrained by the limited range of the sensors used.
Currently, research is mostly focused on the detection of water information in dry crops because there are several challenges that need to be addressed, and these challenges include the following: (1) a resolution issue in which the resolution of remote sensing data often limits the ability to capture small-scale features. Water information in paddy fields may exist in small areas or localized regions. Therefore, high-resolution data are required to accurately capture moisture changes. The UAV remote sensing platform involved in this study has to some extent addressed this issue. However, it is important to strike a balance between spatial resolution and monitoring area since they are usually contradictory, thus presenting the (2) mixed pixel problem in which pixels in remote sensing images may cover different land cover types, such as soil, vegetation, and water bodies. These mixed pixels pose difficulties in extracting moisture information because different land cover types have different ways of reflecting or absorbing light or radiation [54]. This problem is especially pronounced during the early growth stages of rice, thereby giving rise to the (3) algorithm and model selection challenge in which the machine-learning algorithms used in this study are classical methods. With the development of artificial intelligence and the accumulation of data, using deep learning networks may improve the accuracy of paddy field water monitoring [55].
In general, due to the limitations, obtaining quantitative information about paddy field water is challenging. However, in the future, we may be able to assist paddy field irrigation using two other approaches: (1) since irrigation practices of paddy fields are typically guided based on pre-defined maximum and minimum threshold depth of paddy water, it would be meaningful to identify which stage the paddy field water is within this irrigation range; (2) studies have explored intelligent irrigation forecasting using satellite remote sensing data and hydrological modeling [56]. In the future, unmanned aerial vehicle remote-sensing-driven hydrological models can be used to support precise irrigation applications.

4. Conclusions

In this study, we fully explored the potential information in thermal infrared images and visible images, constructed different types of model input variables by combining atmospheric temperature, tested the accuracy of rice paddy water layer recognition with different input variables and different machine-learning algorithms, and selected the best method for rice paddy water layer recognition via model accuracy comparison and parameter optimization. The main conclusions are as follows.
(1) By extracting the temperature features and color features of UAV imagery, the problem of “dichotomous classification” of paddy water layers is addressed using a classification machine-learning model, which demonstrates the feasibility of machine-learning algorithms in identifying paddy water layers, and the highest recognition accuracy of the model was 89.29%.
(2) The results using multiple sources of remote sensing data (thermal infrared and RGB data) were better than those using thermal infrared or RGB data alone, and thermal infrared data had a greater impact on the model recognition accuracy than RGB data.
(3) Among the four machine-learning algorithms, KNN exhibited better results, regardless of the model input variable set; when using multisource remote sensing data as model input variables, KNN, SVM, and RF models had higher recognition accuracy, exceeding 85%; LR recognition accuracy was the worst and only slightly above 60%.
In conclusion, we recommend the application of multisource remote sensing and the KNN algorithm for the identification of paddy water layers. In future work, the combination of thermal infrared sensors with multispectral or hyperspectral sensors with richer spectral information may lead to better recognition accuracy.

Author Contributions

Conceptualization, Y.L. and G.W.; methodology, Y.L. and G.W.; software, H.C. and G.W.; validation, E.L. and X.H.; formal analysis, H.C. and G.W.; investigation, G.W. and H.X.; resources, Y.L. and Y.C.; data curation, Y.C. and G.W.; writing—original draft preparation, H.C. and G.W.; writing—review and editing, Y.L., G.W. and Y.C.; visualization, G.W.; supervision, Y.L.; project administration, Y.L.; funding acquisition, Y.L. All authors have read and agreed to the published version of the manuscript.

Funding

This work was financially supported by the NSFC-MWR-CTGC Joint Yangtze River Water Science Research Project (No. U2040213) and the National Natural Science Foundation of China (51979201).

Data Availability Statement

Not applicable.

Conflicts of Interest

The authors declare no conflict of interest.

References

  1. Luo, W.; Chen, M.; Kang, Y.; Li, W.; Li, D.; Cui, Y.; Khan, S.; Luo, Y. Analysis of crop water requirements and irrigation demands for rice: Implications for increasing effective rainfall. Agric. Water Manag. 2022, 260, 107285. [Google Scholar] [CrossRef]
  2. Mote, K.; Rao, V.; Ramulu, V.; Kumar, K.; Devi, M. Performance of rice (Oryza sativa (L.)) under AWD irrigation practice—A brief review. Paddy Water Environ. 2021, 20, 1–21. [Google Scholar] [CrossRef]
  3. Cheng, M.; Li, B.; Jiao, X.; Huang, X.; Fan, H.; Lin, R.; Liu, K. Using multimodal remote sensing data to estimate regional-scale soil moisture content: A case study of Beijing, China. Agric. Water Manag. 2022, 260, 107298. [Google Scholar] [CrossRef]
  4. Adab, H.; Morbidelli, R.; Saltalippi, C.; Moradian, M.; Ghalhari, G.A.F. Machine Learning to Estimate Surface Soil Moisture from Remote Sensing Data. Water 2020, 12, 3223. [Google Scholar] [CrossRef]
  5. Periasamy, S.; Shanmugam, R.S. Multispectral and Microwave Remote Sensing Models to Survey Soil Moisture and Salinity. Land Degrad. Dev. 2016, 28, 1412–1425. [Google Scholar] [CrossRef]
  6. Cao, Z.; Gao, H.; Nan, Z.; Zhao, Y.; Yin, Z. A Semi-Physical Approach for Downscaling Satellite Soil Moisture Data in a Typical Cold Alpine Area, Northwest China. Remote Sens. 2021, 13, 509. [Google Scholar] [CrossRef]
  7. Senanayake, I.P.; Yeo, I.Y.; Tangdamrongsub, N.; Willgoose, G.R.; Hancock, G.R.; Wells, T.; Fang, B.; Lakshmi, V.; Walker, J.P. An in-situ data based model to downscale radiometric satellite soil moisture products in the Upper Hunter Region of NSW, Australia. J. Hydrol. 2019, 572, 820–838. [Google Scholar] [CrossRef]
  8. Shima, A.; Alireza, B.D.; Sara, M.; Bernhard, B.; Rajat, B.; Wolfgang, W.; Christian, M. Assimilation of Sentinel 1 and SMAP—based satellite soil moisture retrievals into SWAT hydrological model: The impact of satellite revisit time and product spatial resolution on flood simulations in small basins. J. Hydrol. 2020, 581, 124367. [Google Scholar]
  9. Punalekar, S.M.; Verhoef, A.; Quaife, T.L.; Humphries, D.; Bermingham, L.; Reynolds, C.K. Application of Sentinel-2A data for pasture biomass monitoring using a physically based radiative transfer model. Remote Sens. Environ. 2018, 218, 207–220. [Google Scholar] [CrossRef]
  10. Jia, K.; Liang, S.; Gu, X.; Baret, F.; Wei, X.; Wang, X.; Yao, Y.; Yang, L.; Li, Y. Fractional vegetation cover estimation algorithm for Chinese GF-1 wide field view data. Remote Sens. Environ. 2016, 177, 184–191. [Google Scholar] [CrossRef]
  11. Wei, G.; Cao, J.; Xie, H.; Xie, H.; Yang, Y.; Wu, C.; Cui, Y.; Luo, Y. Spatial-Temporal Variation in Paddy Evapotranspiration in Subtropical Climate Regions Based on the SEBAL Model: A Case Study of the Ganfu Plain Irrigation System, Southern China. Remote Sens. 2022, 14, 1201. [Google Scholar] [CrossRef]
  12. Kordi, F.; Yousefi, H. Crop classification based on phenology information by using time series of optical and synthetic-aperture radar images. Remote Sens. Appl. Soc. Environ. 2022, 27, 100812. [Google Scholar] [CrossRef]
  13. Woźniak, E.; Rybicki, M.; Kofman, W.; Aleksandrowicz, S.; Wojtkowski, C.; Lewiński, S.; Bojanowski, J.; Musiał, J.; Milewski, T.; Slesiński, P.; et al. Multi-temporal phenological indices derived from time series Sentinel-1 images to country-wide crop classification. Int. J. Appl. Earth Obs. 2022, 107, 102683. [Google Scholar] [CrossRef]
  14. Wei, G.; Li, Y.; Zhang, Z.; Chen, Y.; Chen, J.; Yao, Z.; Lao, C.; Chen, H. Estimation of soil salt content by combining UAV-borne multispectral sensor and machine learning algorithms. PeerJ 2020, 8, e9087. [Google Scholar] [CrossRef]
  15. Zhang, Z.; Wei, G.; Yao, Z.; Tan, C.; Wang, X.; Han, J. Research on soil salt inversion model based on UAV multispectral remote sensing. Trans. Chin. Soc. Agric. Mach. 2019, 50, 151–160. [Google Scholar]
  16. Lobell, D.B.; Asner, G.P. Moisture Effects on Soil Reflectance. Soil Sci. Soc. Am. J. 2002, 66, 722–727. [Google Scholar] [CrossRef]
  17. Riveros-Burgos, C.; Ortega-Farías, S.; Morales-Salinas, L.; Fuentes-Peñailillo, F.; Tian, F. Assessment of the clumped model to estimate olive orchard evapotranspiration using meteorological data and UAV-based thermal infrared imagery. Irrig. Sci. 2021, 39, 63–80. [Google Scholar] [CrossRef]
  18. Shao, G.; Han, W.; Zhang, H.; Liu, S.; Wang, Y.; Zhang, L.; Cui, X. Mapping maize crop coefficient Kc using random forest algorithm based on leaf area index and UAV-based multispectral vegetation indices. Agric. Water Manag. 2021, 252, 106906. [Google Scholar] [CrossRef]
  19. Fan, C.; Lu, R. UAV image crop classification based on deep learning with spatial and spectral features. IOP Conf. Ser. Earth Environ. Sci. 2021, 783, 012080. [Google Scholar] [CrossRef]
  20. Ge, X.; Ding, J.; Jin, X.; Wang, J.; Chen, X.; Li, X.; Liu, J.; Xie, B. Estimating Agricultural Soil Moisture Content through UAV-Based Hyperspectral Images in the Arid Region. Remote Sens. 2021, 13, 1562. [Google Scholar] [CrossRef]
  21. Easterday, K.; Kislik, C.; Dawson, T.; Hogan, S.; Kelly, M. Remotely Sensed Water Limitation in Vegetation: Insights from an Experiment with Unmanned Aerial Vehicles (UAVs). Remote Sens. 2019, 11, 1853. [Google Scholar] [CrossRef] [Green Version]
  22. Hoffmann, H.; Jensen, R.; Thomsen, A.; Nieto, H.; Rasmussen, J.; Friborg, T. Crop water stress maps for an entire growing season from visible and thermal UAV imagery. Biogeosciences 2016, 13, 6545–6563. [Google Scholar] [CrossRef] [Green Version]
  23. Kendall, C.D.; Saleh, T.; Thomas, J.T.; Louise, H.C. Comparison of canopy temperature-based water stress indices for maize. Agr. Water Manag. 2015, 156. [Google Scholar]
  24. Xu, J.; Lv, Y.; Liu, X.; Dalson, T.; Yang, S.; Wu, J. Diagnosing Crop Water Stress of Rice using Infra-red Thermal Imager under Water Deficit Condition. Int. J. Agric. Biol. 2016, 18, 565–572. [Google Scholar] [CrossRef]
  25. Peng, S.; Xu, J.; Ding, J.; Li, D. Leaf-air temperature diffierence of rice and water deficit diagnose under water saving irrigation. J.Hudraul. Eng. 2006, 15, 1503–1508. [Google Scholar]
  26. Bian, J.; Zhang, Z.; Chen, J.; Chen, H.; Cui, C.; Li, X.; Chen, S.; Fu, Q. Simplified Evaluation of Cotton Water Stress Using High Resolution Unmanned Aerial Vehicle Thermal Imagery. Remote Sens. 2019, 11, 267. [Google Scholar] [CrossRef] [Green Version]
  27. Zhang, Z.; Tan, C.; Xu, C.; Chen, S.; Han, W.; Li, Y. Retrieving soil moisture content in field maize root zone based on UAV multispectral remote sensing. Trans. Chin. Soc. Agric. Mach. 2019, 50, 246–257. [Google Scholar]
  28. Tang, G.; Jiang, S. Drought index and drought prediction for rice. Water Resour. Hydropower Eng. 2011, 42, 54–58. [Google Scholar]
  29. Thamaraichelvi, B.; Yamuna, G. Gaussian kernel-based FCM segmentation of brain MRI with BPNN classification. Int. J. Biomed. Eng. Technol. 2016, 20, 116–131. [Google Scholar] [CrossRef]
  30. Ji, X. Application of Improved SVM Image Segmentation Algorithm in Computer Tomography Image Analysis. Int. J. Bioautomation 2017, 21, 59–68. [Google Scholar]
  31. Shah, S.H.; Angel, Y.; Houborg, R.; Ali, S.; McCabe, M.F. A Random Forest Machine Learning Approach for the Retrieval of Leaf Chlorophyll Content in Wheat. Remote Sens. 2019, 11, 920. [Google Scholar] [CrossRef] [Green Version]
  32. Patil, S.; Sasikala, M. Segmentation and identification of medicinal plant through weighted KNN. Multimed. Tools Appl. 2022, 82, 2805–2819. [Google Scholar] [CrossRef]
  33. Thamizhvani, T.R.; Ajayan, A.K.; Sannidhya, V.; Hemalatha, R.J.; Chandrasekaran, R. Psoriasis Skin Disease Identification Using Support Vector Machine (SVM) Image Classification and Determining the Growth Rate. J. Phys. Conf. Ser. 2022, 2318, 012034. [Google Scholar] [CrossRef]
  34. Liu, B.; Hou, J.; Ge, H.; Liu, M.; Shi, L.; Li, C.; Cui, Y. Comparison of Evapotranspiration Partitioning and Dual Crop Coefficients of Direct-Seeded and Transplanted Rice in the Poyang Lake Basin, China. Agronomy 2023, 13, 1218. [Google Scholar] [CrossRef]
  35. Liu, T.; Zhong, X.; Jiang, M.; Jin, X.; Zhou, P.; Liu, S.; Sun, C.; Guo, W. Estimates of rice lodging using indices derived from UAV visible and thermal. Agric. Forest Meteorol. 2018, 252, 144–154. [Google Scholar] [CrossRef]
  36. Zhang, L. Monitoring Maize Water Stress Based on UAV Remote Sensing Data. Doctor’s Thesis, Northwest A&F University, Xianyang, China, 2021. [Google Scholar]
  37. Kherif, O.; Benmahamed, Y.; Teguar, M.; Boubakeur, A.; Ghoneim, S.S.M. Accuracy Improvement of Power Transformer Faults Diagnostic Using KNN Classifier with Decision Tree Principle. IEEE Access 2021, 9, 81693–81701. [Google Scholar] [CrossRef]
  38. Gao, H.; Wang, C.; Wang, G.; Fu, H.; Zhu, J. A novel crop classification method based on ppfSVM classifier with time-series alignment kernel from dual-polarization SAR datasets. Remote Sens. Environ. 2021, 264, 112628. [Google Scholar] [CrossRef]
  39. Zhu, N.; Zhu, C.; Zhou, L.; Zhu, Y.; Zhang, X. Optimization of the Random Forest Hyperparameters for Power Industrial Control Systems Intrusion Detection Using an Improved Grid Search Algorithm. Appl. Sci. 2022, 12, 10456. [Google Scholar] [CrossRef]
  40. Gianluca, T.; Kazuito, I.; Gustau, C.; Enrico, T.; Dario, P. Uncertainty analysis of gross primary production upscaling using Random Forests, remote sensing and eddy covariance data. Remote Sens. Environ. 2015, 168, 360–373. [Google Scholar]
  41. Islam, M.S.; Sultana, S.; Farid, F.A.; Islam, M.N.; Rashid, M.; Bari, B.S.; Hashim, N.; Husen, M.N. Multimodal Hybrid Deep Learning Approach to Detect Tomato Leaf Disease Using Attention Based Dilated Convolution Feature Extractor with Logistic Regression Classification. Sensors 2022, 22, 6079. [Google Scholar] [CrossRef]
  42. Melo, L.L.D.; Melo, V.G.M.L.; Marques, P.A.A.; Frizzone, J.A.; Coelho, R.D.; Romero, R.A.F.; Barros, T.H.D.S. Deep learning for identification of water deficits in sugarcane based on thermal images. Agric. Water Manag. 2022, 272, 107820. [Google Scholar] [CrossRef]
  43. Jacques, S. Statistical inference in retrieval effectiveness evaluation. Inform. Process. Manag. 1997, 33, 495–512. [Google Scholar]
  44. Luan, Y.; Xu, J.; Lv, Y.; Liu, X.; Wang, H.; Liu, S. Improving the performance in crop water deficit diagnosis with canopy temperature spatial distribution information measured by thermal imaging. Agric. Water Manag. 2021, 246, 106699. [Google Scholar] [CrossRef]
  45. Tang, Q. Canopy Eco-Physiological Properties and the Influence Factors in Irrigated Rice. Ph.D. Thesis, Hunan Agriclutral University, Changsha, China, 2005. [Google Scholar]
  46. Jia, L.; Buerkert, A.; Chen, X.; Roemheld, V.; Zhang, F. Low-altitude aerial photography for optimum N fertilization of winter wheat on the North China Plain. Field Crop. Res. 2004, 89, 389–395. [Google Scholar] [CrossRef]
  47. He, J.; Ma, B.; Tian, J. Water production function and optimal irrigation schedule for rice (Oryza sativa L.) cultivation with drip irrigation under plastic film-mulched. Sci. Rep. 2022, 12, 17243. [Google Scholar] [CrossRef] [PubMed]
  48. Jiang, M.; Guo, K.; Wang, J.; Wu, Y.; Shen, X.; Huang, L. Current status and prospects of rice canopy temperature research. Food Energy Secur. 2023, 12, e424. [Google Scholar] [CrossRef]
  49. Ren, H.; Zhuang, D.; Pan, J.; Shi, X.; Wang, H. Hyper-spectral remote sensing to monitor vegetation stress. J. Soil. Sediment. 2008, 8, 323–326. [Google Scholar] [CrossRef] [Green Version]
  50. Dudani, S.A. The Distance-Weighted k-Nearest-Neighbor Rule. IEEE Trans. Syst. Man Cybern. 1976, 4, 325–327. [Google Scholar] [CrossRef]
  51. Jinzhu, L.; Reza, E.; Yeyin, S.; Jaafar, A.; Ana, I.D.C.; Yunjun, X. Field detection of anthracnose crown rot in strawberry using spectroscopy technology. Comput. Electron. Agric. 2017, 135, 289–299. [Google Scholar]
  52. Saleem, G.; Akhtar, M.; Ahmed, N.; Qureshi, W.S. Automated analysis of visual leaf shape features for plant classification. Comput. Electron. Agric. 2019, 157, 270–280. [Google Scholar] [CrossRef]
  53. Tan, C.; Zhang, Z.; Xu, C.; Ma, Y.; Yao, Z.; Wei, G.; Li, Y. Soil water content inversion in field maize root zone based on UAV multispectral remote sensing. Trans. Chin. Soc. Agric. Eng. 2020, 36, 63–74. [Google Scholar]
  54. Chen, Y.; Ge, Y.; Heuvelink, G.B.M.; An, R.; Chen, Y. Object-Based Superresolution Land-Cover Mapping from Remotely Sensed Imagery. IEEE Trans. Geosci. Remote. Sens. 2018, 56, 328–340. [Google Scholar] [CrossRef]
  55. Yu, J.; Zhang, X.; Xu, L.; Dong, J.; Zhangzhong, L. A hybrid CNN-GRU model for predicting soil moisture in maize root zone. Agric. Water Manag. 2021, 245, 106649. [Google Scholar] [CrossRef]
  56. Corbari, C.; Salerno, R.; Ceppi, A.; Telesca, V.; Mancini, M. Smart irrigation forecast using satellite LANDSAT data and meteo-hydrological modeling. Agric. Water Manag. 2019, 212, 283–294. [Google Scholar] [CrossRef]
Figure 1. Summary map of the study area.
Agronomy 13 01932 g001
Figure 2. Equipment and imagery. (a) Camera, (b) unmanned aerial vehicle, (c) thermal infrared imagery, and (d) visible imagery.
Agronomy 13 01932 g002
Figure 3. Image temperature calibration and relation. (x is the thermal infrared image temperature, and y is the measured temperature of the infrared thermometer).
Agronomy 13 01932 g003
Figure 4. Flow chart for the method of identifying the water layer in paddy fields based on UAV multisource remote sensing data. (A) Data preprocessing; (B) modeling; (C) analysis.
Agronomy 13 01932 g004
Figure 5. Temperature distribution with and without the water layer in the key growing period of rice.
Agronomy 13 01932 g005
Figure 6. The color features of the with-water-layer and no-water-layer paddy fields; “Percentage” represents the percentage of total pixels of the image for one value; (AD) represent tillering, booting, heading, and milk-ripe, respectively.
Agronomy 13 01932 g006
Figure 7. Optimization of model parameters based on KNN.
Agronomy 13 01932 g007
Figure 8. Optimization of model parameters based on SVM.
Agronomy 13 01932 g008
Figure 9. Optimization of model parameters based on RF.
Agronomy 13 01932 g009
Figure 10. Comparison of precision results of model algorithms.
Agronomy 13 01932 g010
Figure 11. Comparison of model accuracy under different combinations of model input variables.
Agronomy 13 01932 g011
Table 1. The key parameters of ZENMUSE XT 2.
ParametersThermal ImageVisible Image
Pixel336 × 2564000 × 3000
FormatR-JPEGJPEG
Width/height (nm)5.7/4.47.4/5.6
Focal length(nm)138
Wavelength (μm)7.5~13.50.49, 0.55, 0.67
Table 2. Tuning parameters of the four machine algorithms.
Machine-Learning AlgorithmsTuning Parameters
KNNK
SVMC, gamma
RFn_estimators
LRDefault
Table 3. The input variables of model.
Variable GroupInput Variable
G1Tp, Ta
G2 r ,   g ,   b , ExG
G3Tp, Ta, r ,   g ,   b , ExG
Note: Tp represents the average temperature of the field, and Ta represents the air temperature.
Table 4. Confusion matrix generated for evaluating identification models.
Prediction
No Water LayerWith Water LayerPrecisionRecallAccuracy
ActualKNNNo water layer129100.83230.92810.8929
With water layer261710.94480.8680
SVMNo water layer126130.83440.90650.8869
With water layer251720.92970.8731
RFNo water layer121180.79610.87050.8542
With water layer311660.90220.8424
LRNo water layer91480.54820.65470.6340
With water layer751220.71770.6193
Table 5. F_score for identification models.
Methodf_Score
No Water LayerWith Water Layer
KNN0.87760.9048
SVM0.85610.9069
RF0.81810.8824
LR0.54940.6917
Disclaimer/Publisher’s Note: The statements, opinions and data contained in all publications are solely those of the individual author(s) and contributor(s) and not of MDPI and/or the editor(s). MDPI and/or the editor(s) disclaim responsibility for any injury to people or property resulting from any ideas, methods, instructions or products referred to in the content.

