Article

Effects of Meteorological Factors and Water-Nitrogen Management Techniques on Carbon Dioxide Fluxes in Wheat Fields in a Dry Semi-Humid Area

1
College of Agronomy, Northwest A&F University, Yangling, Xianyang 712100, China
2
Institute of Water-Saving Agriculture in Arid Areas of China, Northwest A&F University, Yangling, Xianyang 712100, China
3
Key Laboratory of Crop Physi-Ecology and Tillage Science in Northwestern Loess Plateau, Ministry of Agriculture, Northwest A&F University, Yangling, Xianyang 712100, China
*
Authors to whom correspondence should be addressed.
Agronomy 2023, 13(7), 1925; https://doi.org/10.3390/agronomy13071925
Submission received: 9 June 2023 / Revised: 18 July 2023 / Accepted: 19 July 2023 / Published: 20 July 2023
(This article belongs to the Special Issue Improving Fertilizer Use Efficiency)

Abstract

:
Studying carbon dioxide fluxes in wheat fields is becoming increasingly important. The dry semi-humid area in China is an important wheat production area, but the variations in carbon dioxide fluxes in wheat fields and the mechanisms associated with the carbon dioxide flux response to meteorological factors and water-nitrogen management have rarely been studied systematically in this area. Thus, we conducted a monitoring experiment in order to clarify the responses of CO2-C fluxes to meteorological factors and water-nitrogen management in wheat fields in this dry semi-humid area, and modeled the relationships between CO2-C fluxes and meteorological factors under different water-nitrogen managements. Four water-nitrogen treatments were tested in wheat fields: rain-fed (no water and nitrogen added), irrigation (150 mm water added), rain-fed plus nitrogen application (225 kg ha−1 nitrogen added), and irrigation plus nitrogen application (150 mm water and 225 kg ha−1 nitrogen added). The CO2-C fluxes and meteorological indicators were monitored and analyzed, before fitting the relationships between them. The direct and total effects of precipitation, air temperature, and water vapor pressure on CO2-C fluxes in wheat fields were all positive, and their total effect coefficients were more than 0.7 and significant. Irrigation and nitrogen application increased the CO2-C fluxes in wheat fields by 6.82–14.52% and 51.59–55.94%, respectively. The fitting results showed that partial least squares regression models of the relationships between meteorological factors and CO2-C fluxes in wheat fields under different treatments were all effective, with R2Y (cum) and Q2 (cum) values around 0.7. Overall, these results suggest that precipitation, air temperature, water vapor pressure, and water and nitrogen addition have positive effects on CO2-C fluxes from wheat fields in dry semi-humid areas. The partial least squares regression method is also suitable for modeling the relationships between meteorological factors and CO2-C fluxes. These results may provide a scientific basis for predicting and regulating CO2-C fluxes in wheat fields in dry semi-humid areas, and provide a methodological reference for ecosystem carbon dioxide flux simulation studies.

1. Introduction

Carbon is increasingly flowing into the atmospheric carbon pool, where atmospheric CO2 concentration in 2019 increased to 410 ppm [1,2]. This increase in atmospheric carbon will lead to increased global warming and frequent meteorological disasters, thereby posing severe challenges to global development [1,3]. Agriculture is considered one of the most important sources of carbon dioxide emissions [4,5]. The microbial decomposition of soil organic matter, the respiratory metabolism of crop roots, and the mineralization of soil organic matter are important processes in the conversion of agricultural soil carbon to atmospheric carbon [2,3,6]. Agriculture is also threatened by severe reductions in farmland carbon pools and the frequent occurrence of extreme climate events caused by carbon dioxide emissions [3,6]. Monitoring and studying agricultural carbon dioxide emissions can provide a theoretical basis for coping with global climate change and ensuring the healthy development of agriculture, and it has become one of the most important issues in the world.
Exploring the factors that influence carbon dioxide emissions and understanding their relationships has always been a major focus of research into agricultural carbon dioxide emissions [2,7,8,9,10,11]. Agricultural production relies on natural water, light, and heat resources, and thus agricultural carbon dioxide emissions are closely related to meteorological factors [9,10,12]. Air temperature and precipitation can regulate the carbon cycle process by affecting plant growth and soil properties, and they are considered to be important factors that drive carbon dioxide emissions [3,9,12,13]. The water vapor status in the air (relative humidity, water vapor pressure, vapor pressure deficit, etc.) and light status (sunshine duration, solar radiation, photosynthetically active radiation, etc.) can affect plant stomatal conductance, the photosynthetic level, and soil hydrothermal dynamics, which may have complex effects on carbon dioxide emissions [2,7,9,10,12,13,14]. Many previous studies have explored the total effects of various meteorological factors on agricultural carbon dioxide emissions, but their direct and indirect effects have rarely been considered and they require further analysis. Constructing a model based on the effects of meteorological factors on carbon dioxide emissions is helpful for applying abundant meteorological data to predicting and evaluating agricultural carbon dioxide emissions [14]. However, few modeling studies have addressed this problem, and thus further research is required. In addition, the samples that can be used for modeling often vary under different research conditions, so modeling methods with strong sample inclusiveness are more appropriate. The partial least squares regression (PLS) method is particularly advantageous, but it is rarely used in agricultural carbon dioxide flux modeling research and should be introduced.
Agricultural production also relies on anthropogenic inputs of water and nitrogen resources [15,16,17,18], so agricultural carbon dioxide emissions are also regulated by water and nitrogen management techniques [10,19,20]. Irrigation has diverse regulatory effects on carbon dioxide emissions by affecting soil aeration, microbial activity, and plant growth [8,21]. Nitrogen application can regulate carbon dioxide emissions by affecting plant root growth and the soil microbial community composition, and these regulatory effects vary under different conditions [10,22,23,24]. Therefore, the effects of water and nitrogen management on agricultural carbon dioxide emissions need to be further studied. In addition, both water and nitrogen management and meteorological factors have effects on agricultural carbon dioxide emissions, but few studies have considered them simultaneously, so there is a need to study them together.
Wheat is the grain crop with the largest planting area throughout the world, with about 220 million hectares [25], and thus carbon dioxide emissions from wheat fields are an important part of agricultural carbon dioxide emissions. Due to its high environmental adaptability and relatively low water requirements, wheat is one of the main cereal crops grown in the dry semi-humid area of China (more than 15.3 million hectares of arable land in this area) [26,27,28,29]. However, relatively few studies have investigated carbon dioxide emissions from wheat fields in this dry semi-humid area. The inter-monthly distribution of precipitation in this area is uneven due to the influence of the monsoon climate, and agricultural production is often threatened by the occurrence of drought [30]. Decreased precipitation due to climate warming will lead to more severe water shortages in agriculture [30]. In addition, the farmland in this area is threatened by soil degradation [31], and carbon dioxide emission processes can affect soil carbon pools and the quality of farmland. Therefore, it is very important to study the carbon dioxide emissions from wheat fields in this area in the context of the increasing atmospheric carbon concentration and global warming.
Thus, we conducted experiments with different water and nitrogen treatments in wheat fields in the dry semi-humid study area and monitored CO2-C fluxes and meteorological indicators. The aims of this study were: (1) to determine the characteristic changes in meteorological factors and CO2-C fluxes; (2) to explore the effects of water and nitrogen management techniques and meteorological factors on CO2-C fluxes; and (3) to model the relationships between CO2-C fluxes and meteorological factors. We aimed to provide a scientific basis for reducing emissions from wheat fields and improving the quality of farmland in the dry semi-humid study area, and to provide a methodological and technical reference for predicting agricultural carbon dioxide emissions in further studies.

2. Materials and Methods

2.1. Experimental Site Description

The experiment was conducted at the Institute of Water-Saving Agriculture in Arid Areas of China (longitude 108°04′ E, latitude 34°17′ N; altitude 506 m), located on Guanzhong Plain. In the dry semi-humid study area, the annual average temperature, total solar radiation, and precipitation were 13.0 °C, 4800 MJ m−2, and 600 mm, respectively. The experimental field was flat. The soil in the field was Lou soil, which is classified as Eum-Orthric Anthrosol. Before starting the experiment, the basic properties of the soil (0–40 cm) were as follows: bulk density = 1.25 g cm−3, soil organic matter = 12.55 g kg−1, total nitrogen = 0.72 g kg−1, total potassium = 11.48 g kg−1, and total phosphorus = 0.69 g kg−1.

2.2. Experimental Design and Implementation

The experiment was conducted for three winter wheat growing seasons (October 2018 to June 2021) using a randomized block design with three blocks and the following four treatments: rain-fed (R), irrigation (I), rain-fed plus nitrogen application (RN), and irrigation plus nitrogen application (IN). The rain-fed treatments were dependent on natural precipitation. The treatments requiring irrigation were irrigated with 75 mm water at the early overwintering stage and jointing stage for wheat (total 150 mm water). In the treatments requiring nitrogen application, 225 kg ha−1 of pure nitrogen (using urea) was applied before sowing wheat. The application amounts of phosphorus and potassium fertilizer in each treatment were consistent, with basal application rates of 75 kg ha−1 P2O5 (using calcium superphosphate) and 150 kg ha−1 K2O (using potassium chloride) before sowing wheat. Xinong 979 (the main local wheat variety) was used as the test material, and artificial drilling and harvesting were conducted around October 20 each year and early June in the following year, respectively. The wheat row spacing was 20 cm and basic seedlings of 2.25 million plants ha−1 were maintained in all plots. The plot area was 7.2 m2 (3.0 m × 2.4 m). In order to prevent interference by water and fertilizer between plots, the plots were separated by 1 m wide walkways. Other management measures in the experimental field were consistent with local production practices. After wheat harvesting, the field was fallow in summer and uniformly tilled before autumn sowing.

2.3. Indicator Monitoring Methods

2.3.1. CO2-C Flux Measurement

CO2-C flux sampling was conducted in wheat fields by using the static chamber method. The static chamber comprised a top box and base made of polyvinyl chloride and stainless steel, respectively, with dimensions of 40 cm × 30 cm × 40 cm and 40 cm × 30 cm × 15 cm. The top box was wrapped with heat-insulating reflective material and equipped with a thermometer and gas sampling pipe. The lower part of the base was a fixed frame (in the soil) and the upper part was a groove. The long side of the base was perpendicular to the planting row and the area covered by the base included the planting row and inter-row areas. Monitoring began after fertilization and sowing, and gas samples were collected every 5 days for the first half a month and then every half a month until the wheat was harvested. Gas samples were always collected at 8:00–11:00 a.m. The top box was connected to the base groove and the seam was sealed with water, before extracting well-mixed gas samples using syringes at intervals of 0, 10, 20, and 30 min, and the temperature was also recorded. The CO2 concentrations were determined in the samples by using a GC-2010 Plus gas chromatograph (Shimadzu, Kyoto, Japan). The CO2-C fluxes were calculated according to Formula (1) [32]:
F   = k   × 273.15 T × H   × Δ c Δ t × 24
where F is the CO2-C flux (mg m−2 d−1), k is taken as 0.536 (kg C m−3), T is the mean temperature inside the static chamber (K), H is the height of the sampling box (m), Δc/Δt is the rate of change in the CO2 concentration (ppm h−1), and 24 is the conversion factor (h d−1). Δc/Δt was estimated with linear regression analysis, and flux value was accepted when r > 0.95. Cumulative CO2-C emissions were estimated by integrating the monthly average CO2-C fluxes during the wheat growing season [33].

2.3.2. Meteorological Factor Monitoring

The detailed precipitation, air temperature, water vapor pressure, relative humidity, and sunshine duration data required for the study were obtained from the Yangling National General Weather Station. This station is located at the Institute of Water-Saving Agriculture in Arid Areas of China, about 200 m away from the experimental field. The station is used for the long-term continuous observation of meteorological data and service scientific experiments.

2.4. Statistical Analysis

Data from the 2018–2019 and 2020–2021 wheat growing seasons (complete monitoring) were used to analyze the relationships between CO2-C fluxes and meteorological factors, and to construct models. Data from the 2019–2020 wheat growing season (with some interruptions in CO2-C flux monitoring due to the pandemic) were used for model validation.
The direct and indirect relationships between the monthly scale y (average CO2-C flux) and x1 (average air temperature (AT)), x2 (average relative humidity (RH)), x3 (average water vapor pressure (WVP)), x4 (average daily precipitation (P)), and x5 (average daily sunshine duration (SD)) were determined with path analysis. The relationships between y and xi are shown in Table 1. In Table 1, bi is the direct effect coefficient of xi on y, rij*bj is the indirect effect coefficient of xi on y through xj, riy is the total effect coefficient of xi on y obtained by summing the direct and all indirect effect coefficients of xi on y, e refers to other factors that affect y, and R(i) is the decision coefficient representing the comprehensive determining effect of xi on y, which can be calculated using Formula (2) [34].
R i = 2 b i ×   r iy   b i 2
The relationships between CO2-C fluxes and meteorological factors were modeled based on PLS. PLS maximizes the explained covariance between variables by extracting components that adequately reflect the original variable information from the set of variables, and the extracted components are then used to construct a predictive model for the response variable [35]. PLS is applicable to cases with obvious collinearity between independent variables and small sample sizes [36]. Variable importance in projection (VIP) is a variable screening metric based on PLS, which is used to measure the explanatory ability of the independent variable with respect to the dependent variable. An independent variable with a VIP value greater than 1.0 is considered important and an independent variable with a VIP value less than 0.5 is considered less influential [35]. The VIP value can be calculated using Formula (3) [36]:
VIP i = p   × h = 1 m Rd   Y ; t h ×   w hi 2 / h = 1 m Rd   Y ; t h
where VIPi is the VIP value of the independent variable xi, p is the number of independent variables, m is the number of extracted components, th is the h-th extracted component, Rd (Y; th) is the explanatory ability of th with respect to the dependent variable Y, and whi is the weight of xi on th, which reflects the marginal contribution of xi to th.
The PLS model was selected based on R2Y (cum) and Q2 (cum). R2Y (cum) indicates the degree to which the model fits the dependent variable Y, and Q2 (cum) is a measure of the predictive ability of the model as assessed by cross-validation, and thus larger values of R2Y (cum) and Q2 (cum) indicate better model performance [37]. By analyzing the observed and corresponding predicted values of the CO2-C fluxes during the 2019–2020 wheat growing season, the model was further validated using the correlation coefficient (r), root mean square error (RMSE), and symmetric mean absolute percentage error (SMAPE). The values of r, RMSE, and SMAPE can be calculated using Formulas (4–6), respectively [38,39]:
r   = i = 1 n y i   Y × f i   F / i = 1 n y i   Y 2 / i = 1 n f i   F 2
RMSE   = 1 n × i = 1 n f i   y i 2
SMAPE   = 100 % n × i = 1 n f i   y i f i + y i / 2
where n is the sample size, yi is the i-th observed value, fi is the i-th predicted value, Y is the average of the observed values, and F is the average of the predicted values. The performance of a model is better when r is closer to 1, SMAPE is farther away from 200%, and RMSE is smaller.
Path analysis was performed using SAS 8.1 (SAS, Cary, NC, USA). Collinearity between variables was analyzed using IBM SPSS Statistics 20 (IBM, Armonk, NY, USA). PLS analysis and model construction were performed with SIMCA 14.1 (UMETRICS, Umea, Sweden). The figures were prepared using OriginPro 2023 (OriginLab, Northampton, MA, USA).

3. Results

3.1. Dynamics of CO2-C Fluxes in Wheat Fields

Figure 1 shows that the CO2-C fluxes in wheat fields under different water and nitrogen treatments exhibited similar seasonal patterns of variation during the wheat growing seasons, where they decreased initially, before increasing and finally decreasing. The CO2-C fluxes decreased to the lowest values in December–January (overwintering stage) and rose to the peak values in May (filling stage). Irrigation increased the average CO2-C fluxes in the wheat season under the same nitrogen level. The average CO2-C fluxes were 6.82–14.52% higher under I compared with R and 6.82–11.32% higher under IN compared with RN. Under the same water management pattern, the CO2-C fluxes in nitrogen-treated wheat fields were higher in all stages. The average CO2-C fluxes were 55.14–55.94% higher under RN compared with R and 51.59–55.15% higher under IN compared with I (Figure 1).
Figure 2 shows that April–May was the key period for CO2-C emissions from wheat fields, and the cumulative CO2-C emissions in this stage accounted for more than 60% of the cumulative CO2-C emissions in the whole wheat growing season. Under different water and nitrogen treatments, the cumulative CO2-C emissions in the wheat growing season were 3896.65–7195.28 kg ha−1. Irrigation increased the cumulative CO2-C emissions in the wheat growing season under the same nitrogen level. The cumulative CO2-C emissions were 264.04–602.71 kg ha−1 higher under I compared with R and 413.57–730.41 kg ha−1 higher under IN compared with RN. Nitrogen application also increased the cumulative CO2-C emissions in the wheat growing season under the same water management pattern. The cumulative CO2-C emissions were 2146.28–2320.86 kg ha−1 higher under RN compared with R and 2295.81–2448.56 kg ha−1 higher under IN compared with I (Figure 2).

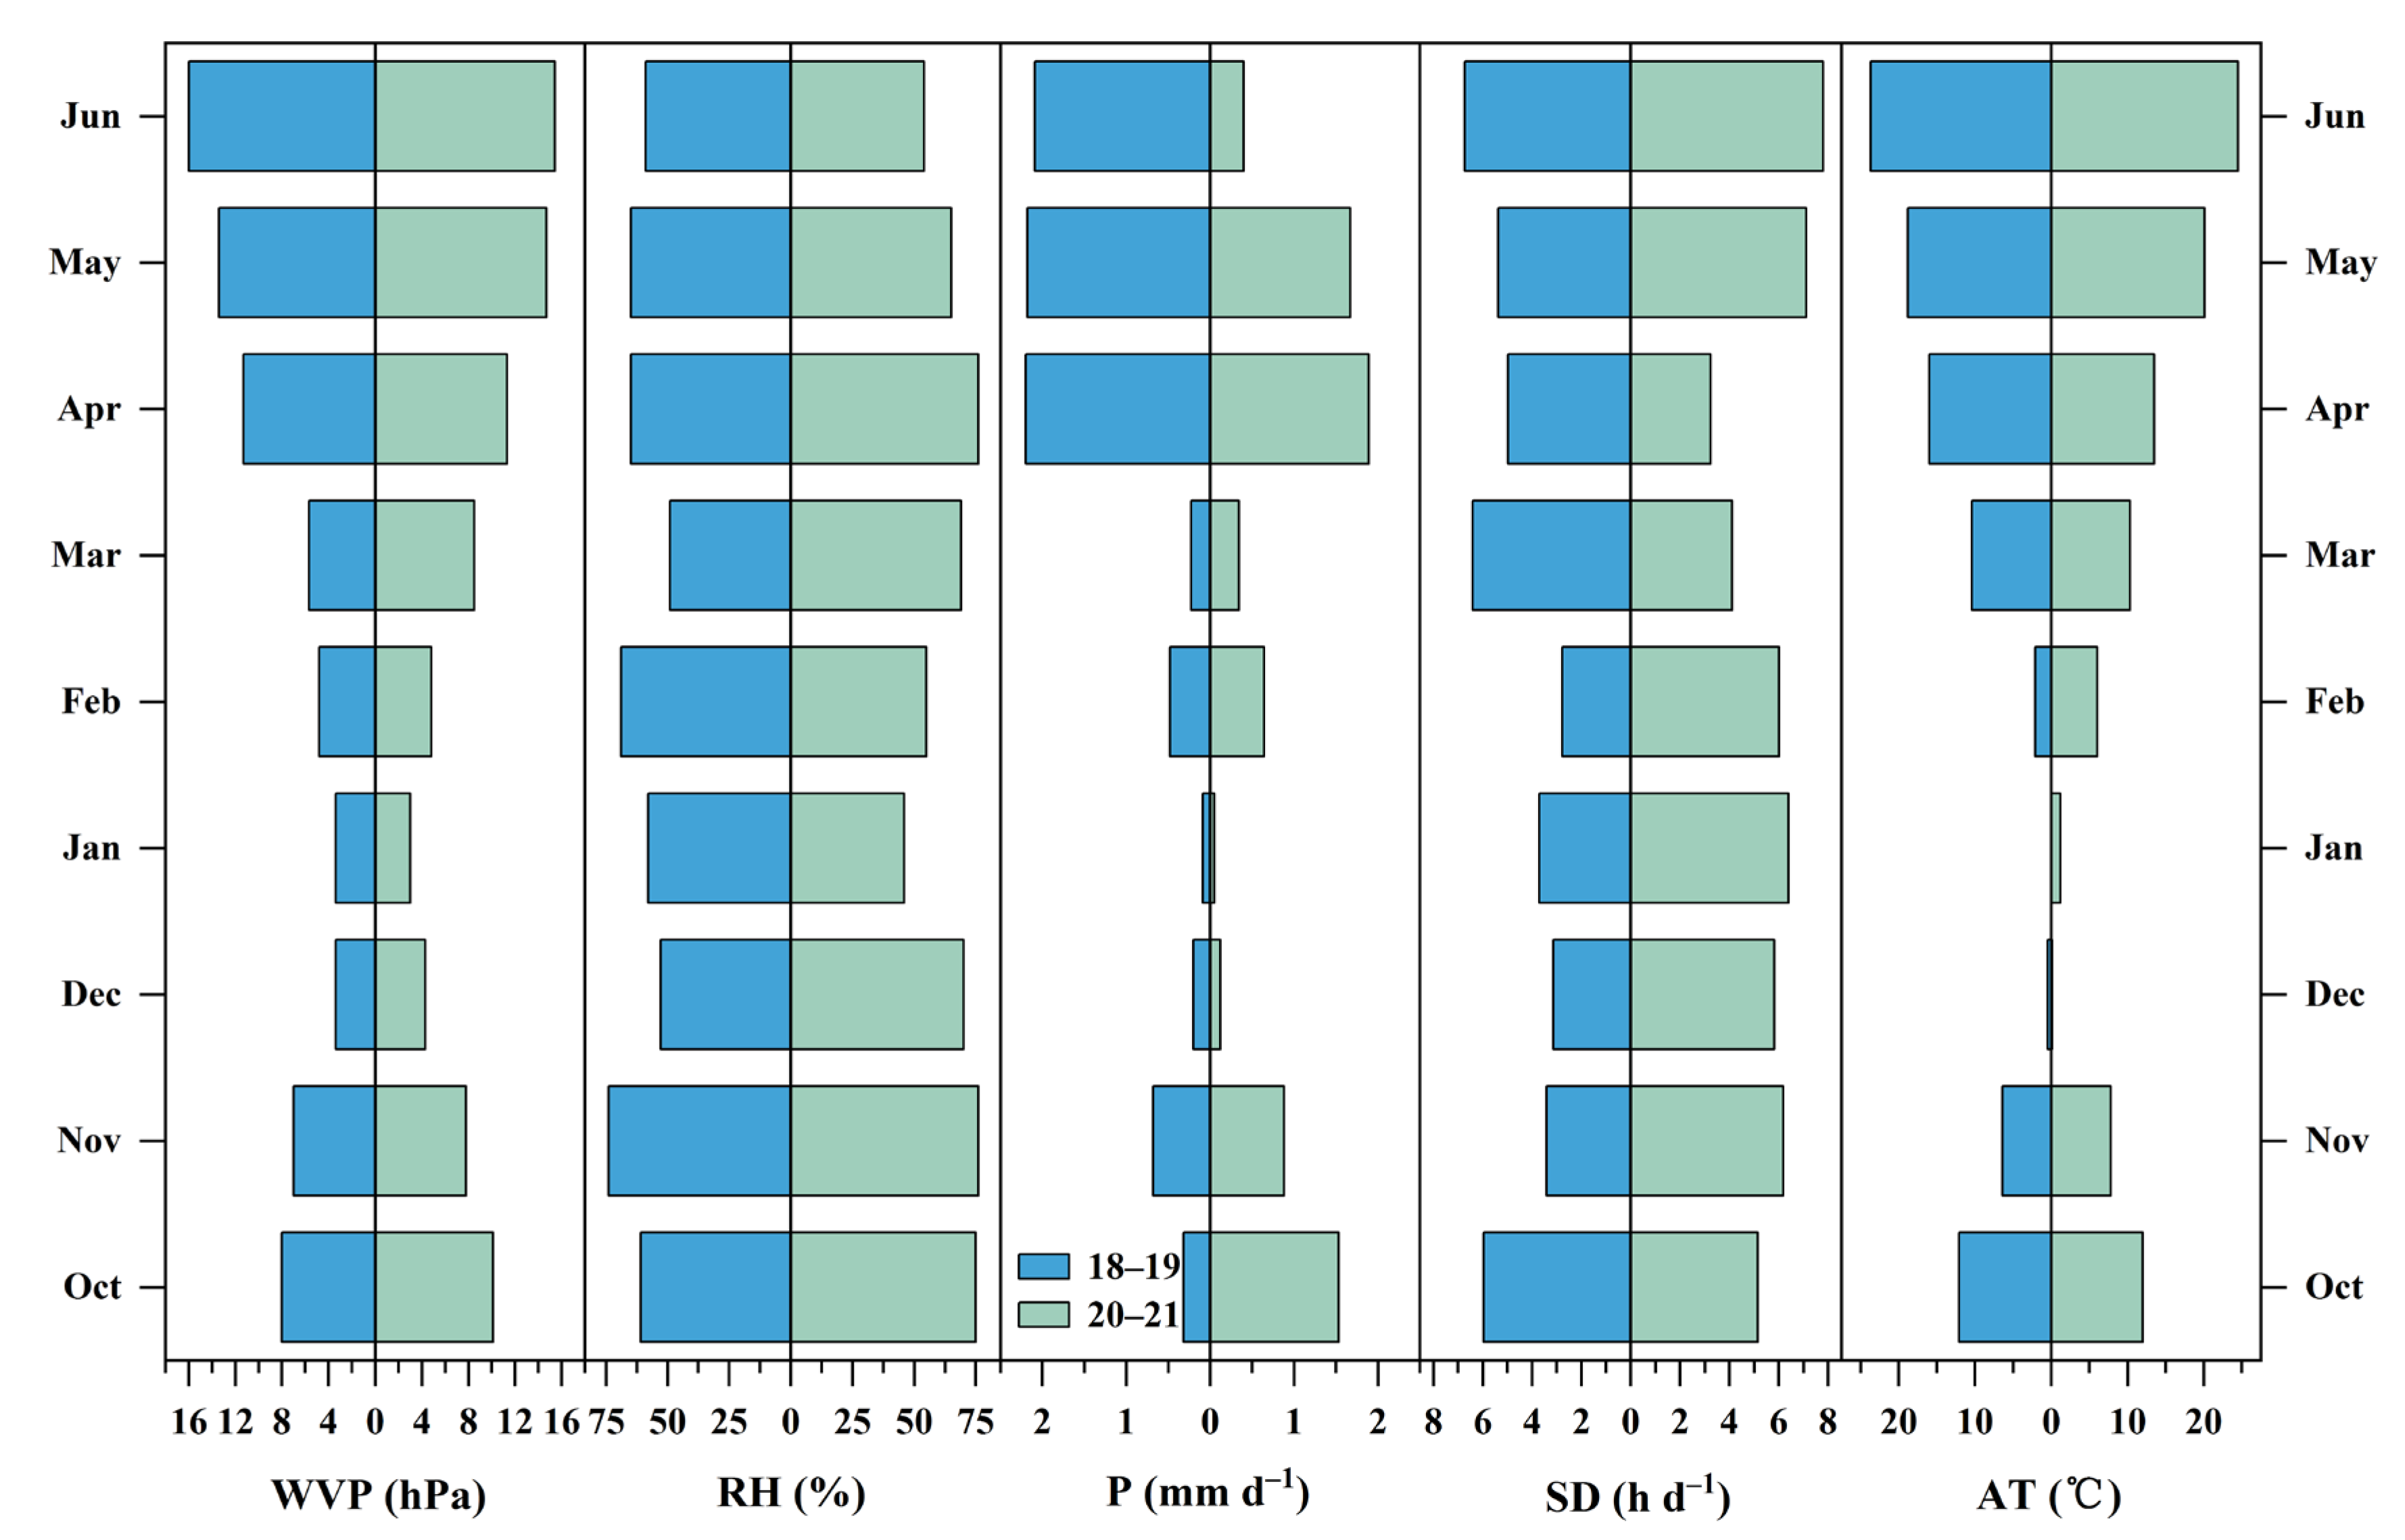
3.2. Dynamics of Meteorological Factors

Figure 3 shows that the monthly variations in all meteorological factors (monthly averages) were relatively clear in the wheat growing season. The characteristic variations in WVP were basically the same in the two growing seasons, where it decreased initially and then increased, with a range of 3.0–16.0 hPa and the lowest period in December–January. The variations in RH were relatively complex and inconsistent in the two growing seasons, with a range of 46–76% (Figure 3). The variations in AT were similar to those in WVP, with an overall “tick”-shaped trend and a range of 0.0–24.5 °C. The variations in SD differed greatly between the two growing seasons, with more abundant sunshine in the 2020–2021 growing season. The distributions of P were generally similar in the two growing seasons, with less in the early stage (drought in the winter and spring) and more in the late stage (Figure 3).

3.3. Responses of CO2-C Fluxes to Meteorological Factors

3.3.1. Correlation Analysis

Figure 4 shows that the CO2-C fluxes under different water and nitrogen treatments were significantly positively correlated with AT and WVP, with correlation coefficients ranging from 0.765 to 0.820 and 0.792 to 0.840, respectively. Irrigation decreased the correlation coefficients between CO2-C fluxes and AT and WVP under the same nitrogen level, whereas nitrogen application increased the correlation coefficients between CO2-C fluxes and AT and WVP under the same water management pattern. Significant positive correlations were also found between the CO2-C fluxes and P under different water and nitrogen treatments, with correlation coefficients ranging from 0.718 to 0.782. Irrigation and nitrogen application both decreased the correlation coefficients between CO2-C fluxes and P (Figure 4). The CO2-C fluxes under different treatments were positively correlated (but not significantly) with RH and SD, with correlation coefficients ranging from 0.107 to 0.153 and 0.179 to 0.247, respectively. Under the same water management pattern, nitrogen application decreased the correlation coefficients between CO2-C fluxes and RH, but increased the correlation coefficients between CO2-C fluxes and SD (Figure 4). The responses of CO2-C fluxes to meteorological factors were influenced by the water and nitrogen management patterns.

3.3.2. Path Analysis

The effects of meteorological factors (AT, RH, WVP, P, and SD) on CO2-C fluxes could be explained effectively by path analysis, and the R2 values for the equations under each treatment were in the range of 0.7275–0.7815 (Table 1). Under different water and nitrogen treatments, the direct effects of RH and SD on CO2-C fluxes were negative and weak, whereas the direct effects of AT, WVP, and P on CO2-C fluxes were all positive. The direct effect coefficient of WVP was the largest (in the range of 0.5136–0.7565) under each treatment (Table 1). AT and P were significantly positively correlated with WVP (Figure 4), so the total effects of these three factors on CO2-C fluxes were all relatively large (Table 1). Under different water and nitrogen treatments, the R(i) values for meteorological factors followed the order of WVP > P > AT > 0 > RH > SD (Table 1). Thus, WVP and P were the main decision variables, whereas RH and SD were restrictive variables. Both irrigation and nitrogen application decreased the direct and comprehensive determining effects of P on CO2-C fluxes, whereas both increased the direct effects of WVP on CO2-C fluxes. In addition, nitrogen application increased the comprehensive determining effects of WVP on CO2-C fluxes (Table 1).

3.4. Modeling Based on PLS Analysis

Figure 5 shows that the VIP values for meteorological factors were different, thereby indicating that they had different abilities to influence the CO2-C fluxes in wheat fields. Under different treatments, the VIP values were all greater than 1.0 for WVP, AT, and P, and the 95% confidence intervals for these VIP values did not contain 0. Thus, these three factors had significant effects on CO2-C fluxes. By contrast, the VIP values for SD and RH were less than 0.5, and the 95% confidence intervals for these VIP values contained 0, so the effects of SD and RH on CO2-C fluxes were not significant (Figure 5). Both irrigation and nitrogen application increased the VIP values for WVP and AT, but both decreased the VIP values for P (Figure 5). Table 2 shows that the variance inflation factor (VIF) values for AT and WVP were greater than 10 and their tolerance values were less than 0.1. Therefore, obvious collinearity was detected between AT and WVP.
Table 3 shows that different combinations of variables were formed by gradually removing meteorological factors with VIP values less than 0.5 and selectively removing (retaining at least one of them) meteorological factors with VIF values greater than 10, and different models were constructed using the PLS method based on these combinations for optimal model selection. Under R and I, the models based on the combination of P and AT were optimal (with the largest R2Y (cum) and Q2 (cum) values), and the models based on the combination of P, AT, and WVP were optimal under RN and IN (Table 3). The specific forms of the optimal models under each treatment are shown in Table 4.

3.5. Model Validation

Based on the P, AT, and WVP data during the 2019–2020 wheat growing season (Figure S1), the optimal model under each treatment was used to predict CO2-C fluxes. These predicted values were in good agreement with the corresponding observed values (Figure 6). The ranges of r, RMSE, and SMAPE were 0.985–0.993, 265.72–551.84 mg m–2 d−1, and 16.40–22.78%, respectively (Table 5). Therefore, these results indicated the good performance of each optimal model.

4. Discussion

4.1. Responses of Ecosystem Carbon Dioxide Fluxes to Meteorological Factors

Ecosystem CO2 fluxes are often influenced by multiple meteorological factors [10,14,40]. Wang et al. [9] found that precipitation could affect the fluctuations in CO2 fluxes in farmland ecosystems. Fatumah et al. [3] conducted experiments in banana–coffee farms in Uganda, and showed that precipitation was a key meteorological factor for regulating the carbon dioxide flux levels, and that the CO2 fluxes increased as the precipitation increased. Similar to previous studies, the results obtained in the present study showed that precipitation was an important meteorological factor for regulating the variations in CO2-C fluxes in wheat fields, and it had a positive regulatory role. The positive regulatory effect of precipitation on farmland carbon dioxide fluxes may be explained by increasing precipitation improving the soil microbial activity, promoting the crop’s physiological metabolism, increasing the disturbance of the soil structure, and accelerating the soil pore gas efflux [3]. In addition, Golovatskaya and Dyukarev [41] found reliable relationships between the air temperature and peat soil CO2 fluxes at all time scales. Huang et al. [42] showed that carbon dioxide fluxes in plantation ecosystems in the hilly areas of north China increased as the monthly mean air temperature increased. Similar to previous studies, we found significant positive correlations between the air temperature and CO2-C fluxes in wheat fields. The positive regulatory effect of air temperature on ecosystem CO2 fluxes may be explained by higher temperatures promoting soil microbial metabolism and soil organic carbon decomposition [10,43]. Furthermore, water vapor pressure, which is influenced by both precipitation and air temperature, is considered to have effects on water- or heat-dependent ecophysiological processes [44]. In the present study, water vapor pressure had significant positive effects on CO2-C fluxes in wheat fields.
However, the effects of the sunshine duration and relative humidity on ecosystem CO2 fluxes are relatively complex. An increase in the sunshine duration can provide more light to promote plant photosynthetic carbon fixation [45], but also more heat to promote soil CO2 emissions [7], and thus the sunshine duration can have diverse effects on ecosystem carbon cycling processes. Dhadli et al. [10] showed that the correlations between the sunshine duration and farmland CO2 fluxes were not significant during the maize and wheat growing seasons. In the present study, the sunshine duration also had weak effects on CO2-C fluxes in wheat fields, with negative direct effects and positive total effects. In addition, the relative humidity can have diverse effects on ecosystem carbon cycling processes. Increased relative humidity can alleviate plant drought stress and increase stomatal conductance and photosynthetic carbon fixation [45,46], and higher relative humidity is not conducive to air flow, which has a limiting effect on ecosystem CO2 emissions [47]. However, the improved moisture conditions associated with higher relative humidity may promote carbon metabolism in soil microbes and plant roots [14,48]. Melling et al. [49] found that relative humidity was the main regulatory factor for CO2 fluxes in forest ecosystems, but it had less effect on CO2 fluxes in crop cultivation systems, including no significant effect on CO2 fluxes in sago cultivation systems. In the present study, the effects of relative humidity on CO2-C fluxes in wheat fields were also insignificant, with negative direct effects and positive total effects.

4.2. Responses of Ecosystem Carbon Dioxide Fluxes to Water and Nitrogen Managements

Water is an important component of soil and an essential resource for plant growth and development, and water management can affect the soil properties and plant traits to regulate ecosystem CO2 fluxes [50]. Jia et al. [51] found that water addition increased the soil CO2 fluxes in bunge needlegrass grassland and purple alfalfa grassland in semi-arid areas. Similarly, Liu et al. [52] conducted experiments in spring maize fields on the Loess Plateau in China and showed that irrigation increased the soil CO2 fluxes compared with rain-fed growing. Moreover, Sainju et al. [19] found that irrigation increased farmland carbon dioxide fluxes by 13% when increasing the soil water content in North Dakota, USA. Similar to previous studies, we found that irrigation increased the CO2-C fluxes by 6.82–14.52% in wheat fields in a dry semi-humid area. The increased ecosystem CO2 fluxes under irrigation may be explained by the improved water conditions increasing the plant root activity, microbial metabolism, and substrate availability [51,52]. Furthermore, in the present study, we found that irrigation changed the effects of meteorological factors on CO2-C fluxes in wheat fields. Similarly, Liu et al. [52] showed that irrigation changed the relationships between meteorological factors and soil CO2 fluxes in maize fields.
Nitrogen is an important nutrient that exists in many forms in soils and organisms, and it participates in a wide range of metabolic activities. Thus, nitrogen management can regulate the soil environment, microbial composition, and plant growth to affect ecosystem CO2 fluxes [53,54]. Shao et al. [55] found that nitrogen application (90–360 kg N ha−1) increased carbon dioxide fluxes in winter wheat fields in northwest China. In addition, Sainju et al. [19] showed that nitrogen application increased the carbon dioxide fluxes in both conventional-till and no-till malt barley fields in North Dakota. Similar to previous studies, we found that nitrogen application increased the CO2-C fluxes in wheat fields compared with no nitrogen application. The increased ecosystem CO2 fluxes under nitrogen application may be explained by increases in soil fertility, soil microbial diversity, and the root biomass and exudates [10,24]. Furthermore, we found that nitrogen application changed the relationships between meteorological factors (precipitation, air temperature, water vapor pressure, etc.) and CO2-C fluxes in wheat fields to some extent. Similarly, Dhadli et al. [10] found that nitrogen application changed the effects of meteorological variables on farmland CO2 fluxes.

4.3. Modeling the Relationships between Ecosystem Carbon Dioxide Fluxes and Meteorological Factors

Modeling the relationships between ecosystem CO2 fluxes and meteorological factors can help to explain and predict changes in ecosystem CO2 fluxes through meteorological data [14]. Constructing these models often involves identifying important independent variables and establishing response relationships between variables, and thus previous studies have introduced many relevant methods and explored their characteristics [10,12,38,56]. Dhadli et al. [10] used stepwise multiple linear regression analysis to model the relationships between farmland CO2 fluxes and meteorological variables in Ludhiana, India, and showed that meteorological variables could explain 22–56% of the changes in farmland CO2 fluxes through these models. This method can include both important variable screening and model construction, and it is simple and convenient to use. Qin et al. [56] used the Bayesian technique for automatic relevance determination to analyze the importance of input variables and modeled the response of carbon dioxide exchange to input variables in summer maize fields in the North China Plain region with the feed-forward back propagation neural network technique, and the predictive ability of this model was much better than that of the stepwise linear regression model. However, the use of the neural network technique to construct models is affected by problems such as difficulties in determining the network structure, explaining the model, and ensuring the reliability of the model under small sample sizes [56]. Cai et al. [38] modeled the response in terms of net ecosystem carbon exchange to environmental variables in evergreen needleleaf forest ecosystems in temperate oceanic climate regions using the gradient boosting regression method, and analyzed the importance of environmental variables using the random forest algorithm, which achieved good results. Gradient boosting regression improved the performance by combining a series of weak prediction models to form a strong prediction model, and this method has the advantages of accurate prediction, good stability, and widespread application [38]. However, the serial fitting of several weak prediction models by using this method may incur high computational overheads. The situations investigated in ecological and environmental studies are complex and diverse, and the availability of a small number of measurements is typical in ecology [56], which may demand applying modeling methods with strong sample size inclusiveness. The PLS method can be used in situations with low numbers of observed samples and it has great potential for application in the field of environmental monitoring [12]. In addition, the VIP metric based on this method can be used to measure the ability of the independent variable to explain the dependent variable [36], thereby helping to identify important variables conveniently and quickly. Yang et al. [12] used the PLS method to study the importance of each independent variable and to model the relationships between carbon dioxide exchange and meteorological variables in an apple orchard on the Loess Plateau, and good simulation and prediction results were obtained. Similarly, based on the experimental situation, we used the PLS method to effectively assess the ability of meteorological factors to explain CO2-C flux changes in wheat fields under different water and nitrogen treatments, and to successfully model the relationships between CO2-C fluxes and meteorological factors, where the R2Y (cum) and Q2 (cum) values for the models were about 0.7.

5. Conclusions

The variations in CO2-C fluxes in wheat fields in a dry semi-humid area all exhibited a seasonal pattern, with decreases followed by increases and then decreases again under different water and nitrogen treatments. The precipitation, air temperature, and water vapor pressure were the most important meteorological factors that affected the variations in CO2-C fluxes in wheat fields, and their direct and total effects were positive. Irrigation and nitrogen application both increased the CO2-C fluxes in wheat fields, and also affected the relationships between CO2-C fluxes and meteorological factors. The PLS models of the relationships between meteorological factors and CO2-C fluxes in wheat fields all performed well under different water and nitrogen treatments. The results obtained in this study provide a scientific basis for the prediction and assessment of CO2-C fluxes, and for formulating emission reduction measures in wheat fields in dry semi-humid areas, as well as serving as a methodological reference for carbon dioxide flux simulation studies in other areas and ecosystems.

Supplementary Materials

The following supporting information can be downloaded at: https://www.mdpi.com/article/10.3390/agronomy13071925/s1, Figure S1: Meteorological data used for model validation during the 2019–2020 wheat growing season.

Author Contributions

Conceptualization, Z.J., T.C., and X.M.; methodology, T.C., X.M., and M.L.; investigation, X.M. and M.L.; data curation, Z.J., T.C., X.M., and M.L.; writing—original draft preparation, X.M.; writing—review and editing, Z.J., T.C., and X.M.; funding acquisition, Z.J. All authors have read and agreed to the published version of the manuscript.

Funding

This study was supported by the Program of the National Natural Science Foundation of China (No. 41671226).

Data Availability Statement

The data presented in this study are available within the article.

Acknowledgments

We are grateful to Junfeng Nie, Ruixia Ding, Hui Li, and Baoping Yang for help during the experimental period.

Conflicts of Interest

The authors declare no conflict of interest.

References

  1. IPCC. Climate Change 2021: The Physical Science Basis. Contribution of Working Group I to the Sixth Assessment Report of the Intergovernmental Panel on Climate Change; Cambridge University Press: Cambridge, UK; New York, NY, USA, 2021. [Google Scholar]
  2. Liu, C.; Wu, Z.; Hu, Z.; Yin, N.; Islam, A.T.; Wei, Z. Characteristics and influencing factors of carbon fluxes in winter wheat fields under elevated CO2 concentration. Environ. Pollut. 2022, 307, 119480. [Google Scholar] [CrossRef] [PubMed]
  3. Fatumah, N.; Munishi, L.K.; Ndakidemi, P.A. Variations in greenhouse gas fluxes in response to short-term changes in weather variables at three elevation ranges, wakiso district, Uganda. Atmosphere 2019, 10, 708. [Google Scholar] [CrossRef] [Green Version]
  4. Pratibha, G.; Srinivas, I.; Rao, K.; Shanker, A.K.; Raju, B.; Choudhary, D.K.; Rao, K.S.; Srinivasarao, C.; Maheswari, M. Net global warming potential and greenhouse gas intensity of conventional and conservation agriculture system in rainfed semi arid tropics of India. Atmos. Environ. 2016, 145, 239–250. [Google Scholar] [CrossRef]
  5. Li, S.; Hu, M.; Shi, J.; Tian, X.; Wu, J. Integrated wheat-maize straw and tillage management strategies influence economic profit and carbon footprint in the Guanzhong Plain of China. Sci. Total Environ. 2021, 767, 145347. [Google Scholar] [CrossRef] [PubMed]
  6. Lal, R.; Follett, R.F.; Stewart, B.A.; Kimble, J.M. Soil carbon sequestration to mitigate climate change and advance food security. Soil Sci. 2007, 172, 943–956. [Google Scholar] [CrossRef]
  7. La Scala, N., Jr.; Panosso, A.; Pereira, G. Modelling short-term temporal changes of bare soil CO2 emissions in a tropical agrosystem by using meteorological data. Appl. Soil Ecol. 2003, 24, 113–116. [Google Scholar] [CrossRef]
  8. Jabro, J.; Sainju, U.; Stevens, W.; Evans, R. Carbon dioxide flux as affected by tillage and irrigation in soil converted from perennial forages to annual crops. J. Environ. Manag. 2008, 88, 1478–1484. [Google Scholar] [CrossRef]
  9. Wang, W.; Liao, Y.; Wen, X.; Guo, Q. Dynamics of CO2 fluxes and environmental responses in the rain-fed winter wheat ecosystem of the Loess Plateau, China. Sci. Total Environ. 2013, 461, 10–18. [Google Scholar] [CrossRef] [PubMed] [Green Version]
  10. Dhadli, H.S.; Brar, B.; Black, T. Influence of crop growth and weather variables on soil CO2 emissions in a maize-wheat cropping system. Agric. Res. J. 2015, 52, 28–34. [Google Scholar] [CrossRef]
  11. He, X.; Du, Z.; Wang, Y.; Lu, N.; Zhang, Q. Sensitivity of soil respiration to soil temperature decreased under deep biochar amended soils in temperate croplands. Appl. Soil Ecol. 2016, 108, 204–210. [Google Scholar] [CrossRef]
  12. Yang, J.; Duan, Y.; Yang, X.; Awasthi, M.K.; Li, H.; Zhang, L. Modeling CO2 exchange and meteorological factors of an apple orchard using partial least square regression. Environ. Sci. Pollut. Res. 2020, 27, 43439–43451. [Google Scholar] [CrossRef] [PubMed]
  13. Jiang, Y.; Wang, P.; Xu, X.; Zhang, J. Dynamics of carbon fluxes with responses to vegetation, meteorological and terrain factors in the south-eastern Tibetan Plateau. Environ. Earth Sci. 2014, 72, 4551–4565. [Google Scholar] [CrossRef]
  14. Yue-Lin, L.; Otieno, D.; Owen, K.; Zhang, Y.; Tenhunen, J.; Xing-Quan, R.; Yong-Biao, L. Temporal variability in soil CO2 emission in an orchard forest ecosystem. Pedosphere 2008, 18, 273–283. [Google Scholar]
  15. Zhu, Z.; Chen, D. Nitrogen fertilizer use in China–Contributions to food production, impacts on the environment and best management strategies. Nutr. Cycl. Agroecosyst. 2002, 63, 117–127. [Google Scholar] [CrossRef]
  16. Trost, B.; Prochnow, A.; Drastig, K.; Meyer-Aurich, A.; Ellmer, F.; Baumecker, M. Irrigation, soil organic carbon and N2O emissions. A review. Agron. Sustain. Dev. 2013, 33, 733–749. [Google Scholar] [CrossRef] [Green Version]
  17. Yang, X.; Lu, Y.; Ding, Y.; Yin, X.; Raza, S. Optimising nitrogen fertilisation: A key to improving nitrogen-use efficiency and minimising nitrate leaching losses in an intensive wheat/maize rotation (2008–2014). Field Crops Res. 2017, 206, 1–10. [Google Scholar] [CrossRef]
  18. Zhang, W.; He, X.; Zhang, Z.; Gong, S.; Zhang, Q.; Zhang, W.; Liu, D.; Zou, C.; Chen, X. Carbon footprint assessment for irrigated and rainfed maize (Zea mays L.) production on the Loess Plateau of China. Biosyst. Eng. 2018, 167, 75–86. [Google Scholar] [CrossRef]
  19. Sainju, U.M.; Jabro, J.D.; Stevens, W.B. Soil carbon dioxide emission and carbon content as affected by irrigation, tillage, cropping system, and nitrogen fertilization. J. Environ. Qual. 2008, 37, 98–106. [Google Scholar] [CrossRef] [Green Version]
  20. Hou, H.; Yang, Y.; Han, Z.; Cai, H.; Li, Z. Deficit irrigation effectively reduces soil carbon dioxide emissions from wheat fields in Northwest China. J. Sci. Food Agric. 2019, 99, 5401–5408. [Google Scholar] [CrossRef] [PubMed]
  21. Sapkota, A.; Haghverdi, A.; Avila, C.C.; Ying, S.C. Irrigation and greenhouse gas emissions: A review of field-based studies. Soil Syst. 2020, 4, 20. [Google Scholar] [CrossRef] [Green Version]
  22. Zhou, L.; Zhou, X.; Zhang, B.; Lu, M.; Luo, Y.; Liu, L.; Li, B. Different responses of soil respiration and its components to nitrogen addition among biomes: A meta-analysis. Glob. Chang. Biol. 2014, 20, 2332–2343. [Google Scholar] [CrossRef]
  23. Mancinelli, R.; Marinari, S.; Brunetti, P.; Radicetti, E.; Campiglia, E. Organic mulching, irrigation and fertilization affect soil CO2 emission and C storage in tomato crop in the Mediterranean environment. Soil Tillage Res. 2015, 152, 39–51. [Google Scholar] [CrossRef]
  24. Qiu, W.; Liu, J.; Li, B.; Wang, Z. N2O and CO2 emissions from a dryland wheat cropping system with long-term N fertilization and their relationships with soil C, N, and bacterial community. Environ. Sci. Pollut. Res. 2020, 27, 8673–8683. [Google Scholar] [CrossRef] [PubMed]
  25. Zheng, Z.; Hoogenboom, G.; Cai, H.; Wang, Z. Winter wheat production on the Guanzhong Plain of Northwest China under projected future climate with SimCLIM. Agric. Water Manag. 2020, 239, 106233. [Google Scholar] [CrossRef]
  26. Li, C.; Wang, C.; Wen, X.; Qin, X.; Liu, Y.; Han, J.; Li, Y.; Liao, Y.; Wu, W. Ridge–furrow with plastic film mulching practice improves maize productivity and resource use efficiency under the wheat–maize double–cropping system in dry semi–humid areas. Field Crops Res. 2017, 203, 201–211. [Google Scholar] [CrossRef]
  27. Li, W.; Xiong, L.; Wang, C.; Liao, Y.; Wu, W. Optimized ridge–furrow with plastic film mulching system to use precipitation efficiently for winter wheat production in dry semi–humid areas. Agric. Water Manag. 2019, 218, 211–221. [Google Scholar] [CrossRef]
  28. Igrejas, G.; Branlard, G. The importance of wheat. In Wheat Quality for Improving Processing Human Health; Igrejas, G., Ikeda, T.M., Guzmán, C., Eds.; Springer: Cham, Switzerland, 2020; pp. 1–7. [Google Scholar]
  29. Wu, M.; Xu, Y.; Zheng, J.; Hao, Z. North Expansion of Winter Wheat Planting Area in China under Different Emissions Scenarios. Agriculture 2022, 12, 763. [Google Scholar] [CrossRef]
  30. Hu, Y.; Ma, P.; Zhang, B.; Hill, R.L.; Wu, S.; Chen, G. Exploring optimal soil mulching for the wheat-maize cropping system in sub-humid drought-prone regions in China. Agric. Water Manag. 2019, 219, 59–71. [Google Scholar] [CrossRef]
  31. Li, R.; Hou, X.; Jia, Z.; Han, Q. Soil environment and maize productivity in semi-humid regions prone to drought of Weibei Highland are improved by ridge-and-furrow tillage with mulching. Soil Tillage Res. 2020, 196, 104476. [Google Scholar] [CrossRef]
  32. Beetz, S.; Liebersbach, H.; Glatzel, S.; Jurasinski, G.; Buczko, U.; Höper, H. Effects of land use intensity on the full greenhouse gas balance in an Atlantic peat bog. Biogeosciences 2013, 10, 1067–1082. [Google Scholar] [CrossRef] [Green Version]
  33. Vera, J.C.; Acreche, M.M. Towards a baseline for reducing the carbon budget in sugarcane: Three years of carbon dioxide and methane emissions quantification. Agric. Ecosyst. Environ. 2018, 267, 156–164. [Google Scholar] [CrossRef]
  34. Du, Y.; Du, J.; Liu, X.; Yuan, Z. Multiple-to-multiple path analysis model. PLoS ONE 2021, 16, e0247722. [Google Scholar] [CrossRef] [PubMed]
  35. Levanoni, O.; Bishop, K.; Mckie, B.G.; Hartman, G.r.; Eklöf, K.; Ecke, F. Impact of beaver pond colonization history on methylmercury concentrations in surface water. Environ. Sci. Technol. 2015, 49, 12679–12687. [Google Scholar] [CrossRef]
  36. Jia, Q.; Yu, W.; Zhou, L.; Liang, C. Atmospheric and surface-condition effects on CO2 exchange in the Liaohe Delta Wetland, China. Water 2017, 9, 806. [Google Scholar] [CrossRef] [Green Version]
  37. Obrador, B.; von Schiller, D.; Marcé, R.; Gómez-Gener, L.; Koschorreck, M.; Borrego, C.; Catalán, N. Dry habitats sustain high CO2 emissions from temporary ponds across seasons. Sci. Rep. 2018, 8, 3015. [Google Scholar] [CrossRef] [PubMed] [Green Version]
  38. Cai, J.; Xu, K.; Zhu, Y.; Hu, F.; Li, L. Prediction and analysis of net ecosystem carbon exchange based on gradient boosting regression and random forest. Appl. Energy 2020, 262, 114566. [Google Scholar] [CrossRef]
  39. Chicco, D.; Warrens, M.J.; Jurman, G. The coefficient of determination R-squared is more informative than SMAPE, MAE, MAPE, MSE and RMSE in regression analysis evaluation. PeerJ Comput. Sci. 2021, 7, e623. [Google Scholar] [CrossRef]
  40. Feiziene, D.; Feiza, V.; Vaideliene, A.; Povilaitis, V.; Antanaitis, S. Soil surface carbon dioxide exchange rate as affected by soil texture, different long-term tillage application and weather. Agriculture 2010, 97, 25–42. [Google Scholar]
  41. Golovatskaya, E.; Dyukarev, E. The influence of environmental factors on the CO2 emission from the surface of oligotrophic peat soils in West Siberia. Eurasian Soil Sci. 2012, 45, 588. [Google Scholar] [CrossRef]
  42. Huang, H.; Zhang, J.; Meng, P.; Fu, Y.; Zheng, N.; Gao, J. Seasonal variation and meteorological control of CO2 flux in a hilly plantation in the mountain areas of North China. Acta Meteorol. Sin. 2011, 25, 238–248. [Google Scholar] [CrossRef] [Green Version]
  43. Hontoria, C.; Saa, A.; Rodríguez-Murillo, J. Relationships between soil organic carbon and site characteristics in peninsular Spain. Soil Sci. Soc. Am. J. 1999, 63, 614–621. [Google Scholar] [CrossRef] [Green Version]
  44. Yin, X. Atmospheric water vapor pressure over land surfaces: A generic algorithm with data input limited to air temperature, precipitation and geographic location. Theor. Appl. Climatol. 1999, 63, 183–194. [Google Scholar] [CrossRef]
  45. Driesen, E.; Van den Ende, W.; De Proft, M.; Saeys, W. Influence of environmental factors light, CO2, temperature, and relative humidity on stomatal opening and development: A review. Agronomy 2020, 10, 1975. [Google Scholar] [CrossRef]
  46. Talbott, L.D.; Rahveh, E.; Zeiger, E. Relative humidity is a key factor in the acclimation of the stomatal response to CO2. J. Exp. Bot. 2003, 54, 2141–2147. [Google Scholar] [CrossRef] [PubMed]
  47. Song, X.; Yuan, H.; Kimberley, M.O.; Jiang, H.; Zhou, G.; Wang, H. Soil CO2 flux dynamics in the two main plantation forest types in subtropical China. Sci. Total Environ. 2013, 444, 363–368. [Google Scholar] [CrossRef] [PubMed]
  48. Mukhopadhyay, S.; Maiti, S. Soil CO2 flux in grassland, afforested land and reclaimed coalmine overburden dumps: A case study. Land Degrad. Dev. 2014, 25, 216–227. [Google Scholar] [CrossRef]
  49. Melling, L.; Hatano, R.; Goh, K.J. Soil CO2 flux from three ecosystems in tropical peatland of Sarawak, Malaysia. Tellus Ser. B-Chem. Phys. Meteorol. 2005, 57, 1–11. [Google Scholar] [CrossRef]
  50. Yan, L.; Chen, S.; Huang, J.; Lin, G. Differential responses of auto-and heterotrophic soil respiration to water and nitrogen addition in a semiarid temperate steppe. Glob. Chang. Biol. 2010, 16, 2345–2357. [Google Scholar] [CrossRef]
  51. Jia, X.; Shao, M.; Wei, X. Soil CO2 efflux in response to the addition of water and fertilizer in temperate semiarid grassland in northern China. Plant Soil 2013, 373, 125–141. [Google Scholar] [CrossRef]
  52. Liu, Y.; Li, S.; Yang, S.; Hu, W.; Chen, X. Diurnal and seasonal soil CO2 flux patterns in spring maize fields on the Loess Plateau, China. Acta Agric. Scand. Sect. B-Soil Plant Sci. 2010, 60, 245–255. [Google Scholar]
  53. Wang, Y.; Cheng, S.; Fang, H.; Yu, G.; Xu, X.; Xu, M.; Wang, L.; Li, X.; Si, G.; Geng, J. Contrasting effects of ammonium and nitrate inputs on soil CO2 emission in a subtropical coniferous plantation of southern China. Biol. Fertil. Soils 2015, 51, 815–825. [Google Scholar] [CrossRef]
  54. Yan, W.; Zhong, Y.; Liu, J.; Shangguan, Z. Response of soil respiration to nitrogen fertilization: Evidence from a 6-year field study of croplands. Geoderma 2021, 384, 114829. [Google Scholar] [CrossRef]
  55. Shao, R.; Deng, L.; Yang, Q.; Shangguan, Z. Nitrogen fertilization increase soil carbon dioxide efflux of winter wheat field: A case study in Northwest China. Soil Tillage Res. 2014, 143, 164–171. [Google Scholar] [CrossRef]
  56. Qin, Z.; Su, G.; Zhang, J.; Ouyang, Y.; Yu, Q.; Li, J. Identification of important factors for water vapor flux and CO2 exchange in a cropland. Ecol. Model. 2010, 221, 575–581. [Google Scholar] [CrossRef]
Figure 1. Dynamics of CO2-C fluxes under different water and nitrogen treatments in fields during the wheat growing seasons in 2018–2019 and 2020–2021. Note: R represents rain-fed treatment (no water and nitrogen added); I represents irrigation treatment (150 mm water added); RN represents rain-fed plus nitrogen application treatment (225 kg ha−1 nitrogen added); and IN represents irrigation plus nitrogen application treatment (150 mm water and 225 kg ha−1 nitrogen added). The Akima spline curve represents the trend in the CO2-C fluxes with time.
Agronomy 13 01925 g001
Figure 2. Cumulative CO2-C emissions under different water and nitrogen treatments during the wheat growing seasons in 2018–2019 (A) and 2020–2021 (B). Note: the column length represents the mean ± standard error for newly added cumulative CO2-C emissions in each stage.
Agronomy 13 01925 g002
Figure 3. Dynamics of meteorological factors during the wheat growing seasons in 2018–2019 and 2020–2021. Note: WVP, RH, P, SD, and AT represent the monthly scale average water vapor pressure, average relative humidity, average daily precipitation, average daily sunshine duration, and average air temperature, respectively.
Agronomy 13 01925 g003
Figure 4. Correlations between meteorological factors and CO2-C fluxes in wheat fields under different water and nitrogen treatments. Note: the color of the connecting line represents the correlation coefficient value and the thickness of the connecting line represents the correlation degree.
Agronomy 13 01925 g004
Figure 5. Variable importance in projection (VIP) values for the meteorological factors with respect to CO2-C fluxes in wheat fields under different water and nitrogen treatments. Note: Error bars represent 95% confidence intervals.
Agronomy 13 01925 g005
Figure 6. Observed and corresponding predicted values of field CO2-C fluxes under different water and nitrogen treatments during the 2019–2020 wheat growing season. Note: Shaded bands represent 95% confidence bands.
Agronomy 13 01925 g006
Table 1. Path coefficients for effects of meteorological factors on CO2-C fluxes in wheat fields under different water and nitrogen treatments.
Factorsbirij*bjriyR(i)R2 and e
ATRHWVPPSD
RAT0.1412-−0.01220.49830.2798−0.12060.78660.20220.7717 and 0.4778
RH−0.23730.0073-0.11330.16390.08650.1337−0.1198
WVP0.51360.1370−0.0523-0.3100−0.09830.81000.5682
P0.41080.0962−0.09470.3876-−0.01790.78200.4737
SD−0.22480.07570.09130.22460.0327-0.1994−0.1402
IAT0.1410-−0.01060.51910.2435−0.12770.76530.19590.7275 and 0.5220
RH−0.20630.0073-0.11800.14270.09160.1532−0.1058
WVP0.53500.1368−0.0455-0.2698−0.10410.79200.5612
P0.35750.0960−0.08230.4038-−0.01900.75600.4127
SD−0.23810.07560.07940.23390.0285-0.1792−0.1420
RNAT0.0668-−0.01240.68920.1914−0.11530.81970.10500.7815 and 0.4675
RH−0.24140.0034-0.15670.11210.08270.1135−0.1131
WVP0.71040.0648−0.0532-0.2121−0.09400.84000.6888
P0.28100.0455−0.09630.5361-−0.01710.74910.3420
SD−0.21500.03580.09290.31060.0224-0.2467−0.1523
INAT0.0415-−0.01230.73400.1578−0.11760.80340.06500.7433 and 0.5067
RH−0.23860.0021-0.16690.09240.08440.1072−0.1081
WVP0.75650.0403−0.0526-0.1748−0.09590.82310.6731
P0.23160.0283−0.09520.5710-−0.01750.71820.2790
SD−0.21940.02230.09180.33080.0184-0.2439−0.1552
Note: bi, rij*bj, riy, R(i), and e denote the direct effect coefficient, indirect effect coefficient, total effect coefficient, decision coefficient, and residual path coefficient, respectively. R represents rain-fed treatment (no water and nitrogen added); I represents irrigation treatment (150 mm water added); RN represents rain-fed plus nitrogen application treatment (225 kg ha−1 nitrogen added); and IN represents irrigation plus nitrogen application treatment (150 mm water and 225 kg ha−1 nitrogen added). WVP, RH, P, SD, and AT represent the monthly scale average water vapor pressure, average relative humidity, average daily precipitation, average daily sunshine duration, and average air temperature, respectively.
Table 2. Collinearity statistics for meteorological factors.
Meteorological FactorsToleranceVIF
AT0.02934.216
RH0.4462.244
WVP0.02737.079
P0.3422.926
SD0.4962.015
Note: VIF represents variance inflation factor.
Table 3. Performance of response models for wheat field CO2-C fluxes relative to different combinations of meteorological factors under different water and nitrogen treatments.
Model NumberMeteorological
Factors
RIRNIN
R2Y (cum)Q2 (cum)R2Y (cum)Q2 (cum)R2Y (cum)Q2 (cum)R2Y (cum)Q2 (cum)
1P, AT, WVP, RH, SD0.6960.6690.6590.6260.7150.6840.6790.641
2P, AT, RH, SD0.6930.6510.6530.6000.6980.6430.6580.593
3P, WVP, RH, SD0.6870.6510.6480.6010.6940.6460.6550.598
4P, AT, WVP, RH0.7140.7020.6760.6620.7330.7160.6960.674
5P, AT, WVP, SD0.7010.6780.6630.6360.7200.6960.6830.655
6P, AT, WVP0.7240.7140.6840.6750.7430.7310.7040.690
7P, AT, RH0.7140.6980.6720.6520.7190.6920.6780.645
8P, AT, SD0.7010.6680.6590.6180.7040.6650.6640.618
9P, WVP, RH0.6960.6780.6580.6360.7000.6730.6610.629
10P, WVP, SD0.7040.6760.6640.6290.7080.6750.6680.628
11P, AT0.7320.7240.6880.6790.7350.7200.6920.675
12P, WVP0.7230.7130.6830.6740.7240.7090.6830.666
Note: R2Y (cum) indicates the degree to which the model fits the dependent variable, and Q2 (cum) is a measure of the predictive ability of the model as assessed by cross-validation.
Table 4. Optimal partial least squares regression model under each water and nitrogen treatment.
RIRNIN
SCUCSCUCSCUCSCUC
AT0.468 # 0.12495.2970.455 # 0.144102.2140.314 # 0.090100.6780.308 # 0.104108.605
WVP----0.322 # 0.069190.0140.315 # 0.085204.925
P0.465 # 0.151952.4500.450 # 0.1371015.1000.287 # 0.135924.9940.275 # 0.126975.974
Const1.075−71.9691.073−21.5531.078−698.7811.063−717.445
Note: SC and UC represent standardized coefficients and unstandardized coefficients, respectively. # value represents the distance from the coefficient to the upper or lower limit of its 95% confidence interval.
Table 5. Validation results for the optimal model under each water and nitrogen treatment.
rRMSE (mg m−2 d−1)SMAPE
R0.985324.0522.01%
I0.988265.7216.40%
RN0.993551.8422.78%
IN0.989517.4019.29%
Note: r, RMSE, and SMAPE denote the correlation coefficient, root mean square error, and symmetric mean absolute percentage error, respectively.
Disclaimer/Publisher’s Note: The statements, opinions and data contained in all publications are solely those of the individual author(s) and contributor(s) and not of MDPI and/or the editor(s). MDPI and/or the editor(s) disclaim responsibility for any injury to people or property resulting from any ideas, methods, instructions or products referred to in the content.

