Article

Identification, Characterization, and Expression Profiling of Maize GATA Gene Family in Response to Abiotic and Biotic Stresses

College of Agriculture, Anhui Science and Technology University, Fengyang 233100, China
*
Author to whom correspondence should be addressed.
These authors contributed equally to this work.
Agronomy 2023, 13(7), 1921; https://doi.org/10.3390/agronomy13071921
Submission received: 20 June 2023 / Revised: 13 July 2023 / Accepted: 17 July 2023 / Published: 20 July 2023
(This article belongs to the Collection Crop Breeding for Stress Tolerance)

Abstract

:
GATA transcription factor is crucial for plant growth and development, physiological metabolism, and environmental response, which has been reported in many plants. Although the identification of maize GATA genes has been reported previously, the number of maize GATA genes was incomplete, and the expression patterns of maize GATA genes were not analyzed. Therefore, in this study, the GATA gene family of maize (Zea mays L.) was systematically analyzed. Forty-one GATA family genes were identified in the maize and were divided into four groups. The gene structure of each subgroup was basically consistent with that of the motif. The maize GATA genes were distributed on 10 chromosomes, including 3 and 17 pairs of tandem and segmental duplication genes, respectively. Fourteen types of cis-acting elements were identified in the promoter sequences of maize GATA family genes, involving four categories: light response, stress, hormone, and growth and development. The tissue-specific expression analysis of maize GATA family genes revealed that 4 GATA genes were highly expressed in almost all the maize tissues, and 11 GATA genes were not expressed in almost all tissues. The other maize GATA family genes showed a tissue-specific expression pattern. The results of RNA-seq reanalysis of publicly available transcriptome sequencing big data revealed that the gene ZmGATA37 was significantly down-regulated in response to abiotic stresses including high temperature, low temperature, drought, waterlogging, and salt, and significantly up-regulated in response to biotic stresses including smut disease, Maize Iranian mosaic virus infection, beet armyworm and aphid infestations. This indicated that the ZmGATA37 gene plays an important role in maize growth and development. Our findings offer new insight into the potential role of GATA transcription factors in abiotic and biotic stresses and provide a theoretical groundwork for the molecular mechanisms underlying maize adaptation to such stress.

1. Introduction

Maize (Zea mays L.) is the largest crop planted in the world, and its total output has surpassed that of rice and wheat [1]. Maize can also be processed into a variety of food and industrial products, including starch, sweeteners, oil, beverages, glue, industrial alcohol, and fuel ethanol [2]. However, the growth and development of maize are easily limited by environmental factors, which can determine a decrease in its yield [3]. Therefore, mining stress-resistant genes and breeding stress-resistant varieties are the most crucial strategies for improving maize quality and yield.
Transcription factors (TFs), also known as trans-acting factors, have a major role in key physiological reactions such as the stress regulation network and signal transduction pathway in plants. They are among the most important regulatory factors ubiquitous in plants [4]. According to the specific sequences of DNA-binding TFs, many vital TF gene families with different functions were observed, including WRKY [5,6], bZIP [7], MYB [8], MADS-box [9] and GATA [10]. Among them, the GATA TF is considered a crucial regulatory protein in biological processes, such as flower development, carbon, and nitrogen metabolism [11], chlorophyll biosynthesis [12], and stress resistance [13]. GATA proteins share a common feature of binding to the specific sequence (T/A) GATA (A/G) [14,15]. The DNA-binding domain of GATA contains a class IV zinc finger structure (C-X2-C-X17–20-C-X2-C), followed by a basal region. Most GATA TFs in plants include a single C-X2-C-X18-C-X2-C motif and several contain C-X2-C-X20-C-X2-C [16,17]. GATA was first found in 1988 in chickens [18]. In 1993, the first plant GATA TF was identified in tobacco [19]. Subsequently, the GATA gene family was found in Arabidopsis thaliana [20], rice [21], soybean [22], cotton [23], rapeseed [24], tomato [16], and other plant species. The GATA protein is also crucial for the regulation of light [25], low nitrogen [22], low temperature [26], salt [16,24] and phytohormones [27,28]. In A. thaliana, GATA12 has been identified as the downstream response factor of the DELLA protein RGL2, which is a key transcriptional repressor of gibberellic acid signaling and participates in regulating seed germination [29]. In rice, OsGATA12 overexpression decreased the number of leaves and tillers, thus affecting yield-related traits [30]. OsGATA7 modulates brassinosteroid-mediated architecture regulation and affects grain shape and yield [31]. PdGATA19 is responsible for photosynthesis and growth in poplar [32]. Low nitrogen treatment led to GATA44 and GATA58 repression in soybean seedlings [22].
Using the high-quality genome information of maize, numerous gene families have been identified in the maize, such as NBS-LRR [33], NAC [34], MAPK [35], and HSP70 [36]. Although some studies have reported the identification of maize GATA family genes [37], they were identified based on the genome information of the maize B73_V3 version. Therefore, the genome identification of maize GATA family genes was incomplete. Moreover, previous studies did not analyze the expression patterns of maize GATA family genes under abiotic and biotic stresses, which greatly limited the biological function research of maize GATA genes.
In this study, the GATA family genes were identified with the maize B73_V4 genome using bioinformatics, and the physicochemical characteristics, chromosome location, gene structure, phylogenetic tree, and collinearity of maize GATA family members were analyzed. Then, based on the big data of maize transcriptome sequencing, transcriptome sequencing analysis was re-performed using the genome information of the maize B73_V4 version. The tissue-specific expression analysis and the expression pattern analysis of the maize GATA gene family in response to stresses were completed. These results preliminarily proved the biological function of GATA family genes in maize growth and development. These findings lay a major foundation for further research on maize GATA gene function and provide favorable genes for molecular breeding of maize resistance.

2. Materials and Methods

2.1. Identification and Chromosome Mapping of GATA Family Genes in Maize

The HMM model file (PF00320) of the GATA gene family was downloaded from the Pfam database (http://pfam.xfam.org/ (accessed on 26 February 2023)) [38]. The maize B73_V4 protein sequence file was downloaded from the maize genome database (https://download.maizegdb.org/Zm-B73-REFERENCE-GRAMENE-4.0/ (accessed on 26 February 2023)) to build a local protein database. HMMER 3.0 software (version 3.0; Robert D Finn, Ashburn, VA, USA, 2015) was used to search for GATA domain-containing sequences in the maize protein database [39]. The sequence information of the candidate proteins was extracted using a Perl script, and the potential GATA gene sequences were verified using online tools such as Pfam and SMART (http://smart.embl.de/smart/batch.pl (accessed on 26 February 2023)) [40]. GATA domain-containing sequences were selected to determine GATA gene family members in maize. Based on the results of Arabidopsis GATA genes [20], the Arabidopsis GATA family genes were downloaded from the Arabidopsis genome database (https://www.arabidopsis.org/ (accessed on 26 February 2023)). The physicochemical properties of maize GATA family genes were analyzed, such as the amino acid number, molecular weight, isoelectric point, instability coefficient, aliphatic index, and average hydrophilicity, using the online ExPASy tool (https://web.expasy.org/protparam/ (accessed on 27 February 2023)). The subcellular localization of maize GATA genes was predicted using the online website WoLF PSORT (https://wolfpsort.hgc.jp/ (accessed on 28 February 2023)) [41]. A chromosomal distribution map of the maize GATA family genes was drawn using TBtools software (version 1.120) [42].

2.2. Phylogenetic Analysis of GATA Family Genes in Maize

Based on the studies of GATA family genes in Arabidopsis [20] and rice [21], the sequences of 29 A. thaliana and 28 rice GATA proteins were downloaded, respectively. Multiple alignments of GATA protein sequences of maize, Arabidopsis, and rice were performed by Muscle in MEGA 7 [43] with default parameters. Based on the alignments, phylogenetic trees were constructed using the maximum likelihood method with 1000 bootstrap replicates. The parameters were the Poisson model, uniform rates, and partial deletion. The trees were visualized and optimized through Evolview [44] (http://www.evolgenius.info/evolview (accessed on 28 February 2023)). PlantCare (http://bioinformatics.psb.ugent.be/webtools/plancare/html/ (accessed on 28 February 2023)) was used to analyze the cis-acting elements of promoters of maize GATA family genes [45].

2.3. Collinearity Analysis of GATA Family Genes in Maize

MCScanX software (https://github.com/wyp1125/MCScanX (accessed on 19 June 2023)) (University of Georgia, Athens, GA, USA, 2012) [46] was used to analyze the interspecific collinearity of maize GATA genes with Arabidopsis and rice GATA genes, and Circos software (http://circos.ca/software/ (accessed on 19 June 2023)) [47] was used to visualize this interspecific collinearity.

2.4. Reanalysis of Maize Transcriptome Sequencing Big Data through RNA-Seq

The published maize transcriptome sequencing data in the SRA database were downloaded and converted into Fastq data using Fastq-dump.2.11.0. Then, FastQC software (https://github.com/s-andrews/FastQC (accessed on 19 June 2023)) was used to determine the quality of Fastq data [48]. Trimmomatic software (version 0.39) [49] was used to remove joints and low-quality sequences of Fastq data, and finally, the filtered clean data were obtained. The maize B73_V4 genome index was constructed by STAR software (version 2.7.10a). The filtered clean data were compared with the maize B73_V4 genome to generate a SAM file. The SAM file was converted into a sorted BAM file using SAMtools software (version 1.15) [50]. StringTie software (v2.2.1) was used to estimate the expression data of each gene [51]. Finally, according to the count data of each gene, the differentially expressed genes were analyzed by DESeq2 software [52].

2.5. Tissue-Specific Expression Analysis of GATA Family Genes in Maize

The transcriptome sequencing data of different maize tissues (PRJNA171684) was searched in the NCBI database (https://www.ncbi.nlm.nih.gov/ (accessed on 1 March 2023)) [53], and the transcriptome sequencing data were reanalyzed using the maize B73_V4 genome information. Then, the expression heatmap of maize GATA family genes in different tissues was drawn using TBtools software.

2.6. Expression Pattern Analysis of GATA Family Genes in Maize under Abiotic Stress and Biotic Stress

The transcriptome sequencing data of maize under abiotic stresses, including temperature (PRJNA645274) [54], drought (PRJNA545969) [55], waterlogging (PRJNA606824) [56], and salt (PRJNA414300) stresses [57], and biotic stresses, including smut disease (PRJNA673988) [58], Maize Iranian mosaic virus infection (PRJNA427399) [59], beet armyworm infestation (PRJNA625224) [60], and aphid infection (PRJCA003201) [61], were retrieved from the NCBI database and reanalyzed using the maize B73_V4 version genome information. The heatmap of maize GATA family genes was drawn using TBtools software.

2.7. Protein Interaction Network Prediction

By referring to the STRING website (http://string-db.org/cgi (accessed on 5 March 2023)) [62], 41 maize GATA protein interactions were predicted on the basis of the maize protein database, and a maize GATA protein interaction network model was constructed for predicting the interactions between GATA family member proteins and other proteins in maize.

3. Results

3.1. Basic Information of GATA Gene Family Members in Maize

Based on the published maize B73_V4 genome information, 41 members of the GATA gene family were identified in the whole maize genome by using the bioinformatics method. The CDS sizes of the maize GATA genes ranged from 420 to 2565 bp, the number of amino acids encoded ranged from 139 to 854, the molecular weight varied from 14.87 to 94.10 kD, and the aliphatic index ranged from 45.76 to 81.17. The theoretical isoelectric points of 41 GATA proteins were between 4.61 and 10.23. All 41 GATA proteins were stable (instability indices were >40). The average hydrophilicity of the 41 GATA proteins was less than zero, which indicated that they were hydrophilic. The prediction of subcellular localization revealed that the maize GATA genes were mainly located in the nucleus and chloroplast (Table 1).

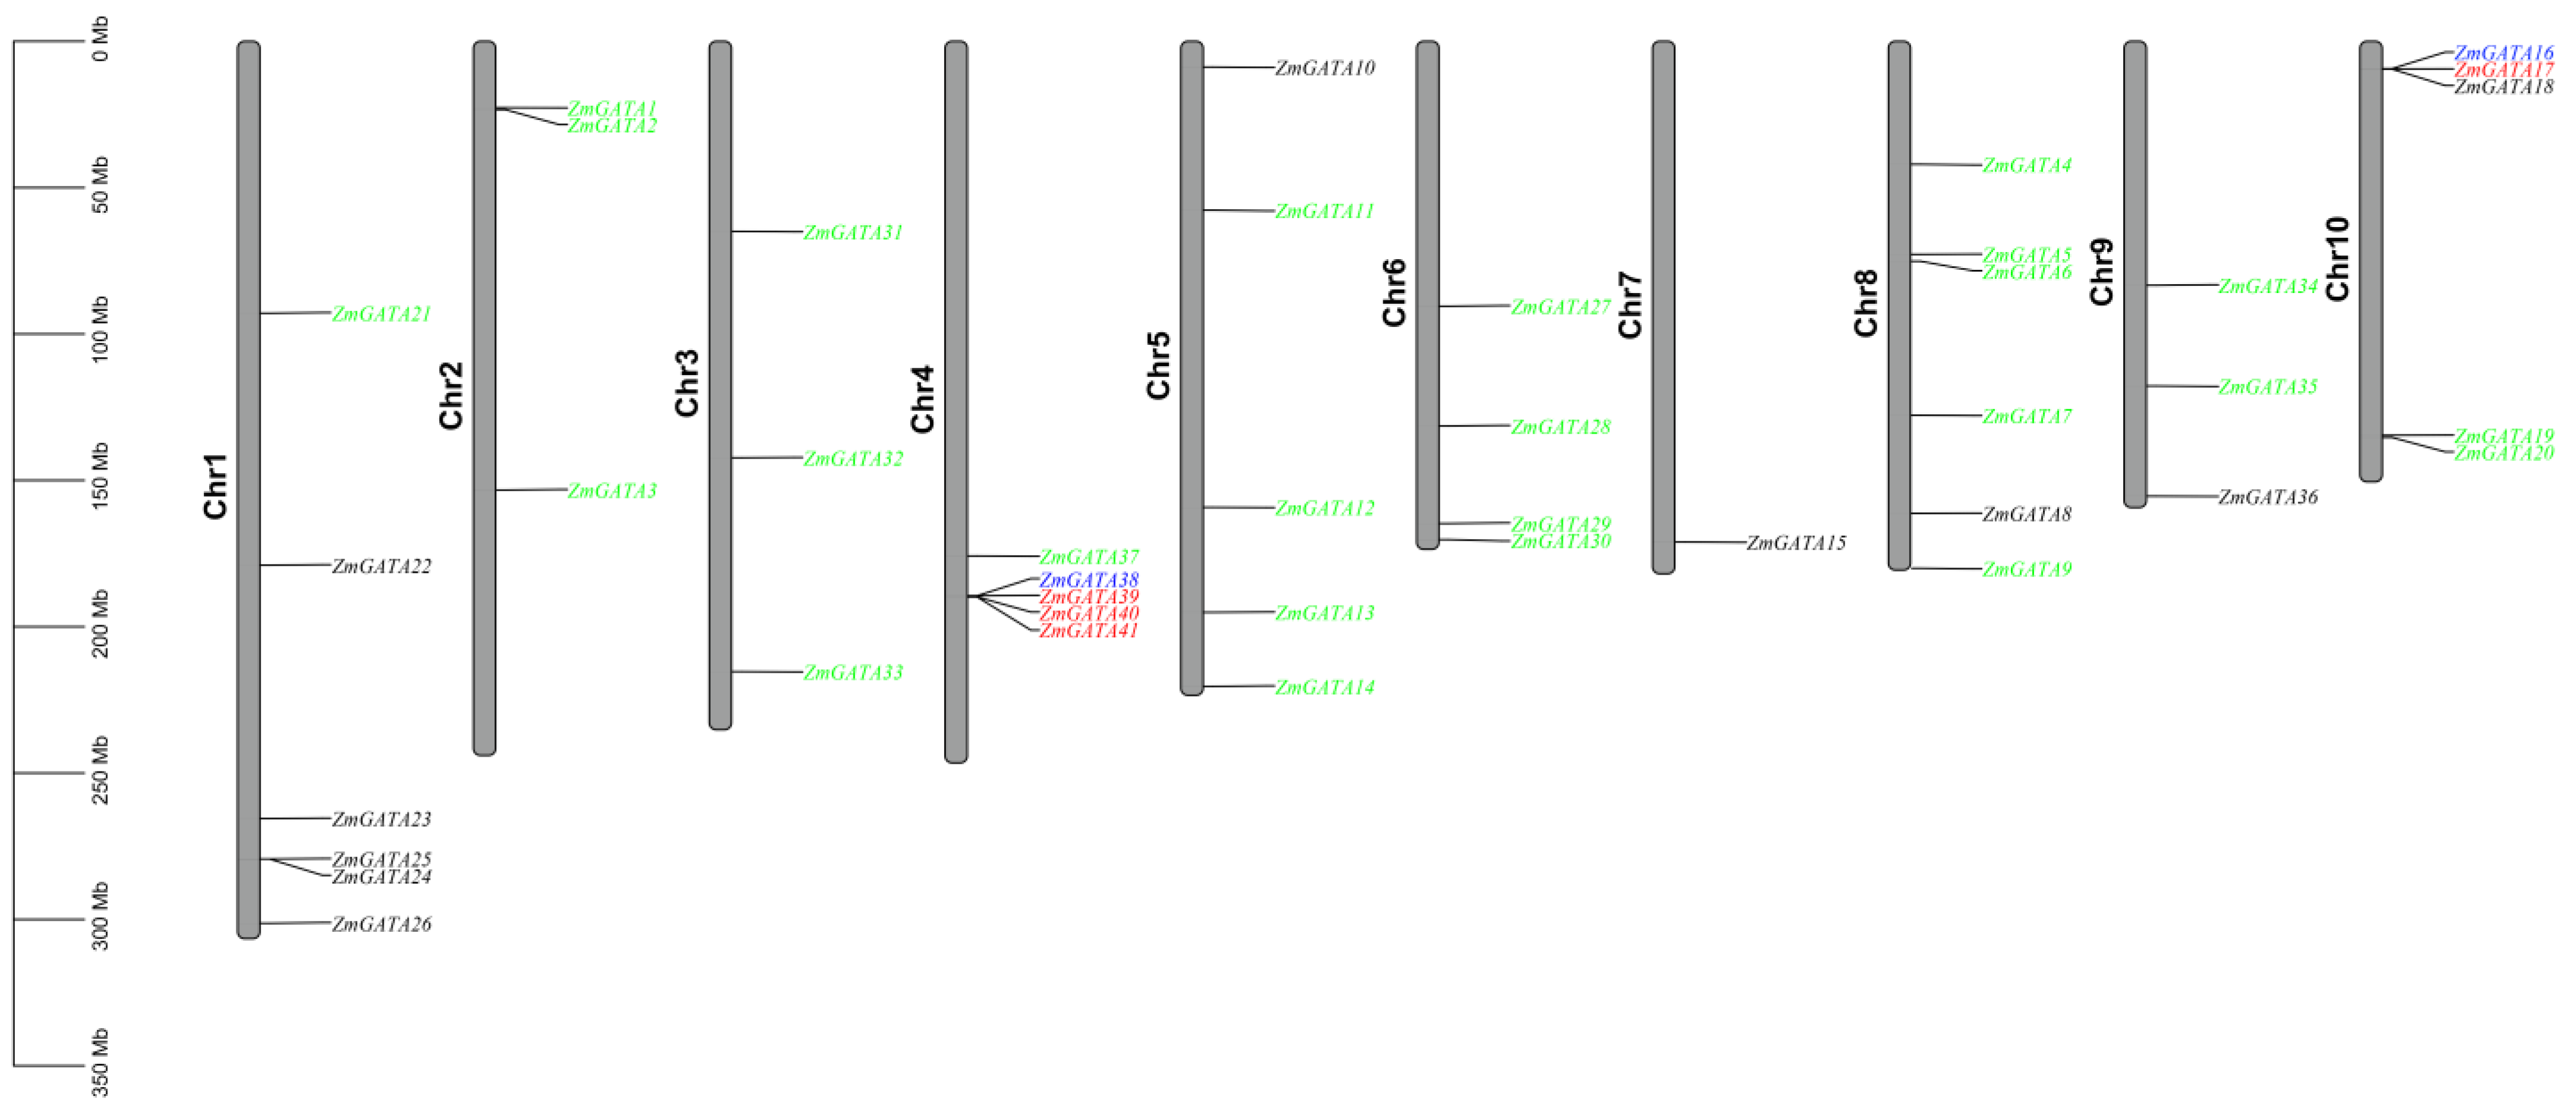
3.2. Chromosome Mapping of GATA Family Genes in Maize

Based on the results of the chromosome location analysis of the 41 GATA family genes in maize, the distributing graph of the GATA genes on maize chromosomes was drawn. As shown in Figure 1, the 41 genes were unevenly distributed on each maize chromosome. Six GATA genes were located on chromosomes 1 and 8, respectively, which contained the largest number of GATA genes. Only one GATA gene was located on chromosome 7, which contained the fewest number of GATA genes. ZmGATA16/ZmGATA17, ZmGATA38/ZmGATA39, and ZmGATA40/ZmGATA41 were tandem duplication gene pairs. ZmGATA1/ZmGATA20, ZmGATA2/ZmGATA13, ZmGATA2/ZmGATA19, ZmGATA3/ZmGATA38, ZmGATA4/ZmGATA28, ZmGATA5/ZmGATA33, ZmGATA6/ZmGATA30, ZmGATA7/ZmGATA9, ZmGATA7/ZmGATA9, ZmGATA9/ZmGATA29, ZmGATA11/ZmGATA27, ZmGATA12/ZmGATA34, ZmGATA13/ZmGATA19, ZmGATA14/ZmGATA37, ZmGATA16/ZmGATA32, ZmGATA21/ZmGATA35, and ZmGATA28/ZmGATA31 were segmental duplication gene pairs (Figure 1).

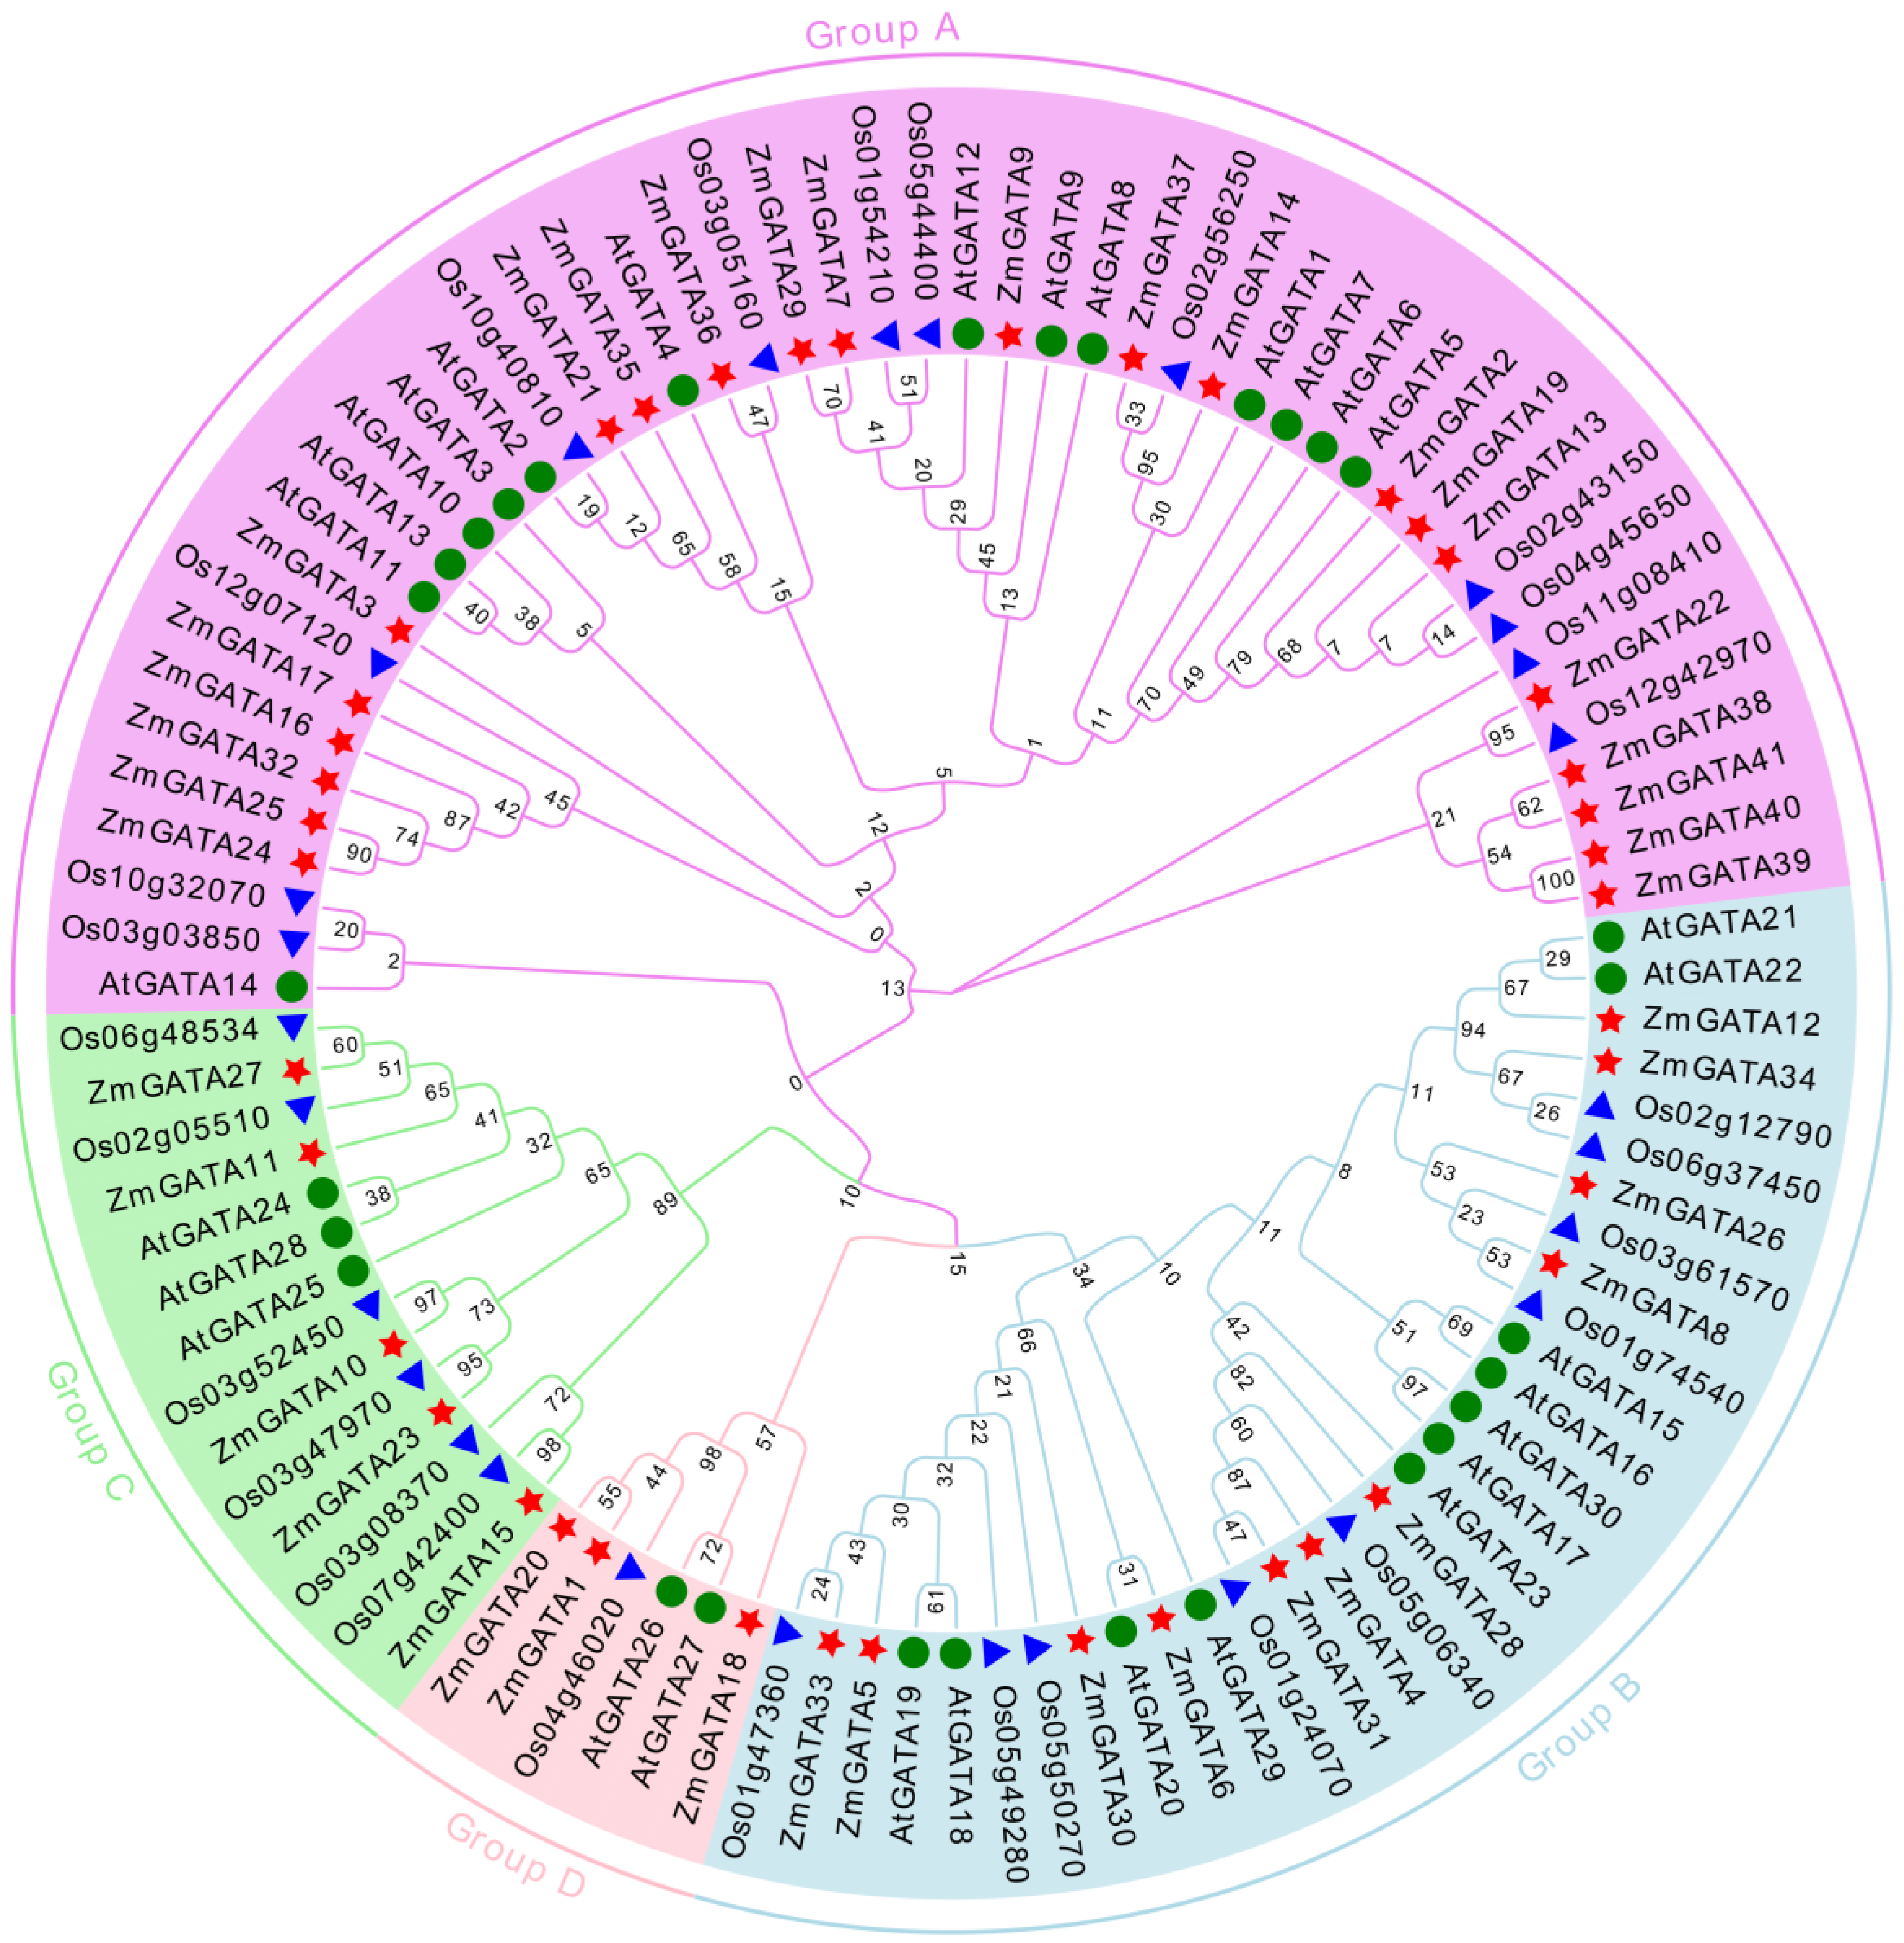
3.3. Cluster Analysis of GATA Family Genes in Maize, A. thaliana, and Rice

To completely clarify the genetic relationship and biological function of maize GATA family genes, the identified maize GATA genes and the GATA family gene members in the model plants Arabidopsis and rice were clustered through multi-sequence alignment, and a phylogenetic tree was constructed (Figure 2). According to the classification results of the Arabidopsis GATA gene family, the phylogenetic tree was divided into four subgroups, namely Group A, Group B, Group C, and Group D. The largest number of maize GATA genes (22) was in subgroup A, and 11 maize GATA genes were present in Group B. Five maize GATA genes were present in Group C, and three maize GATA genes were present in Group D. GATA genes in similar subgroups had a similar structure and function. Thus, the biological function of the maize GATA genes could be inferred based on the results of similar genes in A. thaliana and rice.

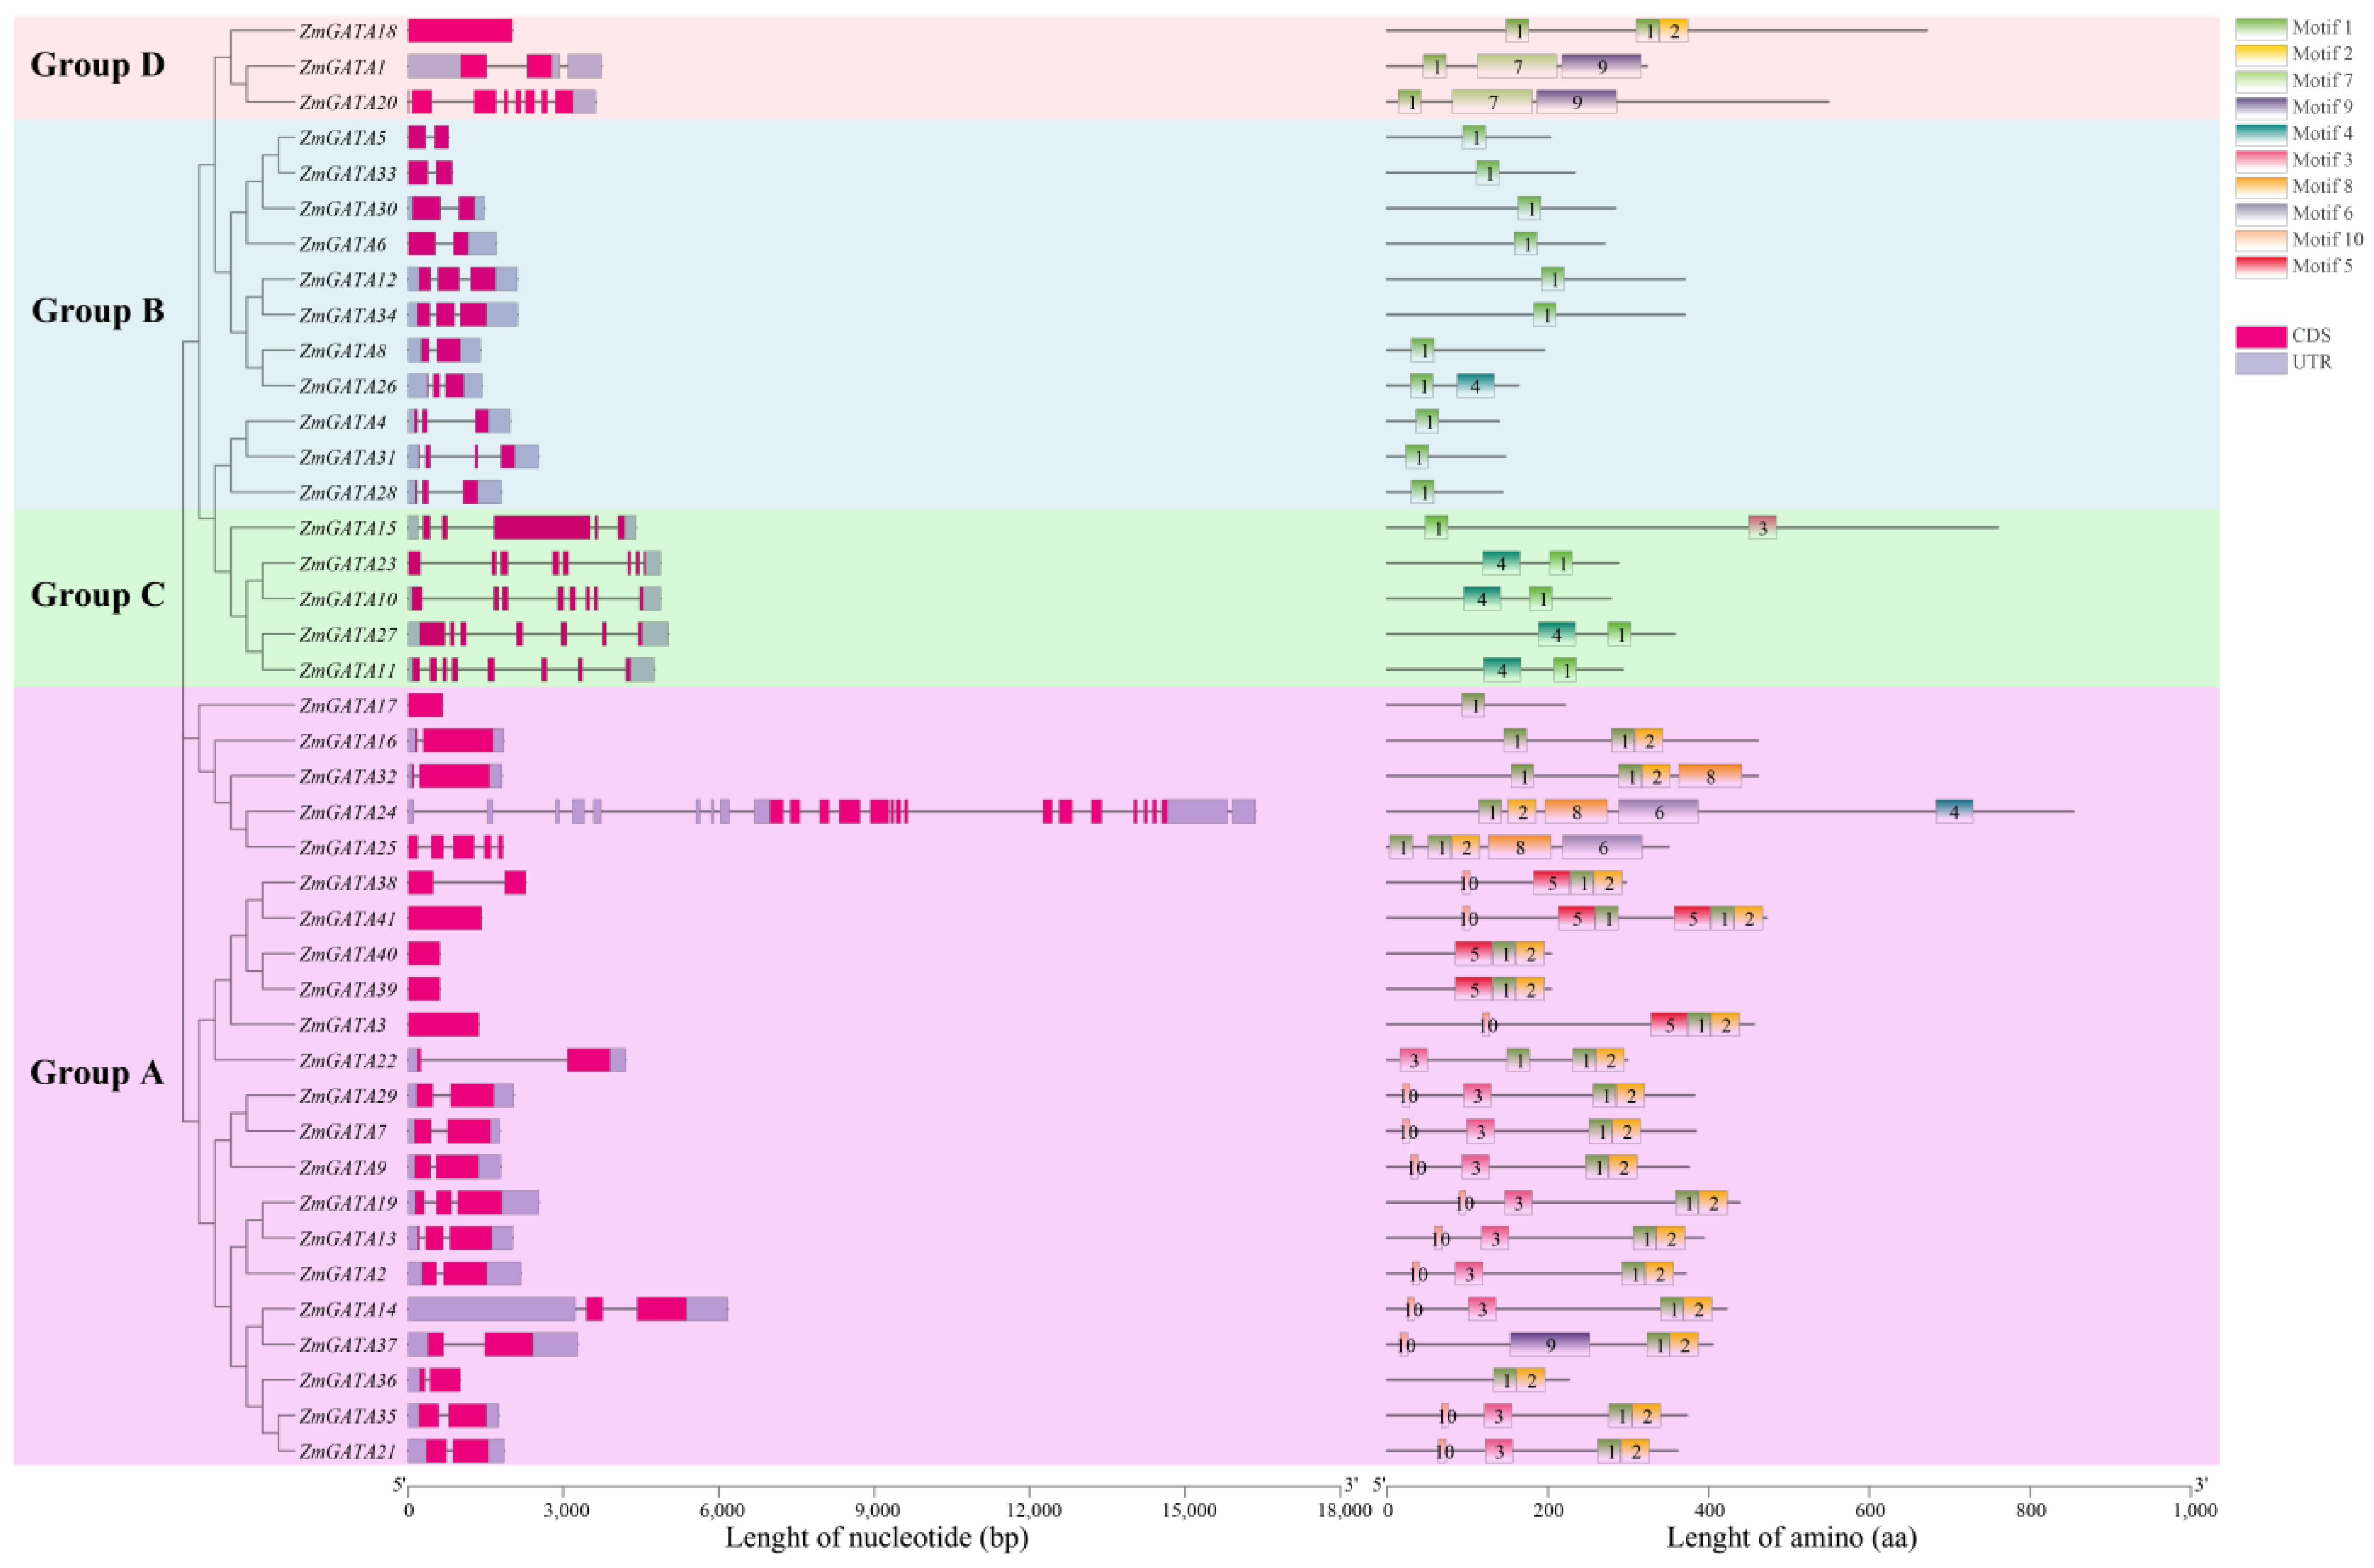
3.4. Gene Structure and Conservated Sequence Analysis of GATA Family in Maize

TBtools software (version 1.120) was used to draw the cluster analysis diagram and structural schematic diagram of maize GATA family genes. Based on the diagrams, we found that the maize GATA family genes were clustered into four subfamilies, namely Group A, Group B, Group C, and Group D (Figure 3). These results were consistent with the cluster results of GATA genes from maize, Arabidopsis, and rice (Figure 2). The conservative motif analysis of maize GATA proteins was performed using MEME and TBtools online software (Table 2). According to the structural diagram of maize GATA family genes, the conserved sequences of GATA proteins in different subgroups were different, whereas those in the same subgroup were the same. For example, most GATA genes in Group A contained motifs 10, 3, 1, and 2, and had the same arrangement order, while most GATA genes in Group C contained motifs 4 and 1, and had the same arrangement order. This indicated that different motif distributions in different subgroups may lead to the evolution of the functional diversity of maize GATA genes. The GATA genes in the same subgroup have similar conserved motifs, indicating that they have similar functions.

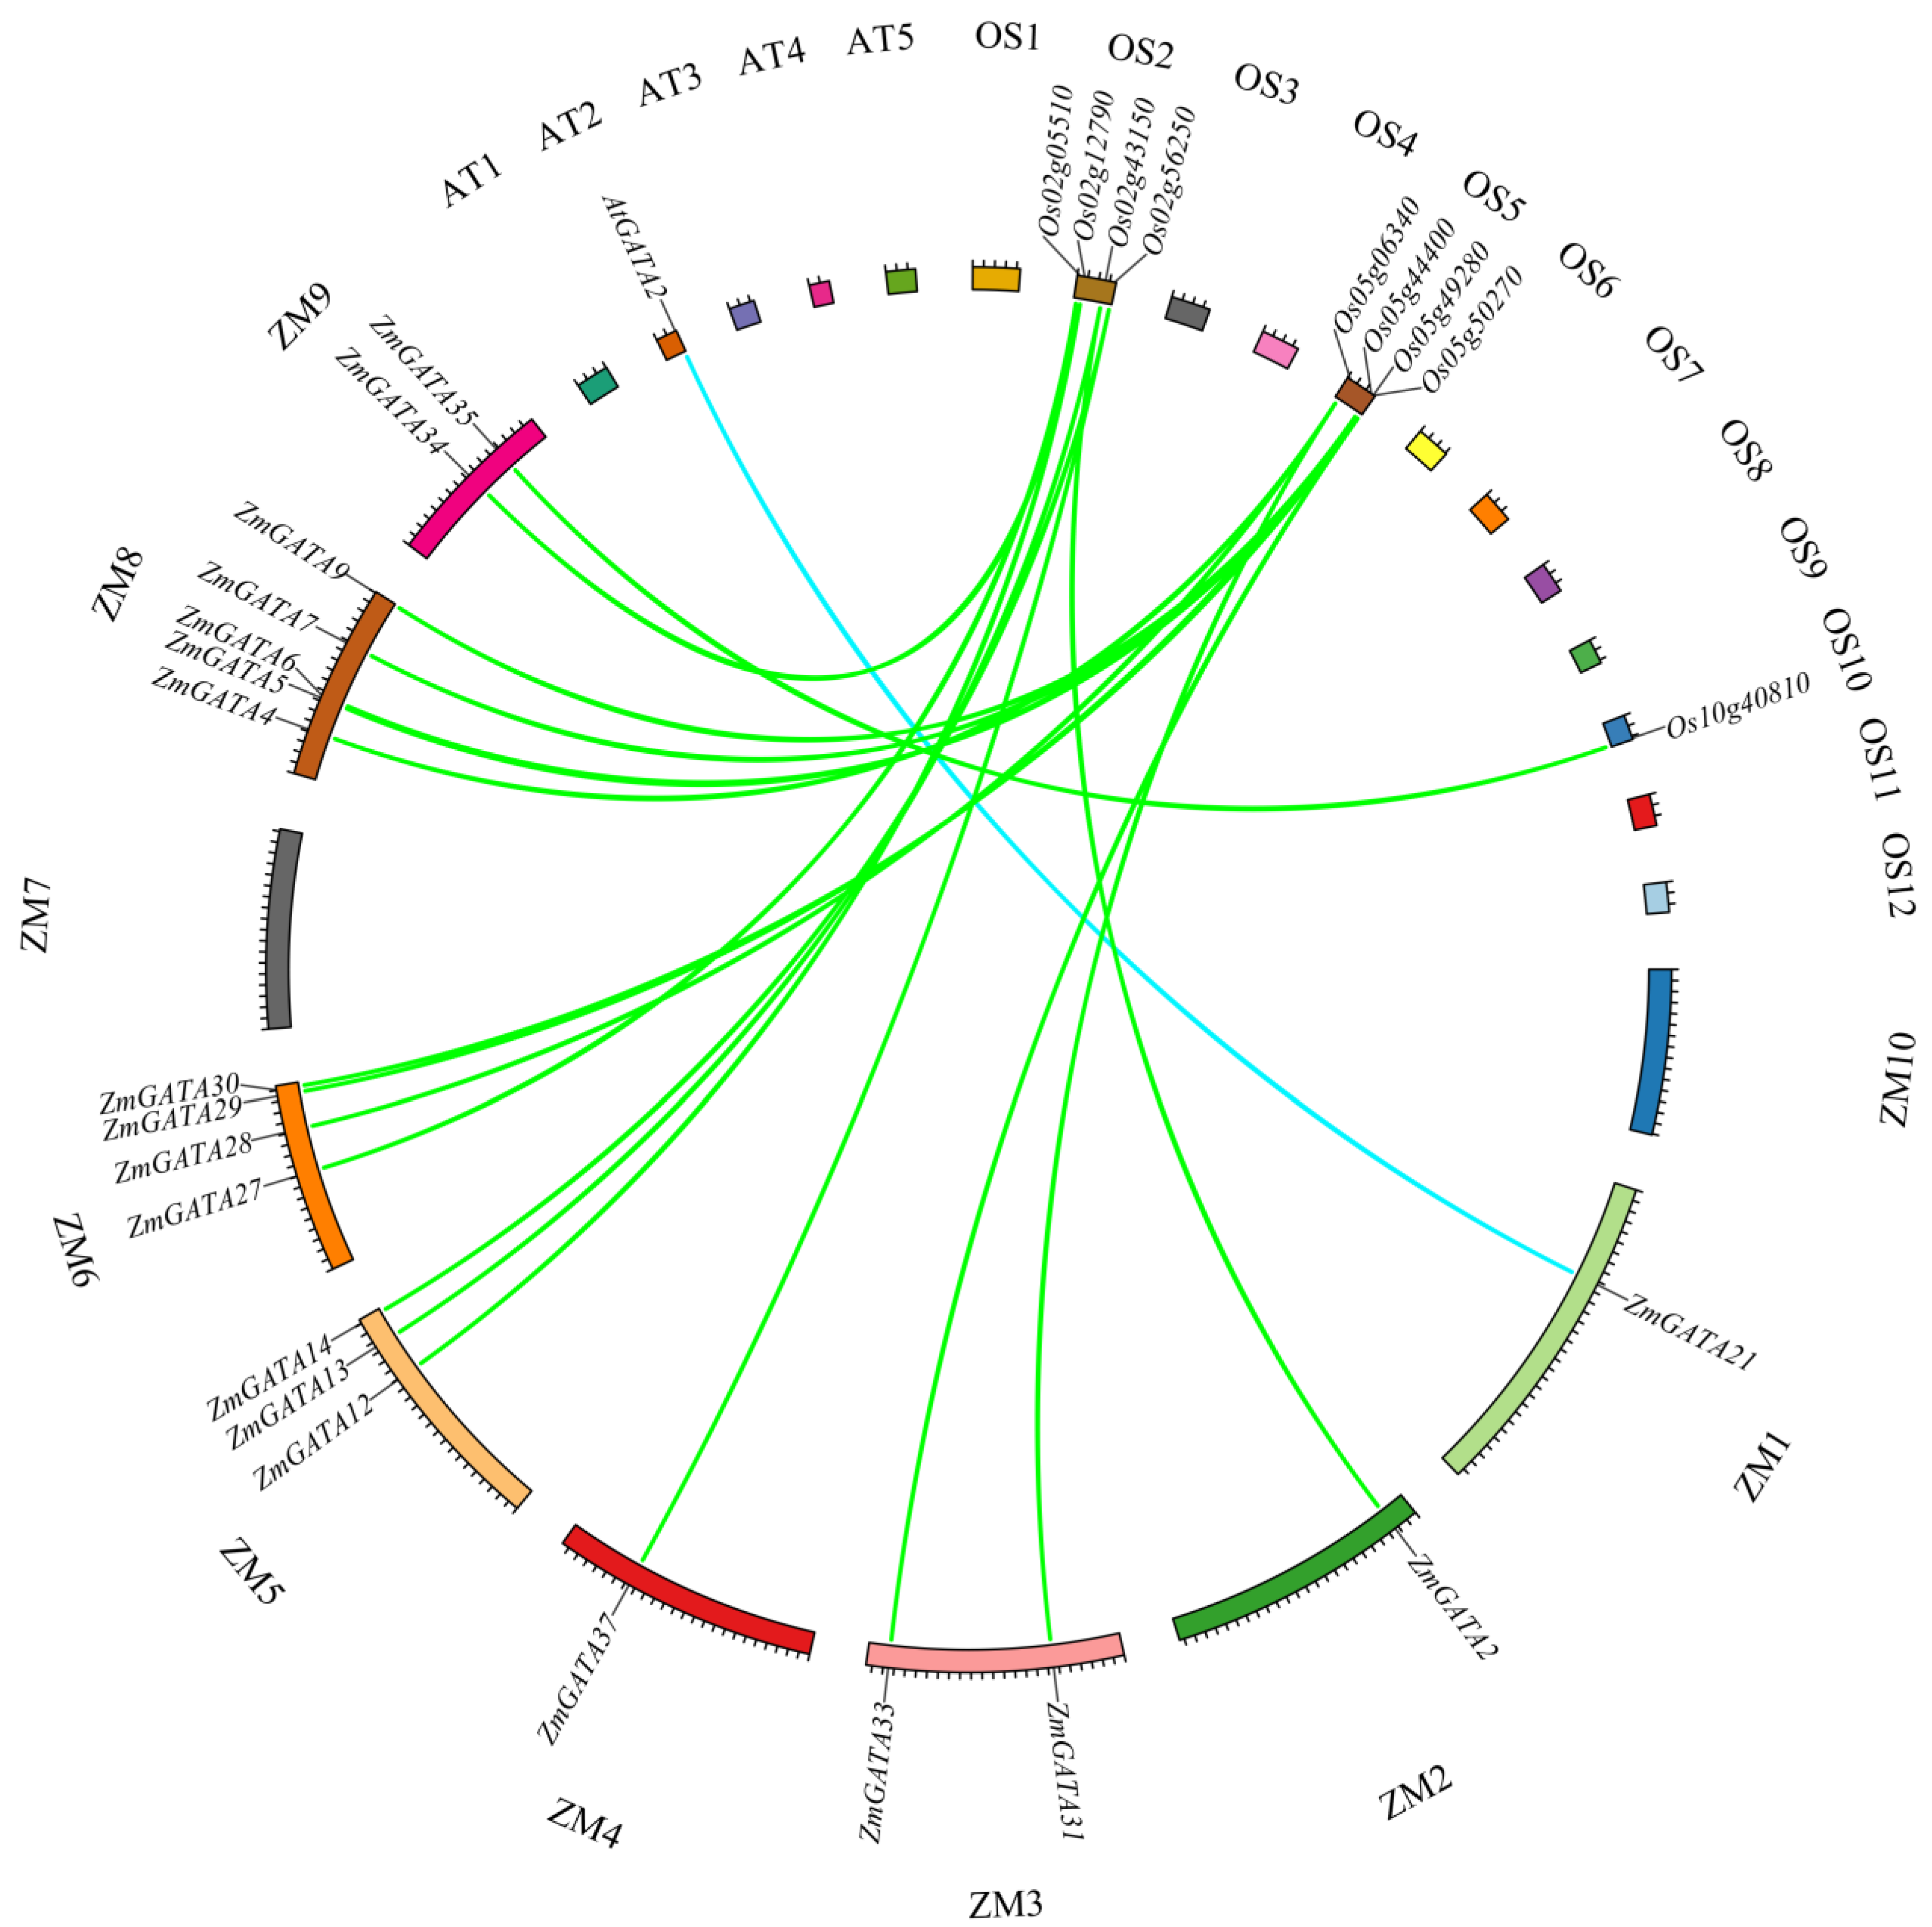
3.5. Collinearity Analysis of GATA Family Genes in Maize, A. thaliana, and Rice

The collinearity analysis of GATA family genes in A. thaliana, maize, and rice showed that one maize GATA gene (ZmGATA21) had a collinearity relationship with one Arabidopsis GATA gene (AtGATA2). Eighteen maize GATA genes (ZmGATA2, ZmGATA31, ZmGATA33, ZmGATA37, ZmGATA12, ZmGATA13, ZmGATA14, ZmGATA27, ZmGATA28, ZmGATA29, ZmGATA30, ZmGATA4, ZmGATA5, ZmGATA6, ZmGATA7, ZmGATA9, ZmGATA34, and ZmGATA35) and nine rice GATA genes (OsGATA17, OsGATA11, OsGATA2, OsGATA3, OsGATA13, OsGAT6, OsGATA14, OsGATA15, and OsGATA7) had eighteen collinear relationships (Figure 4). More collinearity was observed between monocotyledonous plants (maize and rice), whereas collinearity was less between the monocotyledonous plant maize and the dicotyledonous plant A. thaliana. This may be because maize and rice are both monocotyledonous gramineous plants and thus have a closer genetic relationship.

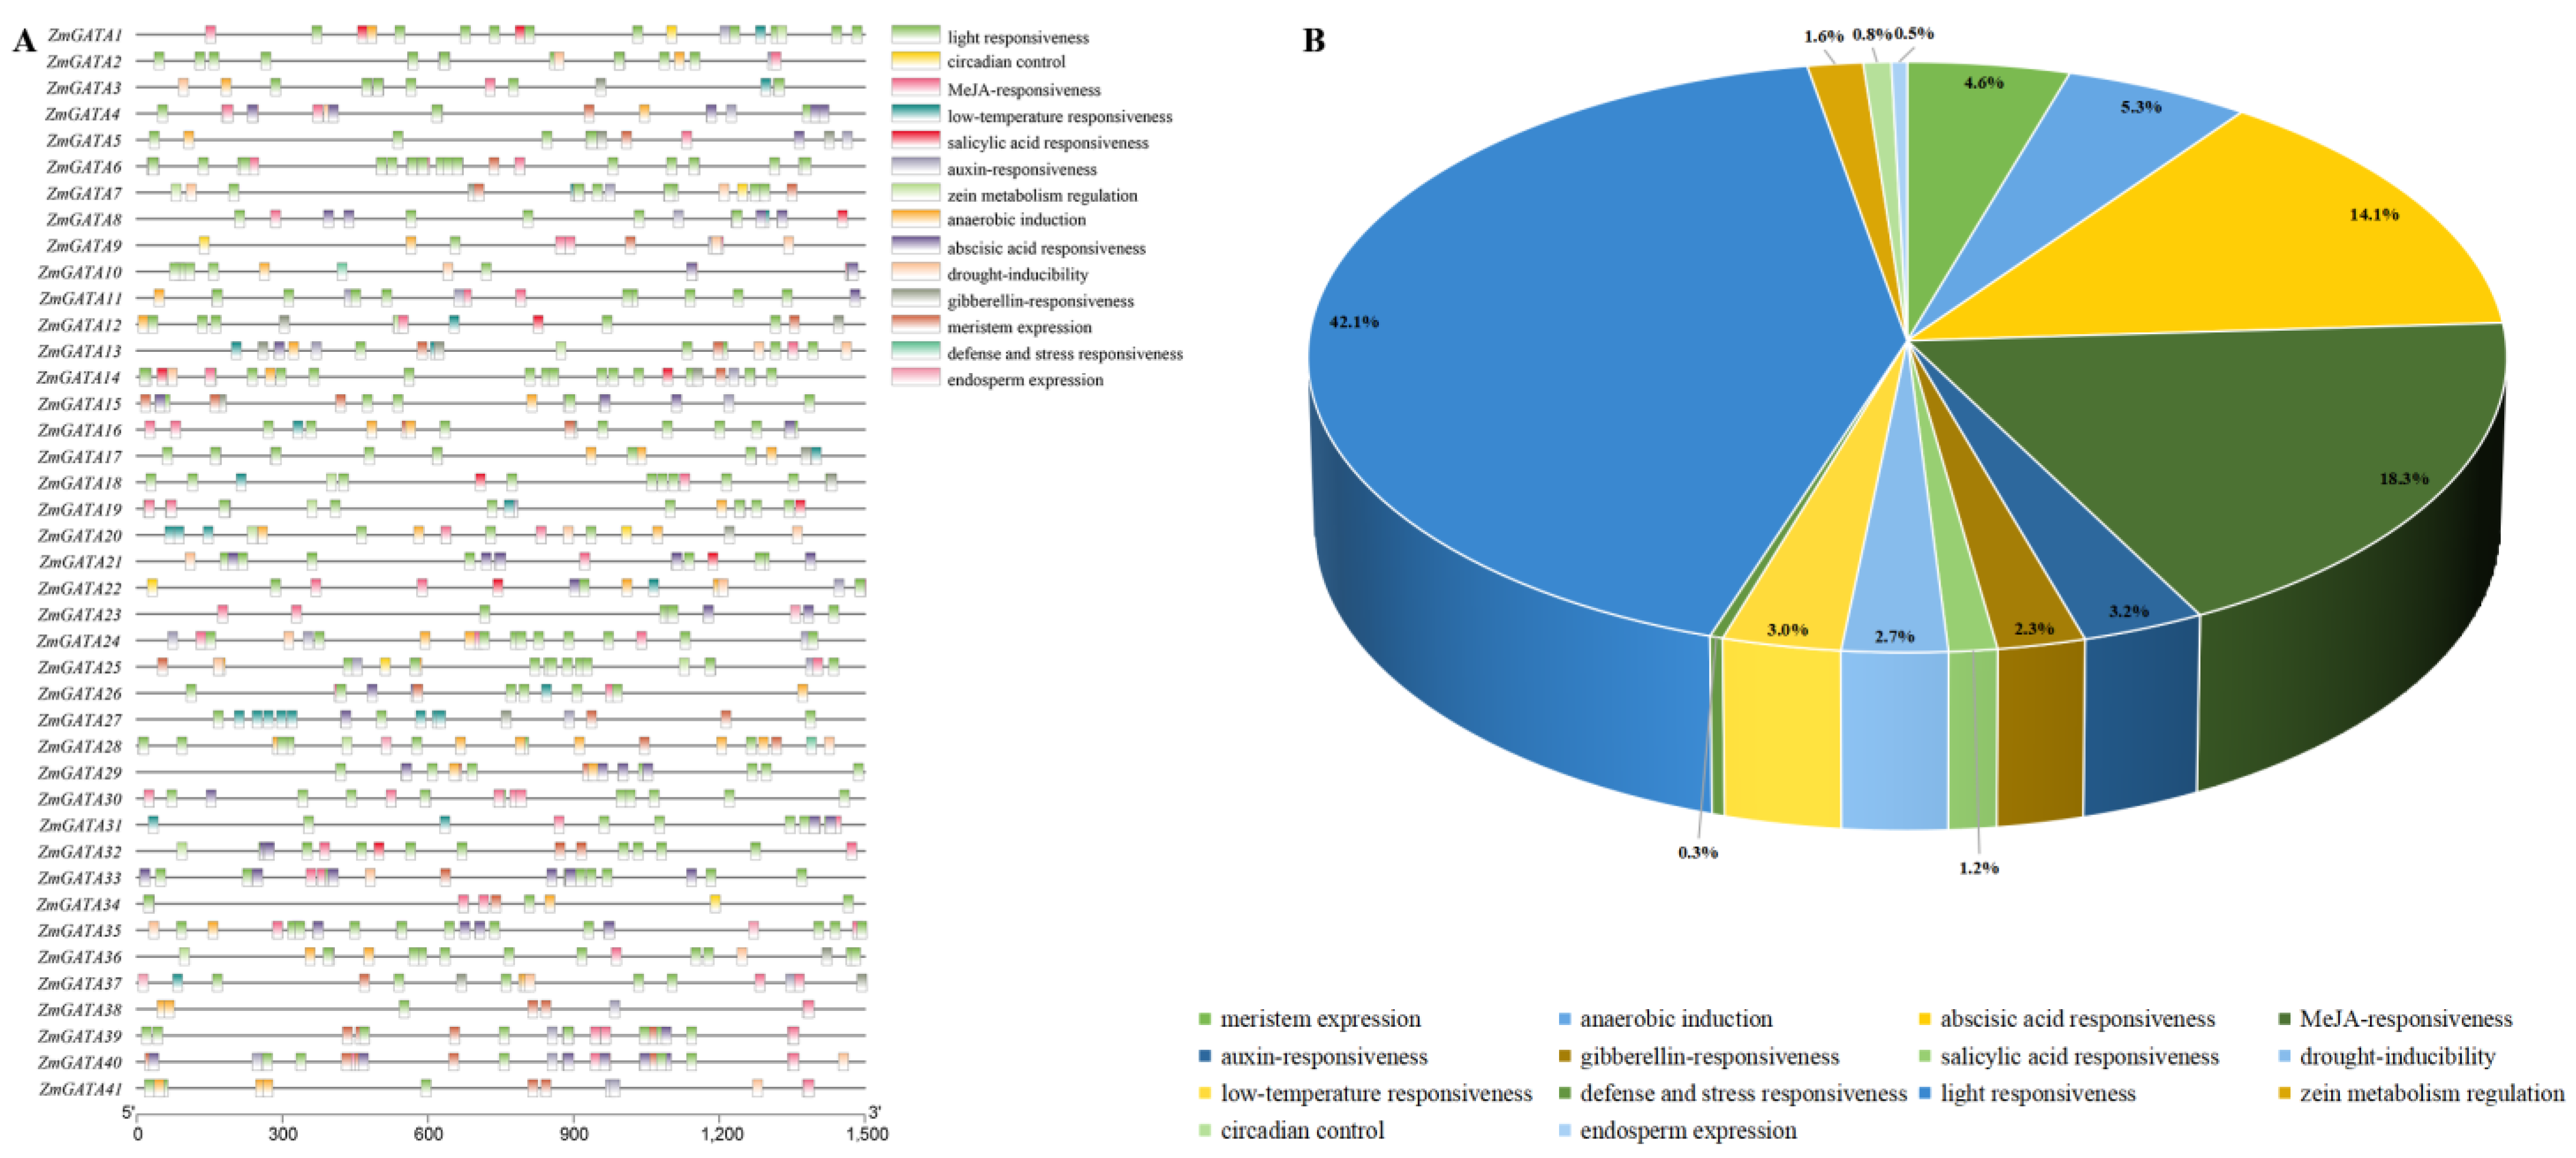
3.6. Analysis of Cis-Acting Elements of Promoter Sequences of GATA Family Genes in Maize

In total, 14 types of cis-acting elements were identified in the promoter sequences of maize GATA family genes (Figure 5). Among them, the light response-related cis-acting elements were the most, including ABRE, G-box, ARE, and Box 4, accounting for 42% of the total cis-acting elements. In addition, some other cis-acting elements related to hormone (MeJA, salicylic acid, auxin, abscisic acid, gibberellin) response, stress (drought, low-temperature) response, circadian control, meristem expression, and endosperm expression were also identified. Different GATA gene promoter regions had different cis-acting element members, which indicated that the maize GATA gene plays various functions during plant growth and development.

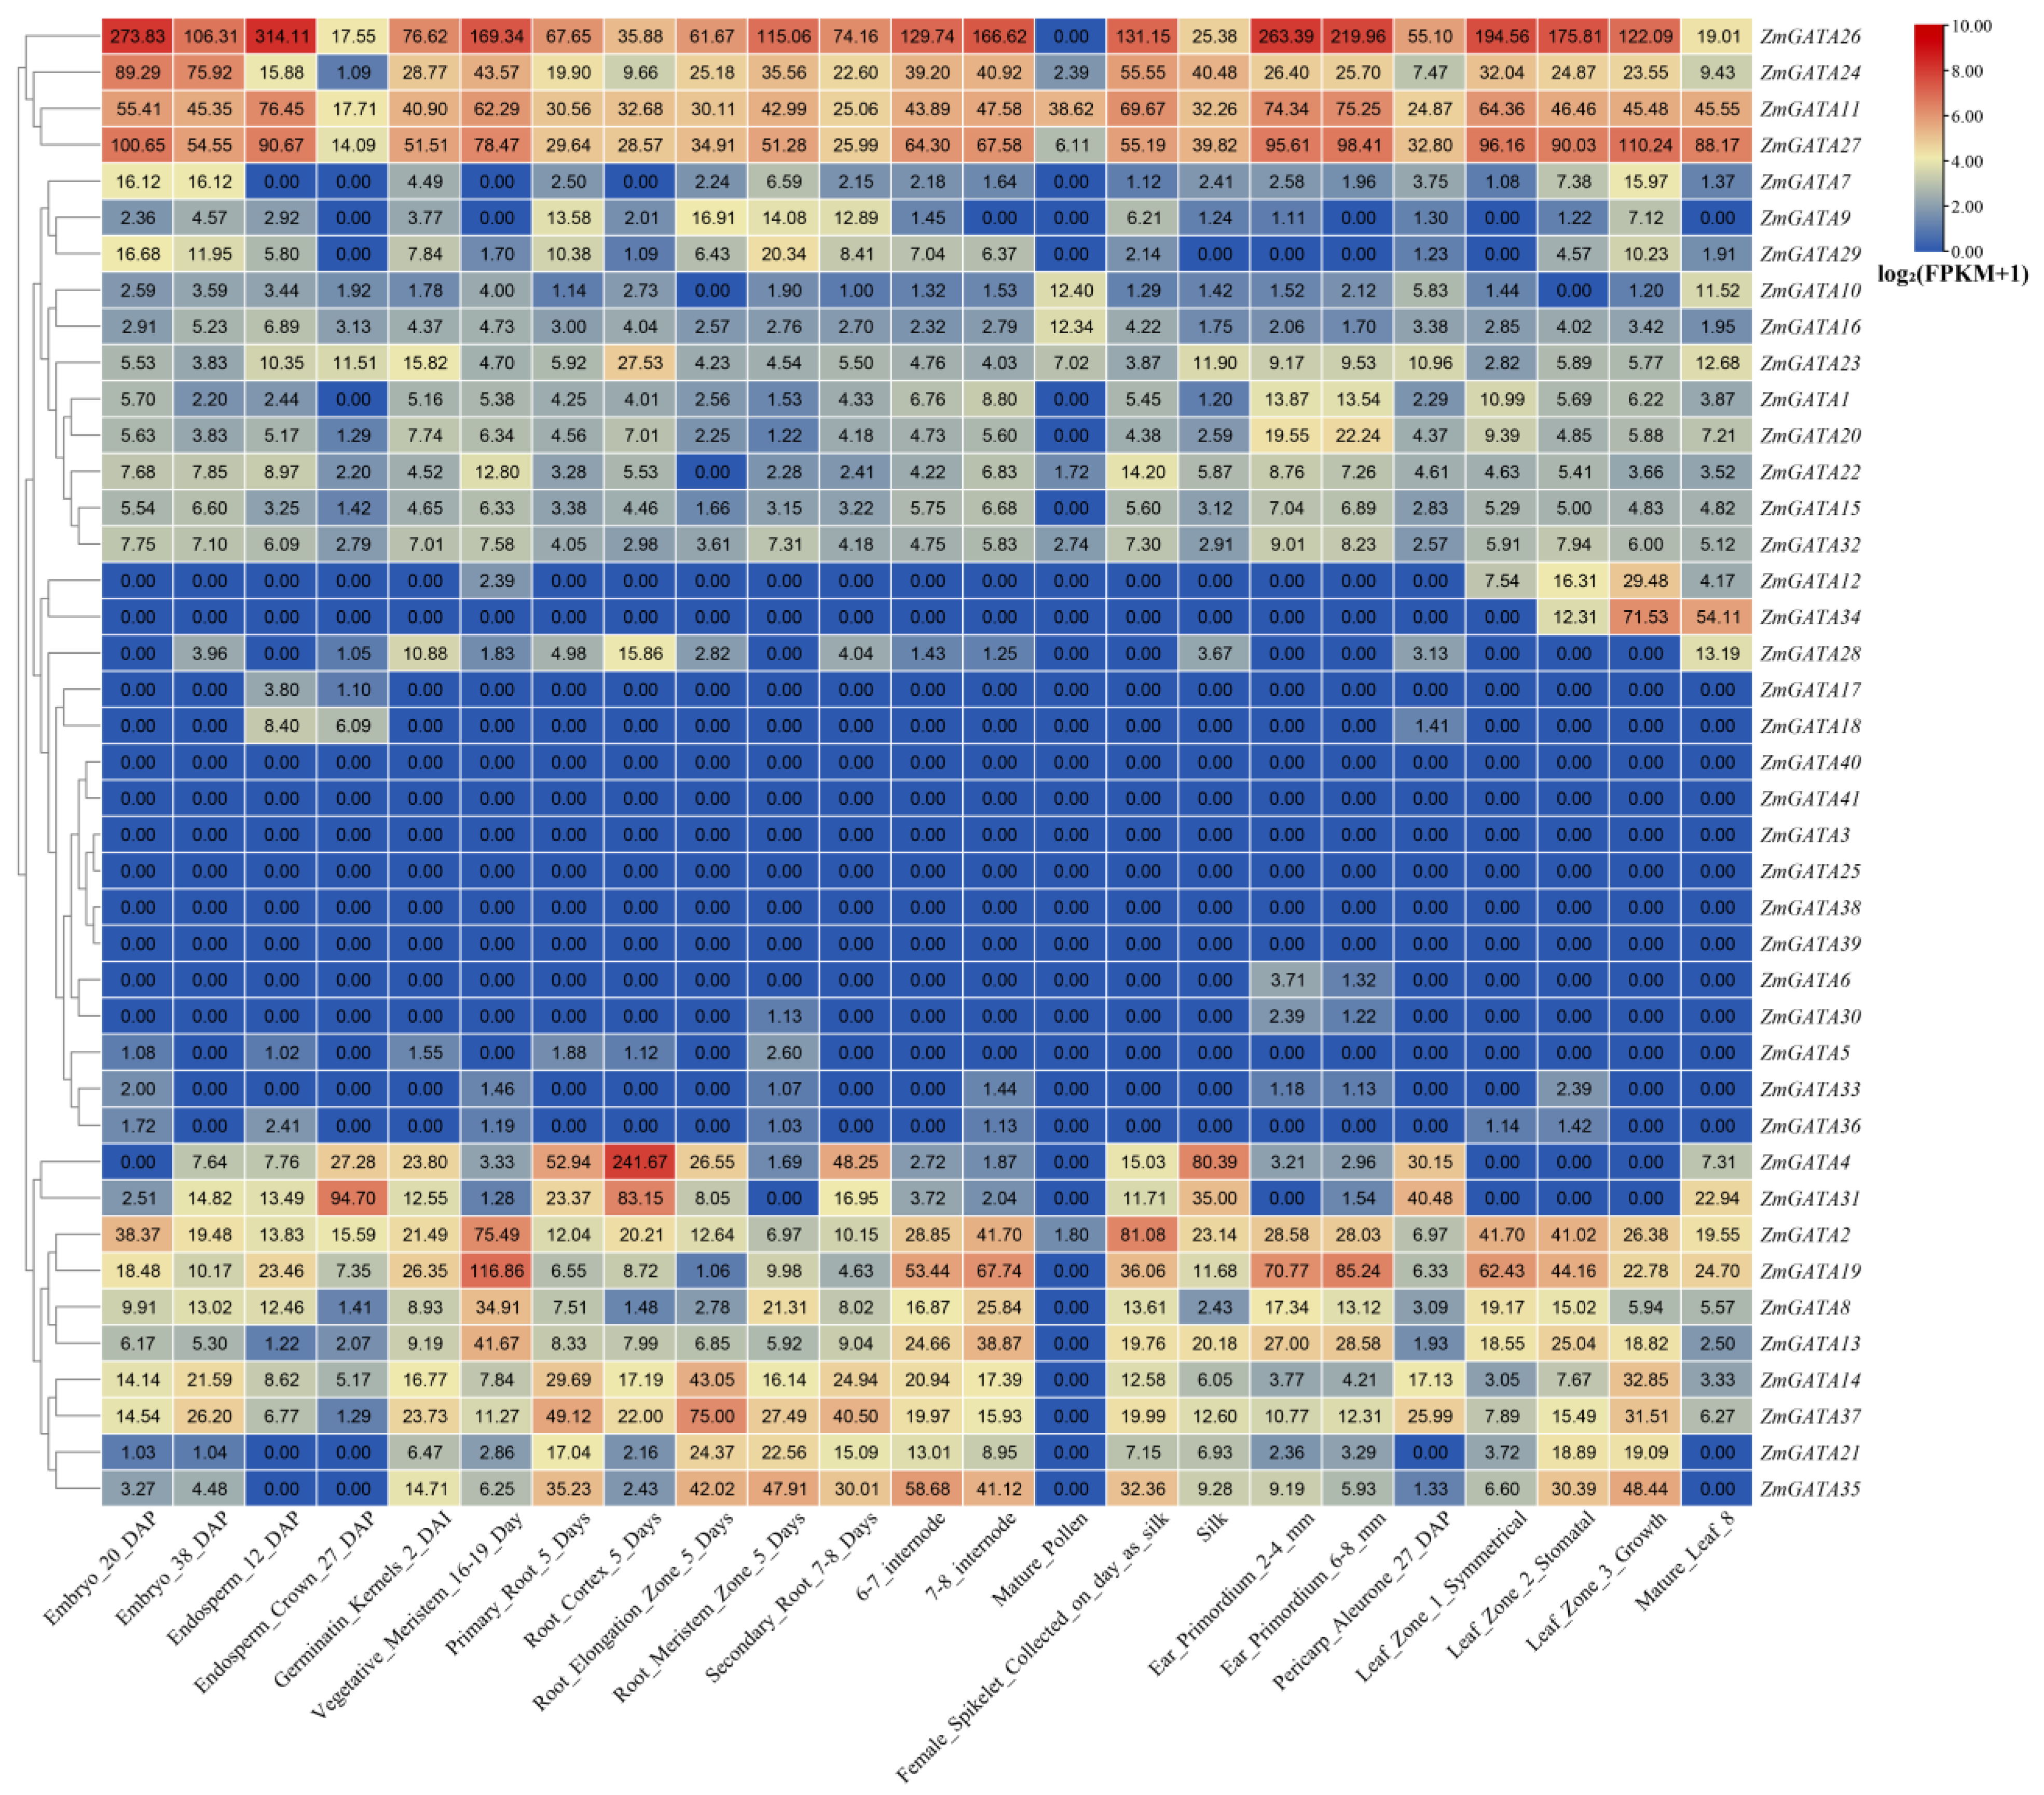
3.7. Tissue-Specific Expression Analysis of GATA Family Genes in Maize

Based on the published transcriptome sequencing data of different maize tissues (PRJNA171684) [53], transcriptome sequencing analysis was re-performed using the maize B73_V4 genome information. The expression heatmap of the maize GATA family genes in different tissues was drawn (Figure 6). The expression levels of four GATA genes, ZmGATA24, ZmGATA11, ZmGATA2, and ZmGATA27, were high in almost all tissues, indicating their possible involvement in various physiological processes of maize development. The 11 GATA genes, namely ZmGATA40, ZmGATA41, ZmGATA3, ZmGATA25, ZmGATA38, ZmGATA39, ZmGATA6, ZmGATA30, ZmGATA5, ZmGATA33, and ZmGATA36, were not expressed in almost all maize tissues. Ten GATA genes, ZmGATA26, ZmGATA4, ZmGATA31, ZmGATA19, ZmGATA8, ZmGATA13, ZmGATA14, ZmGATA37, ZmGATA21, and ZmGATA35, were not expressed in the mature pollen but were expressed in other tissues. The other maize GATA family genes showed a tissue-specific expression pattern. The aforementioned results showed that the maize GATA genes might play specific roles in different tissues.

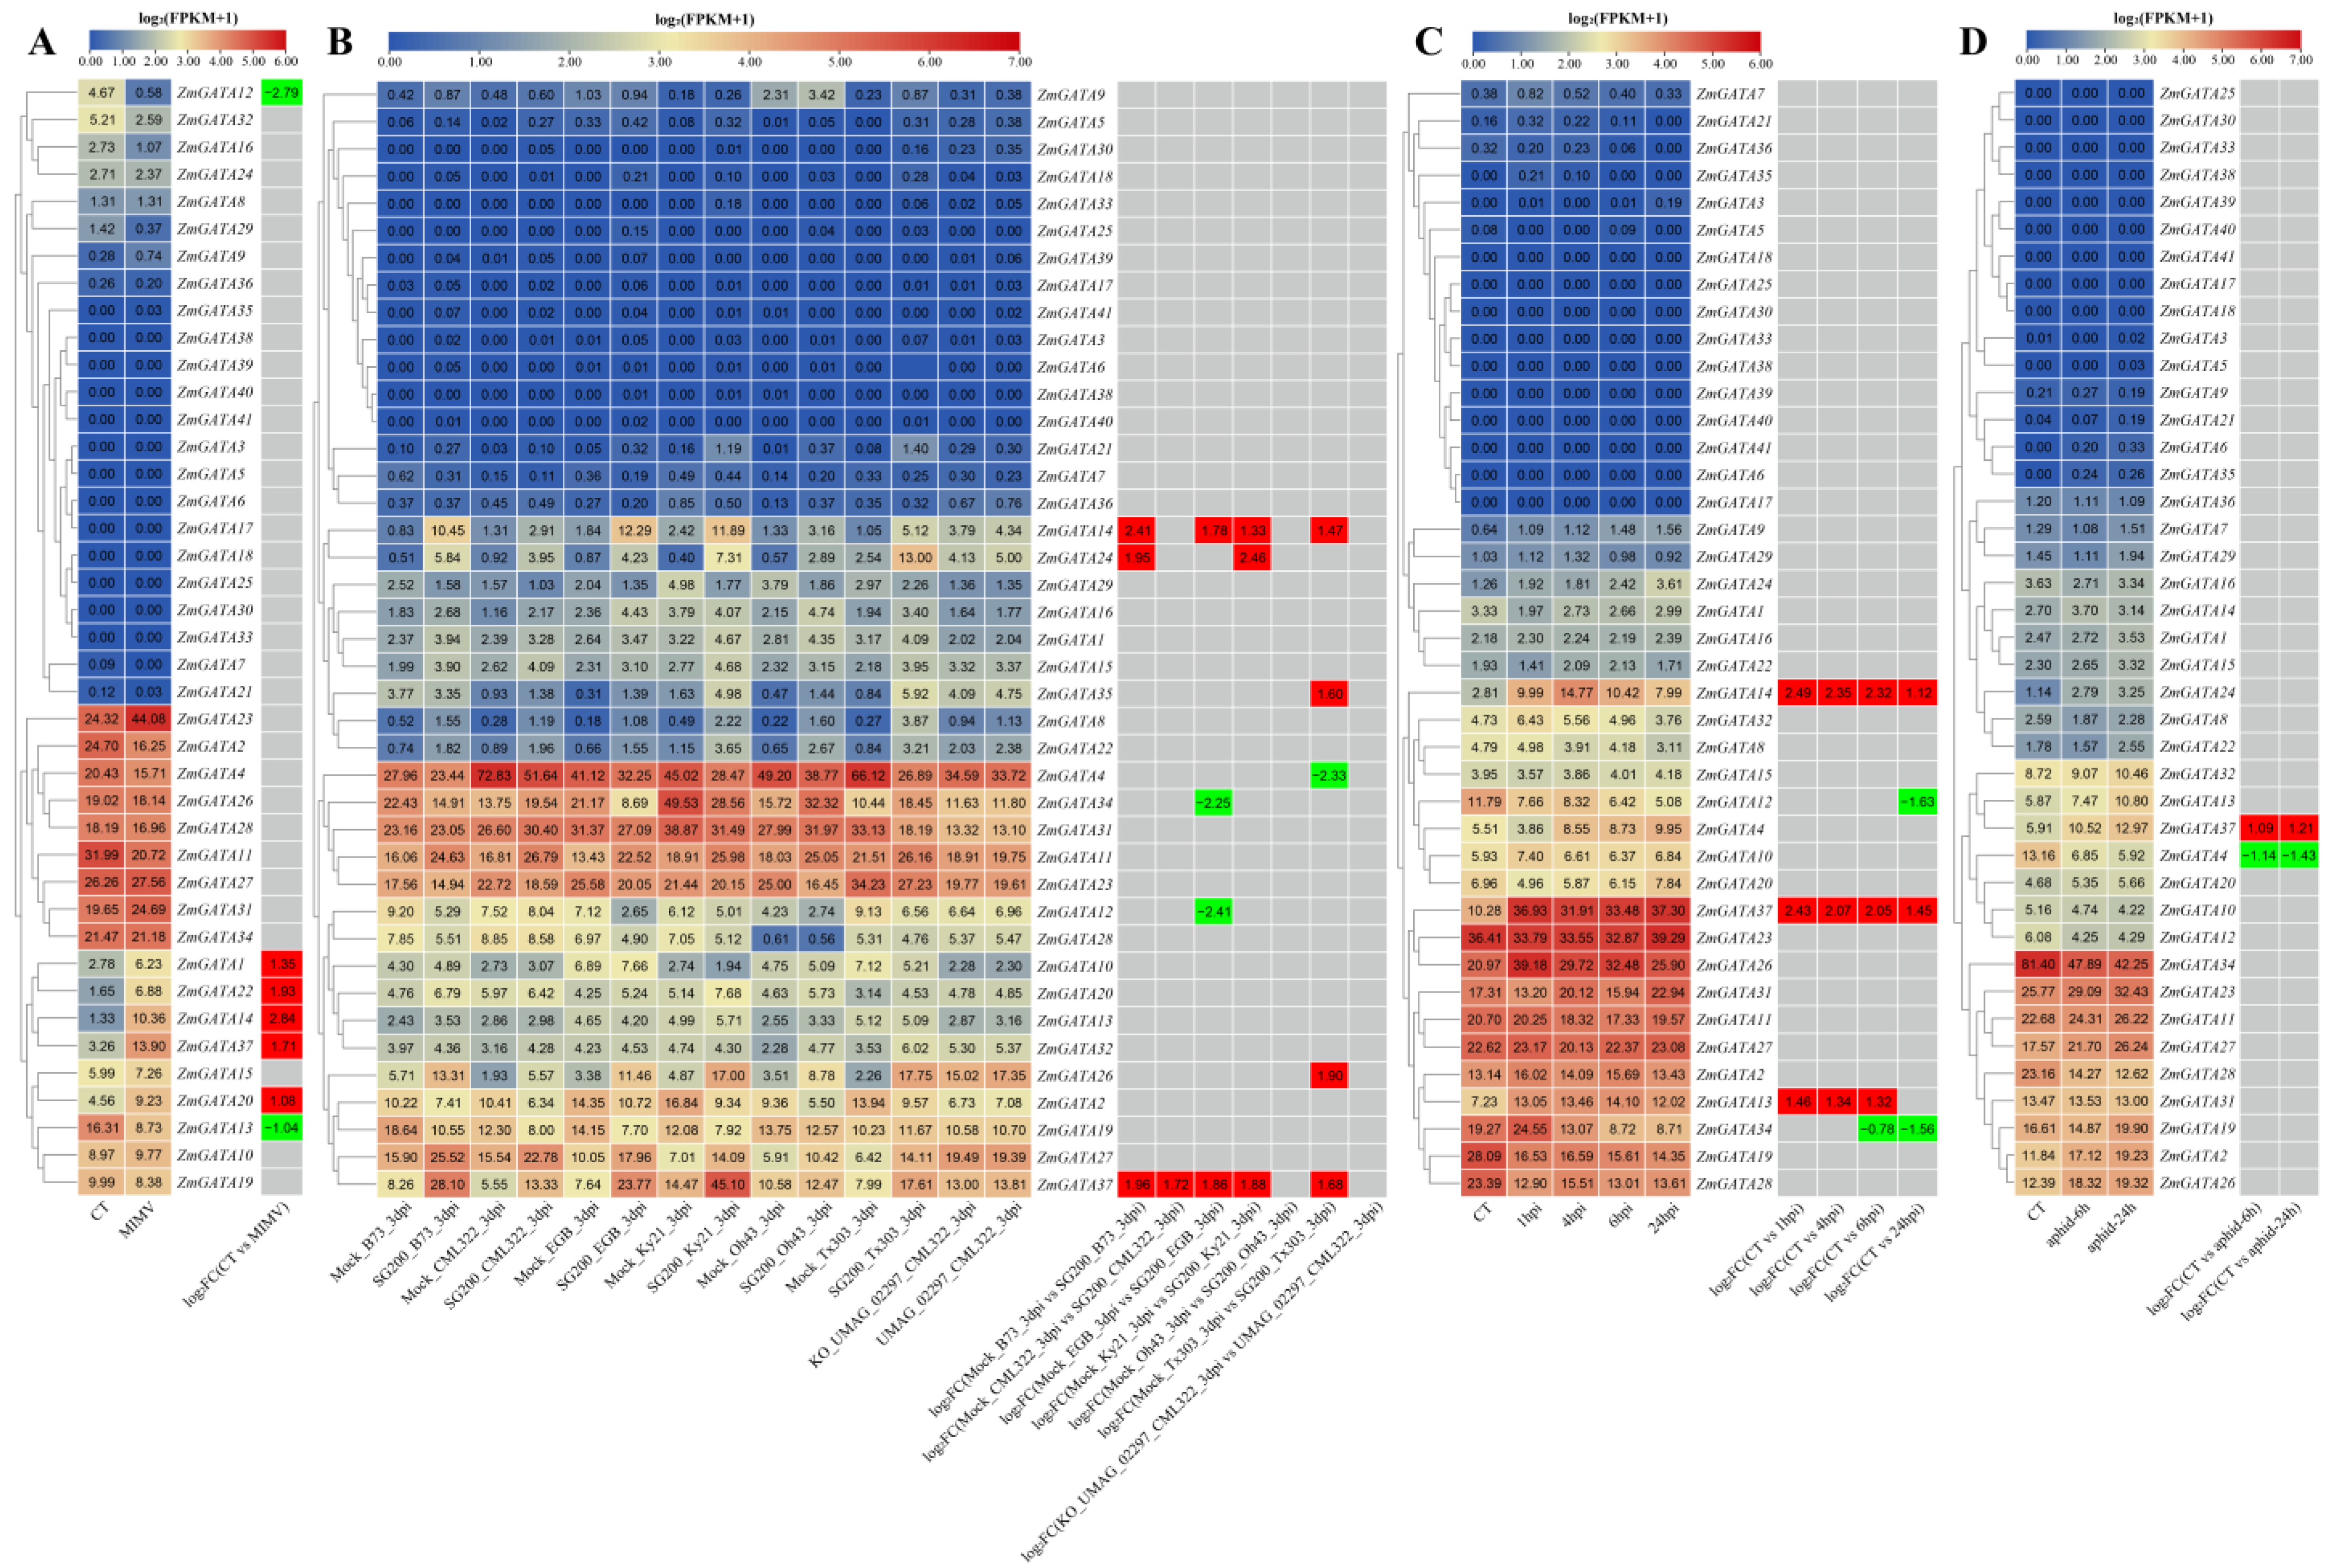
3.8. Expression Pattern Analysis of Maize GATA Family Genes under Abiotic Stress

Based on the published transcriptome sequencing data of maize under high- and low-temperature stresses (PRJNA645274) [54], drought stress (PRJNA545969) [55], waterlogging stress (PRJNA606824) [56], and salt stress (PRJNA414300) [57], the transcriptome sequencing analysis was re-performed using the maize B73_V4 genome information. The expression heatmap of the maize GATA family genes under different abiotic stress responses was drawn (Figure 7). Under temperature stress (Figure 7A), compared with the control materials, three GATA genes (ZmGATA37, ZmGATA26, and ZmGATA14) were simultaneously differentially expressed under high- and low-temperature stresses, and all of the genes were downregulated. Four GATA genes (ZmGATA31, ZmGATA13, ZmGATA27 and ZmGATA12) were significantly upregulated under low-temperature stress. Five GATA genes (ZmGATA19, ZmGATA2, ZmGATA20, ZmGATA15, and ZmGATA22) were only differentially expressed under high-temperature stress. Two GATA genes (ZmGATA34 and ZmGATA28) were differentially expressed under high- and low-temperature stresses. However, their expression patterns were different under high- and low-temperature stresses. Under salt stress (Figure 7B), seven GATA genes (ZmGATA37, ZmGATA4, ZmGATA10, ZmGATA31, ZmGATA12, ZmGATA14, and ZmGATA20) were significantly downregulated, whereas two GATA genes (ZmGATA26 and ZmGATA24) were significantly upregulated. Under waterlogging stress (Figure 7C), five GATA genes (ZmGATA10, ZmGATA22, ZmGATA31, ZmGATA35, and ZmGATA28) were significantly upregulated, whereas four GATA genes (ZmGATA29, ZmGATA23, ZmGATA26, and ZmGATA37) were significantly downregulated. Under drought stress (Figure 7D), five GATA genes (ZmGATA2, ZmGATA7, ZmGATA28, ZmGATA4, and ZmGATA31) were significantly upregulated, whereas four GATA genes (ZmGATA37, ZmGATA35, ZmGATA21, and ZmGATA14) were significantly downregulated.

3.9. Expression Pattern Analysis of Maize GATA Family Genes under Biotic Stress

Based on the published transcriptome sequencing data of maize under smut disease (PRJNA673988) [58], Maize Iranian mosaic virus disease (PRJNA427399) [59], beet armyworm stress (PRJNA625224) [60] and aphid stress (PRJCA003201) [61], the transcriptome sequencing analysis was re-performed using the maize B73_V4 genome information. The expression heatmap of the maize GATA family genes in response to biotic stress was drawn (Figure 8). Under Maize Iranian mosaic virus stress (Figure 8A), compared with the control materials, two maize GATA genes (ZmGATA12 and ZmGATA13) were significantly downregulated, whereas five maize GATA genes (ZmGATA1, ZmGATA22, ZmGATA14, ZmGATA37, and ZmGATA20) were significantly upregulated. Under smut disease stress (Figure 8B), five maize GATA genes (ZmGATA14, ZmGATA24, ZmGATA35, ZmGATA26, and ZmGATA37) were significantly upregulated, whereas three maize GATA genes (ZmGATA4, ZmGATA34, and ZmGATA12) were significantly downregulated. Under beet armyworm stress (Figure 8C), compared with the control materials, three GATA genes (ZmGATA14, ZmGATA37, and ZmGATA13) were significantly upregulated, whereas two GATA genes (ZmGATA12 and ZmGATA34) were significantly downregulated. Under aphid stress (Figure 8D), compared with the control materials, ZmGATA37 was significantly upregulated, whereas ZmGATA4 was significantly downregulated.

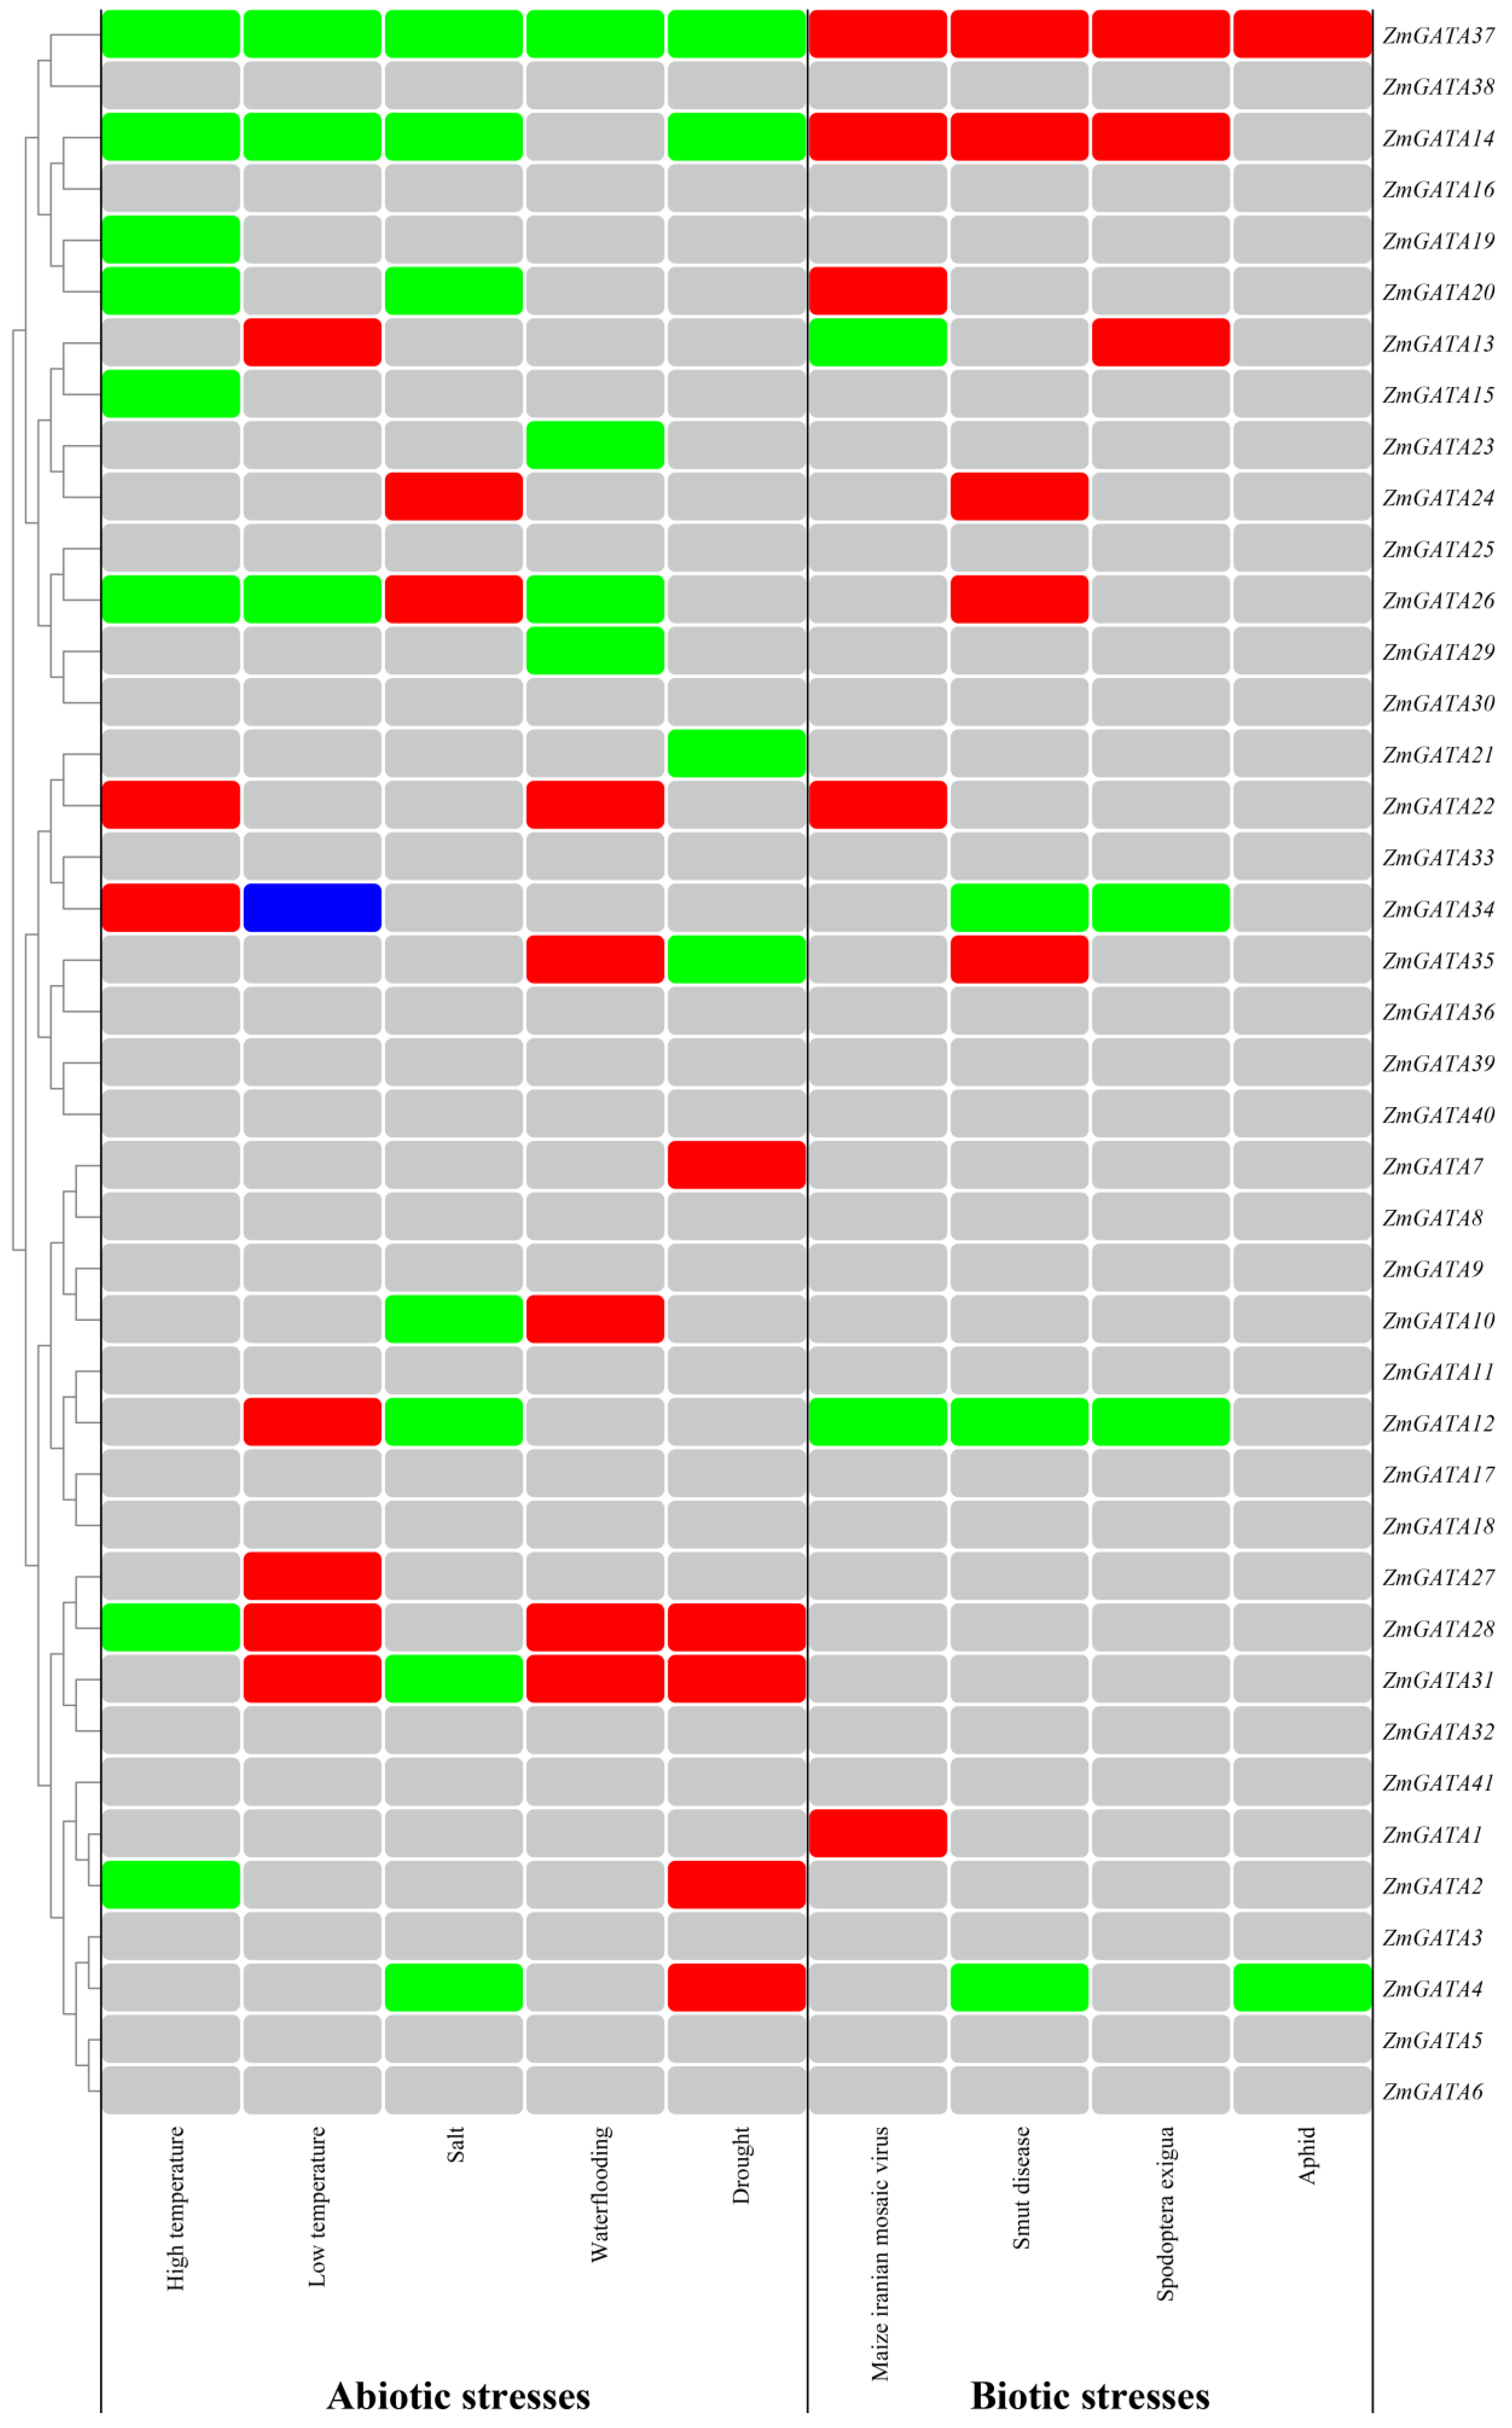
3.10. Analysis of Regulation Mode of Maize GATA Family Genes under Abiotic and Biotic Stresses

On analyzing the expression patterns of the aforementioned maize GATA family genes under abiotic and biotic stresses, the differentially expressed maize GATA genes were labeled, and the heat map was drawn (Figure 9). One maize GATA gene, ZmGATA37, was significantly downregulated under all abiotic stresses and significantly upregulated under all biotic stresses, indicating that this gene actively participates in the stress response and could be used as a key candidate for further research. Another GATA gene, ZmGATA14, was also differentially expressed in response to multiple abiotic and biotic stresses, which could be considered for further research. In total, 11 maize GATA genes including ZmGATA2 ZmGATA7, ZmGATA10, ZmGATA15, ZmGATA19, ZmGATA21, ZmGATA23, ZmGATA27, ZmGATA28, ZmGATA29, and ZmGATA31 were only differentially expressed under abiotic stresses. Only one GATA gene, ZmGATA1, was only differentially expressed under biotic stresses. Two maize GATA genes including ZmGATA22 and ZmGATA24 were significantly up-regulated in response to abiotic and biotic stresses. Nine maize GATA genes (ZmGATA4, ZmGATA12, ZmGATA13, ZmGATA14, ZmGATA20, ZmGATA26, ZmGATA34, ZmGATA35, and ZmGATA37) were differentially expressed under abiotic and biotic stresses, but they had different expression patterns. The other 18 maize GATA genes were not differentially expressed under any stresses. The results of expression pattern analysis of maize GATA family genes under abiotic and biotic stresses provide a reference for further research on the molecular biology of these genes.

3.11. Protein–Protein Interaction Analysis

According to protein–protein interaction (PPI) analysis, 28 interactions were identified among 41 maize GATA proteins (Figure 10A) and ZmGATA37 could interact with 7 other maize proteins (Figure 10B). These results provide a valuable basis for the future functional study of maize GATA genes.

4. Discussion

With the continuous development and wide application of genome sequencing technology, an increasing amount of plant genome sequence information has recently been published [63]. Moreover, important gene family identification work has been carried out. GATA family genes affect plant growth regulation, defense response, and stress tolerance [27,31]. The GATA genes have been identified in A. thaliana [20], rice [21], soybean [22], cotton [23], Brassica napus [24], and tomato [16]. The number of maize GATA family genes identified using the maize B73_V3 genome information previously (38 GATA genes) [37] was lower than that identified using the maize B73_V4 genome information (41 GATA genes) [64] in this study. This indicated that the whole genome identification of maize GATA family genes in previous studies was incomplete. Moreover, the expression pattern of the maize genes in response to abiotic and biotic stresses has not been analyzed in previous studies, which greatly limits the biological function research of maize GATA family genes. Therefore, in this study, the members of maize GATA gene family were identified using the maize B73_V4 genome information. Based on the maize B73_V4 genome information and the big data of transcriptome sequencing, transcriptome sequencing data were reanalyzed to explore the expression patterns of GATA family genes in different tissues and during different stress responses. These findings could act as a reference for the in-depth study of the function of maize GATA genes and provide a theoretical basis for molecular breeding of maize resistance.
Here, 41 GATA gene members were identified in maize, while 29, 28, 64, 179, 96, and 30 GATA genes were identified in Arabidopsis [20], rice [21], soybean [22], cotton [23], rapeseed [24], and tomato [16], respectively. The number of GATA genes identified in different plant species was quite different, which indicated differences among different plants. The 41 GATA genes in maize were divided into four subgroups, namely Group A, Group B, Group C, and Group D, which were consistent with the phylogenetic analysis results of GATA family genes in Arabidopsis [20], rice [21], soybean [22], cotton [23], rapeseed [24], and tomato [16]. Significant differences were observed in the structure of the GATA genes in different subgroups. The gene structure in each subgroup was basically consistent with that of the motif. Collinearity analysis of GATA family genes in Arabidopsis, rice, and maize revealed that the 18 GATA genes in maize were collinear with those in rice, and only 1 GATA gene in maize was collinear with those in A. thaliana. More collinearity was observed between monocotyledonous plants (maize and rice), whereas less collinearity was observed between the monocotyledonous plant maize and the dicotyledonous plant A. thaliana. This may be because maize and rice were both monocotyledonous gramineous plants and had a closer genetic relationship. Segmental and tandem duplications are considered to represent the two main reasons for the expansion of plant gene families [65,66]. The repeat analysis of maize GATA family genes revealed the presence of 3 and 17 pairs of tandem and segmental duplication genes, respectively, which exhibited that the expansion of GATA genes in maize mainly occurred through segmental duplication.
Because of the recent development in high-throughput sequencing technology, the cost of transcriptome sequencing is gradually decreasing [67]. Many researchers have conducted a large amount of maize transcriptome sequencing, leading to the formation of big data on maize transcriptome sequencing. Therefore, making good use of these transcriptome sequencing big data can not only reduce the unnecessary cost but can also dig deeply into these data. Moreover, the expression profiling of different gene families in maize can be investigated by combining the transcriptome sequencing big data under different treatments. In this study, based on the public big data of maize transcriptome sequencing and the maize B73_V4 genome information, tissue-specific expression analysis and expression pattern analysis in response to different biotic and abiotic stresses of 41 identified maize GATA family genes were conducted. ZmGATA24, ZmGATA11, ZmGATA2, and ZmGATA27 were expressed in all tissues. However, other maize GATA genes were not expressed or specifically expressed in all tissues. On analyzing the expression pattern of maize GATA family genes during abiotic and biotic stresses, we found that 13 maize GATA genes, ZmGATA3, ZmGATA5, ZmGATA6, ZmGATA17, ZmGATA18, ZmGATA25, ZmGATA30, ZmGATA33, ZmGATA36, ZmGATA38, ZmGATA39, ZmGATA40, and ZmGATA41, were not expressed under both abiotic and biotic stresses. This result was in agreement with those of the tissue-specific expression analysis and indicated the relatively high reliability of the transcriptome analysis data.
Members of the GATA gene family regulate plant growth and development. In our study, except for ZmGATA3, ZmGATA5, ZmGATA6, ZmGATA8, ZmGATA9, ZmGATA11, ZmGATA16, ZmGATA17, ZmGATA18, ZmGATA25, ZmGATA30, ZmGATA32, ZmGATA33, ZmGATA36, ZmGATA38, ZmGATA39, ZmGATA40 and ZmGATA41, the other maize GATA family genes responded to at least one type of stress. Among them, ZmGATA4, ZmGATA12, ZmGATA13, ZmGATA14, ZmGATA20, ZmGATA22, ZmGATA24, ZmGATA26, ZmGATA34, ZmGATA35 and ZmGATA37 were all involved in response to both abiotic and biotic stresses. ZmGATA2, ZmGATA7, ZmGATA10, ZmGATA15, ZmGATA19, ZmGATA21, ZmGATA23, ZmGATA27, ZmGATA28, ZmGATA29 and ZmGATA31 were only involved in response to abiotic stresses, ZmGATA1 was only involved in response to biotic stresses. The responses of GATA genes to adverse environmental conditions have also been reported in many plant species. For example, the maize GATA genes including ZmGATA12, ZmGATA13, ZmGATA14, ZmGATA26, ZmGATA27, ZmGATA28, ZmGATA31, ZmGATA34 and ZmGATA37 were involved in response to low-temperature stress. Similarly, it was found that OsGATA16 overexpression enhanced the cold tolerance of rice [68]. In maize, the ZmGATA4, ZmGATA14, ZmGATA21, ZmGATA28, ZmGATA31, ZmGATA35 and ZmGATA37 genes were involved in drought stress response. Previous studies also reported that OsGATA8 overexpression enhanced the drought resistance of rice [69] and SlGATA17 overexpression increased the drought tolerance of tomato [70]. A similar function of GATA genes in response to abiotic stress was found in different plants; GATA genes also have similarity in response to biotic stress in different plants. For example, the maize GATA genes including ZmGATA1, ZmGATA4, ZmGATA12, ZmGATA13, ZmGATA14, ZmGATA20, ZmGATA22, ZmGATA24, ZmGATA26, ZmGATA34, ZmGATA35 and ZmGATA37 responded to diseases. It was also reported that Brachypodium distachyon GATA genes responded to a fungal infection caused by Magnaporthe oryzae [24], and DvGATA was involved in defense against wheat powdery mildew [71]. In maize, ZmGATA4, ZmGATA12, ZmGATA13, ZmGATA14, ZmGATA14, ZmGATA34 and ZmGATA37 genes respond to pests. It was also found that cucumber GATA genes reacted to the infestation of the root-knot nematode [72]. The above results indicated that GATA genes in different plants possess similar functions under biotic and abiotic stresses. In maize, the ZmGATA37 gene was differentially expressed under all abiotic and biotic stresses, including high temperature, low temperature, drought, waterlogging, salt, smut disease, Maize Iranian mosaic virus infection, beet armyworm and aphid infestations, indicating that this gene has a crucial role in maize resistance to stresses, which could develop the molecular markers for maize resistance breeding. The ZmGATA37 gene will also be further investigated using the transgenic strategy.

5. Conclusions

In this study, 41 GATA family genes were identified in the whole maize genome by using the maize genome information. The analysis of their physiochemical characteristics, chromosome location, gene structure, phylogenetic evolution and collinearity revealed that 41 maize GATA family genes were distributed on 10 chromosomes and divided into 4 subfamilies. The gene members in each subfamily were highly conserved, and the gene structure and protein-conserved domains were different among the different subfamilies. Combined with the published big data of maize transcriptome sequencing, based on the maize B73_V4 genome information, the transcriptome sequencing data were reanalyzed using bioinformatics technology. The expression patterns of the maize GATA family genes in different tissues and their responses to stresses were investigated and were found to be different, which coordinated the growth and development of maize. Among them, the ZmGATA37 gene was expressed in almost all maize tissues and was differentially expressed in response to multiple abiotic and biotic stresses, indicating that the ZmGATA37 gene actively participated in maize growth and development. This study provides useful information for the functional and evolutionary analyses of the GATA gene in maize, thereby offering a valuable candidate gene for improving stress resistance in maize.

Author Contributions

K.Z. and H.Y. conceived the research and designed the experiments. Y.H. and J.H. performed research, analyzed the data, and wrote the manuscript. C.W. and X.Z. participated in downloading transcriptome sequencing data and helped with the bioinformatics analysis. Y.H. and K.Z. analyzed and interpreted the data. L.Y. and X.C. modified the manuscript. All authors have read and agreed to the published version of the manuscript.

Funding

This work was supported by the Science and Technology Projects in Anhui Province (2022ZH015), the Key Research and Development Program of Anhui Province (202104a06020001), the Research Development Foundation of Anhui Science and Technology University (FZ230126), and the Talent Foundation of Anhui Science and Technology University (NXYJ202103).

Data Availability Statement

Not applicable.

Conflicts of Interest

The authors declare no conflict of interest.

References

  1. Benz, B.F. Archaeological evidence of teosinte domestication from Guilá Naquitz, Oaxaca. Proc. Natl. Acad. Sci. USA 2001, 98, 2104–2106. [Google Scholar] [CrossRef] [PubMed]
  2. Dolgin, E. Maize genome mapped. Nat. News 2009, 1098. [Google Scholar] [CrossRef]
  3. Ramazan, S.; Nazir, I.; Yousuf, W.; John, R.; Allakhverdiev, S. Environmental stress tolerance in maize (Zea mays): Role of polyamine metabolism. Funct. Plant Biol. 2022, 50, 85–96. [Google Scholar] [CrossRef] [PubMed]
  4. Niu, X.; Guan, Y.; Chen, S.; Li, H. Genome-wide analysis of basic helix-loop-helix (bHLH) transcription factors in Brachypodium distachyon. BMC Genom. 2017, 18, 619. [Google Scholar] [CrossRef] [PubMed] [Green Version]
  5. Jiang, J.; Ma, S.; Ye, N.; Jiang, M.; Cao, J.; Zhang, J. WRKY transcription factors in plant responses to stresses. J. Integr. Plant Biol. 2017, 59, 86–101. [Google Scholar] [CrossRef] [Green Version]
  6. Rushton, P.J.; Somssich, I.E.; Ringler, P.; Shen, Q.J. WRKY transcription factors. Trends Plant Sci. 2010, 15, 247–258. [Google Scholar] [CrossRef]
  7. Dröge-Laser, W.; Snoek, B.L.; Snel, B.; Weiste, C. The Arabidopsis bZIP transcription factor family—An update. Curr. Opin. Plant Biol. 2018, 45, 36–49. [Google Scholar] [CrossRef]
  8. Dubos, C.; Stracke, R.; Grotewold, E.; Weisshaar, B.; Martin, C.; Lepiniec, L. MYB transcription factors in Arabidopsis. Trends Plant Sci. 2010, 15, 573–581. [Google Scholar] [CrossRef] [PubMed]
  9. Wang, Y.; Zhang, J.; Hu, Z.; Guo, X.; Tian, S.; Chen, G. Genome-wide analysis of the MADS-box transcription factor family in Solanum lycopersicum. Int. J. Mol. Sci. 2019, 20, 2961. [Google Scholar] [CrossRef] [Green Version]
  10. Kim, M.; Xi, H.; Park, S.; Yun, Y.; Park, J. Genome-wide comparative analyses of GATA transcription factors among seven Populus genomes. Sci. Rep. 2021, 11, 16578. [Google Scholar] [CrossRef]
  11. Reyes, J.C.; Muro-Pastor, M.I.; Florencio, F.J. The GATA family of transcription factors in Arabidopsis and rice. Plant Physiol. 2004, 134, 1718–1732. [Google Scholar] [CrossRef] [Green Version]
  12. Hudson, D.; Guevara, D.; Yaish, M.W.; Hannam, C.; Long, N.; Clarke, J.D.; Bi, Y.-M.; Rothstein, S.J. GNC and CGA1 modulate chlorophyll biosynthesis and glutamate synthase (GLU1/Fd-GOGAT) expression in Arabidopsis. PLoS ONE 2011, 6, e26765. [Google Scholar] [CrossRef] [PubMed]
  13. Huang, X.-Y.; Chao, D.-Y.; Gao, J.-P.; Zhu, M.-Z.; Shi, M.; Lin, H.-X. A previously unknown zinc finger protein, DST, regulates drought and salt tolerance in rice via stomatal aperture control. Genes Dev. 2009, 23, 1805–1817. [Google Scholar] [CrossRef] [PubMed] [Green Version]
  14. Scazzocchio, C. The fungal GATA factors. Curr. Opin. Microbiol. 2000, 3, 126–131. [Google Scholar] [CrossRef] [PubMed]
  15. Lowry, J.A.; Atchley, W.R. Molecular evolution of the GATA family of transcription factors: Conservation within the DNA-binding domain. J. Mol. Evol. 2000, 50, 103–115. [Google Scholar] [CrossRef]
  16. Yuan, Q.; Zhang, C.; Zhao, T.; Yao, M.; Xu, X. A genome-wide analysis of GATA transcription factor family in tomato and analysis of expression patterns. Int. J. Agric. Biol. 2018, 20, 1274–1282. [Google Scholar]
  17. Wang, T.; Yang, Y.; Lou, S.; Wei, W.; Zhao, Z.; Ren, Y.; Lin, C.; Ma, L. Genome-wide characterization and gene expression analyses of GATA transcription factors in Moso bamboo (Phyllostachys edulis). Int. J. Mol. Sci. 2019, 21, 14. [Google Scholar] [CrossRef] [Green Version]
  18. Evans, T.; Reitman, M.; Felsenfeld, G. An erythrocyte-specific DNA-binding factor recognizes a regulatory sequence common to all chicken globin genes. Proc. Natl. Acad. Sci. USA 1988, 85, 5976–5980. [Google Scholar] [CrossRef]
  19. Daniel-Vedele, F.; Caboche, M. A tobacco cDNA clone encoding a GATA-1 zinc finger protein homologous to regulators of nitrogen metabolism in fungi. Mol. Gen. Genet. MGG 1993, 240, 365–373. [Google Scholar] [CrossRef]
  20. Manfield, I.W.; Devlin, P.F.; Jen, C.-H.; Westhead, D.R.; Gilmartin, P.M. Conservation, convergence, and divergence of light-responsive, circadian-regulated, and tissue-specific expression patterns during evolution of the Arabidopsis GATA gene family. Plant Physiol. 2007, 143, 941–958. [Google Scholar] [CrossRef] [Green Version]
  21. Gupta, P.; Nutan, K.K.; Singla-Pareek, S.L.; Pareek, A. Abiotic stresses cause differential regulation of alternative splice forms of GATA transcription factor in rice. Front. Plant Sci. 2017, 8, 1944. [Google Scholar] [CrossRef] [PubMed] [Green Version]
  22. Zhang, C.; Hou, Y.; Hao, Q.; Chen, H.; Chen, L.; Yuan, S.; Shan, Z.; Zhang, X.; Yang, Z.; Qiu, D. Genome-wide survey of the soybean GATA transcription factor gene family and expression analysis under low nitrogen stress. PLoS ONE 2015, 10, e0125174. [Google Scholar] [CrossRef] [PubMed] [Green Version]
  23. Zhang, Z.; Zou, X.; Huang, Z.; Fan, S.; Qun, G.; Liu, A.; Gong, J.; Li, J.; Gong, W.; Shi, Y. Genome-wide identification and analysis of the evolution and expression patterns of the GATA transcription factors in three species of Gossypium genus. Gene 2019, 680, 72–83. [Google Scholar] [CrossRef] [PubMed]
  24. Zhu, W.; Guo, Y.; Chen, Y.; Wu, D.; Jiang, L. Genome-wide identification, phylogenetic and expression pattern analysis of GATA family genes in Brassica napus. BMC Plant Biol. 2020, 20, 543. [Google Scholar] [CrossRef] [PubMed]
  25. Chen, H.; Shao, H.; Li, K.; Zhang, D.; Fan, S.; Li, Y.; Han, M. Genome-wide identification, evolution, and expression analysis of GATA transcription factors in apple (Malus × domestica Borkh.). Gene 2017, 627, 460–472. [Google Scholar] [CrossRef]
  26. Peng, X.; Wu, Q.; Teng, L.; Tang, F.; Pi, Z.; Shen, S. Transcriptional regulation of the paper mulberry under cold stress as revealed by a comprehensive analysis of transcription factors. BMC Plant Biol. 2015, 15, 108. [Google Scholar] [CrossRef] [Green Version]
  27. Peng, W.; Li, W.; Song, N.; Tang, Z.; Liu, J.; Wang, Y.; Pan, S.; Dai, L.; Wang, B. Genome-wide characterization, evolution, and expression profile analysis of GATA transcription factors in Brachypodium distachyon. Int. J. Mol. Sci. 2021, 22, 2026. [Google Scholar] [CrossRef]
  28. Zhang, Z.; Ren, C.; Zou, L.; Wang, Y.; Li, S.; Liang, Z. Characterization of the GATA gene family in Vitis vinifera: Genome-wide analysis, expression profiles, and involvement in light and phytohormone response. Genome 2018, 61, 713–723. [Google Scholar] [CrossRef] [Green Version]
  29. Ravindran, P.; Verma, V.; Stamm, P.; Kumar, P.P. A novel RGL2–DOF6 complex contributes to primary seed dormancy in Arabidopsis thaliana by regulating a GATA transcription factor. Mol. Plant 2017, 10, 1307–1320. [Google Scholar] [CrossRef] [Green Version]
  30. Lu, G.; Casaretto, J.A.; Ying, S.; Mahmood, K.; Liu, F.; Bi, Y.-M.; Rothstein, S.J. Overexpression of OsGATA12 regulates chlorophyll content, delays plant senescence and improves rice yield under high density planting. Plant Mol. Biol. 2017, 94, 215–227. [Google Scholar] [CrossRef]
  31. Zhang, Y.J.; Zhang, Y.; Zhang, L.L.; Huang, H.Y.; Yang, B.J.; Luan, S.; Xue, H.W.; Lin, W.H. OsGATA7 modulates brassinosteroids-mediated growth regulation and influences architecture and grain shape. Plant Biotechnol. J. 2018, 16, 1261. [Google Scholar] [CrossRef] [PubMed] [Green Version]
  32. An, Y.; Zhou, Y.; Han, X.; Shen, C.; Wang, S.; Liu, C.; Yin, W.; Xia, X. The GATA transcription factor GNC plays an important role in photosynthesis and growth in poplar. J. Exp. Bot. 2020, 71, 1969–1984. [Google Scholar] [CrossRef] [PubMed]
  33. Jiang, L.; Ingvardsen, C.R.; Lübberstedt, T.; Xu, M. The Pic19 NBS-LRR gene family members are closely linked to Scmv1, but not involved in maize resistance to sugarcane mosaic virus. Genome 2008, 51, 673–684. [Google Scholar] [CrossRef] [PubMed]
  34. Peng, X.; Zhao, Y.; Li, X.; Wu, M.; Chai, W.; Sheng, L.; Wang, Y.; Dong, Q.; Jiang, H.; Cheng, B. Genomewide identification, classification and analysis of NAC type gene family in maize. J. Genet. 2015, 94, 377–390. [Google Scholar] [CrossRef] [PubMed]
  35. Kong, X.; Pan, J.; Zhang, D.; Jiang, S.; Cai, G.; Wang, L.; Li, D. Identification of mitogen-activated protein kinase kinase gene family and MKK–MAPK interaction network in maize. Biochem. Biophys. Res. Commun. 2013, 441, 964–969. [Google Scholar] [CrossRef]
  36. Jiang, L.; Hu, W.; Qian, Y.; Ren, Q.; Zhang, J. Genome-wide identification, classification and expression analysis of the Hsf and Hsp70 gene families in maize. Gene 2021, 770, 145348. [Google Scholar] [CrossRef]
  37. Jiang, L.; Yu, X.; Chen, D.; Feng, H.; Li, J. Identification, phylogenetic evolution and expression analysis of GATA transcription factor family in maize (Zea mays). Int. J. Agric. Biol. 2020, 23, 637–643. [Google Scholar]
  38. Mistry, J.; Chuguransky, S.; Williams, L.; Qureshi, M.; Salazar, G.A.; Sonnhammer, E.L.; Tosatto, S.C.; Paladin, L.; Raj, S.; Richardson, L.J. Pfam: The protein families database in 2021. Nucleic Acids Res. 2021, 49, D412–D419. [Google Scholar] [CrossRef]
  39. Finn, R.D.; Clements, J.; Eddy, S.R. HMMER web server: Interactive sequence similarity searching. Nucleic Acids Res. 2011, 39 (Suppl. S2), W29–W37. [Google Scholar] [CrossRef] [Green Version]
  40. Letunic, I.; Khedkar, S.; Bork, P. SMART: Recent updates, new developments and status in 2020. Nucleic Acids Res. 2021, 49, D458–D460. [Google Scholar] [CrossRef]
  41. Xiong, E.; Zheng, C.; Wu, X.; Wang, W. Protein subcellular location: The gap between prediction and experimentation. Plant Mol. Biol. Report. 2016, 34, 52–61. [Google Scholar] [CrossRef]
  42. Chen, C.; Chen, H.; Zhang, Y.; Thomas, H.R.; Frank, M.H.; He, Y.; Xia, R. TBtools: An integrative toolkit developed for interactive analyses of big biological data. Mol. Plant 2020, 13, 1194–1202. [Google Scholar] [CrossRef] [PubMed]
  43. Kumar, S.; Stecher, G.; Tamura, K. MEGA7: Molecular evolutionary genetics analysis version 7.0 for bigger datasets. Mol. Biol. Evol. 2016, 33, 1870–1874. [Google Scholar] [CrossRef] [Green Version]
  44. He, Z.; Zhang, H.; Gao, S.; Lercher, M.J.; Chen, W.-H.; Hu, S. Evolview v2: An online visualization and management tool for customized and annotated phylogenetic trees. Nucleic Acids Res. 2016, 44, W236–W241. [Google Scholar] [CrossRef] [PubMed]
  45. Lescot, M.; Déhais, P.; Thijs, G.; Marchal, K.; Moreau, Y.; Van de Peer, Y.; Rouzé, P.; Rombauts, S. PlantCARE, a database of plant cis-acting regulatory elements and a portal to tools for in silico analysis of promoter sequences. Nucleic Acids Res. 2002, 30, 325–327. [Google Scholar] [CrossRef]
  46. Wang, Y.; Tang, H.; Debarry, J.D.; Tan, X.; Li, J.; Wang, X.; Lee, T.-h.; Jin, H.; Marler, B.; Guo, H. MCScanX: A toolkit for detection and evolutionary analysis of gene synteny and collinearity. Nucleic Acids Res. 2012, 40, e49. [Google Scholar] [CrossRef] [PubMed] [Green Version]
  47. Krzywinski, M.; Schein, J.; Birol, I.; Connors, J.; Gascoyne, R.; Horsman, D.; Jones, S.J.; Marra, M.A. Circos: An information aesthetic for comparative genomics. Genome Res. 2009, 19, 1639–1645. [Google Scholar] [CrossRef] [Green Version]
  48. Brown, J.; Pirrung, M.; McCue, L.A. FQC Dashboard: Integrates FastQC results into a web-based, interactive, and extensible FASTQ quality control tool. Bioinformatics 2017, 33, 3137–3139. [Google Scholar] [CrossRef] [PubMed] [Green Version]
  49. Bolger, A.M.; Lohse, M.; Usadel, B. Trimmomatic: A flexible trimmer for Illumina sequence data. Bioinformatics 2014, 30, 2114–2120. [Google Scholar] [CrossRef] [PubMed] [Green Version]
  50. Li, H.; Handsaker, B.; Wysoker, A.; Fennell, T.; Ruan, J.; Homer, N.; Marth, G.; Abecasis, G.; Durbin, R. 1000 genome project data processing subgroup. The sequence alignment/map (SAM) format and SAMtools. Bioinformatics 2009, 25, 2079. [Google Scholar]
  51. Pertea, M.; Pertea, G.M.; Antonescu, C.M.; Chang, T.-C.; Mendell, J.T.; Salzberg, S.L. StringTie enables improved reconstruction of a transcriptome from RNA-seq reads. Nat. Biotechnol. 2015, 33, 290–295. [Google Scholar] [CrossRef] [Green Version]
  52. Varet, H.; Brillet-Guéguen, L.; Coppée, J.-Y.; Dillies, M.-A. SARTools: A DESeq2-and EdgeR-based R pipeline for comprehensive differential analysis of RNA-Seq data. PLoS ONE 2016, 11, e0157022. [Google Scholar] [CrossRef] [PubMed] [Green Version]
  53. Coles, N.D.; McMullen, M.D.; Balint-Kurti, P.J.; Pratt, R.C.; Holland, J.B. Genetic control of photoperiod sensitivity in maize revealed by joint multiple population analysis. Genetics 2010, 184, 799–812. [Google Scholar] [CrossRef] [Green Version]
  54. Li, Y.; Wang, X.; Li, Y.; Zhang, Y.; Gou, Z.; Qi, X.; Zhang, J. Transcriptomic analysis revealed the common and divergent responses of maize seedling leaves to cold and heat stresses. Genes 2020, 11, 881. [Google Scholar] [CrossRef] [PubMed]
  55. Wang, B.; Liu, C.; Zhang, D.; He, C.; Zhang, J.; Li, Z. Effects of maize organ-specific drought stress response on yields from transcriptome analysis. BMC Plant Biol. 2019, 19, 335. [Google Scholar] [CrossRef] [PubMed] [Green Version]
  56. Yu, F.; Tan, Z.; Fang, T.; Tang, K.; Liang, K.; Qiu, F. A comprehensive transcriptomics analysis reveals long non-coding RNA to be involved in the key metabolic pathway in response to waterlogging stress in maize. Genes 2020, 11, 267. [Google Scholar] [CrossRef] [Green Version]
  57. Wang, M.; Wang, Y.; Zhang, Y.; Li, C.; Gong, S.; Yan, S.; Li, G.; Hu, G.; Ren, H.; Yang, J. Comparative transcriptome analysis of salt-sensitive and salt-tolerant maize reveals potential mechanisms to enhance salt resistance. Genes Genom. 2019, 41, 781–801. [Google Scholar] [CrossRef]
  58. Schurack, S.; Depotter, J.R.; Gupta, D.; Thines, M.; Doehlemann, G. Comparative transcriptome profiling identifies maize line specificity of fungal effectors in the maize—Ustilago maydis interaction. Plant J. 2021, 106, 733–752. [Google Scholar] [CrossRef] [PubMed]
  59. Ghorbani, A.; Izadpanah, K.; Dietzgen, R.G. Changes in maize transcriptome in response to maize Iranian mosaic virus infection. PLoS ONE 2018, 13, e0194592. [Google Scholar] [CrossRef] [Green Version]
  60. Tzin, V.; Hojo, Y.; Strickler, S.R.; Bartsch, L.J.; Archer, C.M.; Ahern, K.R.; Zhou, S.; Christensen, S.A.; Galis, I.; Mueller, L.A. Rapid defense responses in maize leaves induced by Spodoptera exigua caterpillar feeding. J. Exp. Bot. 2017, 68, 4709–4723. [Google Scholar] [CrossRef] [Green Version]
  61. Database Resources of the National Genomics Data Center, China National Center for Bioinformation in 2023. Nucleic Acids Res. 2023, 51, D18–D28. [CrossRef] [PubMed]
  62. Szklarczyk, D.; Kirsch, R.; Koutrouli, M.; Nastou, K.; Mehryary, F.; Hachilif, R.; Gable, A.L.; Fang, T.; Doncheva, N.T.; Pyysalo, S. The STRING database in 2023: Protein–protein association networks and functional enrichment analyses for any sequenced genome of interest. Nucleic Acids Res. 2023, 51, D638–D646. [Google Scholar] [CrossRef] [PubMed]
  63. Hamilton, J.P.; Robin Buell, C. Advances in plant genome sequencing. Plant J. 2012, 70, 177–190. [Google Scholar] [CrossRef] [PubMed]
  64. Monaco, M.K.; Stein, J.; Naithani, S.; Wei, S.; Dharmawardhana, P.; Kumari, S.; Amarasinghe, V.; Youens-Clark, K.; Thomason, J.; Preece, J. Gramene 2013: Comparative plant genomics resources. Nucleic Acids Res. 2014, 42, D1193–D1199. [Google Scholar] [CrossRef] [Green Version]
  65. Cannon, S.B.; Mitra, A.; Baumgarten, A.; Young, N.D.; May, G. The roles of segmental and tandem gene duplication in the evolution of large gene families in Arabidopsis thaliana. BMC Plant Biol. 2004, 4, 10. [Google Scholar] [CrossRef] [PubMed] [Green Version]
  66. Zhu, Y.; Wu, N.; Song, W.; Yin, G.; Qin, Y.; Yan, Y.; Hu, Y. Soybean (Glycine max) expansin gene superfamily origins: Segmental and tandem duplication events followed by divergent selection among subfamilies. BMC Plant Biol. 2014, 14, 93. [Google Scholar] [CrossRef] [PubMed] [Green Version]
  67. Cui, K.; Wu, W.-w.; Diao, Q.-y. Application and research progress on transcriptomics. Biotechnol. Bull. 2019, 35, 1. [Google Scholar]
  68. Zhang, H.; Wu, T.; Li, Z.; Huang, K.; Kim, N.-E.; Ma, Z.; Kwon, S.-W.; Jiang, W.; Du, X. OsGATA16, a GATA transcription factor, confers cold tolerance by repressing OsWRKY45–1 at the seedling stage in rice. Rice 2021, 14, 42. [Google Scholar] [CrossRef]
  69. Nutan, K.K.; Rathore, R.S.; Tripathi, A.K.; Mishra, M.; Pareek, A.; Singla-Pareek, S.L. Integrating the dynamics of yield traits in rice in response to environmental changes. J. Exp. Bot. 2020, 71, 490–506. [Google Scholar] [CrossRef]
  70. Zhao, T.; Wu, T.; Pei, T.; Wang, Z.; Yang, H.; Jiang, J.; Zhang, H.; Chen, X.; Li, J.; Xu, X. Overexpression of SlGATA17 promotes drought tolerance in transgenic tomato plants by enhancing activation of the phenylpropanoid biosynthetic pathway. Front. Plant Sci. 2021, 12, 634888. [Google Scholar] [CrossRef]
  71. He, H.; Zhu, S.; Jiang, Z.; Ji, Y.; Wang, F.; Zhao, R.; Bie, T. Comparative mapping of powdery mildew resistance gene Pm21 and functional characterization of resistance-related genes in wheat. Theor. Appl. Genet. 2016, 129, 819–829. [Google Scholar] [CrossRef] [PubMed]
  72. Zhang, K.; Jia, L.; Yang, D.; Hu, Y.; Njogu, M.K.; Wang, P.; Lu, X.; Yan, C. Genome-wide identification, phylogenetic and expression pattern analysis of gata family genes in cucumber (Cucumis sativus L.). Plants 2021, 10, 1626. [Google Scholar] [CrossRef] [PubMed]
Figure 1. The distribution of GATA gene family on maize chromosomes. Note: Red-labeled genes are tandem duplication genes, green-labeled genes are segmental duplication genes, and blue-labeled genes have both tandem and segmental duplication genes.
Agronomy 13 01921 g001
Figure 2. Phylogenetic analysis of GATA proteins from maize, Arabidopsis, and rice.
Agronomy 13 01921 g002
Figure 3. Exon–intron structures of GATA genes and a schematic diagram of the amino acid motifs of GATA proteins in maize.
Agronomy 13 01921 g003
Figure 4. Syntenic relationships of GATA gene family in maize, A. thaliana, and rice.
Agronomy 13 01921 g004
Figure 5. The cis-acting element analysis of the promoters of maize GATA family genes. (A) Distribution of various cis-acting elements in the promoters of maize GATA genes. (B) The relative proportions of different cis-acting elements in the promoters of maize GATA genes. Note: the cis-acting elements with the same or similar functions are represented in the same color.
Agronomy 13 01921 g005
Figure 6. The expression heatmap of GATA gene family in different tissues of maize. Note: the data in the boxes indicated original FPKM values.
Agronomy 13 01921 g006
Figure 7. The expression heatmaps of maize GATA gene family under abiotic stress treatments. (A) The expression patterns of maize GATA family genes under high- and low-temperature stresses. NT: normal temperature (25 °C); HT: high temperature (37 °C); MHT: medium-high temperature (42 °C); EHT: extremely high temperature (48 °C); LT: low temperature (16 °C); MLT: medium-low temperature (10 °C); ELT: extremely low temperature (4 °C). (B) The expression patterns of maize GATA family genes under salt stress. S-CT: control treatment (0 mM NaCl) of salt-sensitive maize inbred line (L29); S-salt: salt treatment (220 mM NaCl) of salt-sensitive maize inbred line (L29); T-CT: control treatment (0 mM NaCl) of salt-tolerant maize inbred line (L87); T-salt: salt treatment (220 mM NaCl) of salt-tolerant maize inbred line (L87). (C) The expression patterns of maize GATA family genes under waterlogging stress. WS-0 h: waterlogging stress for 0 h; WS-2 h: waterlogging stress for 2 h; WS-4 h: waterlogging stress for 4 h; WS-6 h: waterlogging stress for 6 h; WS-8 h: waterlogging stress for 8 h; WS-10 h: waterlogging stress for 10 h; WS-12 h: waterlogging stress for 12 h. (D) The expression patterns of maize GATA family genes under drought stress. Control-ear: control treatment (20–35 °C, normal nutrients, well-watered with soil water content ≥ 19.5%) of ear; Drought-ear: drought treatment (20–35 °C, normal nutrients, well-watered with soil water content ≥ 14.0–15.0%) of ear; Control-leaf: control treatment of leaf; Drought-leaf: drought treatment of leaf; Control-kernel: control treatment of kernel; Drought-kernel: drought treatment of kernel. Note: In each figure, the data in the left boxes indicated the original FPKM values. The data in the right boxes were the log2(fold-change) values highlighted by red (up-regulation) and green (down-regulation) colors.
Agronomy 13 01921 g007
Figure 8. The expression heatmaps of maize GATA gene family under biotic stress treatments. (A) The expression patterns of maize GATA family genes under Maize Iranian mosaic virus stress, CT: control treatment (uninfected plant); MIMV: Maize Iranian mosaic virus treatment. (B) The expression patterns of maize GATA family genes under smut disease stress. Mock: control treatment (uninfected plant); SG200 and UMAG_02297: the biotrophic fungus Ustilago maydis strains caused maize smut disease; KO_UMAG_02297: knock-out mutant strain of UMAG_02297; 3 dpi: 3 days post-infection; B73, CML322, EGB, Ky21, Oh43 and Tx303 were six maize lines. (C) The expression patterns of maize GATA family genes under beet armyworm stress. CT: control treatment (uninfected plant); 1 hpi, 4 hpi, 6 hpi and 24 hpi were 1, 4, 6 and 24 h post-infestation of beet armyworm, respectively. (D) The expression patterns of maize GATA family genes under aphid stress, CT: control treatment (uninfected plant); aphids—6 h and aphids—24 h were 6 and 24 h post-infestation of aphids, respectively. Note: In each figure, the data in the left boxes indicated the original FPKM values. The data in the right boxes were the log2 (fold-change) values highlighted by red (up-regulation) and green (down-regulation) colors.
Agronomy 13 01921 g008
Figure 9. The expression pattern heatmap of maize GATA gene family under abiotic and biotic stress. Note: gray color represents no change in expression level, red represents up-regulation, green represents down-regulation, and blue represents both up-regulation and down-regulation.
Agronomy 13 01921 g009
Figure 10. Protein–protein interaction analysis. (A) The interaction network of maize GATA proteins (B) The interaction network between ZmGATA37 and other maize proteins.
Agronomy 13 01921 g010
Table 1. The physiochemical characteristics of 41 members in the maize GATA gene family.
Gene NameLocus NameCDS Size (bp)Number of Amino Acids (aa)Molecular Weight (kD)pIInstability IndexAliphatic IndexGrand Average of HydropathicityPrediction of Subcellular Location
ZmGATA1Zm00001d00279097232335.838.5556.4861.33−0.591Extracell
ZmGATA2Zm00001d002811111637139.527.1168.0557.44−0.682Nucleus
ZmGATA3Zm00001d005005137145646.846.3764.8755.18−0.468Chloroplast
ZmGATA4Zm00001d00919342013914.879.8265.5265.40−0.612Chloroplast
ZmGATA5Zm00001d00960461220321.788.9670.7354.48−0.504Chloroplast
ZmGATA6Zm00001d00966881327028.148.9066.0652.33−0.339Chloroplast
ZmGATA7Zm00001d010785115538440.375.6356.4471.77−0.462Nucleus
ZmGATA8Zm00001d01177158819521.249.7161.2557.28−0.839Nucleus
ZmGATA9Zm00001d012757112837539.415.5761.1766.45−0.342Nucleus
ZmGATA10Zm00001d01333183727829.778.6052.5067.88−0.453Nucleus
ZmGATA11Zm00001d01465688229330.879.2345.0764.44−0.462Nucleus
ZmGATA12Zm00001d016361111337039.519.3564.3163.16−0.431Nucleus
ZmGATA13Zm00001d017409118539441.938.4355.9573.86−0.392Nucleus
ZmGATA14Zm00001d018421126942243.435.5568.0365.17−0.319Nucleus
ZmGATA15Zm00001d022142228376086.758.6447.9972.05−0.417Nucleus
ZmGATA16Zm00001d023539138646149.379.4477.4665.23−0.652Chloroplast
ZmGATA17Zm00001d02354066622123.338.2568.0658.05−0.618Nucleus
ZmGATA18Zm00001d023541201667173.797.3774.1466.66−0.732Nucleus
ZmGATA19Zm00001d025953131743846.179.0769.1559.86−0.548Chloroplast
ZmGATA20Zm00001d025988165054960.546.2358.3570.18−0.586Nucleus
ZmGATA21Zm00001d029896108636137.457.3458.1547.01−0.522Nucleus
ZmGATA22Zm00001d03113590029933.338.6361.3451.24−0.925Nucleus
ZmGATA23Zm00001d03352386728830.654.6156.2263.85−0.732Cytoplasm
ZmGATA24Zm00001d033945256585494.108.9349.1775.66−0.395Nucleus
ZmGATA25Zm00001d033946105335038.629.2447.4281.17−0.369Chloroplast
ZmGATA26Zm00001d03475149216317.999.9777.2158.22−0.887Nucleus
ZmGATA27Zm00001d036494107735838.135.0945.5268.55−0.568Nucleus
ZmGATA28Zm00001d03760543214315.579.9972.0162.87−0.628Nucleus
ZmGATA29Zm00001d038801114938239.655.6555.7673.72−0.364Cytoplasm
ZmGATA30Zm00001d03911385528429.958.5764.2054.19−0.351Chloroplast
ZmGATA31Zm00001d04077544414716.059.4366.0165.65−0.660Nucleus
ZmGATA32Zm00001d041883138646149.3810.0367.1562.52−0.733Chloroplast
ZmGATA33Zm00001d04396970223323.577.4550.4057.73−0.137Mitochondrion
ZmGATA34Zm00001d046354111337038.988.5055.1767.68−0.285Nucleus
ZmGATA35Zm00001d047081112237338.558.2256.2545.76−0.521Nucleus
ZmGATA36Zm00001d04839168122623.846.4072.9359.91−0.514Nucleus
ZmGATA37Zm00001d051981121840542.285.3369.7464.02−0.424Nucleus
ZmGATA38Zm00001d05241289429731.026.4473.5764.88−0.497Nucleus
ZmGATA39Zm00001d05241361520422.1310.2374.8862.75−0.702Nucleus
ZmGATA40Zm00001d05243061520422.2110.2373.6262.25−0.732Nucleus
ZmGATA41Zm00001d052431141947249.219.2674.4060.11−0.579Nucleus
Table 2. The motif information of maize GATA proteins.
MotifSequenceNumber of Amino AcidsPfam Annotation
motif 1HCGTTKTPQWRSGPLGPKTLCNACGVRYK29GATA
motif 2GRLLPEYRPAASPTFVPSQHSNSHRKVMZ29-
motif 3KRLNYPHRVASLMRFREKRKERNFDKKIRYSVRKEVALRMQRRKGQF47-
motif 4GGNGGNNRSAALPVALAPPSGSTGGAVRRRRPVPRPRNRQVQRTCS46-
motif 5ELYEPSDDLAELEWLSNIMDD21-
motif 6CGEDAVRLVGEYGVDAYPFSAQRRRELESMDDARRGGGRLQELLGCEERDYVISADDIKIPIADLAGKTVGLYFGAHWCPPCHVFTKQLKEVYNELKILR100-
motif 7KKPNHIIMENGPFSGQNFRKMGDVDPSYRSSSGSAVSYSESCAPYGAADASEMTGSAQSHAWESLVPSRKRSCVTRPKPSPVEKLAKELNFIMHEEKLYY100-
motif 8EHPRAMDVLQFPQRWQAYTALRSAGKSVEIIFVSLDRDEASFRDHFQGMSWLAVPFDAAGLLRQKLCARFAIERIPALI79-
motif 9EEDLLYHSETPIGSFEIGSGSVLLRHPNSKSLEEESEASSIPADNKSYITSESYSGSASFVIHNGNKAAINLNAPNARPKKSPLHMEDNARRCKLFYERQ100-
motif 10MSNQPPHASLQDDLPDCDGDDPLALAIRLFPAHTTGAGLSPAALGIGRVAEPPRREQEPLANSTYGVRGAGPDPWGLRLSRSVLGGLDGFDVDTFFADD99-
Disclaimer/Publisher’s Note: The statements, opinions and data contained in all publications are solely those of the individual author(s) and contributor(s) and not of MDPI and/or the editor(s). MDPI and/or the editor(s) disclaim responsibility for any injury to people or property resulting from any ideas, methods, instructions or products referred to in the content.

