1. Introduction
Traditional irrigation distributes water according to some rotation to guarantee the proportional and fair distribution of water resources among all beneficiaries. Such systems provide a minimum level of reliability and flexibility, and it is quite likely that farmers cannot irrigate crops at critical times [
1]. For on-demand irrigation networks, the time, duration and frequency of using the hydrant for different farmers are different, which leads to a significant pattern variation of the open hydrants, both in time and space [
2]. With the increasing number of irrigation water users, the necessity of larger and more complicated water supply systems and distribution networks is crucial [
3]. Different algorithms and software have been developed to control on-mand WDN. Ayad presents a GIS-based model for water pipeline network data integration and analysis named Integrated Water Distribution network design and Calibration Utility (IWDCU) [
4].
Better irrigation practices, smart irrigation management in agriculture is essential for increasing crop yield. A closed-loop irrigation system for sugarcane farms using the Internet of Things was developed. The solution seeks to improve irrigation management by seamlessly integrating the WiSA automated irrigation system with the IrriWeb irrigation decision support tool [
5]. To extend the findings of previous studies investigating the proper positioning of water content sensors, the representativeness of soil water content sensors’ readings and the existence of Time Stable Representative Positions are investigated using a specially developed mathematical model [
6]. Salima evaluated differences between six mixtures of C
3–C
4 turfgrass grown under two water regimes (limited and high irrigation), and the regression and conceptual model using remote sensing parameters revealed the most adequate criteria to detect turfgrass variability under each growing condition [
7]. To evaluate turfgrass performance, temporal and spatial soil moisture, and salinity dynamics, four irrigation scheduling approaches were compared. The results provide essential information to guide adopting data-driven approaches to irrigation scheduling [
8].
Considering the crop distribution in an irrigation area, Lima has developed a tool for simulating an on-demand irrigation network. This tool is helpful as a decision support system tool to manage on-demand collective irrigable areas with minimum energy costs at the pump station and perform an irrigation schedule to guarantee crop water requirements [
9,
10]. A methodology to obtain the optimal characteristic and efficiency curves of pumping stations is present, which can provide the irrigation pump’s theoretical characteristic and efficiency curves and the number of frequency speed drives for special demands [
11]. Campos presents a new methodology for the recording of irrigation scheduling, incorporating the constraint of daily volume requests for each hydrant, and the methodology is capable of minimizing the cost of energy while maximizing pressure at the critical hydrants [
12].
Pardo developed a computer application in MATLAB containing a genetic algorithm to find the best moment to open and close valves to minimize an objective function which measures the differences between the objective and the real injected flows [
13]. Even though many water distribution network problems have been extensively investigated in the scientific literature, the on-demand WDN is a rather complex problem challenging operation, maintenance, and management issues [
14,
15]. Irrigation pumping stations are one of the main elements of irrigation systems, fine adjustment of the impeller, changing the rotation frequency of the impeller, and switch control through the pump unit are the main control methods for irrigation pumping stations. At the same time, the Ball Valve also is an important control component in the irrigation system. The main research contents include the flow coefficient characteristics, resistance coefficient characteristics, pressure drop, and internal flow distribution. In recent years, with the development of computational fluid dynamics and artificial intelligence technology, the joint control technology of irrigation pumps and ball valves has been extensively studied. Moreno has developed a tool to improve energy efficiency in water user associations, and the tools were also utilized to propose measures to improve energy use [
16]. To improve the energy and hydraulic performance of large-scale pressurized irrigation, Khadra has developed a management-oriented multistep methodology that integrates different existing models into a sector system according to the pressure requirements of the hydrants [
17]. For the centrifugal pumps of type “D” in the Republic of Uzbekistan, Kan presents the method of fine-tuning the central impeller, changing the rotating frequency of the impeller and switching the pump unit [
18]. Utilizing the UDF technology and computational fluid dynamics, the transient numerical simulation of the ball valve under different opening degrees has also been carried out [
19]. The EPANet program was used to simulate the pressure distribution of WDN, the WDN was used as a black box feasibility determination, and a novel stochastic partitioning algorithm was applied to regulate water pumps [
20]. Corcoles has developed a methodology and optimum regulation of pumping stations tool to estimate the pressure head at all nodes of a WDN [
21]. To study the influence of valve opening degree on WDN, the model for the pipeline, gate valve and the controller for valve opening were developed, and a series of comparative model parameters were established based on the Flowmaster software, the variation of pipeline resistance coefficient under different valve opening degrees was emphasized [
22]. For the pipeline system, flow rate and pressure affect each other. It is difficult to control them separately, and slow response speed of traditional flow and pressure control. To solve those problems, a flow-pressure coupling adjustment method. For multi-user water distribution in the head of the irrigation system, based on generalized regression neural network was proposed [
23]. The pump stations and ball valves are two essential control parameters of the on-demand WDN, and they jointly determine whether the control system can meet the demand for the hydrants [
24]. To meet the water demand for hydrants, it is still necessary to further study the theory and technology of on-demand WDN.
Considering the frequency of the head pump and the opening degree of the ball valve in the main and branch pipelines, the main objective of this paper is to explore the relationship between the flow rate and pressure of different branch pipelines and the corresponding pump impeller speed and valve opening degree. The corresponding control system is a multi-input and MIMO system. An experimental device for the on-demand WDN was built, the pipeline of this device includes one main pipeline and three branch pipelines, and the control system included functions such as detection, control, data storage, and query, and the Raspberry Pi 4B was used as the controller. The prediction error of pressure in the main pipeline and three branch pipelines were used as the objective function, an intelligent control model was constructed by using multiobjective optimization neural network based on experimental data, and the super parameters of the neural network model were optimized, finally, a control model suitable for the on-demand WDN was established.
This paper aims to design and develop an intelligent control technology and system using a hardware platform connected to pressure and flow sensors to monitor and control irrigation pump stations. And additionally, determine the opening degree of valves in the pipeline and the frequency of the pump station using multiobjective optimization.
Highlights:
On-demand irrigation control technologies are needed to optimize crop production.
The opening degree of valves and frequency of the pump station are used to control the pressure and flow.
Machine learning and multiobjective optimization methods optimize the on-demand MIMO control system.
This paper is organized into material and methods, system hardware design, control system software, multiobjective optimization method, experimental design, and multiobjective optimization method based on machine learning were given. The result and analysis of the optimized forecasting model were given, and we compared six models under four types of experimental tests. In conclusion, we conclude this paper with future work.
2. Materials and Methods
2.1. System Hardware Design
The control system of on-demand WDN should meet the following requirements: (1) The system can automatically and real-time detect the pressure and flow of the main pipeline; (2) The system can automatically and real-time detect the pressure and flow of three branch pipelines; (3) The system can control the speed of the water pump impeller and the opening degree of branch electric valve; (4) The system should have the functions of detection, control and multiobjective optimization, which can achieve the display and optimization process of pressure and flow.
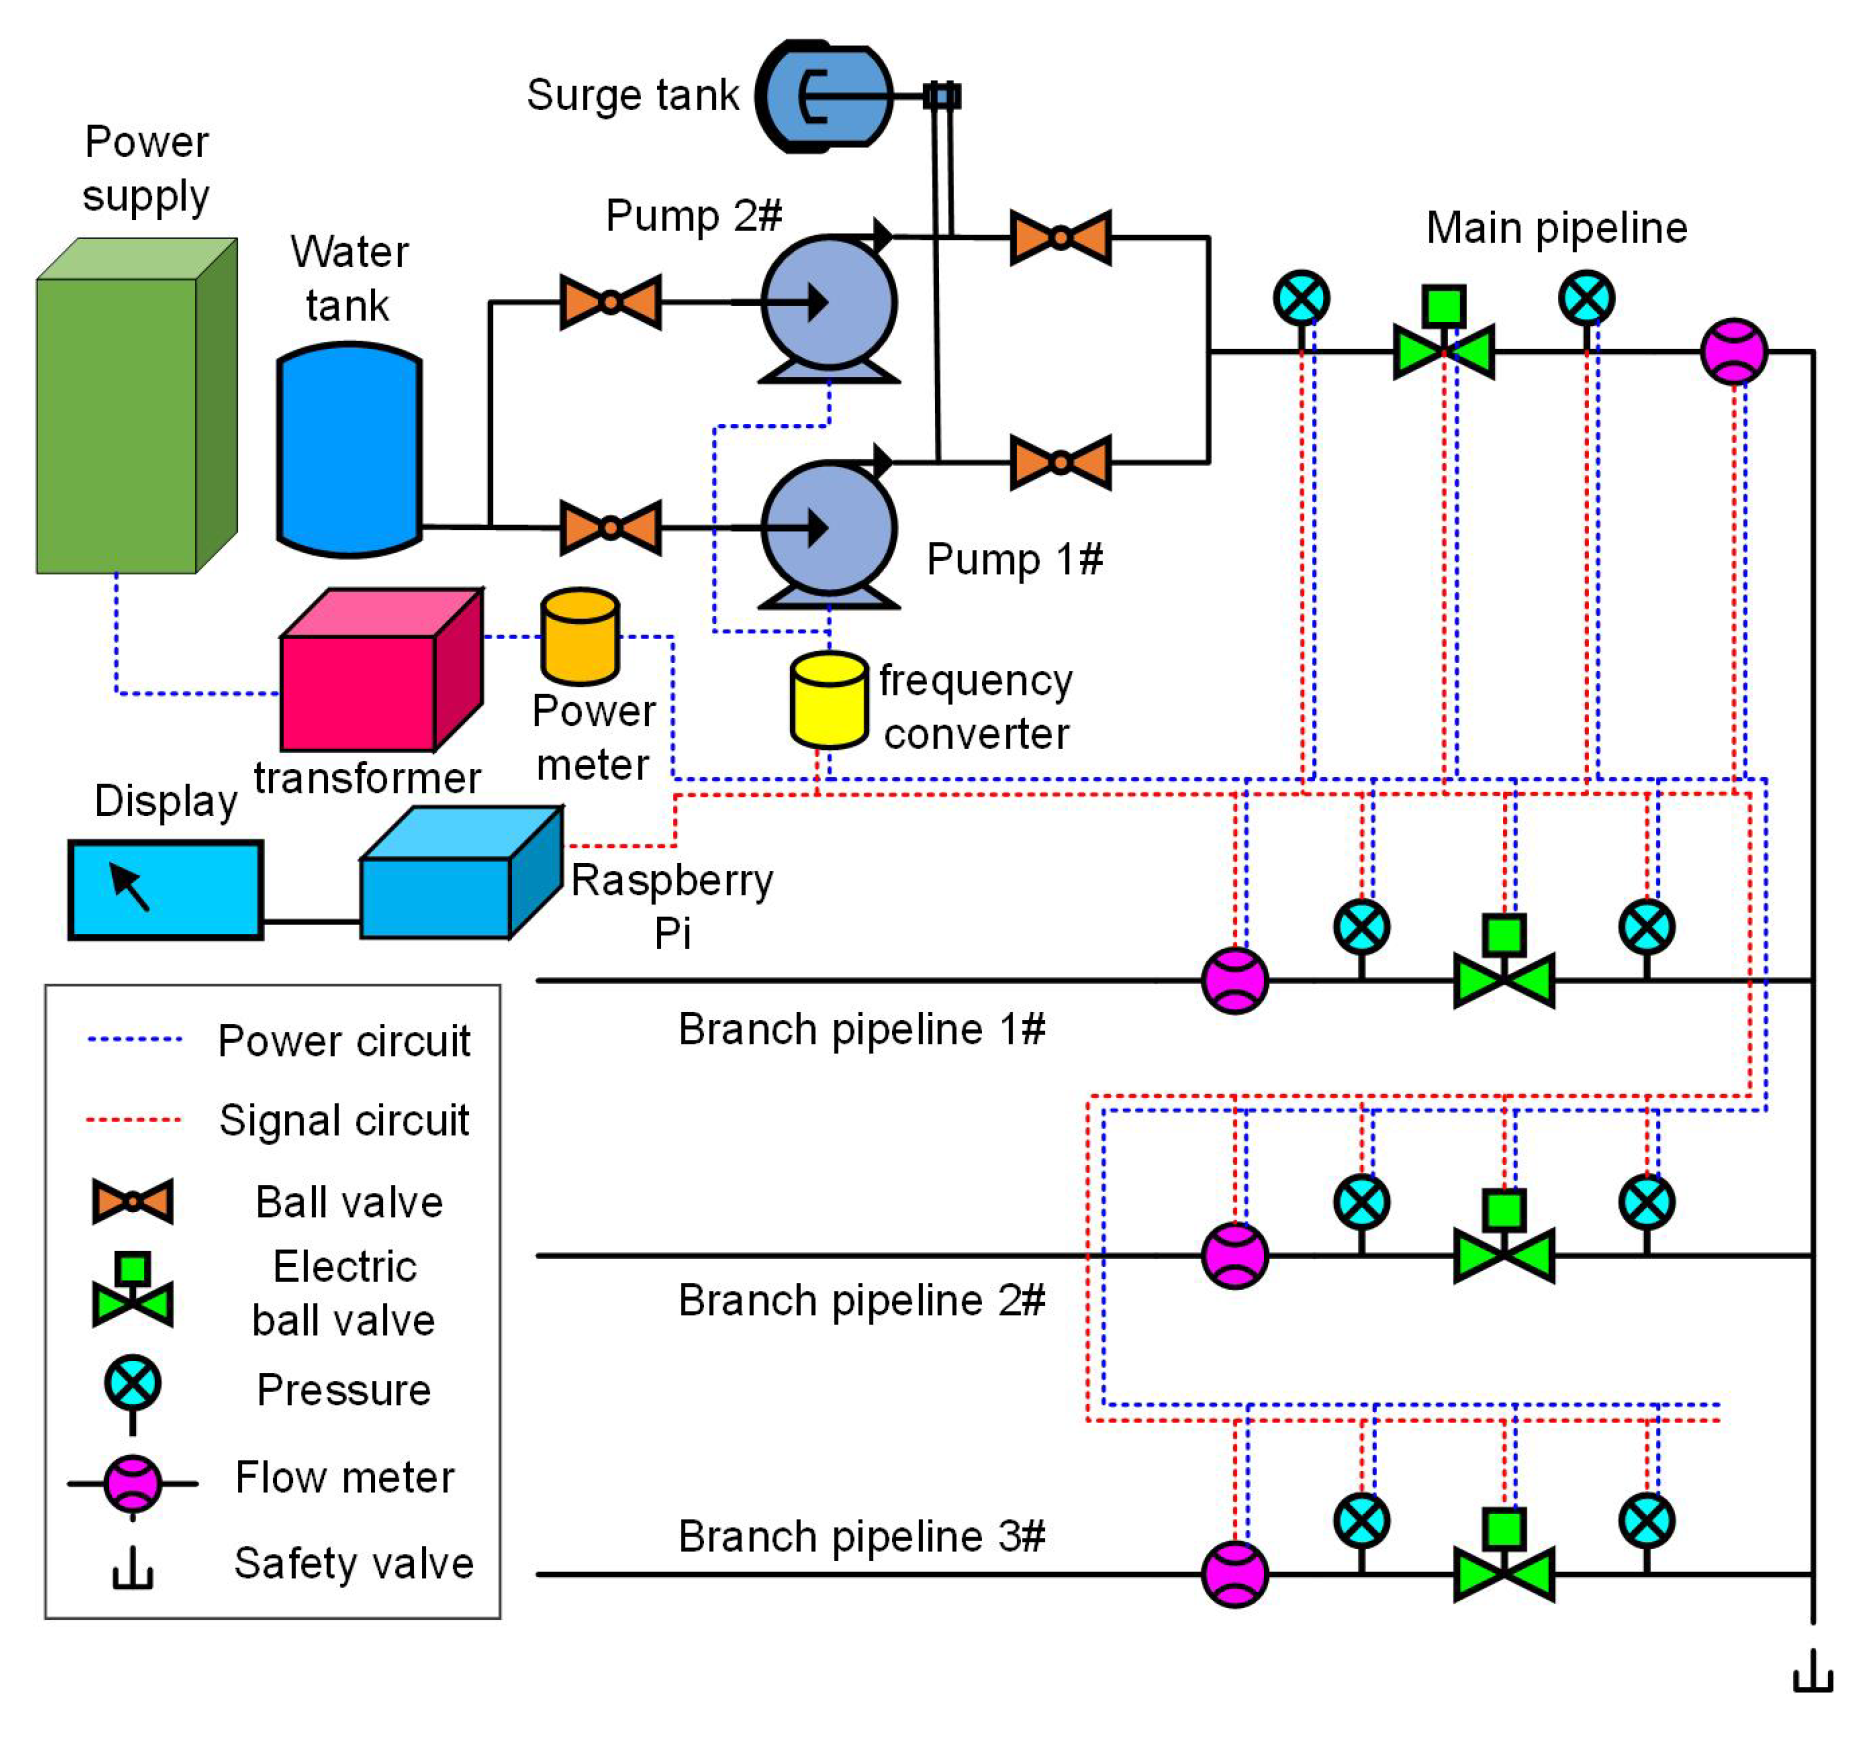
According to the above requirements, the structure of the experimental device is shown in
Figure 1, which is mainly composed of executive components, monitor, and control components. The executive components include the centrifugal pump station and its frequency converter, the electric ball valve and three branch electric valves. The head pump is a vertical centrifugal pump (CDMF20-10FSWSC, South Pump Industry, Taizhou city, China), with a rated flow of 30 mh
−1, head of 119 m, power of 11 kW and rotating speed of 2900 r/min. The frequency converter for controlling the pump station is ABBACS510-10. The diameter of the main pipeline is 90 mm, and the diameters of the three branch pipelines connected with the main pipeline are 75 mm. The electric ball valves (TQ911F-10S), pressure sensors (U-MIK-P300-M) and electromagnetic flow sensors (L-MABB) were installed on the main pipeline and the three branches, respectively. The monitor and control components include Raspberry Pi 4B, display screen, digital to analog conversion module (DA), RS485 data communication module, pressure and flow sensors, and the experimental device also includes a water tank, surge tank, manual ball valve, drainage valve, power supply and distribution box.
Monitoring data and control signals during the experimental process use the MODBUS master-slave communication protocol. Raspberry Pi 4B receives the sensor monitoring data using this protocol. At the same time, the Raspberry Pi writes data into the register to control the electric ball valve. According to the data in the register, the opening degree of the electric ball valve was changed. The frequency of the frequency converter was controlled by the digital amount transmitted by Raspberry Pi to the DA module, and then the speed of the pump station would be controlled.
2.2. Control System Software
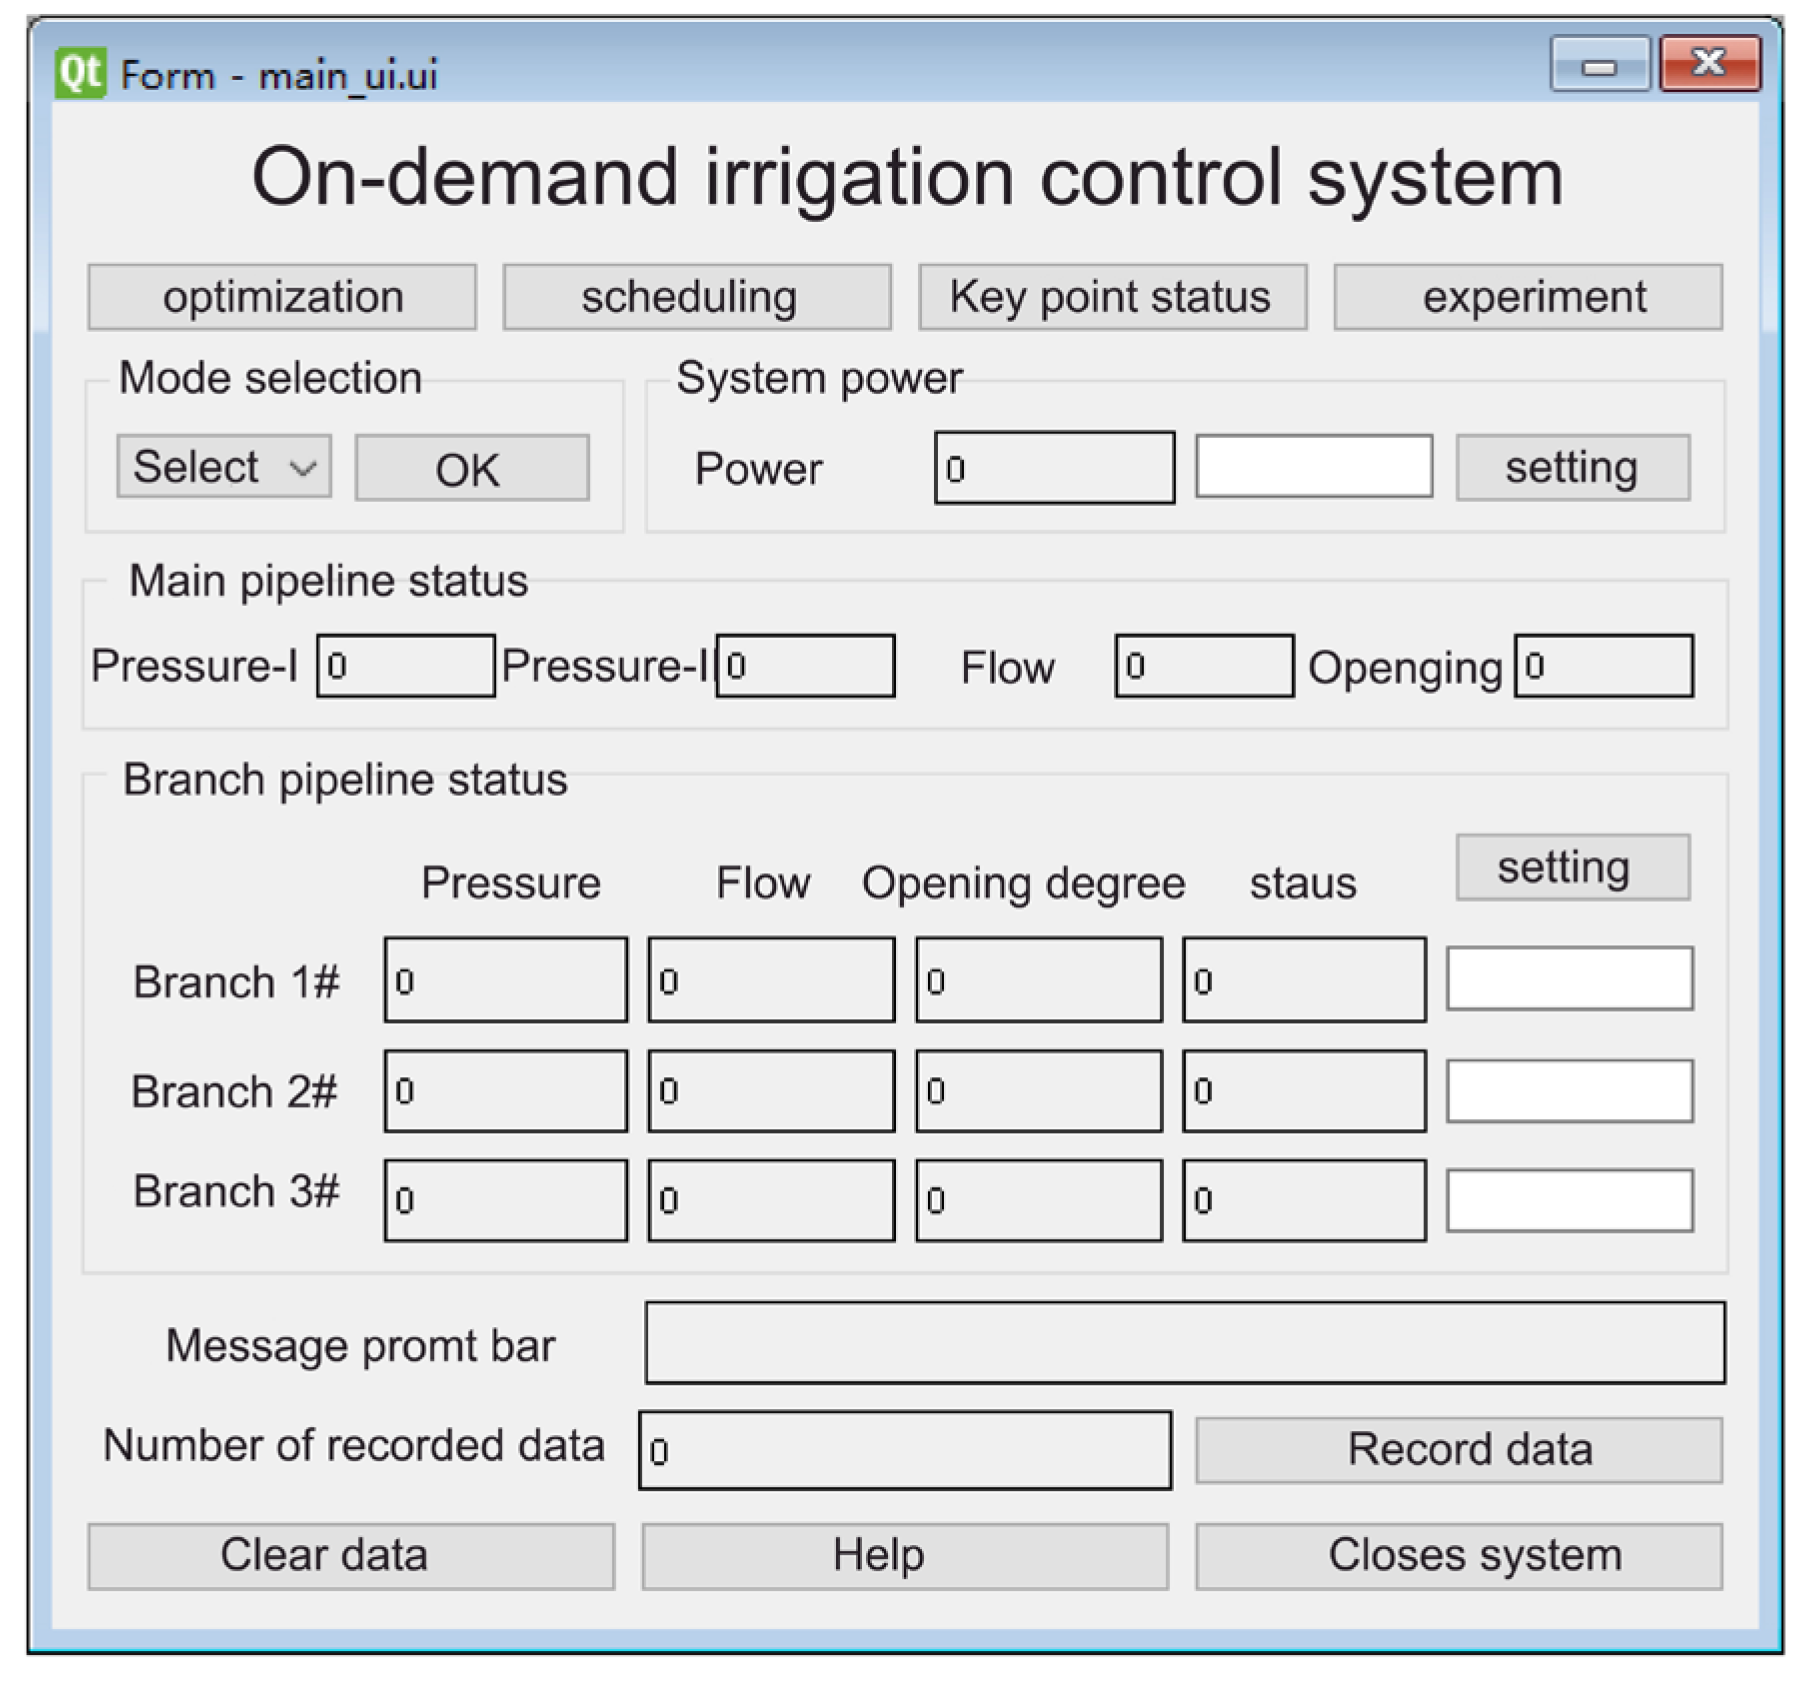
To improve the visualization and operability of control system, the Python editing language, the PyCharm integrated development environment (IDE), Qt Designer interactive visual design tool, and SSH (Secure shell) remote communication security protocol [
25] were used developing an on-demand WDN control system software, as shown in
Figure 2, the functions of this software are control parameters optimization, irrigation schedule, monitor the status of key nodes in pipeline, and control performance tests, respectively. Among them, the control parameters optimization was developed based on the optimized model, and the best opening degree of the electric valve can be obtained. The irrigation schedule includes water demand data for crops at different growth stages. They monitor the status of key nodes in the pipeline, which can display the data of pressure and flow in real time, as well as the opening degree of all-electric valves in the pipe network. The control performance test controls the system using the input box of the pump station impeller speed and the opening degree of electric ball valves. The software also includes the functions of querying historical data and clearing data. This software has both manual and automatic control modes.
The MODBUS protocol is used for data transmission between sensors, electric valves, and controllers, and the data transmitted by the protocol is a hexadecimal byte string the Raspberry Pi cannot directly recognize. Therefore, a program for converting hexadecimal byte strings to decimal physical quantities has been developed for pressure sensors and flow meters, and a program for converting decimal valves o hexadecimal byte strings has been developed for the opening degree of electric ball valves. Due to the limitations of Raspberry Pi’s computing power memory read and write speed, a single-threaded controller has lower program efficiency when monitoring and converting data from the pressure sensors, the display control of the control system software may encounter errors, and the control software is unable to handle other tasks. To solve this problem, a multithreaded running program was developed using the signal and slot mechanism, which improved the response speed of the control system program and ensured the normal operation of the system.
2.3. Multiobjective Optimization Method
2.3.1. Mathematical Description of Multiobjective Optimization
The multiobjective optimization problem is composed of multiple objective functions, related equations and inequality constraints [
26], and the related formulas are as follows:
Subject to:
gi(
x) ≥ 0,
i = 1, 2, ⋯, p
where:
fi(
x), {
i = 1, 2, 3, ⋯, m} are called objective functions,
gi(
x) and
hj(
x) are called constraint functions, and
x = {
x1,
x2, ⋯,
xn}
T is n-dimensional design variable, and all a set of design variables satisfying the constraint functions are called a feasible solution. The above multiobjective optimization problem is transformed into a minimized objective function, and a standard multiobjective optimization model can be obtained by using all inequalities as constraints [
27]:
subject to:
gi(
x) ≤ 0,
i = 1,2, ⋯, p
All the objective functions f1(x), f2(x), ⋯, fm(x) constitute the objective function vector F(X) of the multiobjective optimization problem, and the objective function corresponds to a mapping from the N-dimensional design variable space to the M-dimensional objective function space.
2.3.2. Multiobjective Optimization Model of on-Demand WDN
Through extensive literature and research [
26,
28,
29,
30,
31], it can be known that the hydrant’s pressure and flow demand can be determined by crop irrigation system, pipe network layout and other factors. In the process of on-demand irrigation water distribution, the pressure and flow demand of most hydrants of on-demand irrigation changes randomly, and the control input parameters of on-demand irrigation systems cannot be obtained using rotation irrigation control technology.
In this paper, it is proposed to adjust the speed of the pump station impeller and the opening degree of the electric valves to meet the pressure and flow demand of hydrants. There are five input parameters for the on-demand irrigation control system, the operating frequency of the pump (impeller speed), the opening degree of the electric valve in the main pipeline, and three opening degrees of the electric valve in the branch pipeline, respectively. While the output parameters of the control system are the flow and pressure of the three branches pipeline, the flow of the main pipeline and two pressure before and after the electric valve in the main pipeline. The control system belongs to a multi-input and multi-output system. Because there are five input parameters for the control system, these input parameters were taken as target variables. This paper proposes to optimize the control target variables using the multiobjective optimization method. The constraint conditions are the pressure-bearing capacity of the pipeline, and the related parameters are not negative.
The first objective function is the average absolute error value of the opening degree for the electric valve controlled in the main pipeline and three branch pipelines:
where:
Foi is the expected opening degree of the electric valve, %;
Fi is the opening degree of the electric valve optimized by the control system, %.
The second objective function is the absolute error value of control frequency for the pump station:
where: H
o is the expected frequency of the pump station, Hz; H is the operating frequency of the pump station in the control system, Hz.
The multiobjective optimization function is the extreme value of the sum of the first objective function and the second objective function, as shown in Formula (8):
2.4. Experimental Design
To study the control performance of the system under different working conditions, four experimental schemes were designed in this paper. As shown in
Table 1, in experiment:
- (1)
the frequency of the pump station is set to 50 Hz, and the opening degree of the electric ball valves in the three branch pipelines is set to 100%. The opening degree of the electric valve in the main pipeline was gradually reduced from 100% to 25% by 5%.
- (2)
the opening degree of the electric valve in the main pipeline is set to 25%, and the opening degree of the electric ball valves in the three branch pipelines are all 100%. The operating frequency of the pump station is gradually reduced from 50 Hz to 20 Hz.
- (3)
the operating frequency of the pump station is set to 50 Hz, the opening degree of the electric valve in the main pipeline is set to 100%, and the opening degree of the electric valves in the three branch pipelines is gradually reduced from 100% to 15%.
- (4)
the operating frequency of the pump station is set to 50 Hz, the opening degree of the electric valve in the main pipeline is set to 100%, and the sum of the opening degree of the three branch electric ball valves is gradually reduced from 300% to 50%. The opening degree of a single branch valve is reduced in sequence by permutation and combination.
2.5. Multiobjective Optimization Method Based on Machine Learning
The control system of the on-demand irrigation system belongs to a multi-input and multi-output system. The machine learning algorithm is very suitable for constructing multi-input and multi-output nonlinear system models, with differences in the principles of different types of machine learning leading to differences in model performance. This paper selects four kinds of machine learning models with good performance, including BP, SVR, RF and XG Boost [
32,
33,
34,
35].
- (1)
The training of the BP neural network is the forward propagation of input and the backward propagation of error. The network consists of an input layer, hidden layer and output layer, and the number of hidden layers (N_hidden layer), iteration times (N_estimators) and learning rate is the main superparameters that affect the model performance.
- (2)
For MIMO systems, the SVR uses the transformation function φ to map variables to high-dimensional feature space and introduce a kernel function to make the linear algorithm have nonlinear characteristics. When the kernel function types are linear kernel function (linear) and radial basis function (RBF), stop fitting tolerance (Tol) and regularization coefficient (C) are the main parameters that affect the model performance. When the kernel function is polynomial (Ploy), degree, the constant term (Coef0), stop fitting tolerance (Tol), and regularization coefficient (C) of the polynomial function are the main superparameters that affect the performance of the model.
- (3)
RF is an integrated learning algorithm based on Bagging. Its data and feature sampling are random, and it has the advantage of fast training. The number of submodels (N-estimators), the maximum tree depth (Max_depth), the minimum number of samples required for splitting (Min_samples_split) and the minimum number of samples of leaf nodes (Min_samples_leaf) affect the model performance.
- (4)
XGBoost has added a regularization part, which can perform quadratic Taylor expansion on the error part of the loss function and has good performance. Maximum tree depth (Max_depth), Learning rate (learning rate), number of sub-models (N_estimators) and proportion of randomly sampled columns (Colsample_bytree).
Referring to domestic and foreign literatures and related materials [
34,
36,
37,
38,
39], this paper selects four types of neural network superparameters and their range of values. It counts the number of each neural network training model, as shown in
Table 2.
Using experimental data to train neural networks with different hyperparameters, combined with a multiobjective optimization function, the optimal combination of hyperparameters of neural networks is obtained. Random division of experimental data can reduce the overfitting of the neural network training process. To prevent the over-fitting of neural network training, this paper randomly divides experimental data into training sets (75%) and test sets (25%) by using the Holdout cross-validation method.
The development language of neural network program is Python 3.6, and the main libraries used are Tensorflow, Pandas, Numpy, Sklearn and Keras. The training software platform is Pycharm 2021.3, the CPU model of the training computer is Inter (R) Core (TM) i5-8500CPU @ 3.00 GHz, and the RAM is 16.0 GB.
The trained neural network adopts root mean square error (
RMSE), mean absolute error (
MAE) and correlation coefficient (
R2) as evaluation indexes, and its calculation formula is as follows: (9)–(11) [
40]:
where:
N—total number of samples;
Yi—the predicted value of the model;
—the forecast average value of the model;
Xi—true value;
—the average of true values.
3. Experimental Results and Analysis
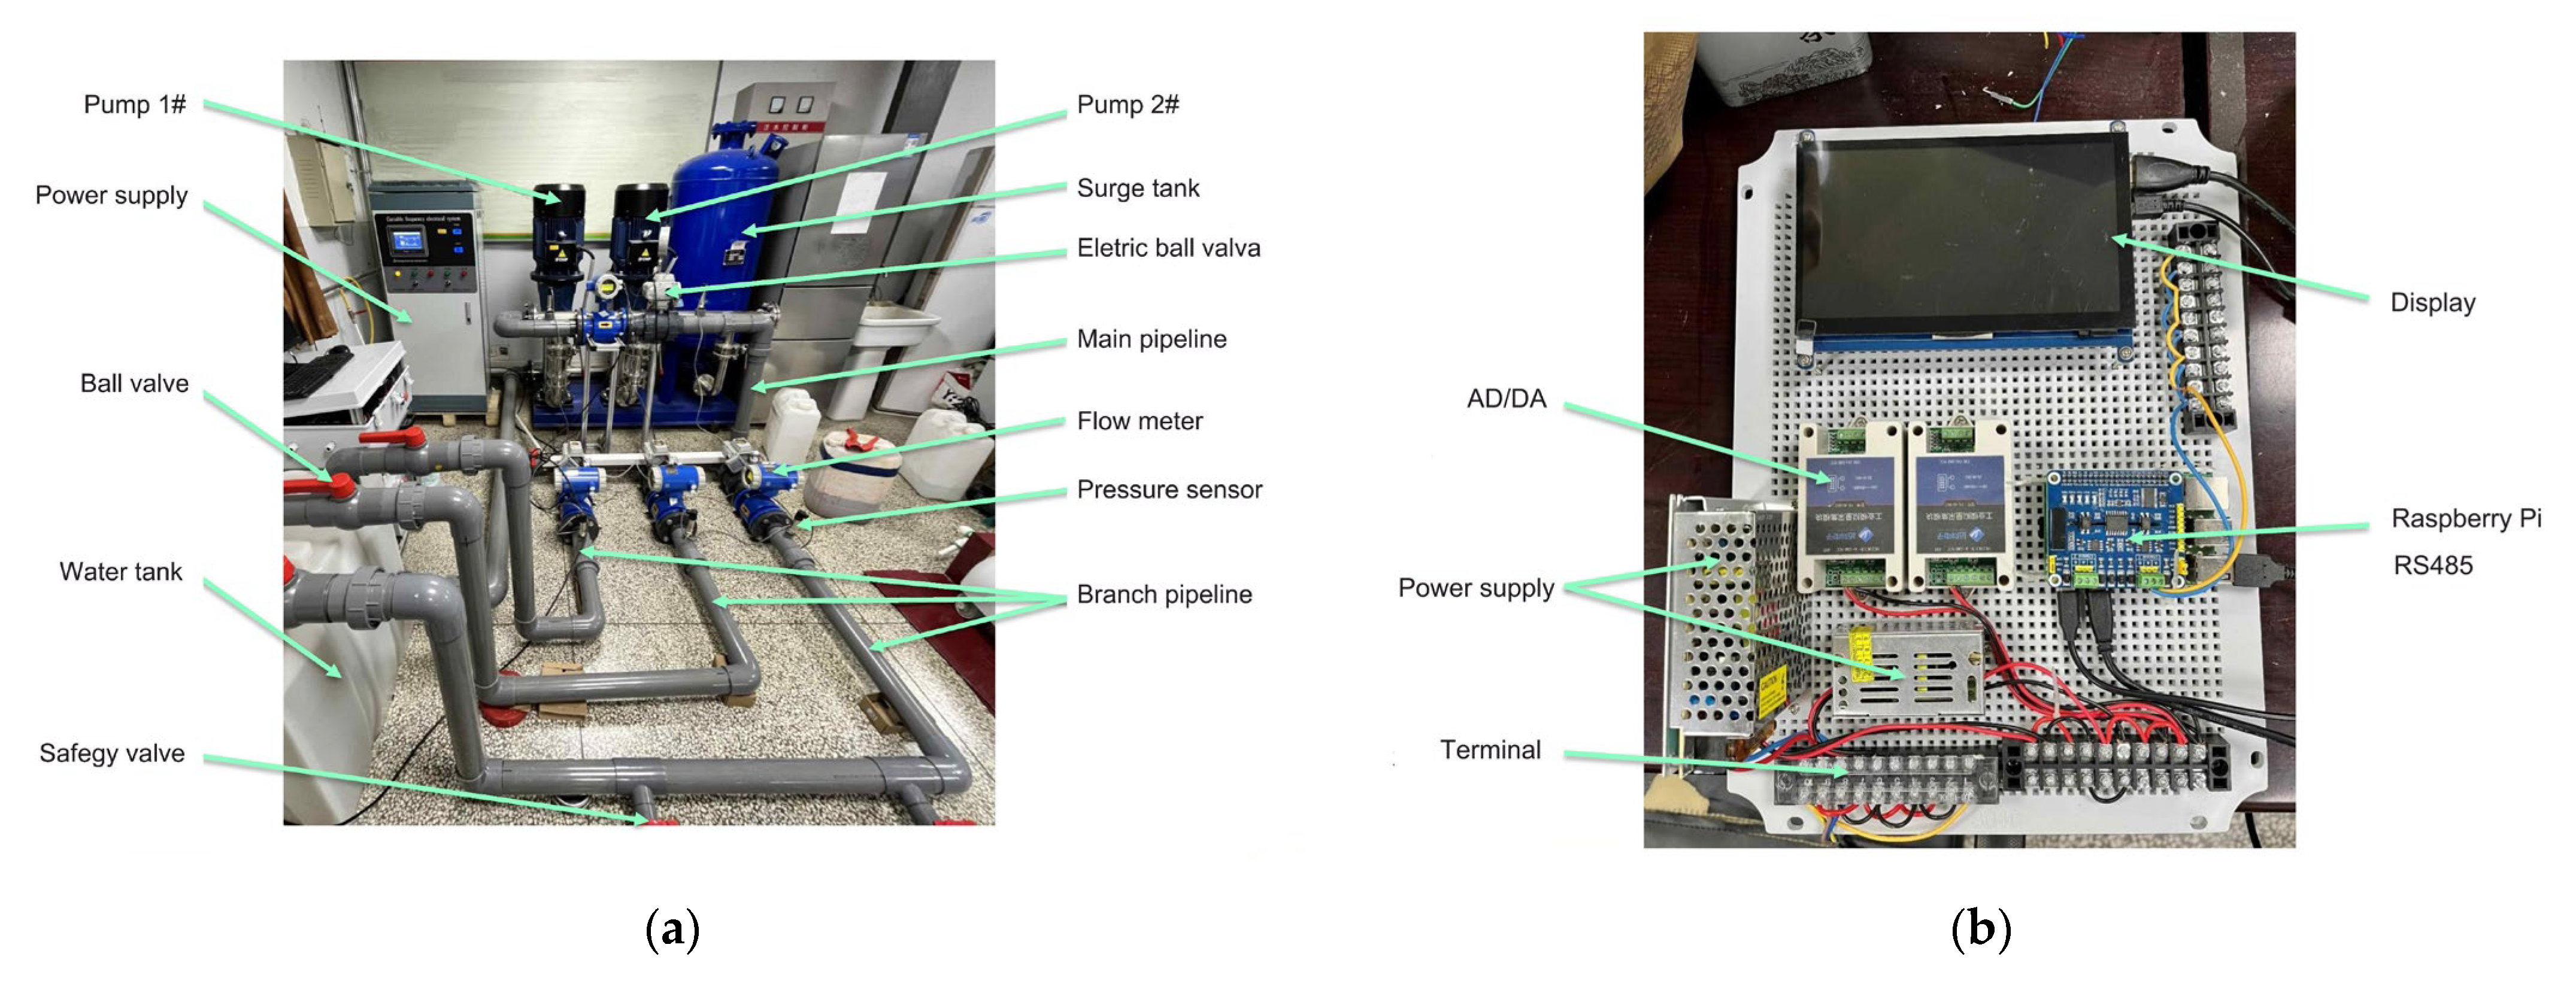
The diagram experimental device and control system are shown in
Figure 3. The input parameters of Experiments 1 and 2 are the opening degree of the electric valve in the main pipeline and the operating frequency of the pump station, respectively, and the number of tests is 16 and 29, respectively. The input parameter of experiment 3 is the opening degree of electric valves in three branch pipelines, and the number of tests is 18. Because there are few control variables in these three experiments, those test processes are not complicated. In experiment 4, there are many input parameters which need to be arranged and combined. A total of 1632 groups of experiments were obtained. To improve the experiment efficiency, this paper developed a program for the automatic input of parameters and automatic saving of experimental results. During the experiment, the program read the input parameters stored in the Excel file gradually and stored the output parameters obtained by feedback in the Excel file, which improved the efficiency of experiment data analysis and processing.
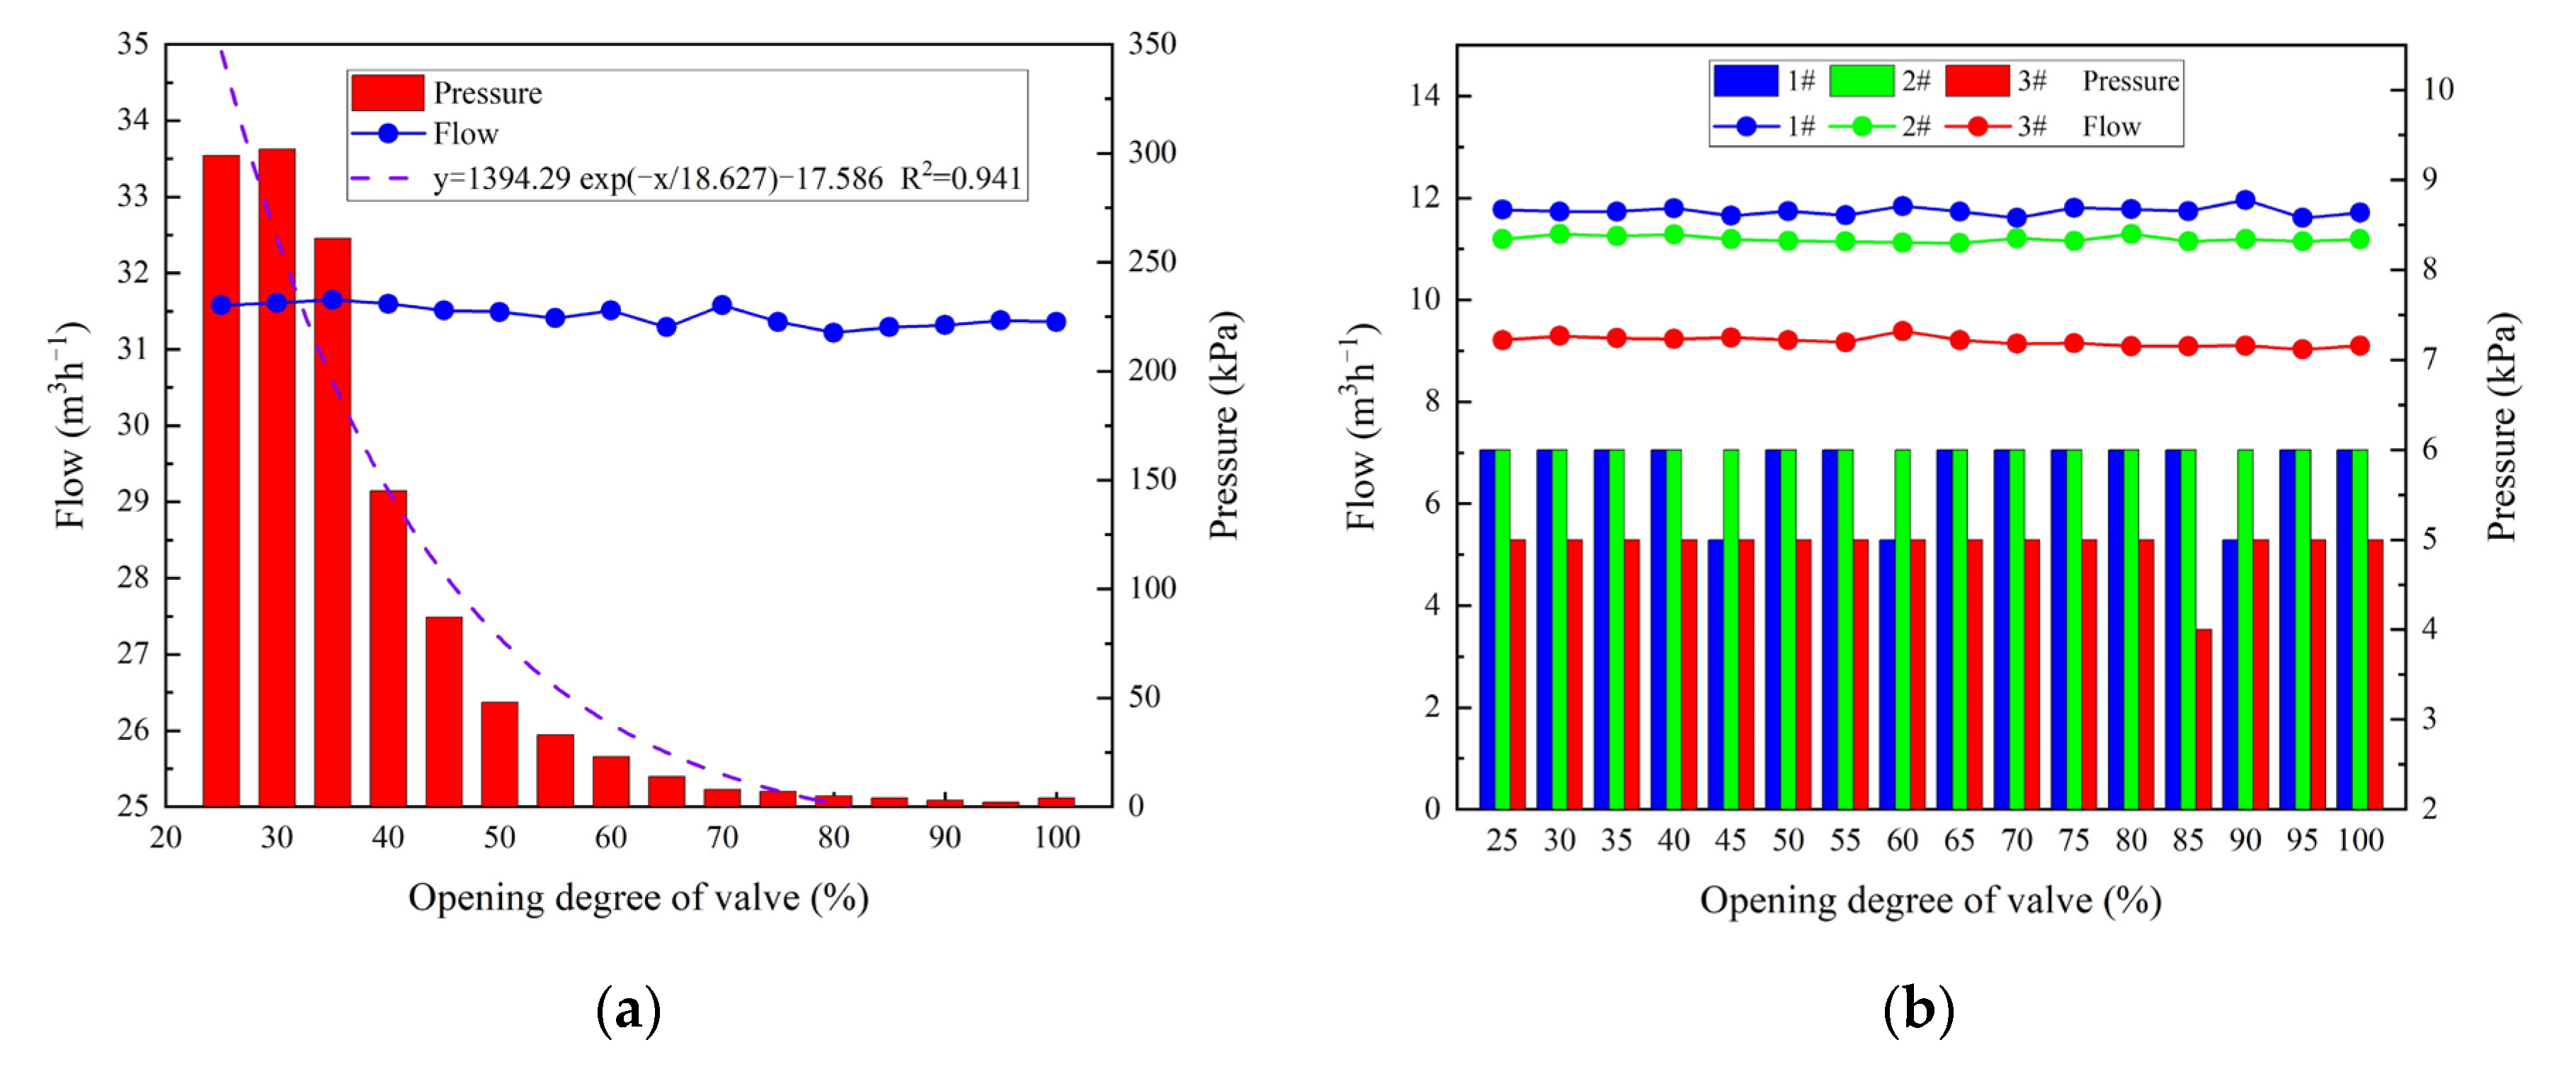
For Experiment 1, when the frequency of the pump station is fixed at 50 Hz, and the opening degree of the electric valve in the main pipeline is gradually reduced from 100% to 25%, the variation amplitude of the flow in the main pipeline is relatively small, this parameter is stable within the range of 31 mh
−1 to 32 mh
−1. However, when the opening degree in the main pipeline increases from 0 to 100, the pressure of the main pipeline drops sharply from 300 to 5 kPa, as shown in
Figure 4a. As the opening degree of the valve further increases, the pressure in the main pipeline gradually decreases to 0. The exponential function is used to fit the pressure and flow. The results indicate that the correlation coefficient of the exponential function is 0.941. These results show that the opening degree of the electric valve in the main pipeline has little effect on the flow, but it has a significant impact on the pressure. As shown in
Figure 4b, the pressure and flow of the three branch pipelines changed little during the increase of the valve opening, and the pressure and flow of the branch one pipeline and branch two pipelines were greater than the branch three pipelines, respectively.
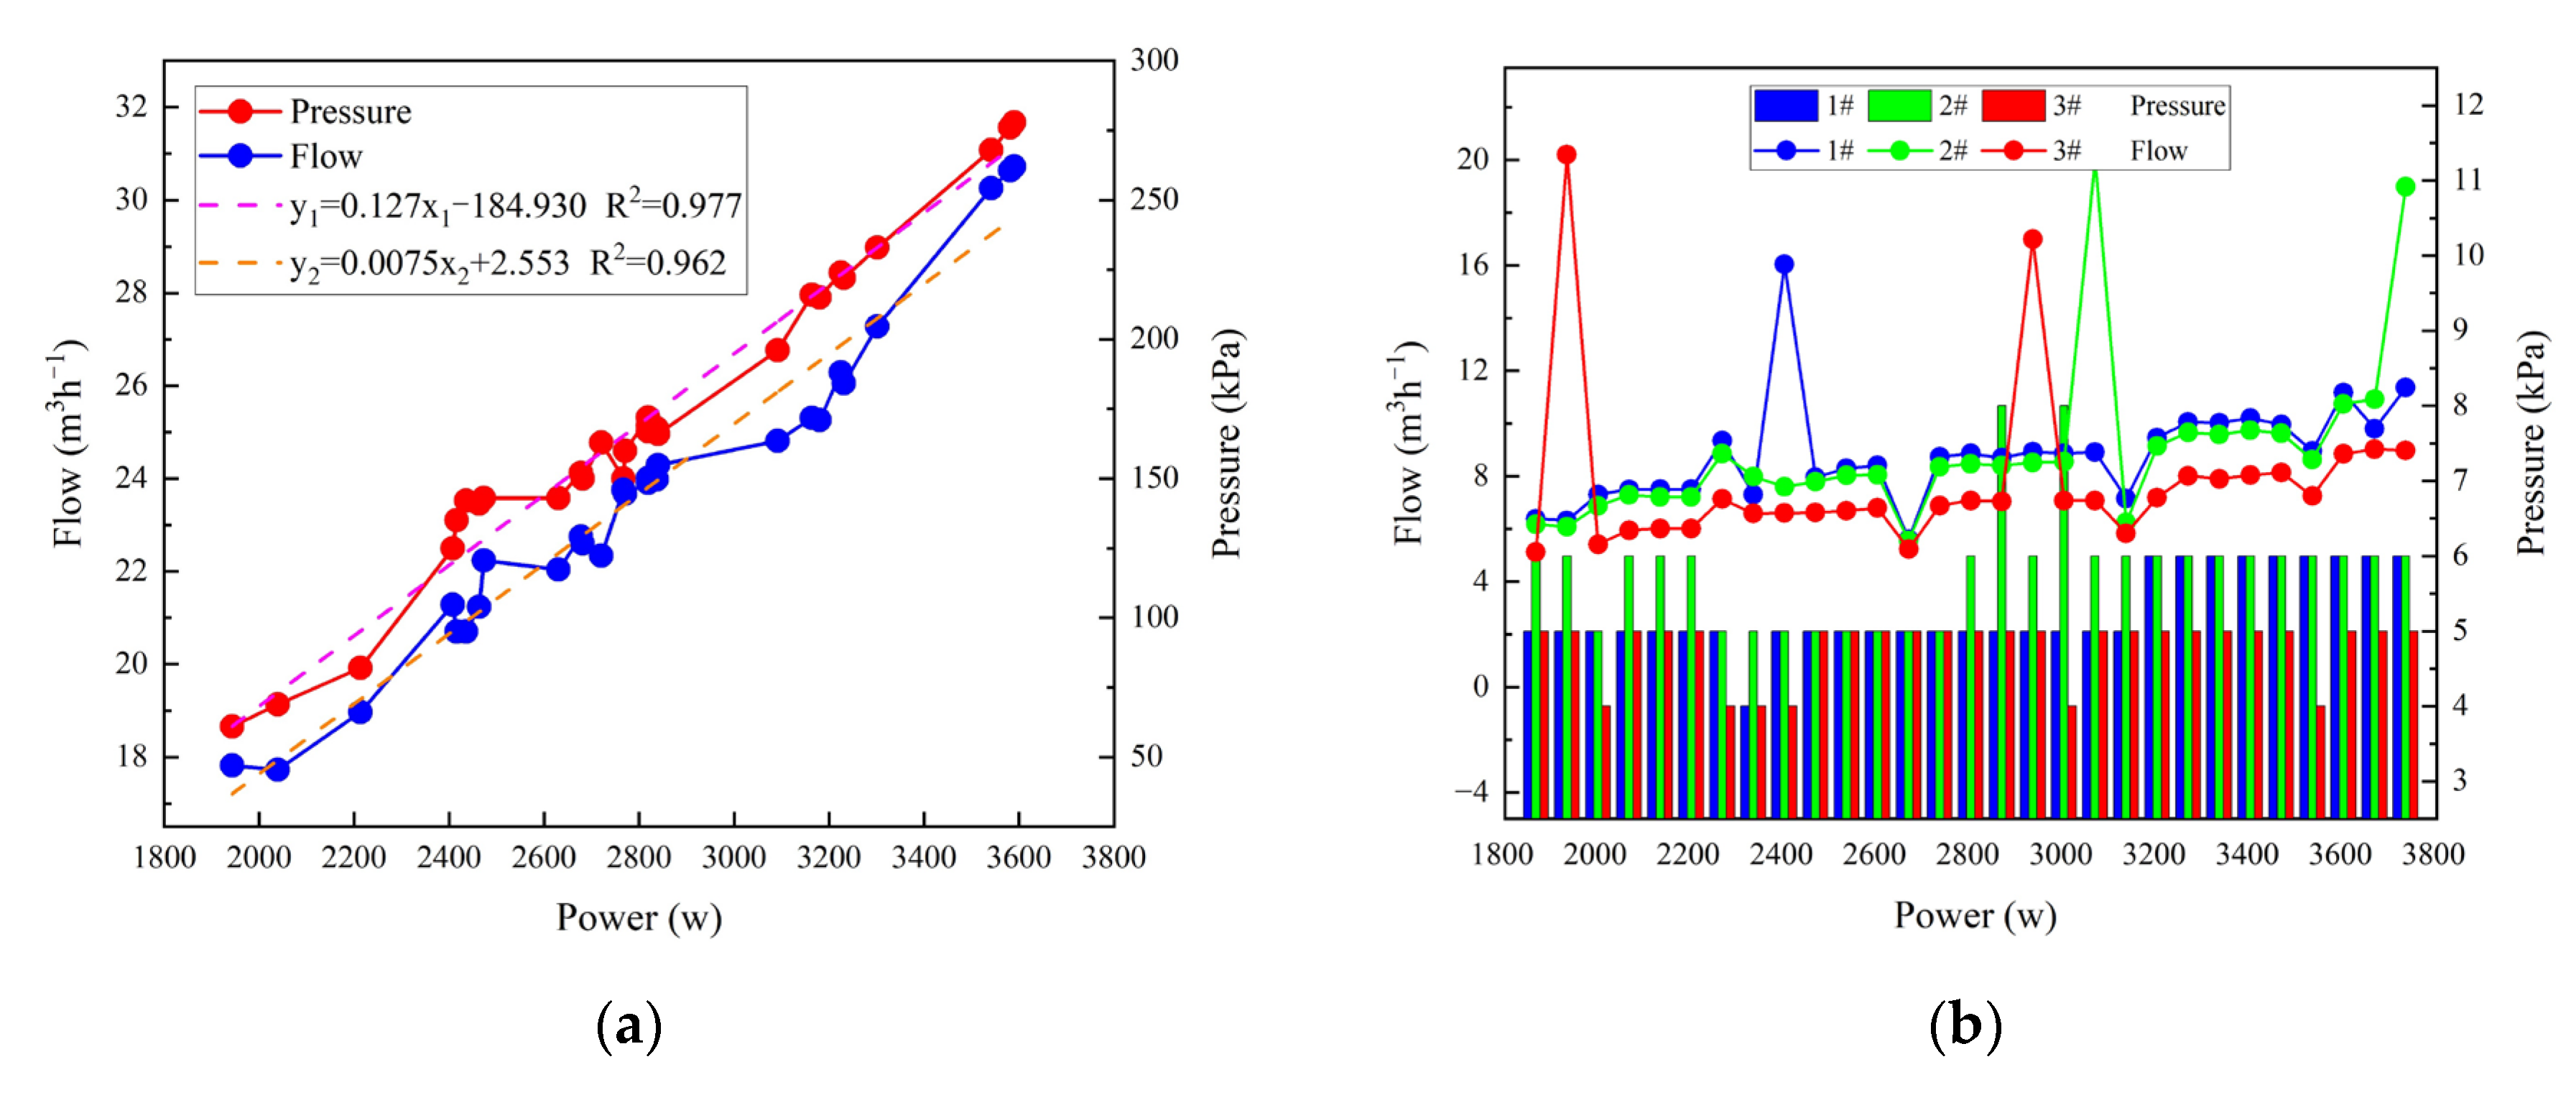
For Experiment 2, the main pipeline’s changes in pressure and flow are shown in
Figure 5a. The opening degree of the electric valve in the main pipeline is set to 25%, and the power of the pump station gradually changes from 1943 W to 3301 W. The flow and pressure of the main pipeline increase with the increase of the water pump power. The pressure of the main pipeline increases from 61 kPa to 233 kPa, and the flow increases from 17.8 mh
−1 to 27.3 mh
−1. As the power of the pump station increase, the pressure and flow of the main pipeline show a linear increasing trend. The correlation coefficients between pressure, flow and pump power are 0.977 and 0.962, respectively. It can be seen that the power of the pump station significantly affects the pressure and flow of the main pipeline. The pressure and flow changes of the three branch pipelines are shown in
Figure 5b. As the power of the pump station increases, the flow and pressure of the three branch pipelines do not change much. The pressure and flow trends of the three branch pipelines are consistent, but the flow of the three branches pipeline shows significant changes in some tests. Similar to Experiment 1, the pressure of the Branch 1 pipeline and Branch 2 pipeline is greater than that of Branch 3.
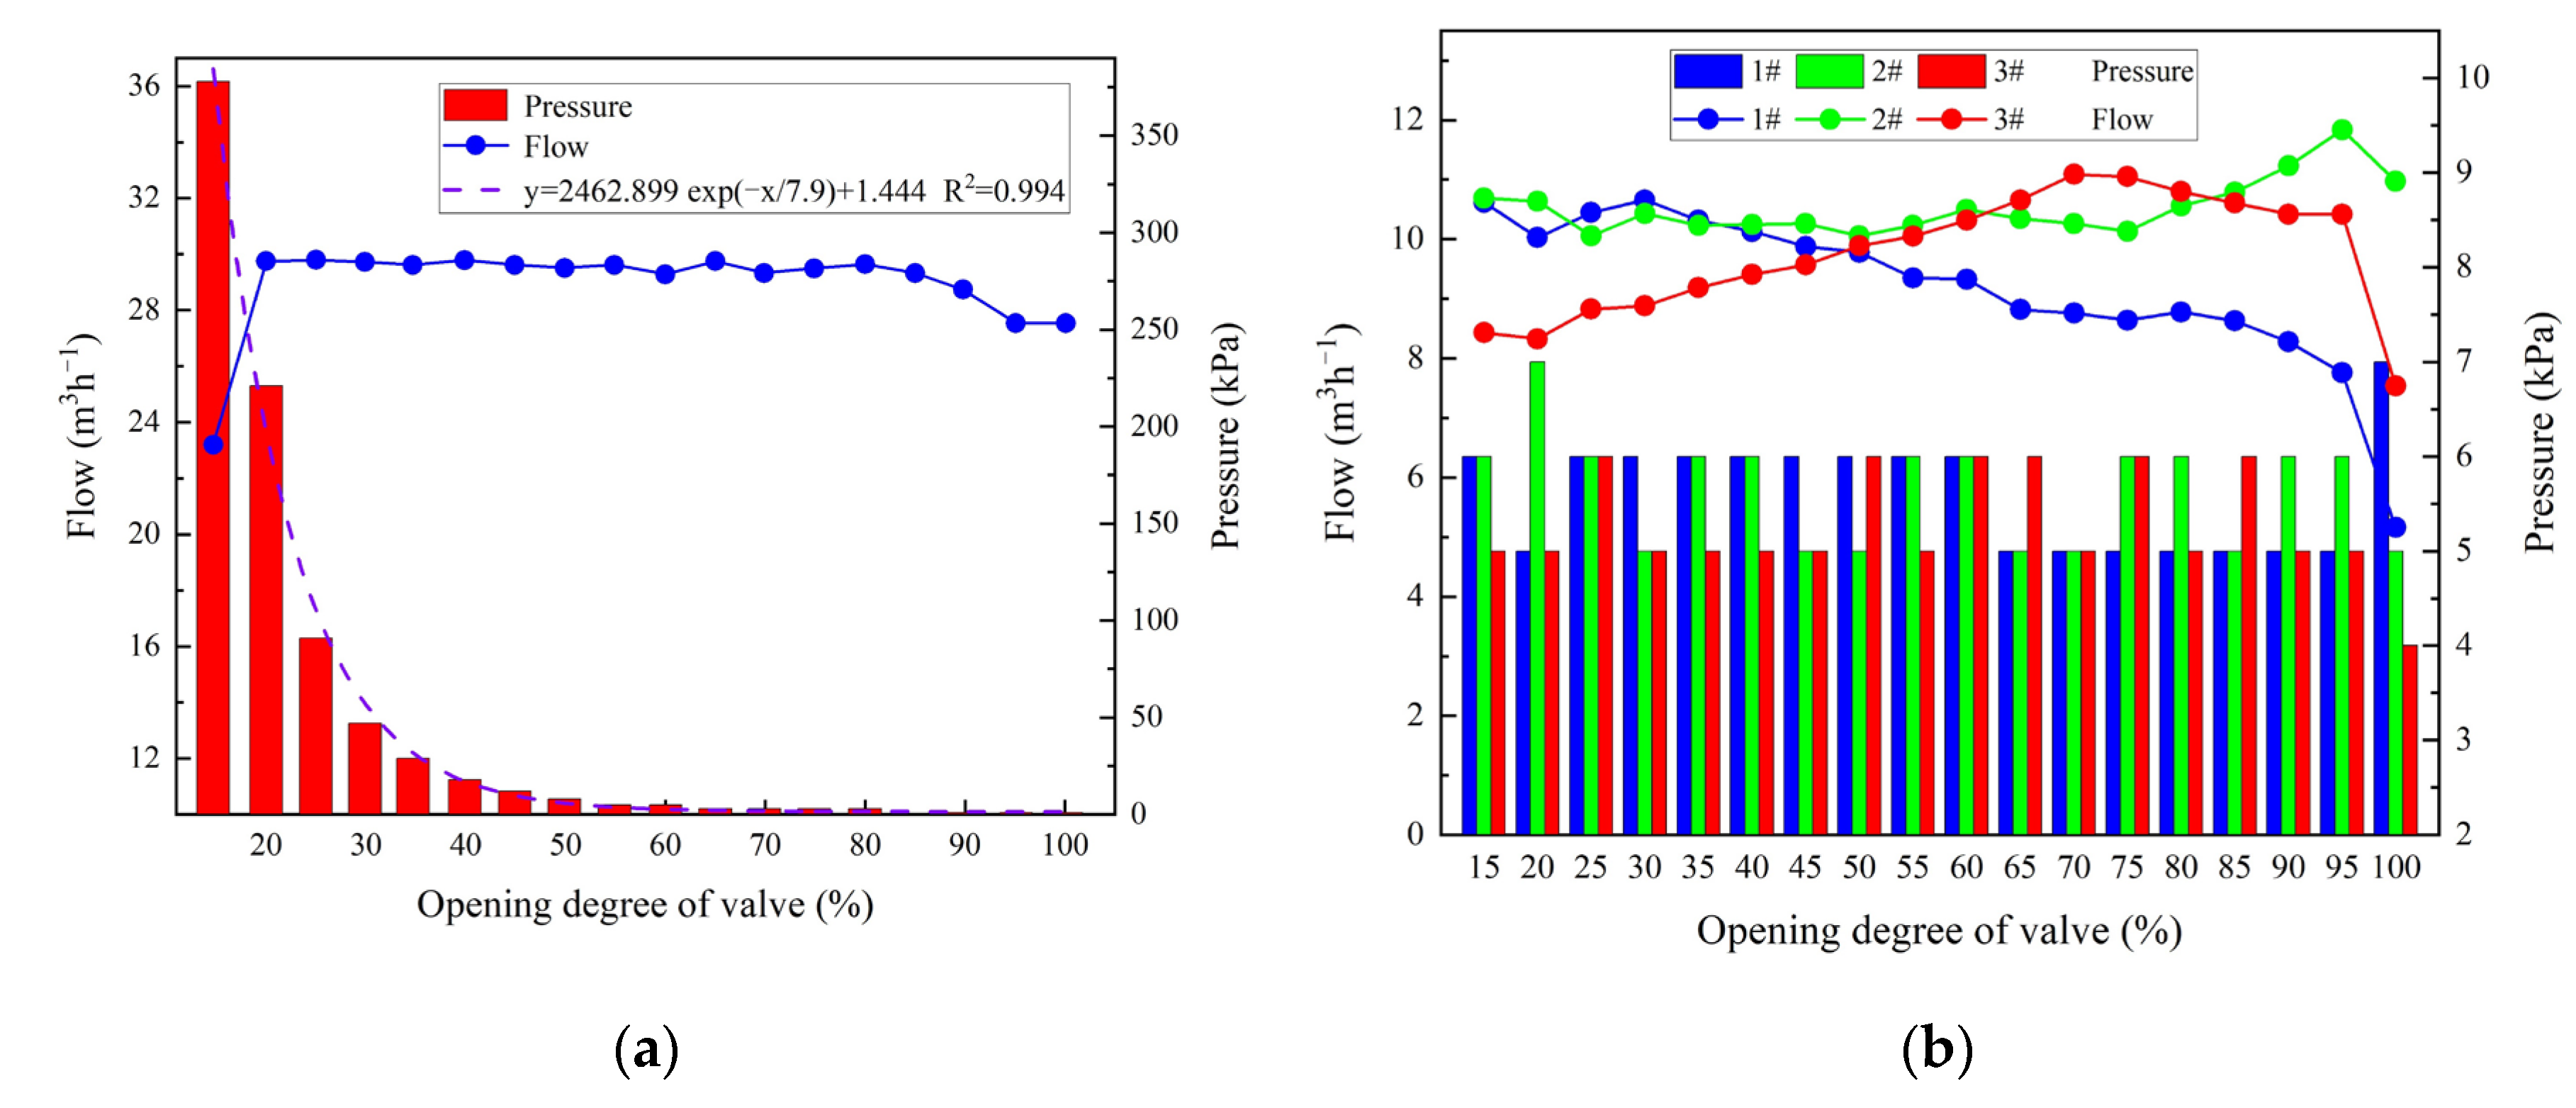
For Experiment 3, the pressure and flow changes of the main pipeline are shown in
Figure 6a. While increasing the opening degree of the three branch electric valves from 15% to 100%, the flow rate of the main pipeline first increases slightly and then maintains a small change. The pressure of the main pipeline sharply decreases as the opening degree of the three branch valves increases until the pressure of the main pipeline gradually approaches 0 kPa. This change is similar to the change in Experiment 1, but the pressure drops faster in Experiment 3. The exponential function was also used to fit the pressure and flow. The results indicate that the correlation coefficient of the exponential function is 0.994. The pressure and flow changes of the three branch pipelines in Experiment 3 are shown in
Figure 6b. It can be seen that the flow of the Branch 1 pipeline, which is closest to the main pipeline, gradually decreases as the opening degree of the branch valve increases. Under the condition of constant total flow, the branch closest to the main pipeline is more prone to a decrease in flow. The pressure of the three branch pipelines does not change much while increasing the valve opening degree and is maintained between 5–6 kPa.
For Experiment 4, the frequency of the pump station was set to 50 Hz, and the opening degree of the electric valve in the main pipeline was 100%. The sum of the opening degree of the three branch electric valves decreases from 300% to 50%. There were 1632 sets of experiments in this complete experiment, and it is difficult to summarize the pressure and flow rate changes in the main and branch pipelines. The maximum and minimum pressure values of the main pipeline in this experiment are 346 kPa and 0 kPa, respectively. The maximum and minimum flow rates of the main pipeline are 31.76 mh−1 and 12.05 mh−1, respectively. The maximum and minimum flow among the three branch pipelines is 31.489 mh−1 and 0 mh−1, respectively.
4. Results
To construct an on-demand irrigation water distribution control model, five input parameters, namely the frequency of the pump station and the opening degree of the electric valve in the main and branch pipelines, require a large number of experiments. To simplify the complexity of the optimization model, it is necessary to compare and analyze the results of different input parameters. Experiments 1 and 3 show that the opening degree of the valve in the main pipeline significantly affects the pressure of the main pipeline but has no significant impact on the flow of the main pipeline and the pressure of the three branches. The opening degree of the valve in three branch pipelines also has a significant impact on the pressure in the main pipeline. Still, it has little effect on the pressure in the three branch pipelines and the flow in the main pipeline. From Experiment 4, it can be seen that the opening degree of the valve in the branch pipeline has a significant impact on the flow of the three branch pipelines. Therefore, the opening degree of the electric valve in the branch pipeline can not only significantly affect the flow in the branch pipeline, but also significantly affect the pressure of the main pipeline. The flow rate of the three branch lines and the flow rate of the main line are key parameters in the irrigation process.
Meanwhile, from Experiment 2, it can be seen that the operating frequency of the pump station is positively correlated with the pressure and flow in the main pipeline. Therefore, this article proposes to set the working frequency of the head pump to 50 Hz, mainly considering the influence of the opening degree of the three branch valves on the pressure of the main pipeline and the flow of the branch pipeline. Using the data from Experiment 4, a multiobjective optimization control model for stochastic irrigation water distribution is constructed.
Six different machine learning models with all hyperparameter combinations have been trained using the multiobjective optimization function. The best hyperparameter set of each model was obtained. The corresponding best model was used to predict the opening degree of the three branch electric valves. The best hyperparameter and prediction performance of the model is shown in
Table 3. From the table, the performance of six models from best to worst is XGBoost, RF, SVR, RBF, SVR-Poly, SVR-Linear and BP, respectively. For the opening degree of three branch valves, the MAE between predicted values of the XGBoost model and the true valves are less than 3.3%, the RMSE is less than 4.5%, and the
R2 is greater than 0.990, indicating that the predictive performance of this model is good.
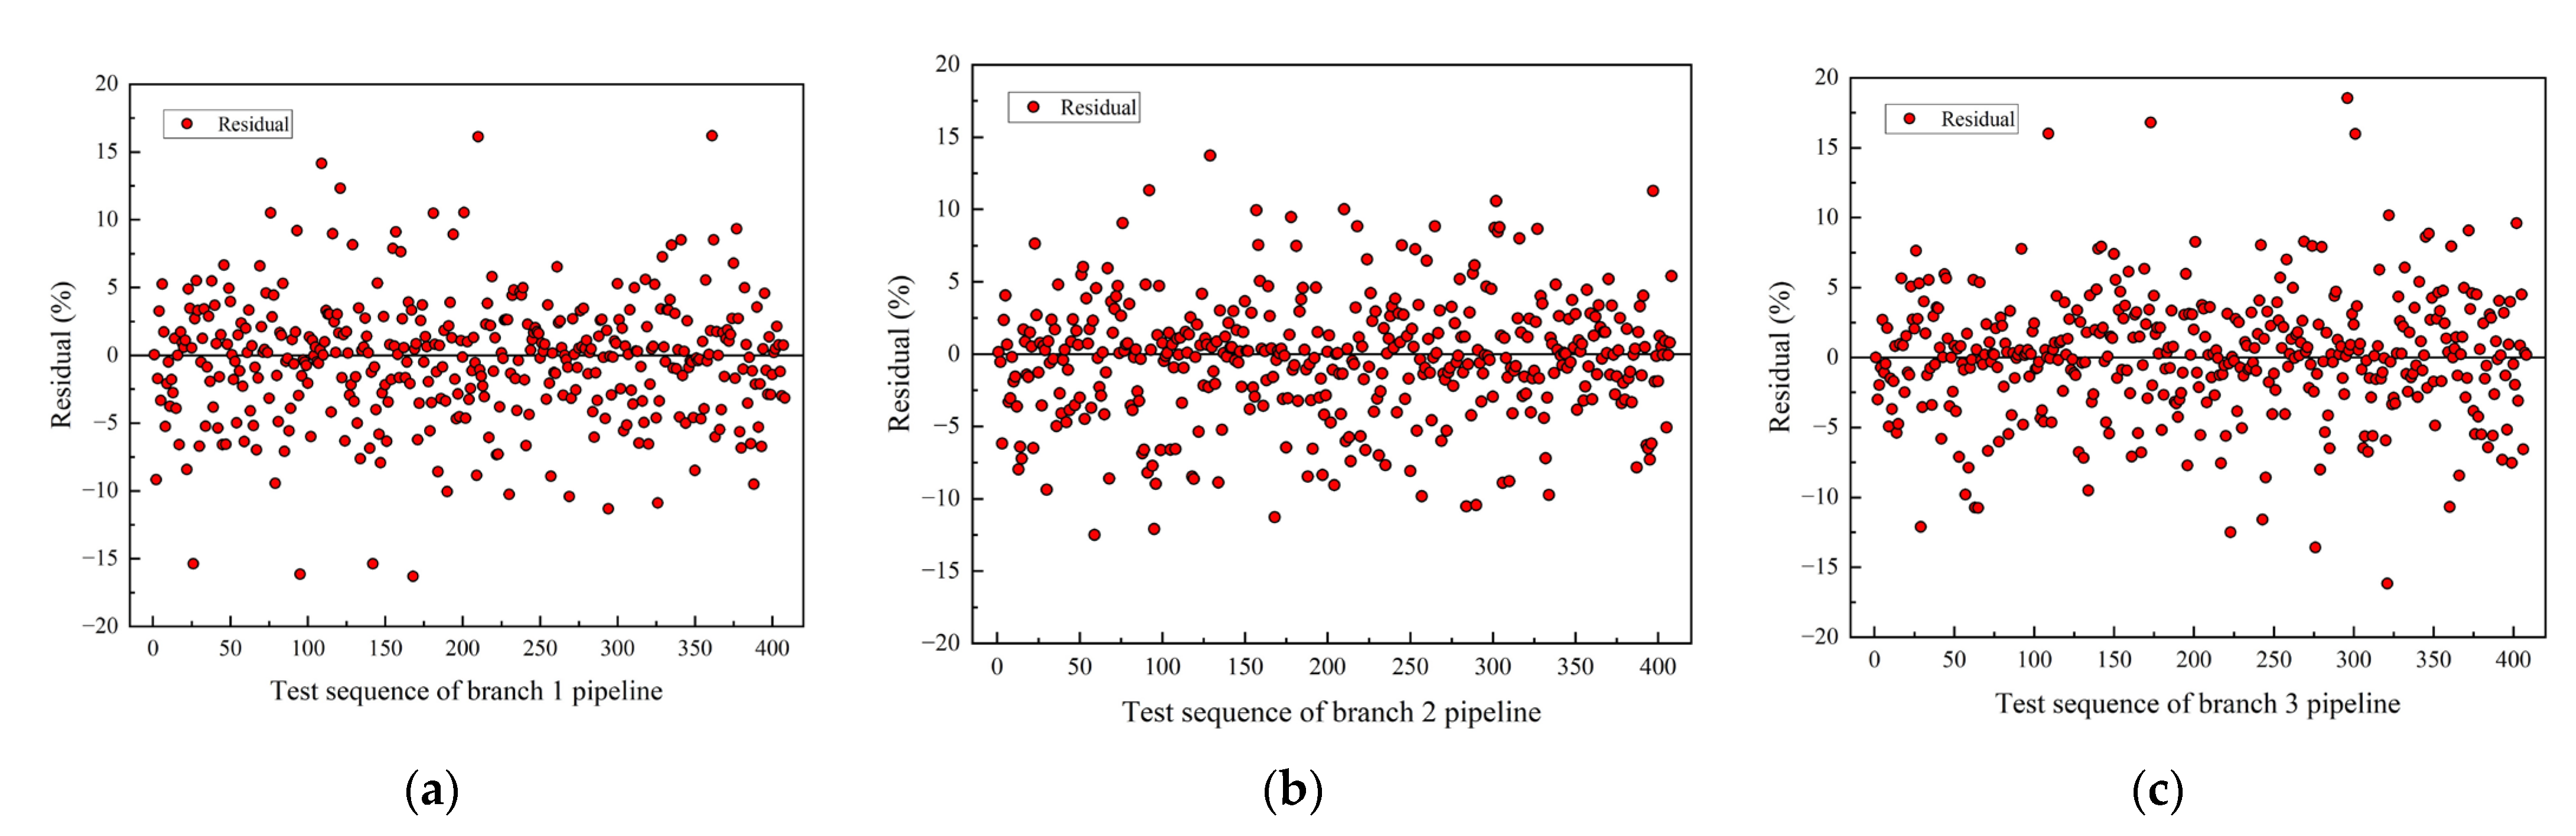
The residuals of the opening degree of three branch valves between the predicted value of the XGBoost model and the true value are shown in
Figure 7. For the total 408 test set and the three branches, it can be seen that the number of residuals distributed in the range of [−5, 5] % is 320, 325, and 324, respectively. The number distributed in the range of [−3, 3] % is 238, 245, and 245, respectively. The number distributed in the range of [−20, −10] % is 10, 6, and 9, and the number distributed in the range of [10, 20] % is 8, 6, and 6, respectively. These data indicate that the residual of the XGBoost model in predicting valve opening degree is mainly concentrated within the range of [−3, 3] %, and the residual distribution characteristics between the three branches are not significantly different.
5. Discussion
On-demand irrigation treats each hydrant as an irrigation unit. Each hydrant can obtain irrigation water from the irrigation pipe network at any time. This irrigation method can meet the water needs of multiple users to the greatest extent. The pressure and flow requirements of the hydrants and the irrigation pipeline network and layout are constantly changing. Therefore, the pressure and flow at the pump station should also be adjusted as needed. In recent years, many researchers have developed and implemented systems that control irrigation in real-time for quick management decisions, resulting in adequate yields while saving significant amounts of water. Increasingly, farmers worldwide are turning to automated irrigation systems to save them significant time by remotely turning on and off pumps and valves [
41].
Photovoltaic pumping systems (PVPSs) are more competitive for use in irrigation. Traditional PVPS configurations use a variable-speed drive (VSD). The performance of this type of configuration was tested both at a pumping test facility and in the field at a variety of sites. VSDs can thus potentially further improve the economic competitiveness of a PVPS. The studies show that the VSDs can thus potentially further improve the economic competitiveness of a PVPS. This study only applies to regulating the operating frequency of pump stations, and further research is needed for the comprehensive regulation of the pump station and valves [
42]. To improve the management of on-demand irrigation networks, a system called GreenValve (GVS) was designed by Politecnico di Milano. The GVS can recover energy from the flow and is a three-step general and replicable methodological approach for defining installation and operating conditions. At the same time, the study shows that simple management rules can reduce and even avoid the occurrence of hydrant failure, creating the conditions for more effective use of the resources [
43].
In an actual on-demand irrigation system, the distribution of pipelines, irrigation frequency, and irrigation scheduling will directly affect the performance of the control model. The on-demand irrigation system is a MIMO system. The real-time energy, the resilience, the pressure head at all nodes, and the perturbation of an on-demand irrigation network were studied and optimized using machine learning, deep learning, multi-objective design, and simulation method, respectively [
12,
15,
18,
21,
28,
29]. It is undeniable that these studies have provided new technologies for irrigation systems, and ways to control the pump station and valves. However, the control parameters of these studies are single, and most focus on specific irrigation system networks. These control methods may not necessarily apply to different on-demand irrigation networks. Therefore, further research is needed on the comprehensive pressure and flow control methods in on-demand irrigation systems.
In this paper, the operating frequency of the pump station, the opening degree of the main pipeline valve, and the branch pipeline valve are the input parameters, and the pressure and flow of the main pipe and the branch pipe are the output parameters. Therefore, conventional rotational irrigation control methods (such as stable flow regulation and constant pressure water supply) are difficult to meet the needs of on-demand irrigation.
Therefore, further consideration needs to be given to the impact of the pipeline network, irrigation scheduling and management on the on-demand irrigation system in the future to improve the model’s applicability.
Due to the low irrigation pressure and flow caused by rotational irrigation, high irrigation uniformity, low power and energy consumption of the head pump, and relatively low cost and operating expenses of the irrigation control system. Due to the user end’s high pressure and flow demand, as well as the significant fluctuations, it is difficult to control the uniformity of the irrigation pipeline effectively. In addition, the power and energy consumption of the pump station is also high, which correspondingly increases the cost and operating expenses of the irrigation control system. Therefore, in subsequent research, objectives such as irrigation uniformity, system cost, and operating cost should also be comprehensively considered.
6. Conclusions
This paper establishes an on-demand irrigation experimental device using centrifugal pumps, including a water tank, main pipeline, and three branches (hydrants). Based on the PyCharm integrated development environment, a visual control system was developed using Python, Qt Designer, SSH, and other tools. A total of 1695 sets of experimental results were analyzed. It can be concluded that the opening degree of the electric valve in the branch pipeline can significantly affect the flow of the branch pipeline and the pressure of the main pipeline. At the same time, the flow of the branch pipeline and the flow of the main pipeline are also parameters that users are more concerned about during irrigation.
Six machine learning models for on-demand experimental devices were constructed using multiobjective algorithm optimization methods. Those models were trained using experimental data, and it was found that the model based on XGBoost had the best performance. For the opening degree of the three branches, the MAE between the model’s predicted value and the true value was less than 3.3%, the RMSE was less than 4.5%, and the R2 was greater than 0.990. The XGBoost model has the best performance. This article preliminarily establishes intelligent control technology for on-demand irrigation. Subsequent in-depth research needs to combine factors such as irrigation uniformity, user pipeline layout, control system, and operation cost to improve the applicability of multi-user stochastic control technology.


