Article

Using Fluorescence Spectroscopy to Assess Compost Maturity Degree during Composting

1
Department of Environmental Science and Engineering, National Pingtung University of Science and Technology, No. 1 Shuefu Road, Neipu, Pingtung 912, Taiwan
2
Department of Plant Industry, National Pingtung University of Science and Technology, No. 1 Shuefu Road, Neipu, Pingtung 912, Taiwan
3
Department of Soil and Water Conservation, National Pingtung University of Science and Technology, No. 1 Shuefu Road, Neipu, Pingtung 912, Taiwan
*
Author to whom correspondence should be addressed.
Agronomy 2023, 13(7), 1870; https://doi.org/10.3390/agronomy13071870
Submission received: 24 June 2023 / Revised: 8 July 2023 / Accepted: 12 July 2023 / Published: 15 July 2023

Abstract

:
Uncertainty remains over composting time and maturity degree for compost production. The objectives of this study were to establish maturity indicators for composting based on spectral and chemical components and to provide a reference for future composting management. Several indicators of composting were assessed for three commercial composts at 0, 7, 15, 30, 45, and 60 days during the germination of Chinese cabbage, including (1) central temperature, (2) moisture content, (3) pH, (4) electrical conductivity, (5) C/N ratio, (6) E4/E6 ratio, (7) fluorescence humification index (HIX), and (8) germination index (GI). We evaluated the optimal composting time using these indicators, reflecting the changes in hog manure, chicken manure, and agricultural by-product composts throughout their composting process to provide a basis for maturity time. The results showed that the E4/E6 ratio, C/N ratio, humic acid (HA), fulvic acid (FA), and germination rate, which reached a stable status after 30 days of composting, could be the indicators of “early-stage” maturity. In contrast, central temperature, electrical conductivity, HIX, and GI reached stable values after 45 days of composting and thus could be more suitable indicators of full maturity. Based on our results, we recommend a minimum composting time of 30 days to achieve primary maturity, while fully matured compost may be obtained after 45 days.

1. Introduction

Compost is an important input for sustainable agriculture, and a precision compost strategy not only increases global food production but also facilitates soil quality and organic carbon storage in the soil [1]. Composting is an environmentally friendly and economically beneficial way of recycling agricultural by-products. However, inadequate composting can result in poor maturity of a compost product, which can threaten soil quality and inhibit crop growth after application because insufficiently matured compost may contain unstable organic matter. Therefore, identifying the maturity of compost has become a crucial issue in the agricultural management of organic farming [1,2].
For sustainable and precision agriculture, establishing and providing reliable and efficient indicators of compost maturity is an urgent task that will enhance the benefits of compost application. Compost maturity refers to the degree of organic matter stabilization in composts during the mineralization and humification processes [1]. Compost maturity involves microbial reactions on compost raw materials [2], leading to the eventual attainment of stabilization and harmlessness of compost products, which not only prevents adverse environmental impacts but also implies that compost products contribute to enhancing soil fertility and promoting crop growth. Application of compost with good maturity can promote soil aggregation, suppress pathogens, increase soil organic matter, and enhance the soil carbon pool [3,4,5]. Thus, the determination of compost maturity is crucial to assessing compost quality. Due to significant variations in compost feedstock and the complexity of the fermentation processes, using a single parameter or indicator to evaluate compost maturity seems improper and unreasonable.
In the past, assessing compost maturity generally included four methods: physical methods, chemical methods, spectral analysis, and biological indicators [6]. Physical or apparent indicators include compost temperature, odor, color, optical properties, and electrical conductivity. However, these methods are typically preliminary and cannot serve as quantitative indicators of compost maturity [7]. Several indices are usually commonly combined to judge the maturity of compost. However, these methods mostly require chemical or biological analyses in the laboratory, which are also usually time- and money-consuming. Furthermore, the disposal of chemical and biological analyses might lead to pollution of the environment.
Since it is difficult to establish a single parameter or indicator for assessing the compost maturity of different composts using physical and chemical analyses, spectral analysis has been further applied to determine compost maturity. Recent studies have highlighted the great potential of spectroscopic methods for both quantitative and qualitative characterization of dissolved organic matter from soil or compost [8,9,10]. Among these spectroscopic methods, three-dimensional excitation–emission matrix (3D EEM) fluorescence spectroscopy is a widely used, nondestructive method for characterizing DOM in terms of its important fluorescent components, including humic-like and proteinaceous substances. Moreover, researchers also suggested that the analysis of fluorescence spectra can reflect the gradual decomposition of protein-like substances during composting, reaching a stable balance after around 60 days, which indicates compost maturity [1].
Further refinement of techniques such as infrared spectroscopy (FT-IR) or 3D EEM should provide a relatively rapid method of assessing the suitability of the compost to land application [11]. 3D EEM is also under development to detect the compositional changes in organic matter structures, including the transformation of fresh materials into humified substances (HSs) during composting [2,12]. Composting processes involve the decomposition and humification of organic matter under the influence of microorganisms, resulting in changes in the composition and structure of dissolved organic matter (DOM). 3D EEM is a non-destructive tool for assessing compost maturity, offering advantages such as high sensitivity, strong selectivity, low sample quantity required, and ease of use. 3D EEM can effectively differentiate fluorescent components of organic matter. Therefore, this study aims to apply 3D EEM and traditional physical/chemical approaches, including (1) temperature, (2) moisture content, (3) pH, (4) electrical conductivity, (5) C/N ratio, (6) E4/E6 ratio, and (7) germination index of Chinese cabbage to identify the content and quality of humified materials during composting. It also aims to further establish several indicators for assessing compost maturity, and propose the most appropriate composting time, which may enable future agricultural by-products management.

2. Methods and Materials

2.1. Composting and Sampling

This study selected three commercial composts to monitor the indicators during their composting process: a hog manure compost (HMC) (Hanbao Agricultural and Livestock Enterprise Co., Ltd., Pingtung, Taiwan), a chicken manure compost (CMC) (Changhong Composting Plant, Pingtung, Taiwan), and a general compost of agricultural by-products (GC) (Changhong Composting Plant, Pingtung, Taiwan). The composition of raw materials in each compost was (1) hog manure compost: mushroom substrate = 1:1, where hog manure was piled for seven days before composting HMC; (2) chicken manure: sawdust = 1:1 for CMC; (3) corn cob: rice bran: coconut fiber = 9:0.5:0.5 for GC (Table 1).
The moisture content of the mixture of raw HMC materials was adjusted to 50%, placed in a tank for 30 days, and transferred to a fermentation tank for turning. The CMC and GC were also adjusted to reach 50% moisture content but then directly placed in the fermentation treatment tank. Three samples of each compost were collected 0, 7, 15, 30, 45, and 60 days after composting started. The sampling position was approximately 50 cm away from the center of the compost pile. Physical, chemical, and spectral analyses of the samples were conducted as described below.

2.2. Monitoring and Analyses

In this study, we used wireless long-distance transmission monitoring devices (ZL6, Meter Group Inc., USA) and monitoring probes (5TE, Meter Group Inc., Pullman, WA, USA) to continuously monitor temperature, moisture, and electrical conductivity (EC) during the composting of the HMC, CMC, and GC. We also conducted total carbon (TC) and total nitrogen (TN) analyses of the compost samples as follows: TC was determined using the high-temperature combustion method [13] and TN was determined using the Kjeldahl digestion method and distilling equipment [14]. The pH was measured using the glass electrode method (soil:water = 1:5).
During composting, organic matter undergoes decomposition and humification by microbes, leading to changes in the composition and structure of the highly active DOM. Three-dimensional (3D) fluorescence spectroscopy can effectively differentiate the fluorescent components of organic matter with different chemical structures. Humic acid (HA) and fulvic acid (FA) in the compost samples collected during the composting period were extracted. Compost samples (10 g) were mixed with 0.1 M (NaOH + Na4P2O7) in a solid-to-water ratio of 1:10 (w/v). The mixtures were shaken for 24 h at a rotational speed of 150 rpm at room temperature and centrifuged at 10,000 rpm for 15 min. The obtained supernatant was filtered through a 0.45 m membrane filter and then acidified to a pH of 1 using 6 M HCl. The mixtures were allowed to stand for 24 h at 4℃ and again centrifuged at 10,000 rpm for 15 min. The sediments were considered as HA and the obtained supernatant was passed through an XAD-8 macroporous resin column and an H+-saturated cation exchange resin for further FA purification [15]. The C content of HA and FA was further determined using a total organic carbon (TOC) analyzer (O-I analytical model 1080, College Station, TX, USA). The humification degree was then determined using the fluorescence analyzer (HITACHI F-7000, Tokyo, Japan) and UV-visible spectrophotometer (HITACHI U-3900, Tokyo, Japan). The fluorescence spectra were calibrated and standardized using ultrapure water spectral data, at an excitation wavelength of 350 nm and an emission wavelength range of 365–450 nm [16]. The fluorescence EEM spectra were measured using a HITACHI F-7000 fluorescence spectrophotometer. The excitation source was a 150 W Xenon lamp. Contour maps of EEM spectra were obtained on DI water extracts of whole composts. The emission (Em) wavelength range was fixed from 250 to 550 nm, whereas the excitation (Ex) wavelength was increased from 200 to 450 nm in 2 nm steps and excitation in 5 nm steps emission. Slit widths were 5 nm and the compost extract was irradiated in a 1 cm path-length fused silica cell.
We conducted the fluorescence spectra analysis and calculated the Humification Index (HIX) for all compost samples, which equals the integration of intensity in the emission spectrum range (300–345 nm + 435–480 nm) divided by the intensity at the excitation wavelength of 255 nm. HIX serves as an effective indicator of humification degree and resistance to decomposition. The HIX of DOM derived from fresh plant and animal manure is less than 4 and increases as humification progresses. We also calculated the absorbance ratio at 465 nm and 665 nm (E4/E6). The E4/E6 ratio is widely used to describe the characteristics of humic substances and is inversely correlated with the aromaticity of DOM, which also implies the humification degree of the DOM.
One gram of each compost sample was extracted with 20 mL of DI water by shaking for 24 h at room temperature. The extracts were filtered through Whatman No. 2 filter paper. The extracts were prepared for analysis of DOC, E4/E6, and fluorescence spectrum.

2.3. Seed Germination Test

Mature compost should not inhibit seed germination. Therefore, the germination index (GI) is commonly calculated based on the germination rate and root length of tested seedlings. The GI is equal to:
[(germination rate of seeds × root length in compost leachate)/(germination rate of seeds × root length in water)] × 100
When the GI exceeds 90%, it is considered a mature compost. Chinese cabbage seeds purchased from Farmer’s Seedling Company were stored in a refrigerator at 4 °C immediately after purchase.

2.4. Statistical Analysis

Data were analyzed using IBM SPSS Statistics 22 for Windows (IBM Corp., Armonk, NY, USA). Data sets were subjected to mean separation analysis using a one-way analysis of variance, with significance being set to a p-value of 0.05. The differences between mean values under different treatments were identified using Duncan’s test.

3. Results and Discussion

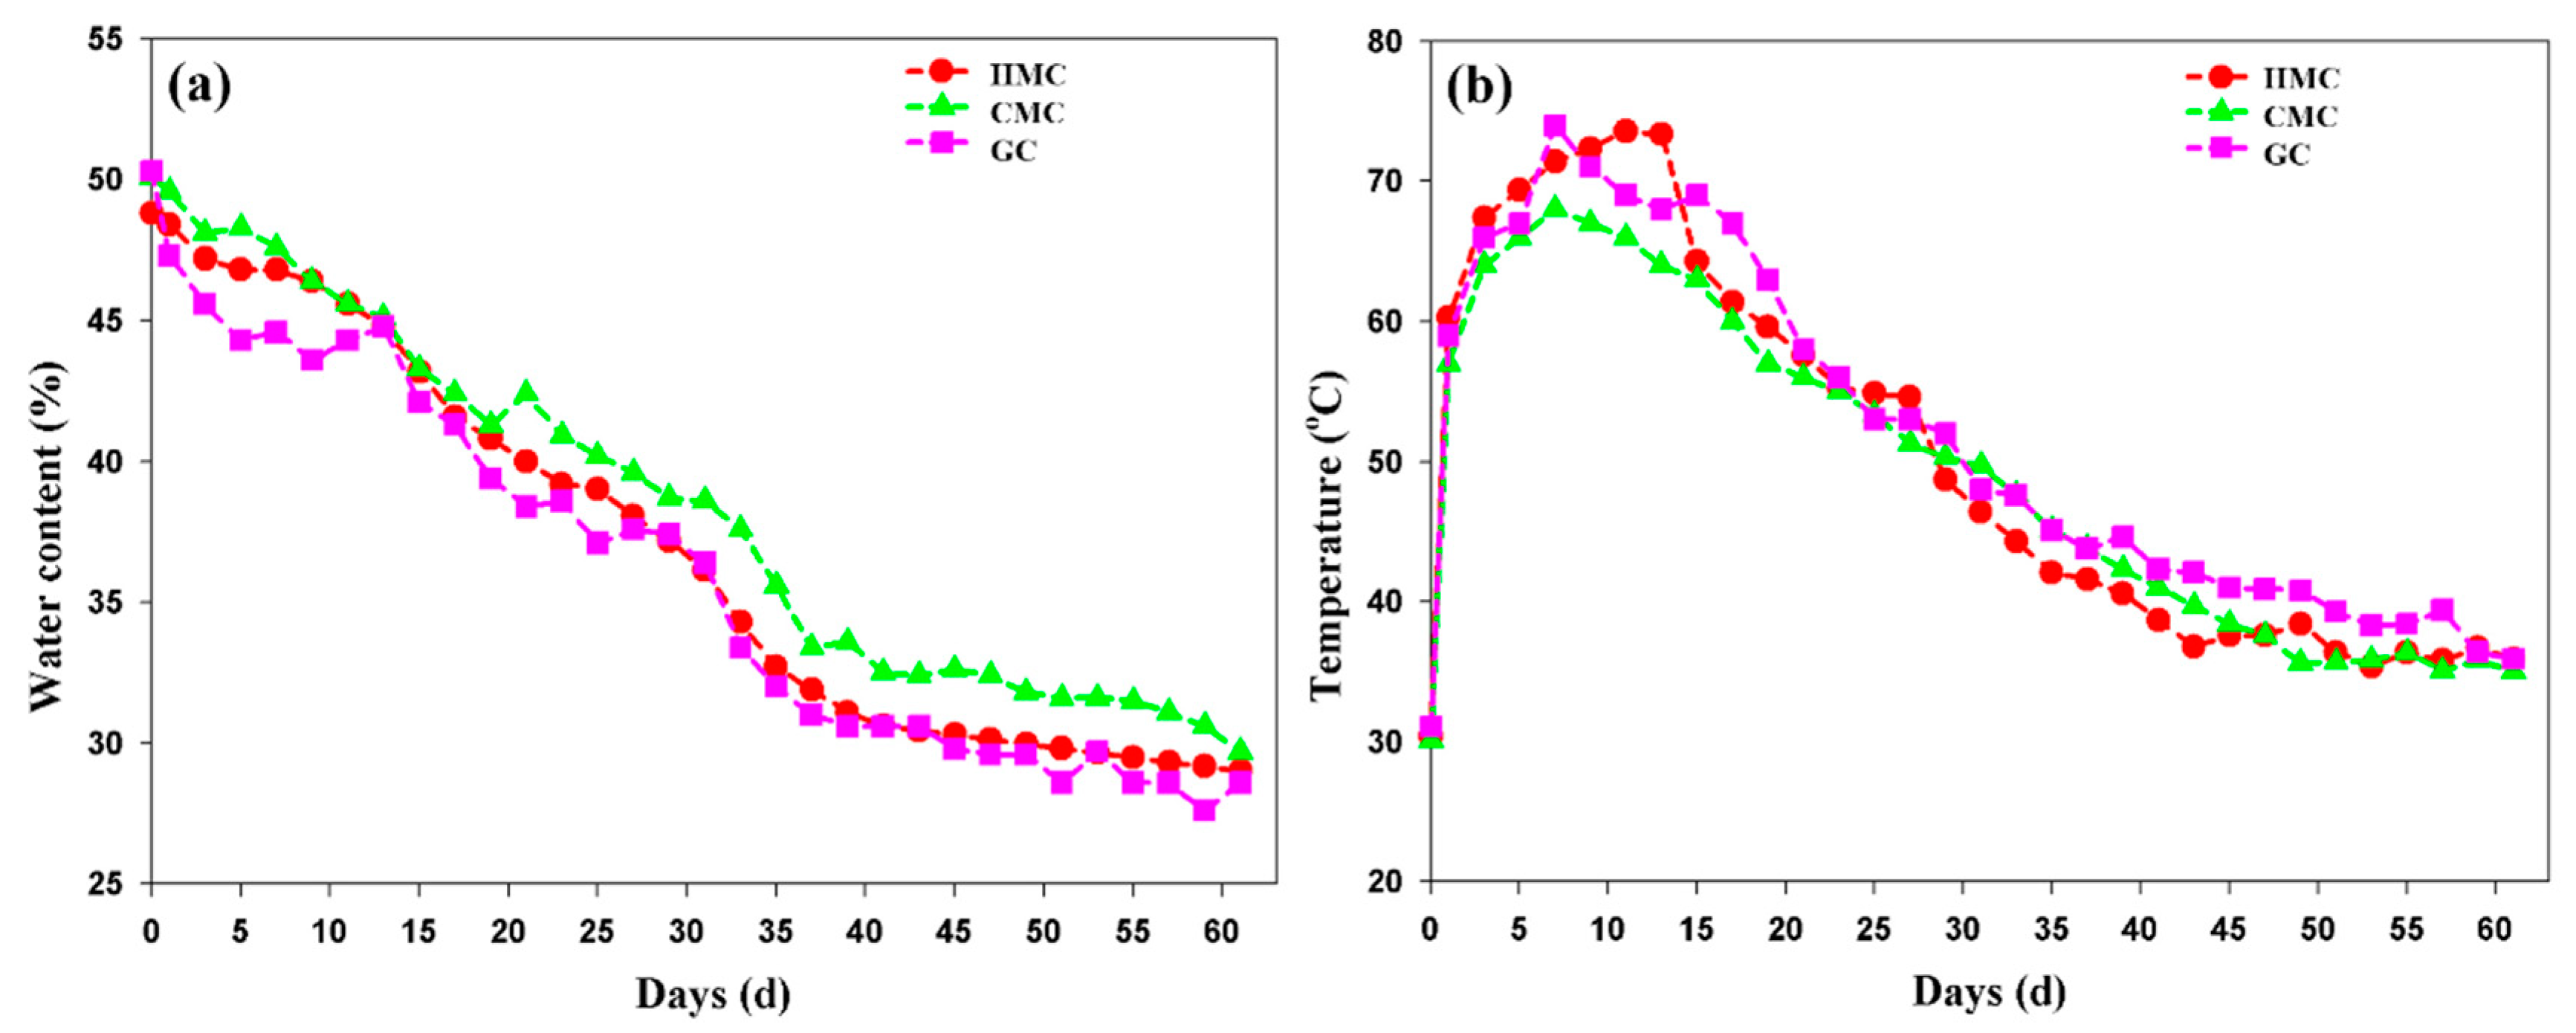
3.1. Moisture and Temperature of the Composts

Moisture is a notable physical factor during the composting process. Figure 1a shows that the moisture content of all three composts gradually decreased from an initial level of around 50% to approximately 28–35% after 40 days and continued to decrease over time, with no significant differences observed among the compost types. If the moisture content falls below 15% during composting, the metabolic activities of microorganisms and bacteria cease. Conversely, excessive moisture reduces air permeability, leading to anaerobic fermentation by microorganisms, which produces odors, slows down the degradation rate, and prolongs the composting time. The central temperatures of the compost materials during the composting period are shown in Figure 1b. The highest temperature and its occurrence day were 73.6 °C on the 11th day for HMC, 68 °C on the 7th day for CMC, and 74 °C on the 7th day for GC. Subsequently, the temperatures gradually decreased and reached a stable status at around 39 °C after 40–45 days. Theoretically, the moisture and temperature of composts could keep decreasing until they reach a balance with atmospheric conditions, leading to a rough identification of compost maturity; however, these physical indices would still not elucidate changes in humic substances during composting.

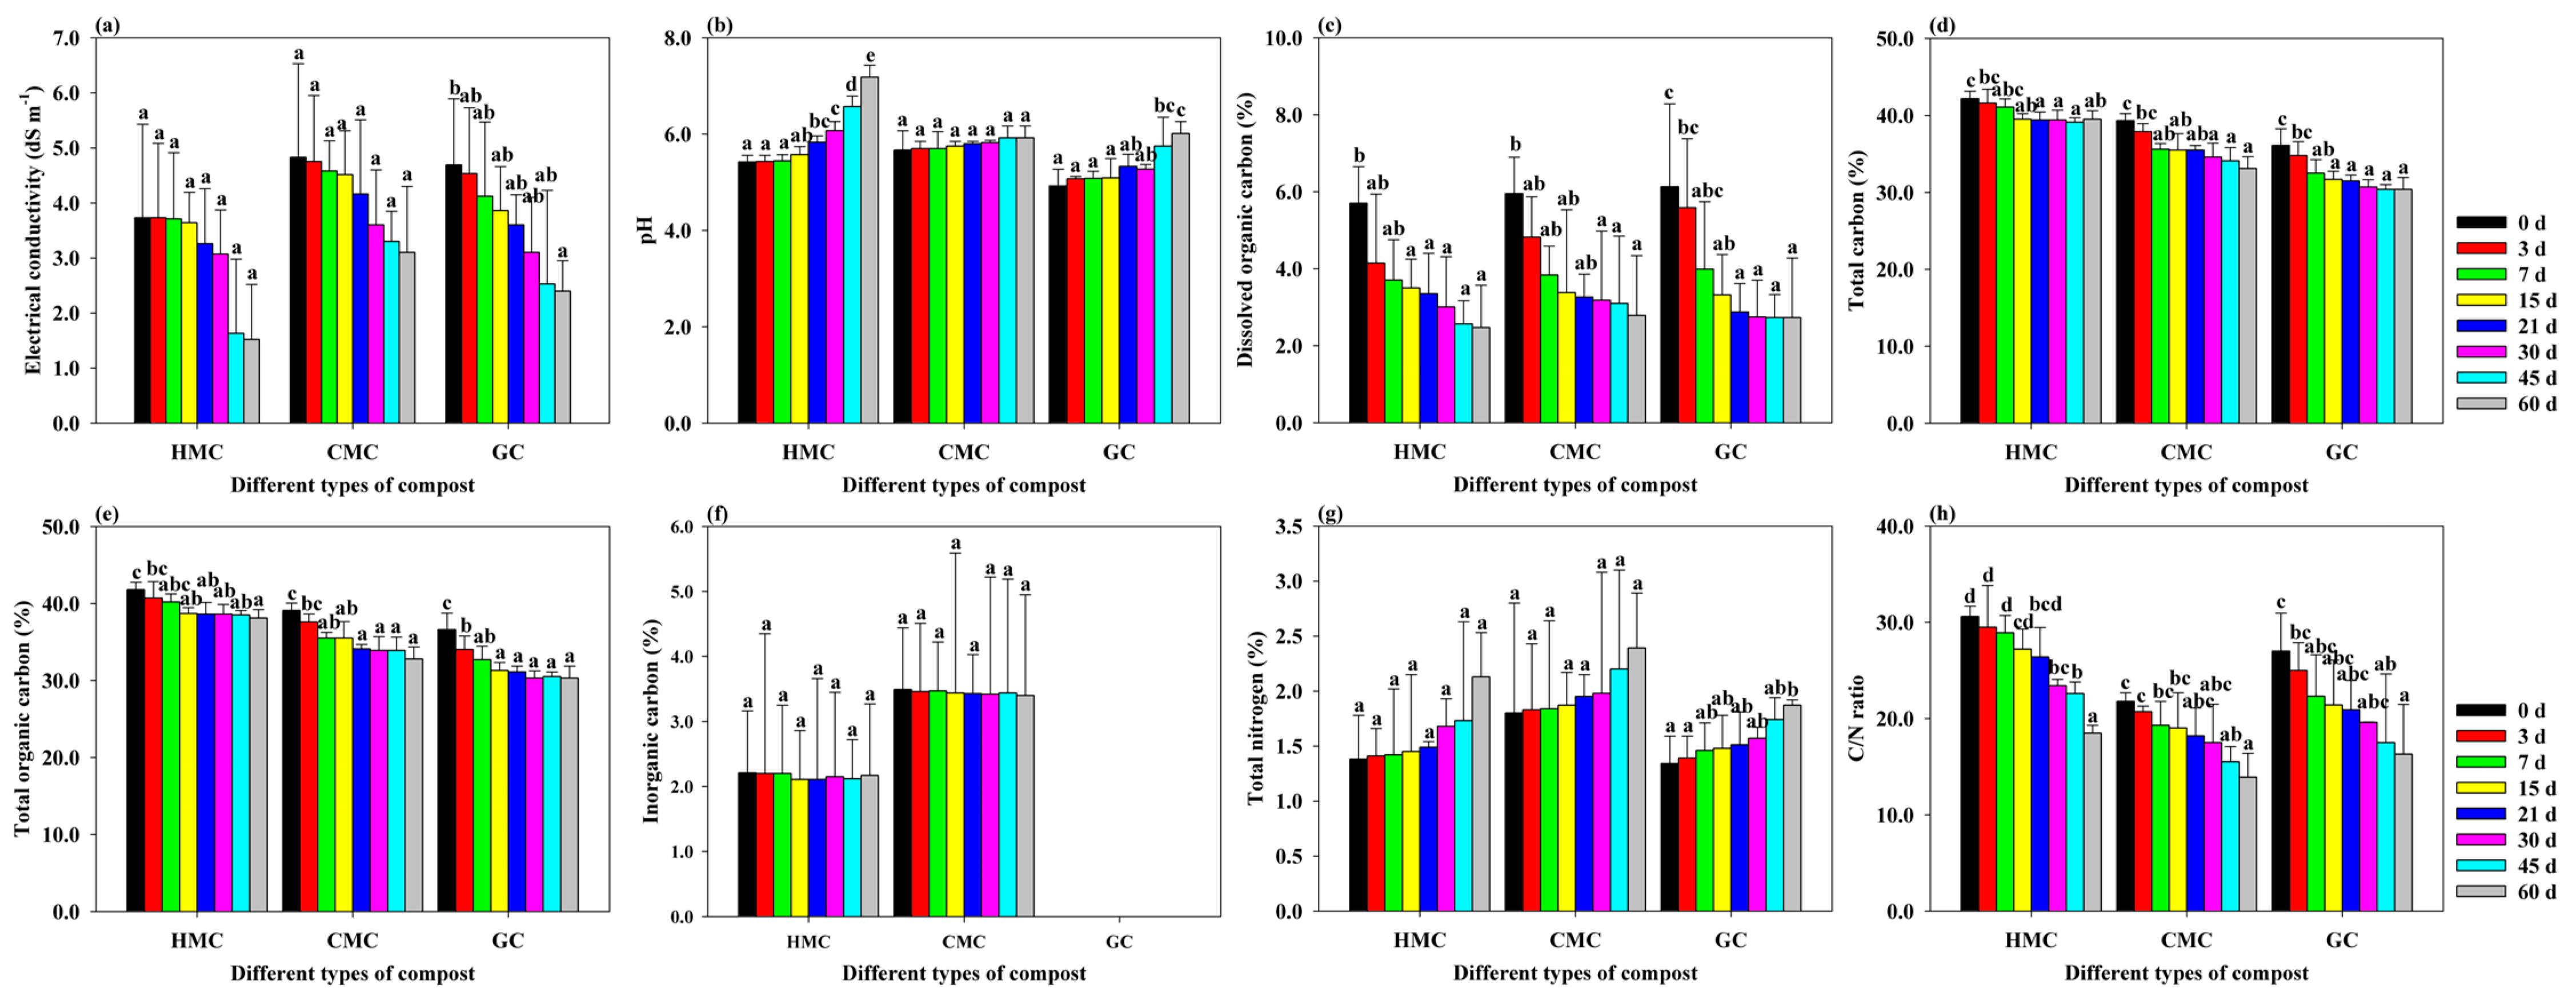
3.2. Electrical Conductivity (EC) of the Compost Extracts

High levels of soluble salts in compost could negatively affect crops, implying the poor quality of this compost. Figure 2a shows that the EC values of the three composts decreased over time. HMC had an EC value of <2 dS/m (the level harmless to most plants) after 45 days of composting, and CMC and GC had EC values of 2–4 dS/m at the same stage. The decrease in EC could be attributed to the turning of the compost and the loss of moisture, resulting in the leaching of soluble salts from the compost. Humification can also lead to less functional group density in the organic matter structure and thus decrease the EC of the extracts. Applying organic fertilizers with high EC values can cause soil salinity or inhibit crop growth. Therefore, compost with higher EC values should be mixed with soil or other low EC materials (such as peat moss) before they are used as a growing medium. The EC value of compost is more representative of its quality rather than its maturity.

3.3. pH Values of the Composts

The pH value is one of the critical factors affecting microbial growth. Figure 2b shows that the pH values of HMC and GC significantly increased during the composting process. The pH values of HMC increased from 5.42 to 7.18, and those of GC increased from 4.92 to 6.01. In contrast, the pH of CMC did not change significantly over this period. All compost reached the weak acid or neutral status after 60 days. Briefly, the reasons for the increase in pH during composting are: (1) in the early stage of composting, organic nitrogen undergoes mineralization through microbial action, resulting in the production of ammonium nitrogen and an increase in pH, and (2) in the later stage of composting, the release of H+ by nitrifying bacteria during the nitrification process also affects the pH [17]. The raw materials intuitively affect the initial—and the subsequent change in—pH values of the compost. Thus, in addition to EC, pH values should be considered a quality rather than a maturity index.

3.4. Carbon and Nitrogen in the Composts

The contents of dissolved organic carbon (DOC), as a measurement of DOM, in all composts showed a significant decrease during composting. The DOC of HMC, CMC, and GC decreased from 5.70% to 2.47%, from 5.95% to 2.79%, and from 6.13% to 2.93%, respectively (Figure 2c). The degradation of DOM in compost is rapid in the early stage, possibly due to the high fresh organic matter content in the initial phase that results in increased microbial and chemical reactions [2,12]. Moreover, humification can form large-structured organic substances with lower solubility from smaller DOM. The total carbon (TC) and total organic carbon (TOC) contents of the composts also showed a decreasing trend along with decomposition time. After seven days of composting, TC and TOC reached a relatively stable state because, in the early stage of composting, microorganisms metabolize and mineralize the fraction of the easily decomposable organic matter and release carbon dioxide to obtain energy, resulting in a decrease in TC and TOC. TOC was the predominant fraction of the TC in the three tested composts, leading to similar decreasing trends. Accordingly, the two properties could be reflective of the microorganisms’ early activity rather than compost maturity.
The total nitrogen content of all composts increased during the composting process. It increased by 54.3%, 32.2%, and 39.8% for HMC, CMC, and GC, respectively (Figure 2g). The continuous decomposition of organic matter into carbon dioxide and water could reduce the compost volume and weight, resulting in a decrease in nitrogen amount but a relative increase in nitrogen concentration [18]. The C/N ratio commonly serves as an indicator for evaluating compost maturity. Our results from Figure 2h show that the C/N ratio for the three composts tested significantly decreased during the composting process. The C/N ratio for HMC decreased by 39.4%, from an initial value of 30.5 to 18.5; the ratio for CMC decreased by 36.5%, from an initial value of 21.8 to 13.8; while for GC, the C/N ratio decreased by 39.7%, from 27.0 to 16.3. In this study, the C/N ratios of all compost materials decreased below 20 during the composting period. A C/N ratio of less than 20 is commonly considered one of the indicators of compost maturity. In this study, the initial C/N ratios and composting times required to reach C/N ratios below 20 varied across the three composts. We also found that other properties kept changing even though the C/N ratios had decreased below 20. Nevertheless, the C/N ratios across experimental replicates revealed high variations, especially for CMC and GC. Previous research suggested C/N ratios ranging from 15 to 25 (around the 20th day of composting) as a criterion for compost maturity [1]. This was inconsistent with the present study, which found that the C/N ratio index might be dependent on the compost type.

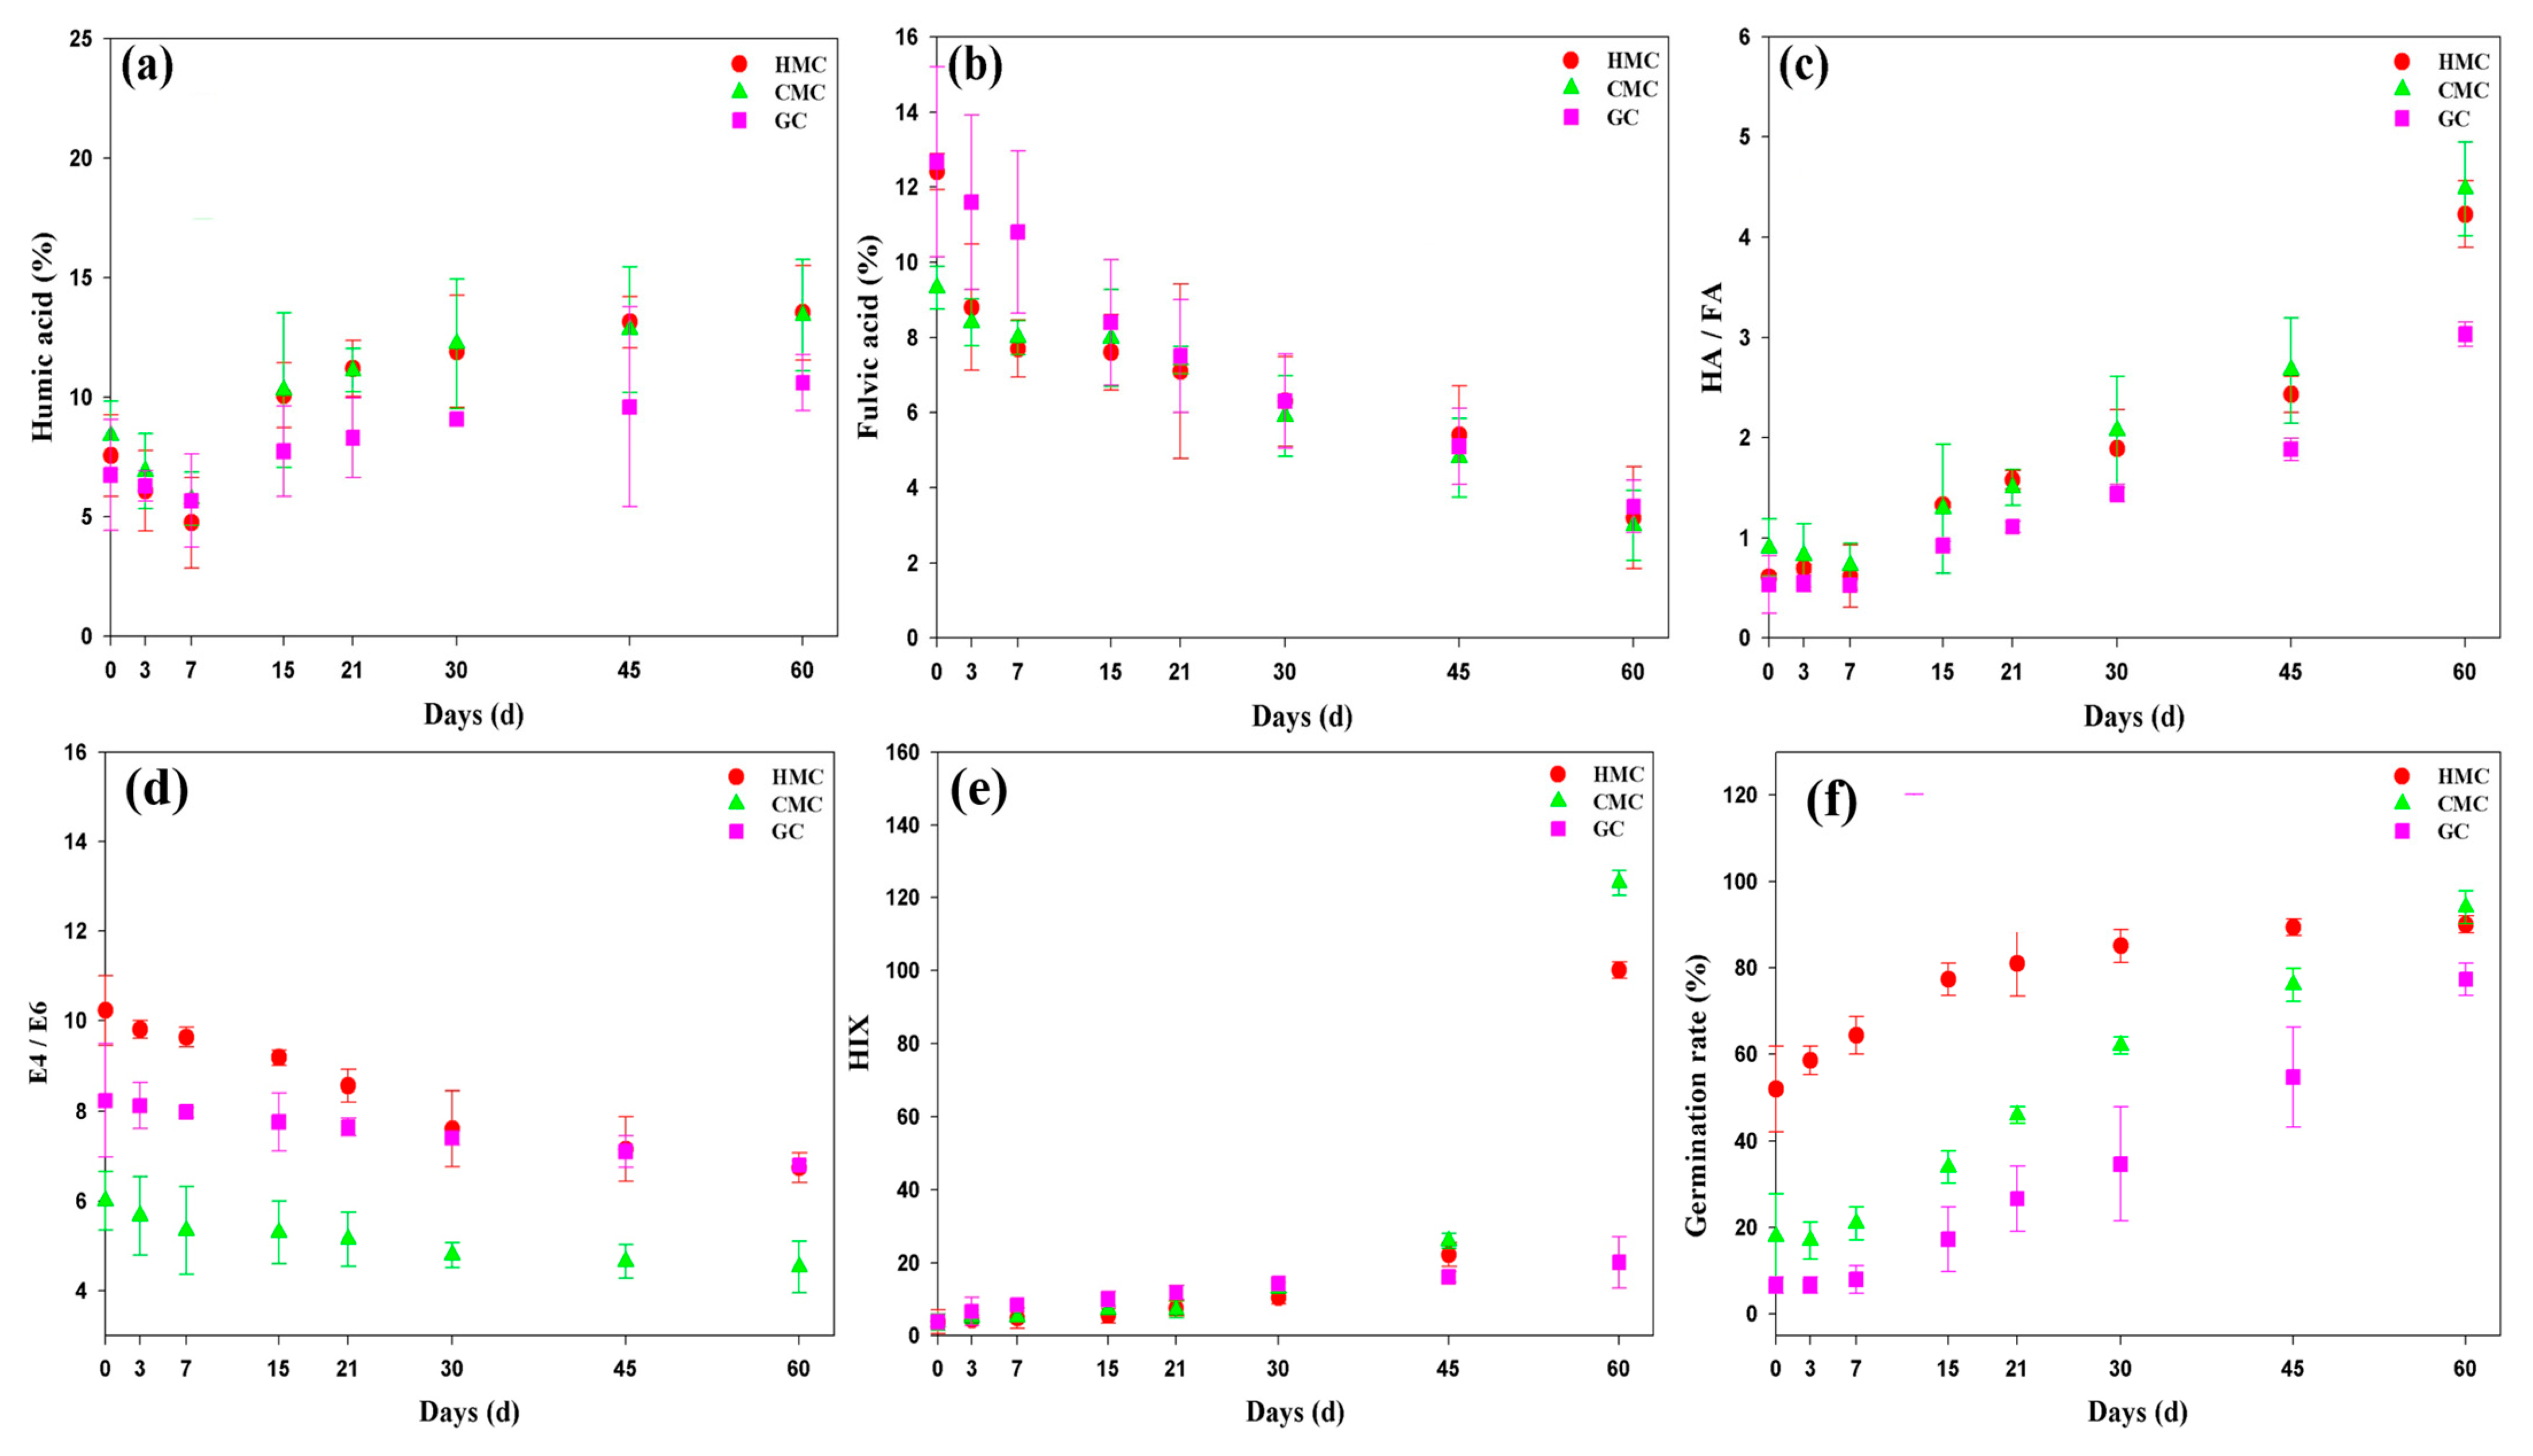
3.5. Humic Acid (HA) and Fulvic Acid (FA) in the Composts

Figure 3a shows the HA content in the composts during composting. The HA content decreased in the first week, which could be attributed to the high microbial activity during the early stages of composting, leading to the rapid decomposition of easily degradable organic matter. Afterward, the HA content gradually increased, primarily due to the transformation of organic matter into aromatic compounds or the formation of structurally complex and more stable humic substances. After 30 days of composting, the HA content increased to a relatively stable state, with final values of 13.5%, 13.4%, and 10.6% for HMC, CMC, and GC, respectively.
FA content decreased throughout the composting process in all composts (Figure 3b), probably because FA is lower in molecular weight, simpler in chemical structure, and more decomposable than HA [19]. The final FA contents were 3.2%, 3.0%, and 3.5% for HMC, CMC, and GC, respectively. The assessment of compost maturity in terms of organic matter composition mainly focuses on changes in the three major components: HA, FA, and humic substances (HS). A previous study denoted that the quantity of HS derived from agricultural residues remained relatively stable during the composting process, the HA content increased gradually until maturation, and the FA content decreased during composting [11]. Our study shows similar trends for HA and FA.
The degree of humification of organic matter could be assessed using the HA/FA ratio, which generally tends to increase with composting time. After 60 days of composting in this study, the HA/FA ratios also increased and reached 4.23, 4.48, and 3.03 for HMC, CMC, and GC, respectively (Figure 3c). It is generally accepted that compost matures once the HA/FA ratio reaches 1.9 [20,21]. In this way, the required composting time for both HMC and CMC is 30 days, while that for GC is 45 days. Since some properties of the composts—including the HA/FA ratio itself—were still changing, the HA/FA ratio may not serve as the absolute indicator of fully mature compost.

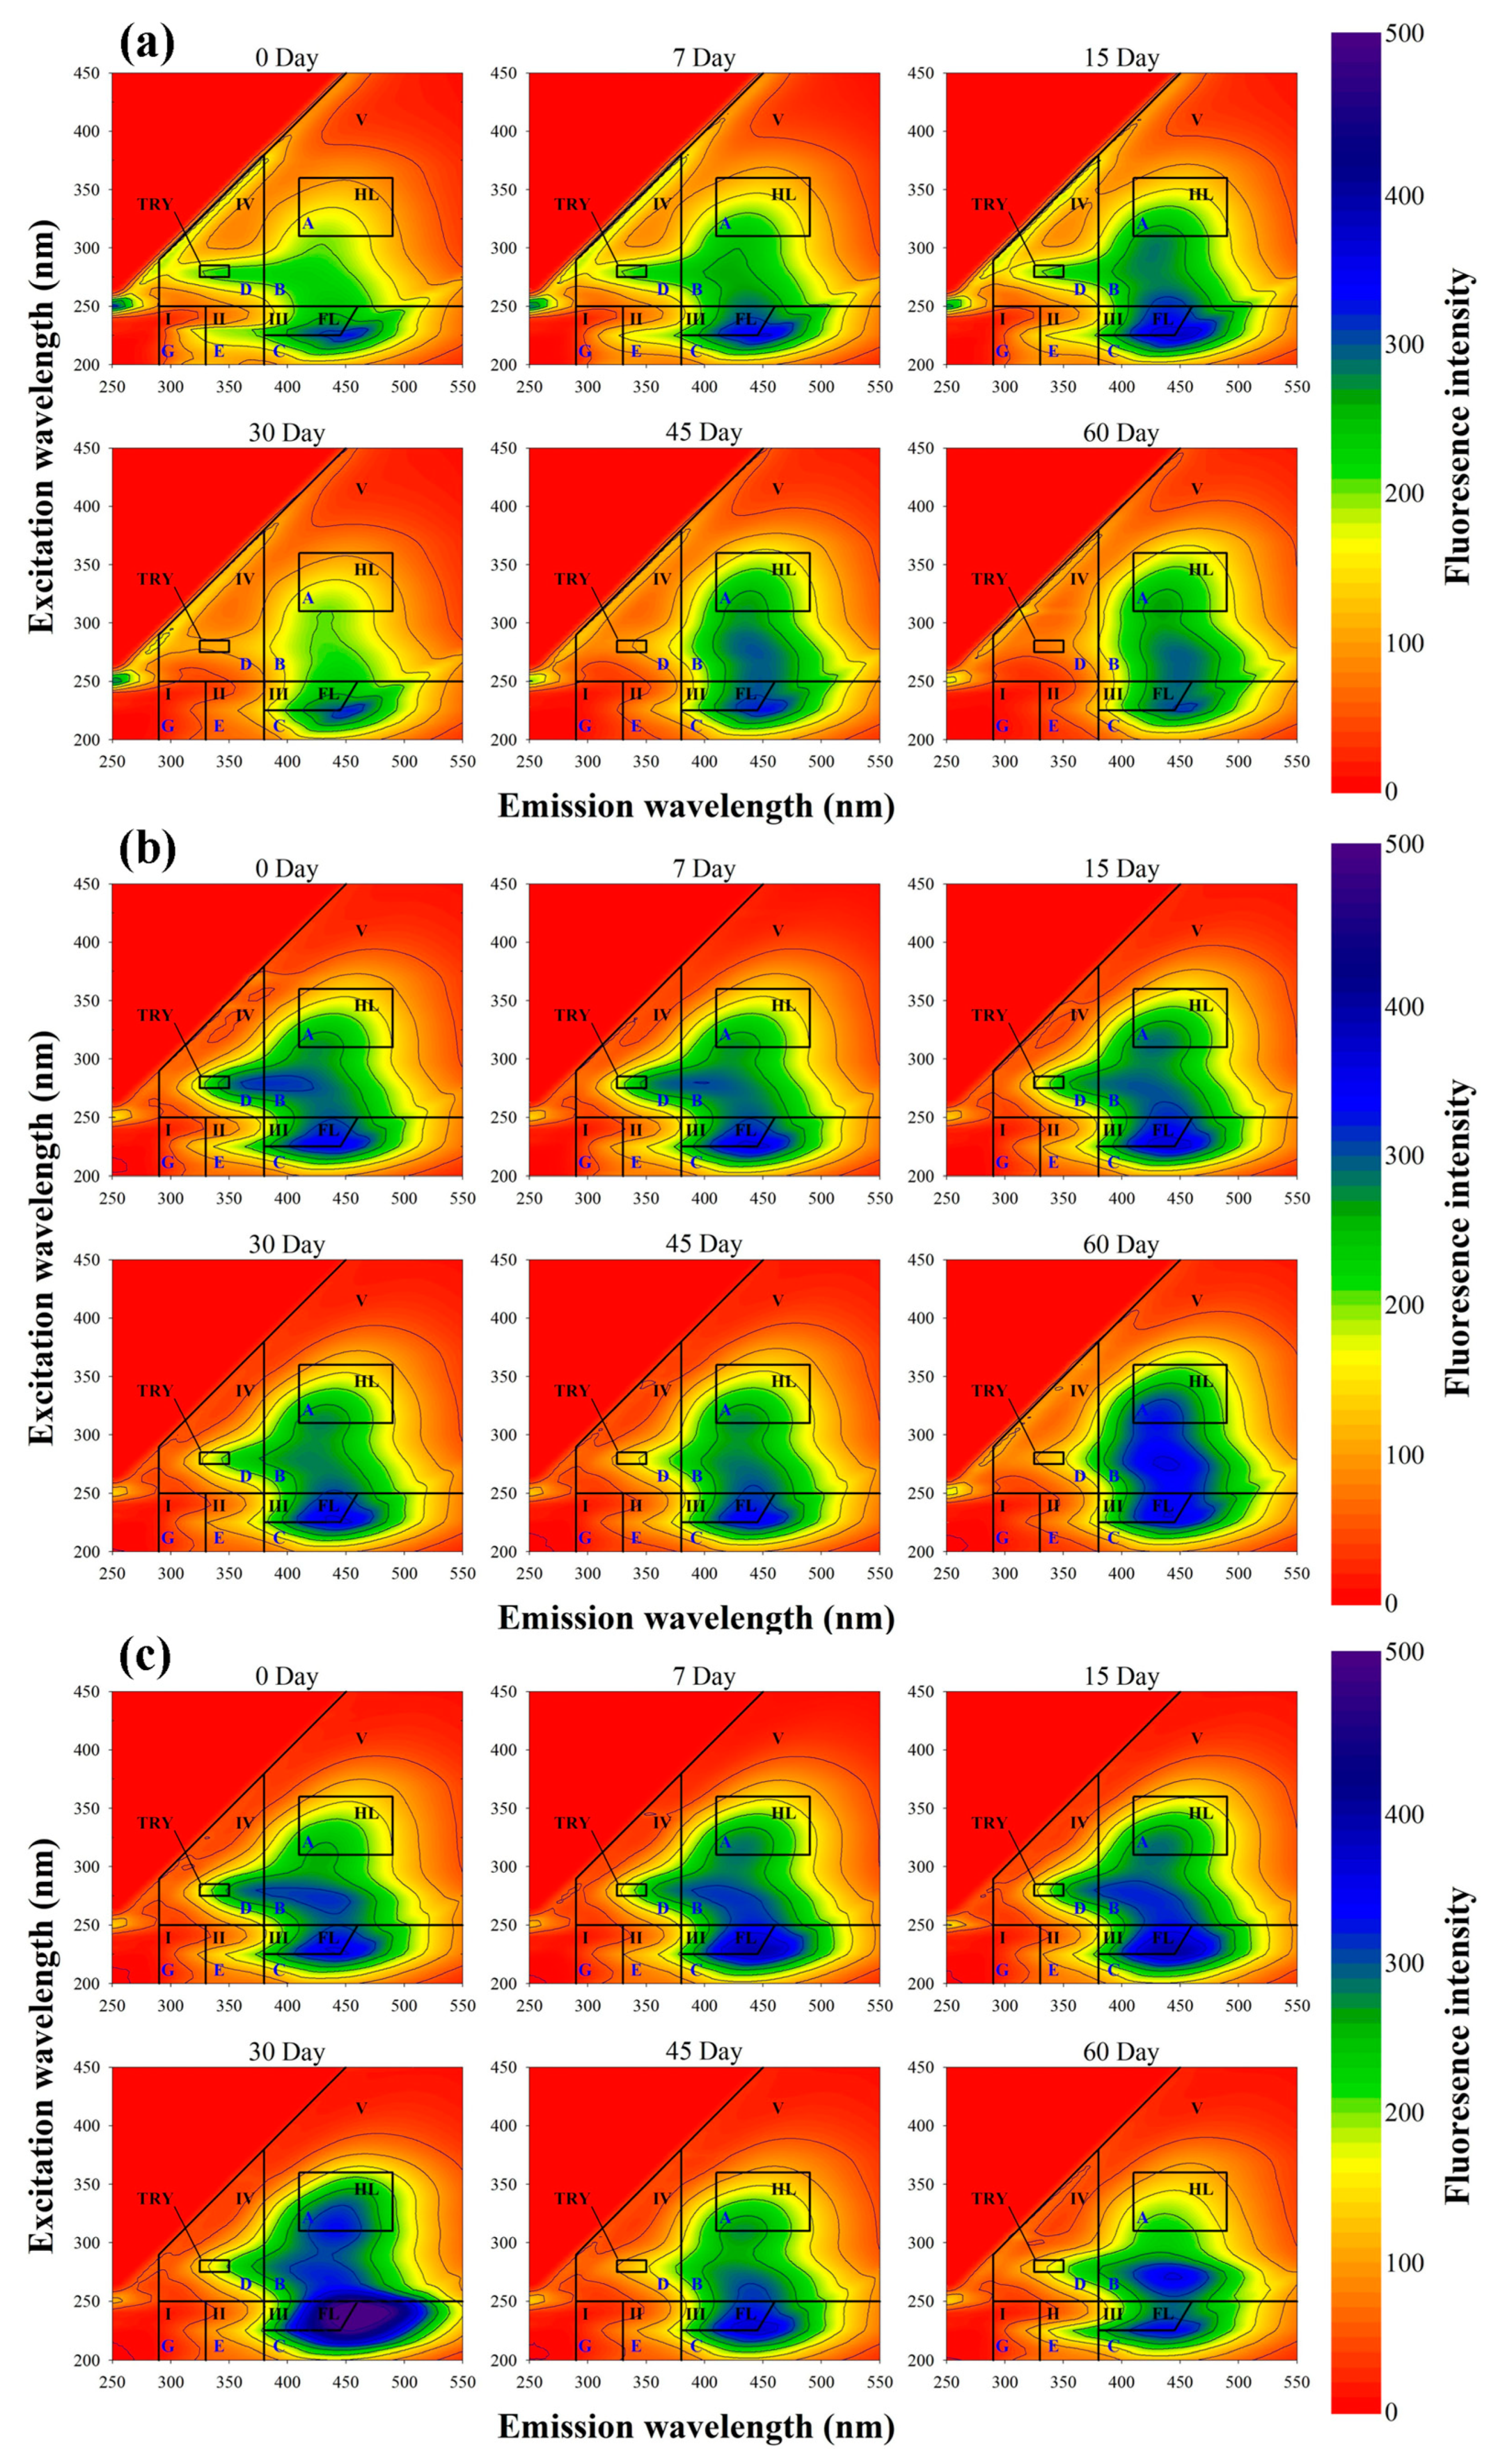
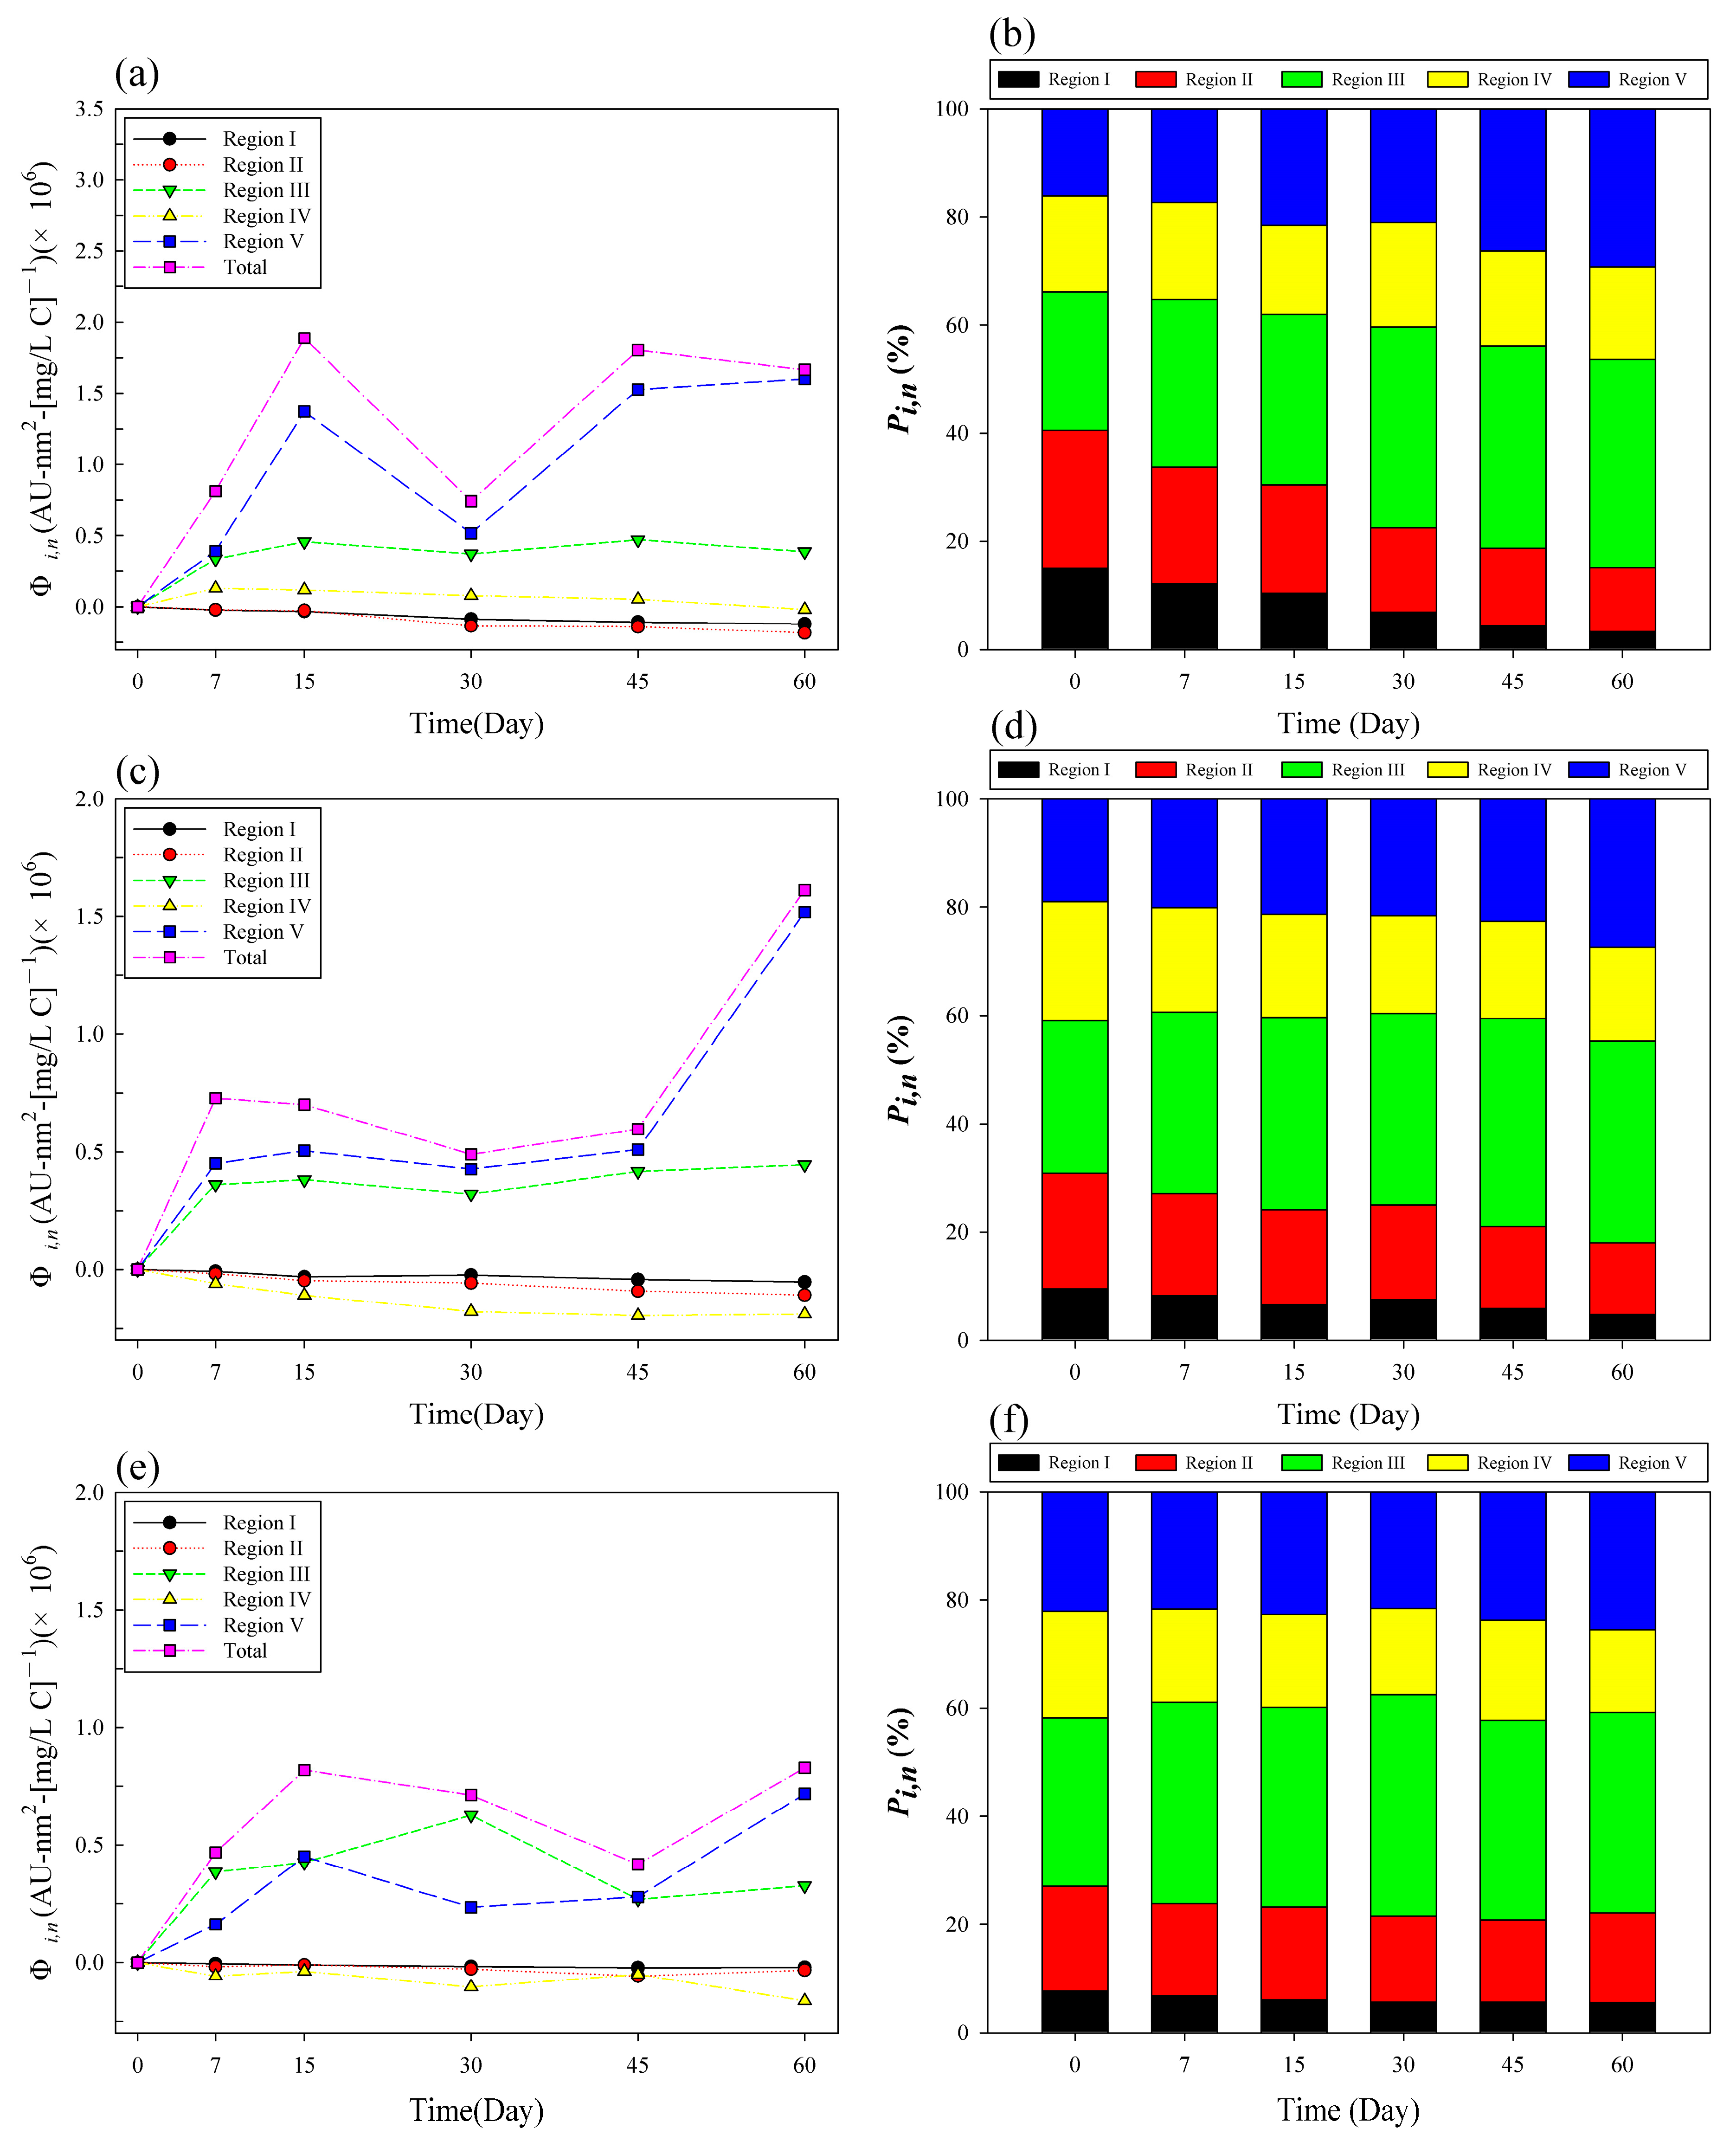
3.6. The Optical Indices during Composting

E4/E6 is also commonly used as an indicator for assessing maturity. Based on the results in Figure 3d, the E4/E6 ratios of all composts showed a decreasing trend. This ratio decreased from an initial value of 10.2 to 6.74 for HMC, from 6.01 to 4.53 for CMC, and from 8.24 to 6.80 for GC. The results could be due to the gradual transformation of small organic molecules or fulvic acid into larger humic acid molecules during the composting process. All composts showed a stabilized E4/E6 ratio after 30 days of composting, ranging between 5 and 8. We consider the E4/E6 ratio an indicator of early-stage maturity.
In addition to E4/E6, the humification index (HIX) obtained from fluorescence analysis may be another indicator of organic material maturity and resistance to decomposition [22,23,24,25]. Figure 3e shows that HIX increased over time during composting. The HIX of HMC increased from an initial value of 3.82 to 100, CMC from 3.77 to 124, and GC from 3.83 to 20.1. The initial HIX values for all composts were less than four, indicating that the composts consisted mainly of fresh plant and animal manure. At 45 days, the HIX values for all composts were higher than 16, indicating a high degree of humification in these three composts [22,23,24,25].

3.7. Germination Rate of the Composting Substances

Figure 3f shows that, for all composts, the germination rate of seeds (Chinese cabbage) increases with composting time. The germination rate of HMC reached over 80% after 30 days, and that of CMC exceeded 80% after 60 days. However, the germination rate of GC did not surpass 80% even at the end of composting. The higher EC values for CMC and GC could be the main reason for the retardation of the germination rate and the increase in the GI (Figure 2a). The germination rate is a simple and intuitive method, although it requires a longer time to test. It is widely applied to the assessment of the quality and maturity of compost by testing the biological toxicity of compost leachate. In our study, the germination rate reflected the quality (probably dominated by EC) rather than the maturity.

3.8. Evaluation of Fluorescence Indices of Compost Maturity

The peaks of the EEM spectra indicating the chemical changes in the compost during the composting period used limited spectra data, which could not identify the heterogeneity in aromatic DOM in the compost [26]. The fluorescence-regional integration (FRI) technique, a quantitative method [27], has been introduced to divide the EEM spectra into five excitation–emission regions (Region I: tyrosine-like organic compounds; Region II: tryptophan-like organic compounds; Region III: fulvic acid-like materials; Region IV: soluble microbial byproduct-like materials; Region V: humic acid-like materials) [28].
Figure 4 shows the 3D EEM spectra. All spectra indicated the presence of the different fluorophores identified by Ex/Em wavelength pairs and the specific fluorescence intensity of these peaks. Figure 5 illustrates the changes in the composition of organic substances in the compost during the composting process. The results indicate that during the initial stages of composting (Days 0 and 7), the predominant organic substances are fulvic-like substances (Region III, FL), along with some tryptophan-like substances (Region II) and tyrosine-like substances (Region I). After 15 days, a noticeable transformation from fulvic-like substances to humic-like substances (Region V, A) occurred, accompanied by a gradual disappearance of tryptophan-like and tyrosine-like substances. By day 45, the composition of organic substances in the compost undergoes a significant transition, with a predominance of humic-like substances and aromatic compounds (Region V, B), indicating the progressive maturation of the compost. The organic matter in the compost gradually transformed into humic acids (higher molecular weight) and more stable aromatic compounds, representing a higher maturity degree.
Normalizing the cumulative excitation–emission area volumes to relative regional areas resulted in the normalized excitation–emission area volumes (Φi,n and ΦT,n, referring to the value of Region I and the entire region) and the percent fluorescence response (Pi,n), as shown in Figure 5. Both Φi,n and ΦT,n increased and decreased during the initial 30 days, mainly due to the fluctuation in extracted DOC concentration in compost. The increase in the aromatic groups accounted for the changes in Φ3,n and Φ5,n, essentially contributing to the evolution of ΦT,n (Figure 5a,c,e). Φ3,n and Φ5,n represented the humic substances whose constitutions varied during humification. FA changes involved the decrease in polysaccharides and the production of structures incorporating more aromatic compounds and aliphatic polyesters/ethers [29]. On the other hand, groups containing aromatic and carboxylic C increased, while polysaccharides and other aliphatic structures degraded during composting, resulting in HA structures with higher aromaticity [30]. The increase in aromatic compounds in both parts of the humic substances increased ΦT,n in the three composts to 0.75–1.8 × 10⁷ AUnm−2 (mg L−1)−1 on days 7–15. However, the values fluctuated until the end of composting, mainly due to the variations in Φ3,n and Φ5,n.
Generally speaking, the Pi,n trends for the five regions of the three composts can be categorized into abating, fluctuating, and accruing. Regions I and II had Pi,n values of 5.1–14.3%, 18.9–25.8%, and 25.1–35.1% for HMC, CMC, and GC, respectively, and bottomed out on day 60. On the contrary, region V showed the reverse trend, with the bottom at 18.7–20.1% at the beginning and increasing to 23.2–27.8% on day 60, indicating that humic acid-like materials were the main components of fluorescence materials at the end (Figure 5b,d,f).

4. Conclusions

This study evaluated the changes in humic substances during the composting process using fluorescence spectra and several physicochemical maturity indicators. We aimed to understand the maturation degree of composts and to provide a more accurate assessment of compost quality or full maturity. There is currently no unified standard for determining compost maturity; therefore, we integrated several indicators and adopted the semi-quantitative integration method to calculate the maturity indices of the composts. In addition, seed germination was used as a reference standard to evaluate the actual time of compost maturation in conjunction with temporal changes in the indicators. Based on our results, E4/E6 ratio, C/N ratio, HA, FA, and germination rate reached a stable state after 30 days. Accordingly, we recommend that composting time for each compost type should be at least 30 days to achieve the first stage of maturity. Subsequently, the central temperature, electrical conductivity, HIX, and GI stabilized after 45 days of composting, implying that they are more suitable indicators of full maturity and that fully matured compost is most likely to be produced after 45 days. Three-dimensional fluorescence excitation–emission matrix spectroscopy (3D EEM) may be a powerful tool for obtaining detailed information on the maturity of composts.

Author Contributions

Conceptualization and methodology, S.-H.J.; sample analysis, Y.-T.C.; writing—original draft preparation, S.-H.J. and C.-H.L.; writing—review and editing, S.-H.J., C.-H.L., C.-Y.H. and T.-C.C. All authors have read and agreed to the published version of the manuscript.

Funding

This research was funded by the Ministry of Science and Technology of the R.O.C. (Grant number MOST 105-2628-B-020-001-MY2).

Data Availability Statement

The authors confirm that the data supporting the findings of this study are available within the article.

Conflicts of Interest

The authors declare no conflict of interest.

References

  1. Marhuenda-Egea, F.C.; Martínez-Sabater, E.; Jordá, J.; Moral, R.; Bustamante, M.A.; Paredes, C.; Pérez-Murcia, M.D. Dissolved organic matter fractions formed during composting of winery and distillery residues: Evaluation of the process by fluorescence excitation-emission matrix. Chemosphere 2007, 68, 301–309. [Google Scholar] [CrossRef]
  2. Fuentes, M.; Baigorri, R.; Garcia-Mina, J.M. Maturation in composting process, an incipient humification-like step as multivariate statistical analysis of spectroscopic data shows. Environ. Res. 2020, 189, 109981. [Google Scholar] [CrossRef]
  3. Garcia, C.; Hernandez, T.; Costa, F.; Pascual, J.A. Phytotoxicity due to the agricultural use of urban wastes: Germination experiments. J. Sci. Food Agric. 1992, 59, 313–319. [Google Scholar] [CrossRef]
  4. Miikki, V.; Senesi, N.; Hanninen, K. Characterization of humic material formed by composting of domestic and industrial biowastes. Part 2. Spectroscopic evaluation of humic acid structures. Chemosphere 1997, 34, 1639–1651. [Google Scholar] [CrossRef]
  5. Li, P.; Liu, J.; Jiang, C.; Wu, M.; Liu, M.; Li, Z. Distinct successions of common and rare bacteria in soil under humic acid amendment—A microcosm study. Front. Microbiol. 2019, 10, 2271. [Google Scholar] [CrossRef] [PubMed]
  6. Li, G.; Zhang, F. Solid Waste Composting and Organic Compound Fertilizer Production (Revised Edition); Chemical Industry Press: Beijing, China, 2005. [Google Scholar]
  7. Chai, X.; Zhang, H.; Zhao, Y. Principles and Techniques of Solid Waste Composting; Chemical Industry Press: Beijing, China, 2005. [Google Scholar]
  8. Bünemann, E.K.; Bongiorno, G.L.; Bai, Z.G.; Creamer, R.E.; Deyn, G.D.; Goede, R.D.; Fleskens, L.; Geissen, V.; Kuyper, T.W.; Mäder, P.; et al. Soil quality—A critical review. Soil Biol. Biochem. 2018, 120, 105–125. [Google Scholar] [CrossRef]
  9. Jones, D.L.; Simfukwe, P.; Hill, P.W.; Mills, R.T.E.; Emmett, B.A. Evaluation of dissolved organic carbon as a soil quality indicator in national monitoring schemes. PLoS ONE 2014, 9, e90882. [Google Scholar] [CrossRef] [PubMed] [Green Version]
  10. Schmidt, M.P.; Martínez, C.E. The influence of tillage on dissolved organic matter dynamics in a Mid-Atlantic agroecosystem. Geoderma 2019, 344, 63–73. [Google Scholar] [CrossRef]
  11. Chefetz, B.; Hatcher, P.G.; Hadar, Y.; Chen, Y. Chemical and biological characterization of organic matter during composting of municipal solid waste. J. Environ. Qual. 1996, 25, 776–785. [Google Scholar] [CrossRef]
  12. Wei, Z.; Zhao, X.Y.; Zhu, C.W.; Xi, B.D.; Zhao, Y.; Yu, X. Assessment of humification degree of dissolved organic matter from different composts using fluorescence spectroscopy technology. Chemosphere 2014, 95, 261–267. [Google Scholar] [CrossRef]
  13. Nelson, A.J.; Sommers, L.E. Total carbon, organic carbon aand organic matter. In Method of Soil Analysis: Part 2 Chemical and Microbiological Properties, 2nd ed.; Page, A.L., Ed.; Agronomy SSSA and ASA: Madison, WI, USA, 1982; Volume 9, pp. 539–579. [Google Scholar]
  14. Bremner, J.M. Nitrogen Total. In Methods of Soil Analysis Part 3: Chemical Methods; Sparks, D.L., Ed.; SSSA Book Series 5; Soil Science Society of America: Madison, WI, USA, 1996; pp. 1085–1122. [Google Scholar]
  15. He, X.S.; Xi, B.D.; Wei, Z.M.; Guo, X.J.; Li, M.X.; An, D.; Liu, H.L. Spectroscopic characterization of water extractable organic matter during composting of municipal solid waste. Chemosphere 2011, 82, 541–548. [Google Scholar] [CrossRef] [PubMed]
  16. Murphy, K.R.; Butler, K.D.; Spencer, R.G.M.; Stedmon, C.A.; Boehme, J.R.; Aiken, G.R. Measurement of dissolved organic matter fluorescence in aquatic environments: An interlaboratory comparison. Environ. Sci. Technol. 2010, 44, 9405–9412. [Google Scholar] [CrossRef] [PubMed]
  17. Sánchez-Monedero, M.A.; Roig, A.; Paredes, C.; Bernal, M.P. Nitrogen transformation during organic waste composting by the Rutgers system and its effects on pH, EC and maturity of the composting mixtures. Bioresour. Technol. 2001, 78, 301–308. [Google Scholar] [CrossRef]
  18. Zhou, S.Z.; Zhang, X.Y.; Liao, X.D.; Wu, Y.B.; Mi, J.D.; Wang, Y. Effect of Different Proportions of Three Microbial Agents on Ammonia Mitigation during the Composting of Layer Manure. Molecules 2019, 24, 2513. [Google Scholar] [CrossRef] [PubMed] [Green Version]
  19. Liu, N.; Zhao, G.; Ye, W.S.; Liu, G. Effects of UV-irradiation on Cd2+ and Pb2+ binding to humic/fulvic acids: Methodological guidance to eliminating the interference of dissolved organic matter on SWASV detection of heavy metals in soil extracts. Environ. Technol. Innov. 2023, 31, 103232. [Google Scholar] [CrossRef]
  20. Iglesias Jiménez, E.; Pérez García, V. Determination of maturity indices for city refuse composts. Agric. Ecosyst. Environ. 1992, 38, 331–343. [Google Scholar] [CrossRef]
  21. Raj, D.; Antil, R.S. Evaluation of maturity and stability parameters of composts prepared from agro-industrial wastes. Bioresour. Technol. 2011, 102, 2868–2873. [Google Scholar] [CrossRef]
  22. Birdwell, J.E.; Engel, A.S. Characterization of Dissolved Organic Matter in Cave and Spring Waters Using UV–Vis Absorbance and Fluorescence Spectroscopy. Org. Geochem. 2010, 41, 270–280. [Google Scholar] [CrossRef]
  23. Parlanti, E.; Wörz, K.; Geoffroy, L.; Lamotte, M. Dissolved organic matter fluorescence spectroscopy as a tool to estimate biological activity in a coastal Region submitted to anthropogenic inputs. Org. Geochem. 2000, 31, 1765–1781. [Google Scholar] [CrossRef]
  24. Burdige, D.J.; Kline, S.W.; Chen, W. Fluorescent Dissolved Organic Matter in Marine Sediment Pore Waters. Mar. Chem. 2004, 89, 289–311. [Google Scholar] [CrossRef]
  25. Huguet, A.; Vacher, L.; Relexans, S.; Saubusse, S.; Froidefond, J.M.; Parlanti, E. Properties of Fluorescent Dissolved Organic Matter in the Gironde Estuary. Org. Geochem. 2009, 40, 706–719. [Google Scholar] [CrossRef]
  26. Shao, Z.H.; He, P.J.; Zhang, D.Q.; Shao, L.M. Characterization of water-extractable organic matter during the biostabilization of municipal solid waste. J. Hazard. Mater. 2009, 164, 1191–1197. [Google Scholar] [CrossRef] [PubMed]
  27. Chen, W.; Westerhoff, P.; Leenheer, J.A.; Booksh, K. Fluorescence Excitation−Emission Matrix Regional Integration to Quantify Spectra for Dissolved Organic Matter. Environ. Sci. Technol. 2003, 37, 5701–5710. [Google Scholar] [CrossRef] [PubMed]
  28. Liu, N.; Ye, W.S.; Zhao, G.; Liu, G. Release of free-state ions from fulvic acid-heavy metal complexes via VUV/H2O2 photolysis: Photodegradation of fulvic acids and recovery of Cd2+ and Pb2+ stripping voltammetry currents. Environ. Pollut. 2022, 315, 120420. [Google Scholar] [CrossRef]
  29. Jouraiphy, A.; Amir, S.; Winterton, P.; Gharous, M.E.; Revel, J.C.; Hafidi, M. Structural study of the fulvic fraction during composting of activated sludge-plant matter: Elemental analysis, FTIR and 13C NMR. Bioresour. Technol. 2008, 99, 1066–1072. [Google Scholar] [CrossRef] [PubMed]
  30. Amir, S.; Jouraiphy, A.; Meddich, A.; Gharous, M.E.; Winterton, P.; Hafidi, M. Structural study of humic acids during composting of activated sludge-green waste: Elemental analysis, FTIR and 13C NMR. J. Hazard. Mater. 2010, 177, 524–529. [Google Scholar] [CrossRef] [PubMed]
Figure 1. The water content (a) and central temperature (b) of hog manure compost (HMC), chicken manure compost (CMC), and general compost (GC) during the 60-day composting period.
Agronomy 13 01870 g001
Figure 2. Selected properties of the three studied composts during the composting period. The whiskers represent the standard deviations: (a) electrical conductivity, (b) pH, (c)dissolved organic content, (d) total carbon content, (e) total organic carbon content, (f) inorganic carbon content, (g) total nitrogen contents, (h) C/N ratio. The values followed by the same letters above the bars are not significantly different (p > 0.05) between different composting days.
Agronomy 13 01870 g002
Figure 3. The humic acid content (a), fulvic acid content (b), HA/FA ratio (c), E4/E6 ratio (d), humification index (HIX) (e), and germination percentage (f) of hog manure compost (HMC), chicken manure compost (CMC), and general compost (GC) during a 60-day composting period. The whiskers represent standard deviations.
Agronomy 13 01870 g003
Figure 4. 3D EEM spectrum of dissolved organic matter derived from hog manure compost (a), chicken manure compost (b), and general compost (c) during the 60-day composting period.
Agronomy 13 01870 g004
Figure 5. Normalized excitation–emission area volumes (Φi,n) (a,c,e) and the percent fluorescence response (Pi,n) (b,d,f) calculated from the 3D EEM spectrum of dissolved organic matter extracted from hog manure compost (a,b), chicken manure compost (c,d), and general compost (e,f) during the 60-day composting period.
Agronomy 13 01870 g005
Table 1. The composition of raw materials in the three composts in this study.
Major Constituents
of Compost
Hog Manure
Compost
(HMC)
Chicken Manure Compost
(CMC)
General
Compost
(GC)
Hog manure50%--
Chicken manure-50%-
Mushroom waste50%--
Sawdust-50%-
Corncob--90%
Rice bran--5%
Coconut fiber--5%
Disclaimer/Publisher’s Note: The statements, opinions and data contained in all publications are solely those of the individual author(s) and contributor(s) and not of MDPI and/or the editor(s). MDPI and/or the editor(s) disclaim responsibility for any injury to people or property resulting from any ideas, methods, instructions or products referred to in the content.

