
Analyzing Characteristics of Grassland Gross Ecosystem Product to Inform Decision Making in the Karst Desertification Control

Abstract
:1. Introduction
2. Materials and Methods
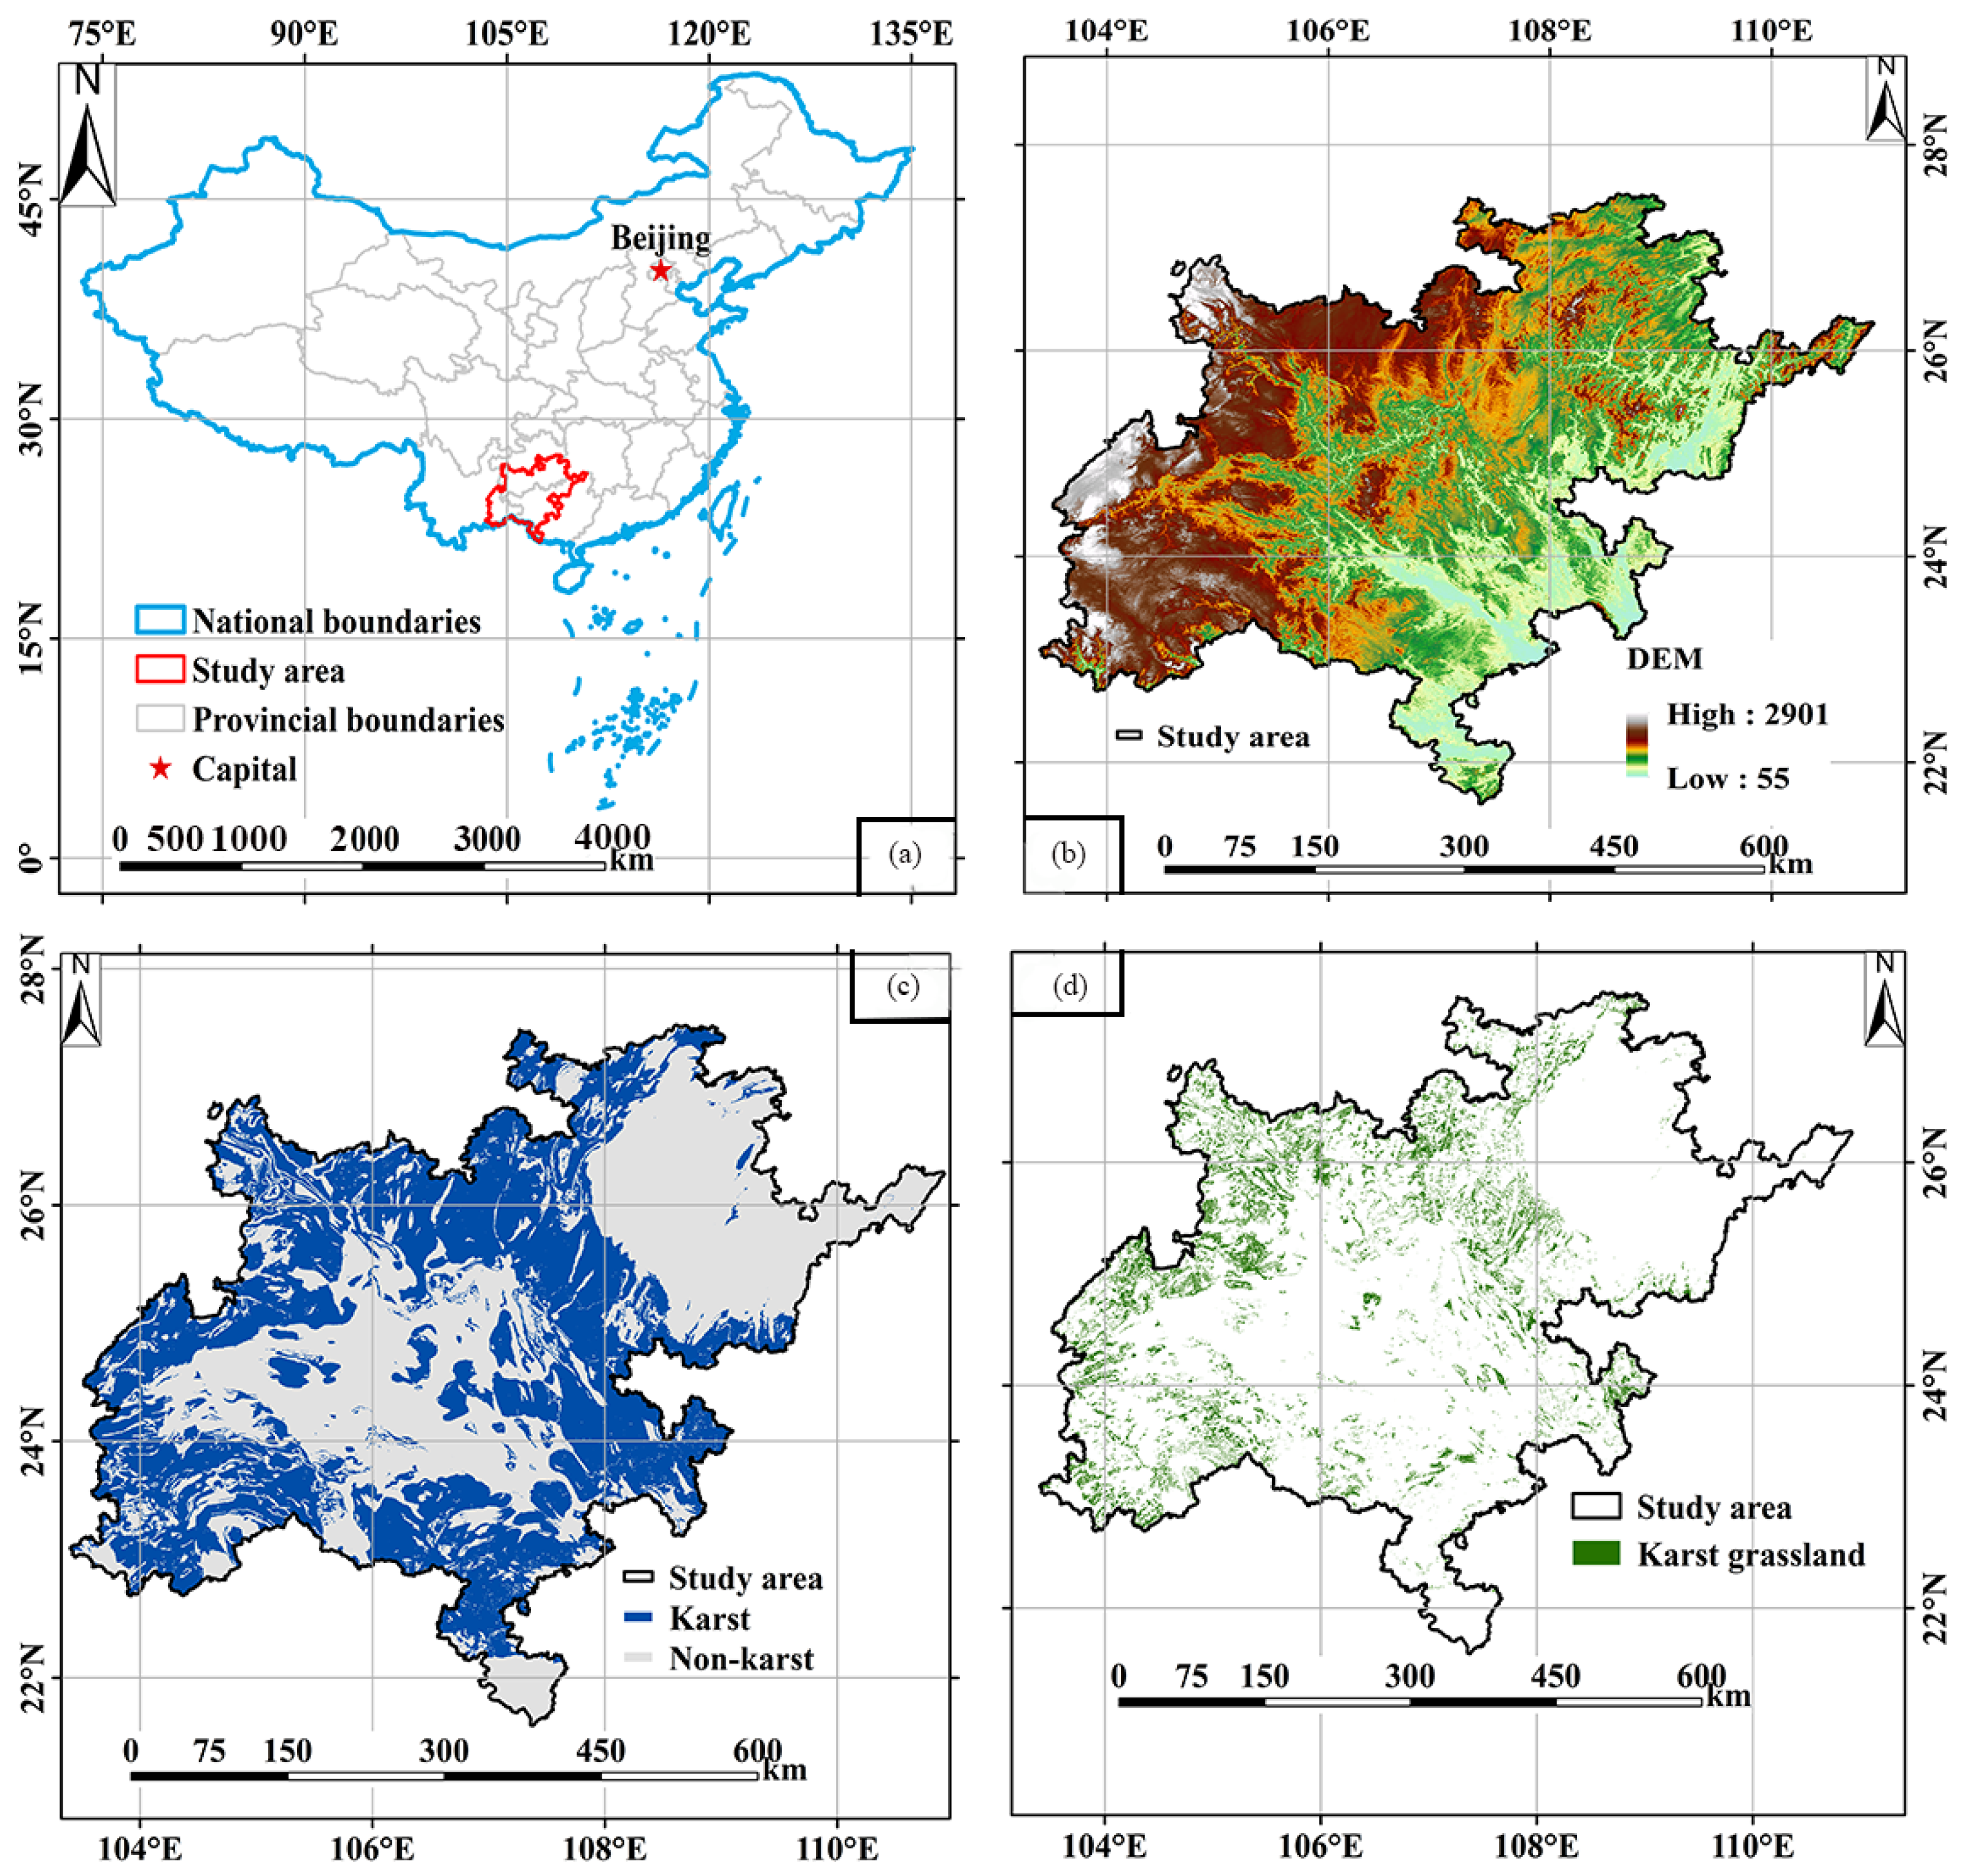
2.1. Research Areas
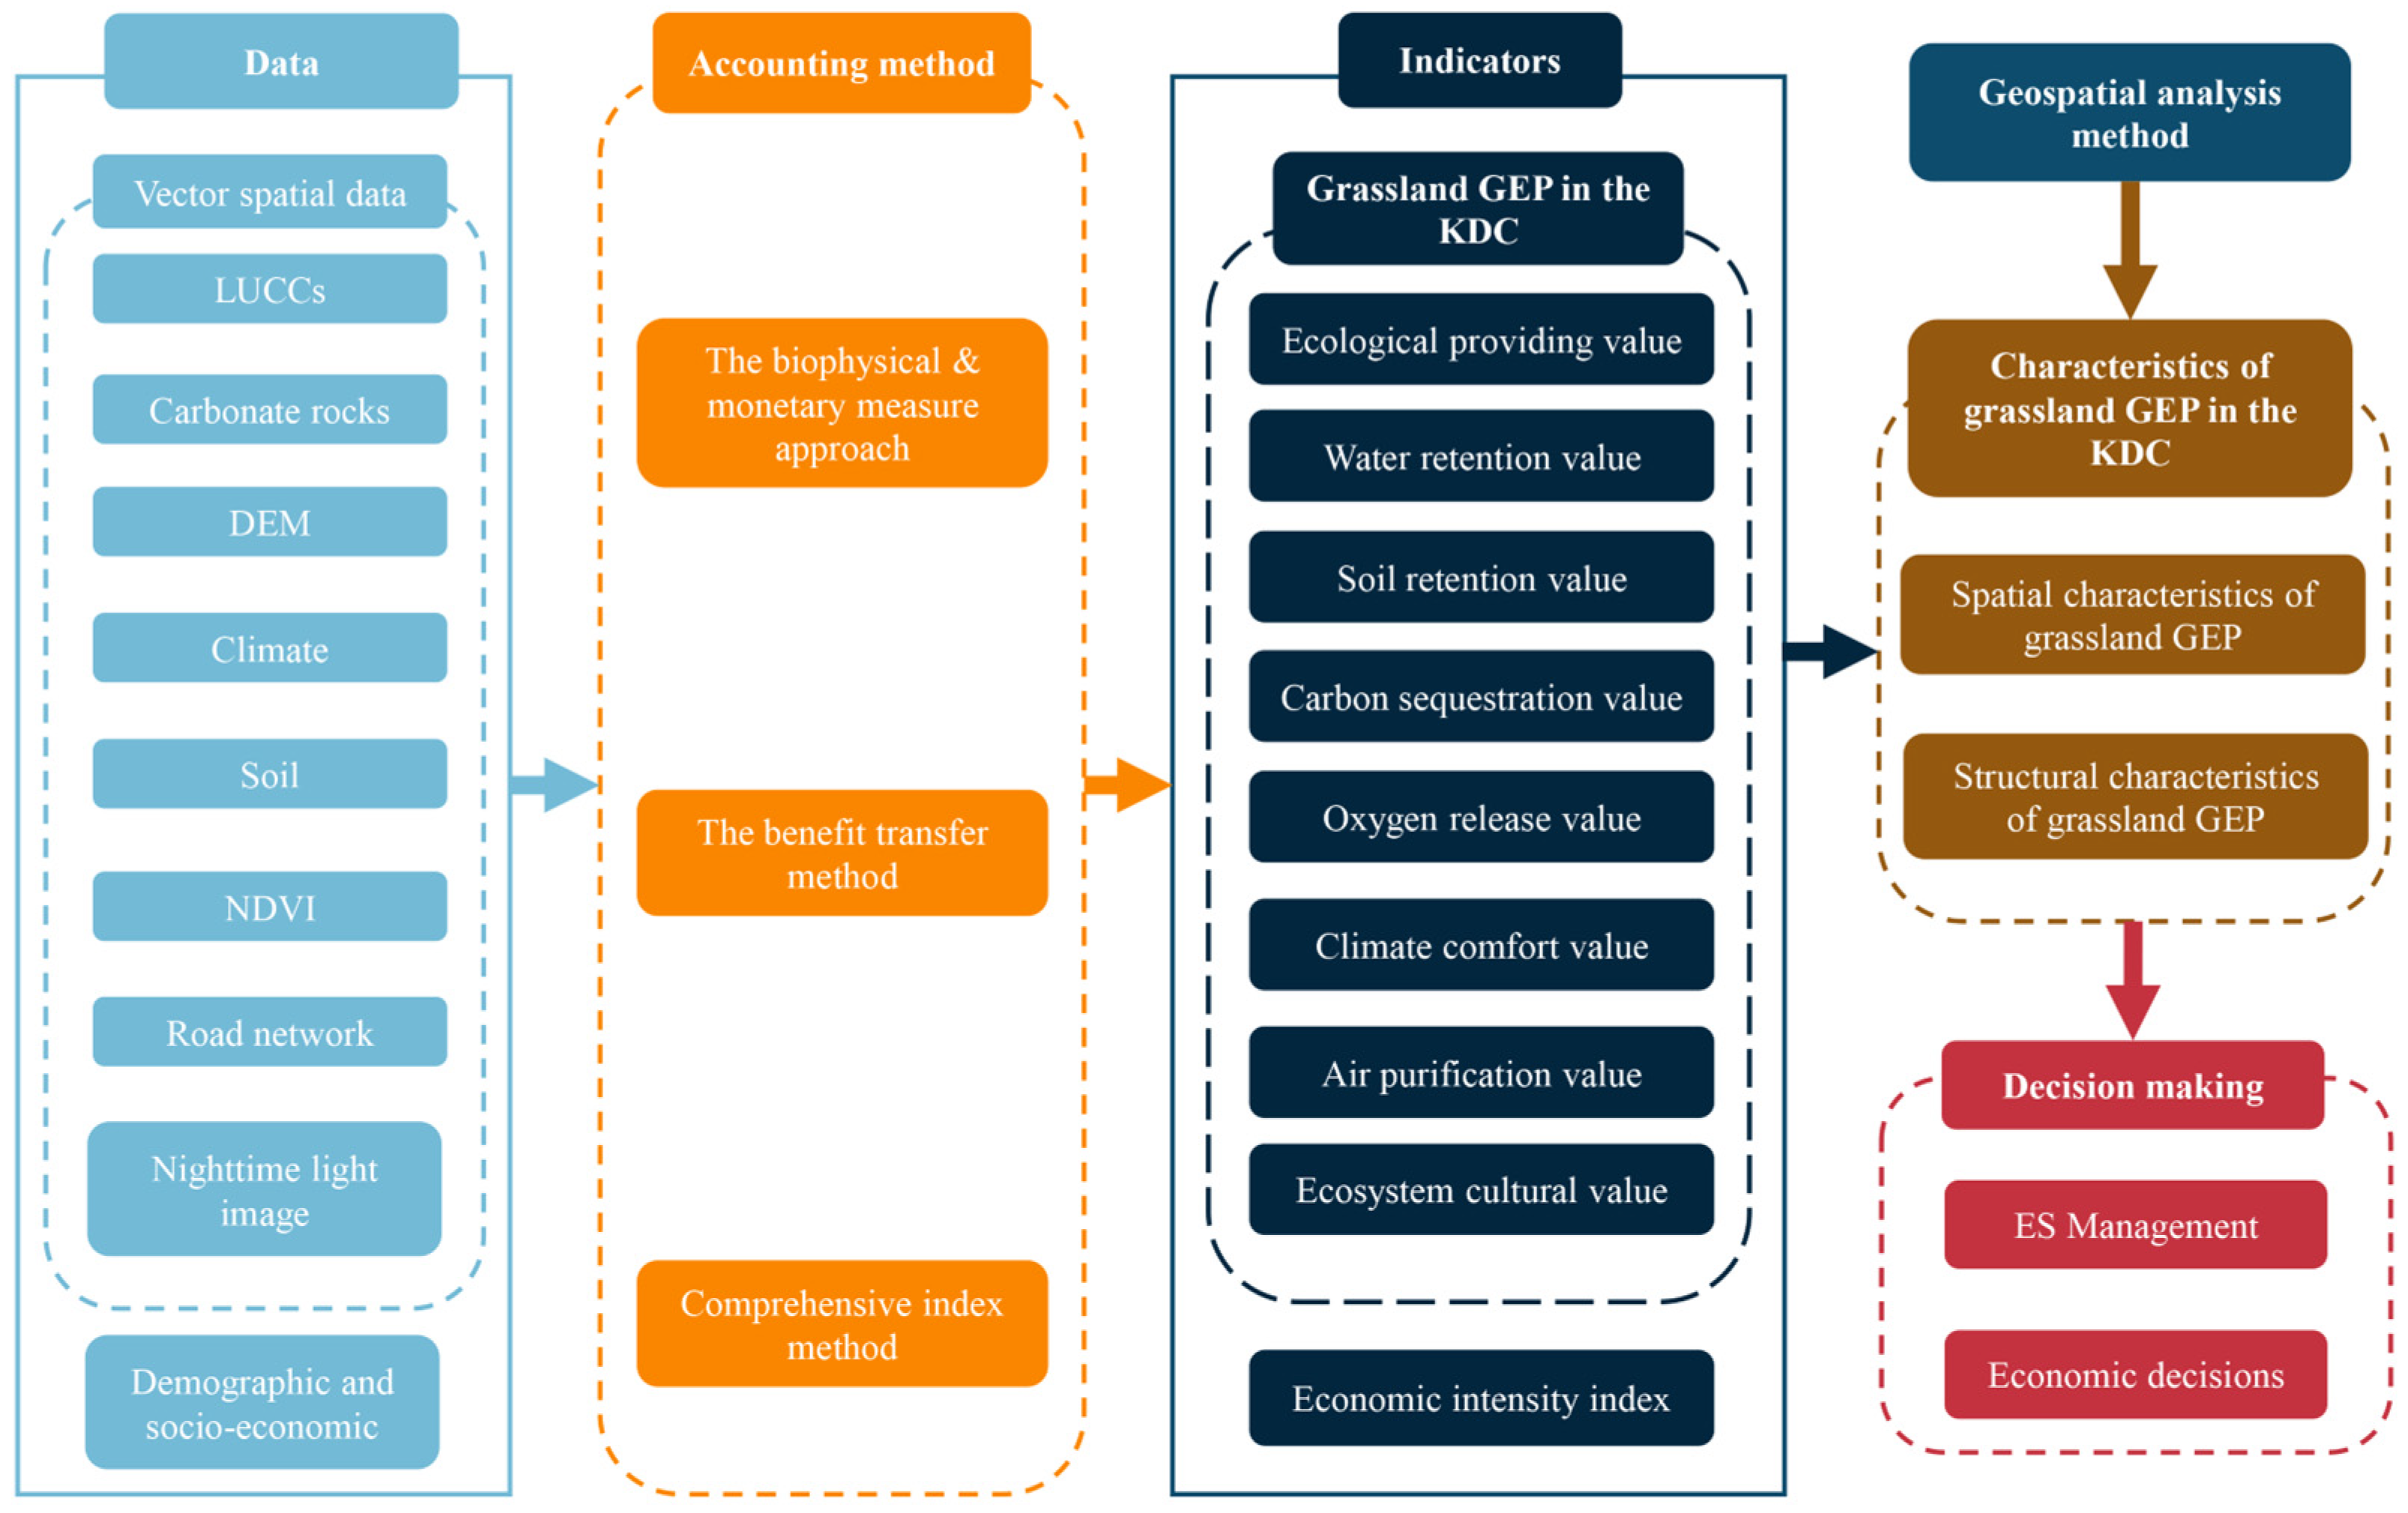
2.2. Data Source
2.3. Evaluation and Analysis Methods
2.3.1. Measuring GEP of Grassland in the KDC
- Ecosystem providing value
- Ecosystem regulation services value
- Water retention value
- 2.
- Soil retention value
- 3.
- Carbon sequestration and storage value
- 4.
- Oxygen release value
- 5.
- Climate comfort value
- 6.
- Air purification value
- Ecosystem cultural services value
2.3.2. Evaluation of Counties Economic Intensity
- Structure of indicator system
- Standardization of data.
- Determination of weights
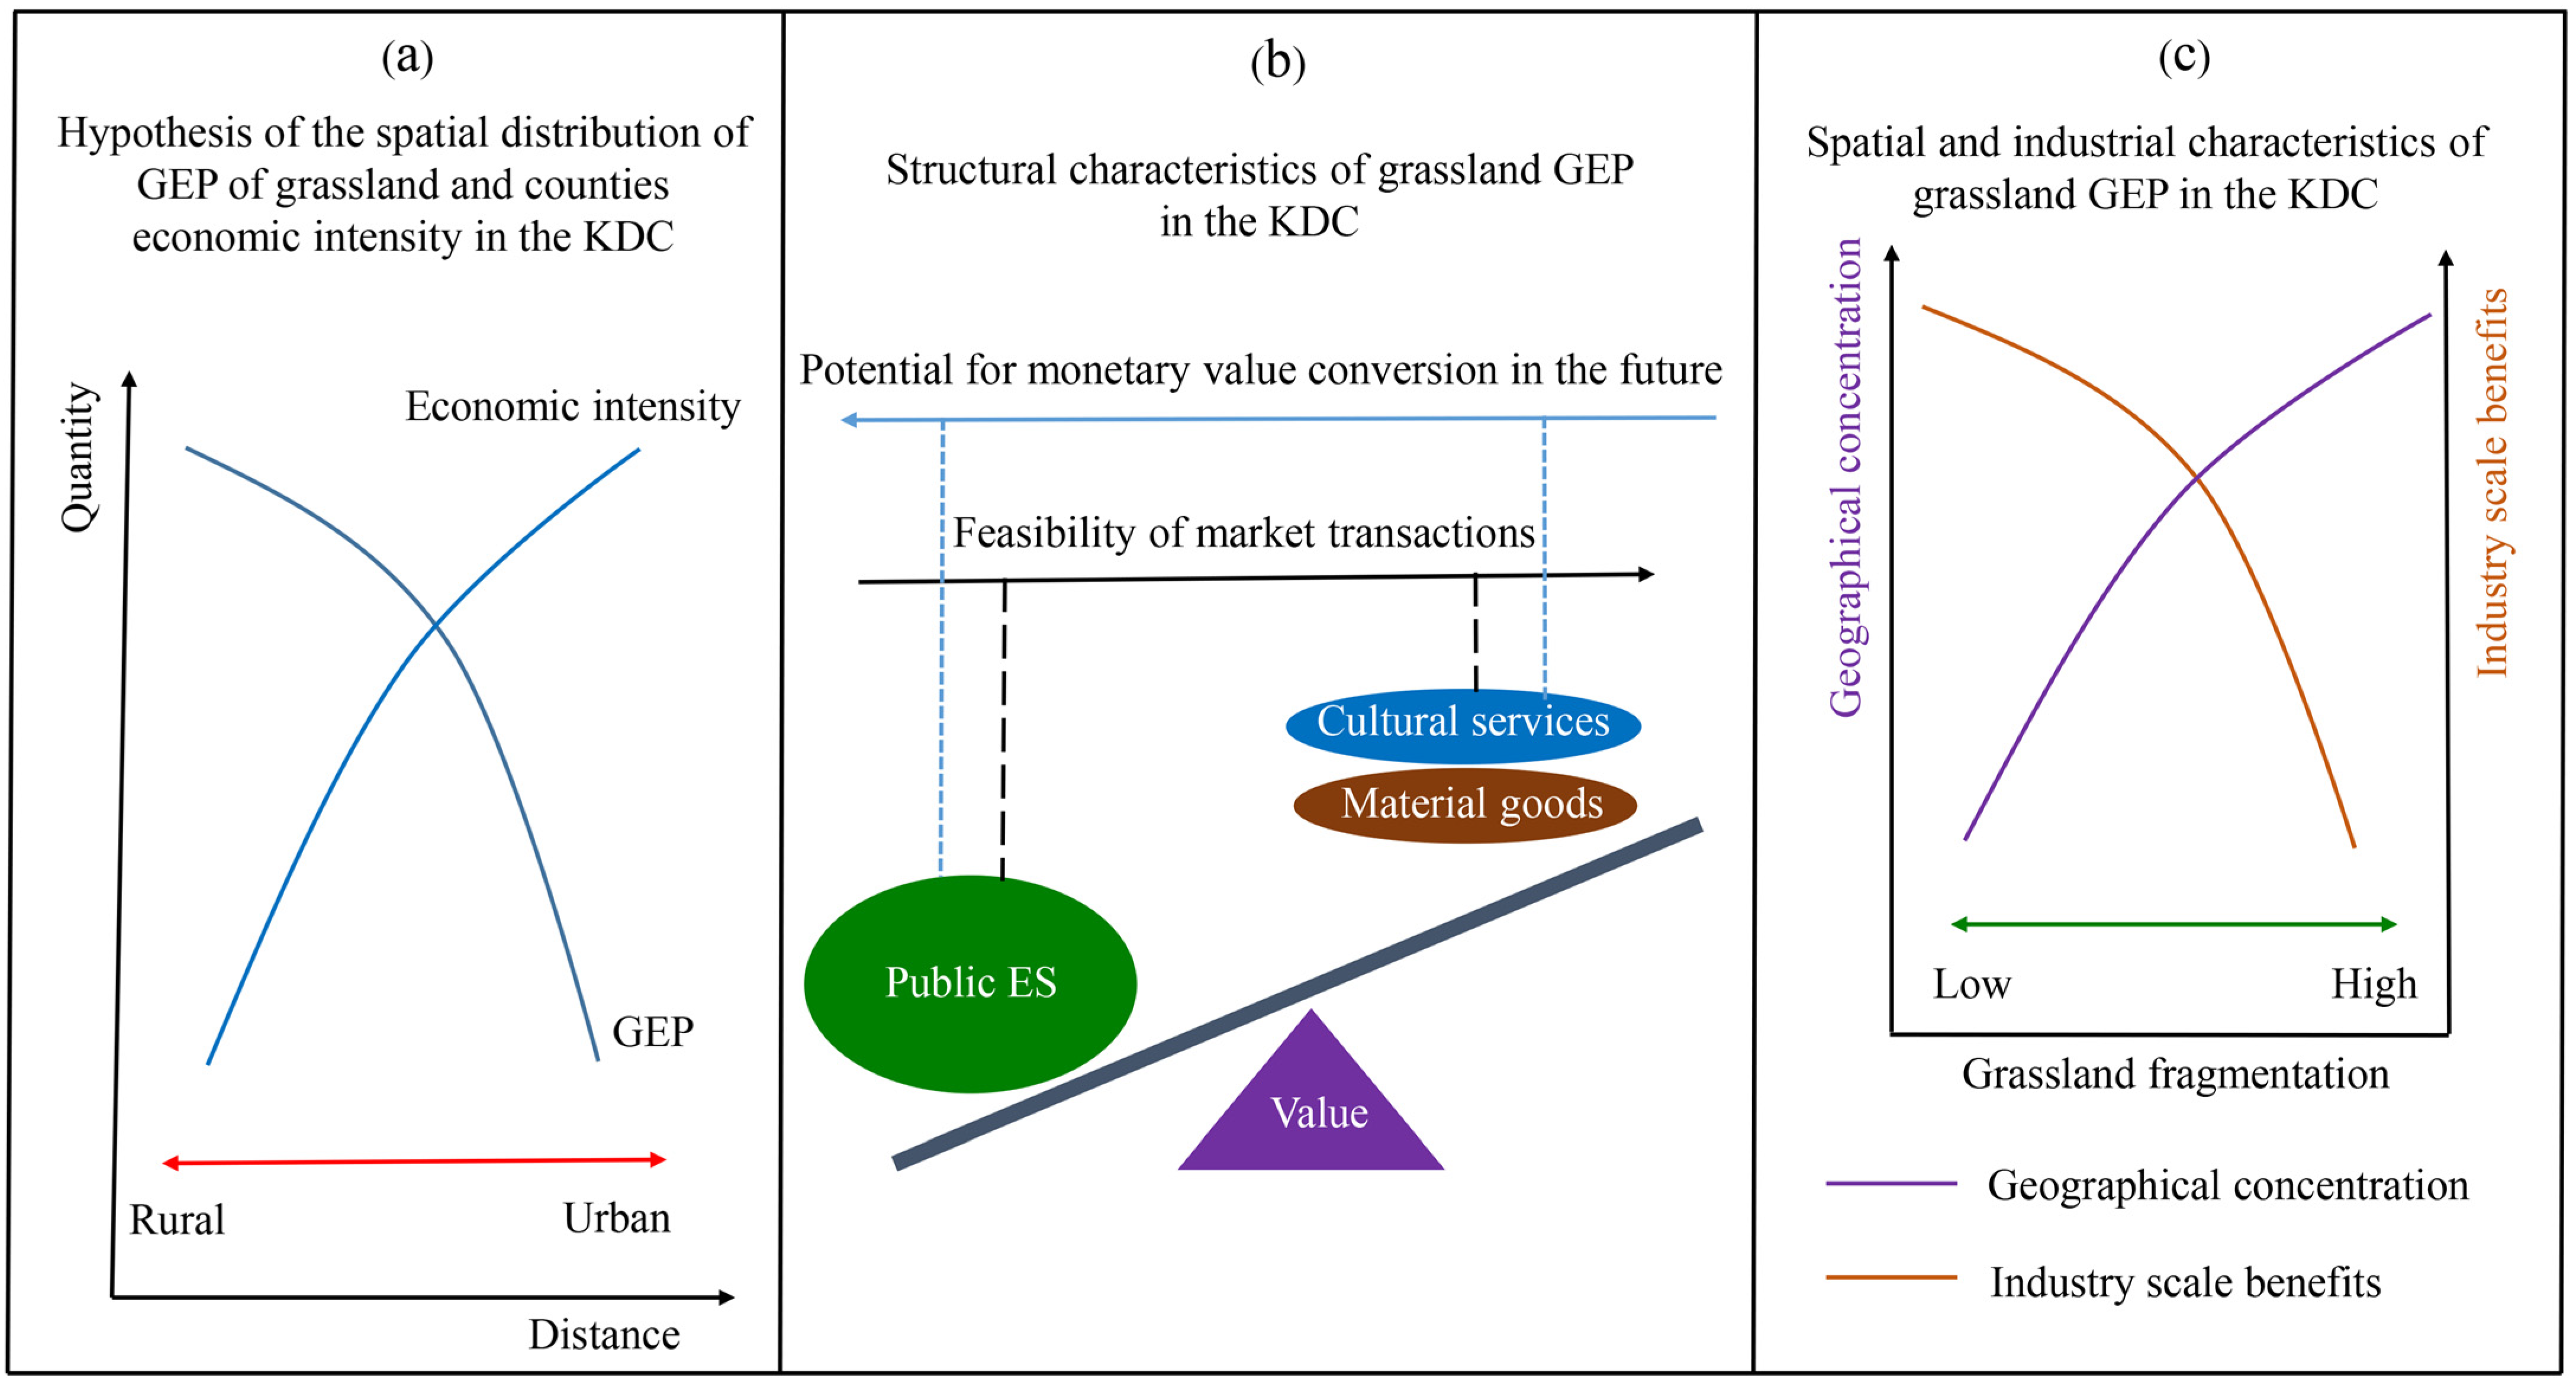
2.3.3. Characteristic Quantification of Grassland GEP in the KDC Area
- Structural characteristic of grassland GEP in the KDC area
- Geospatial characteristics of grassland GEP in the KDC
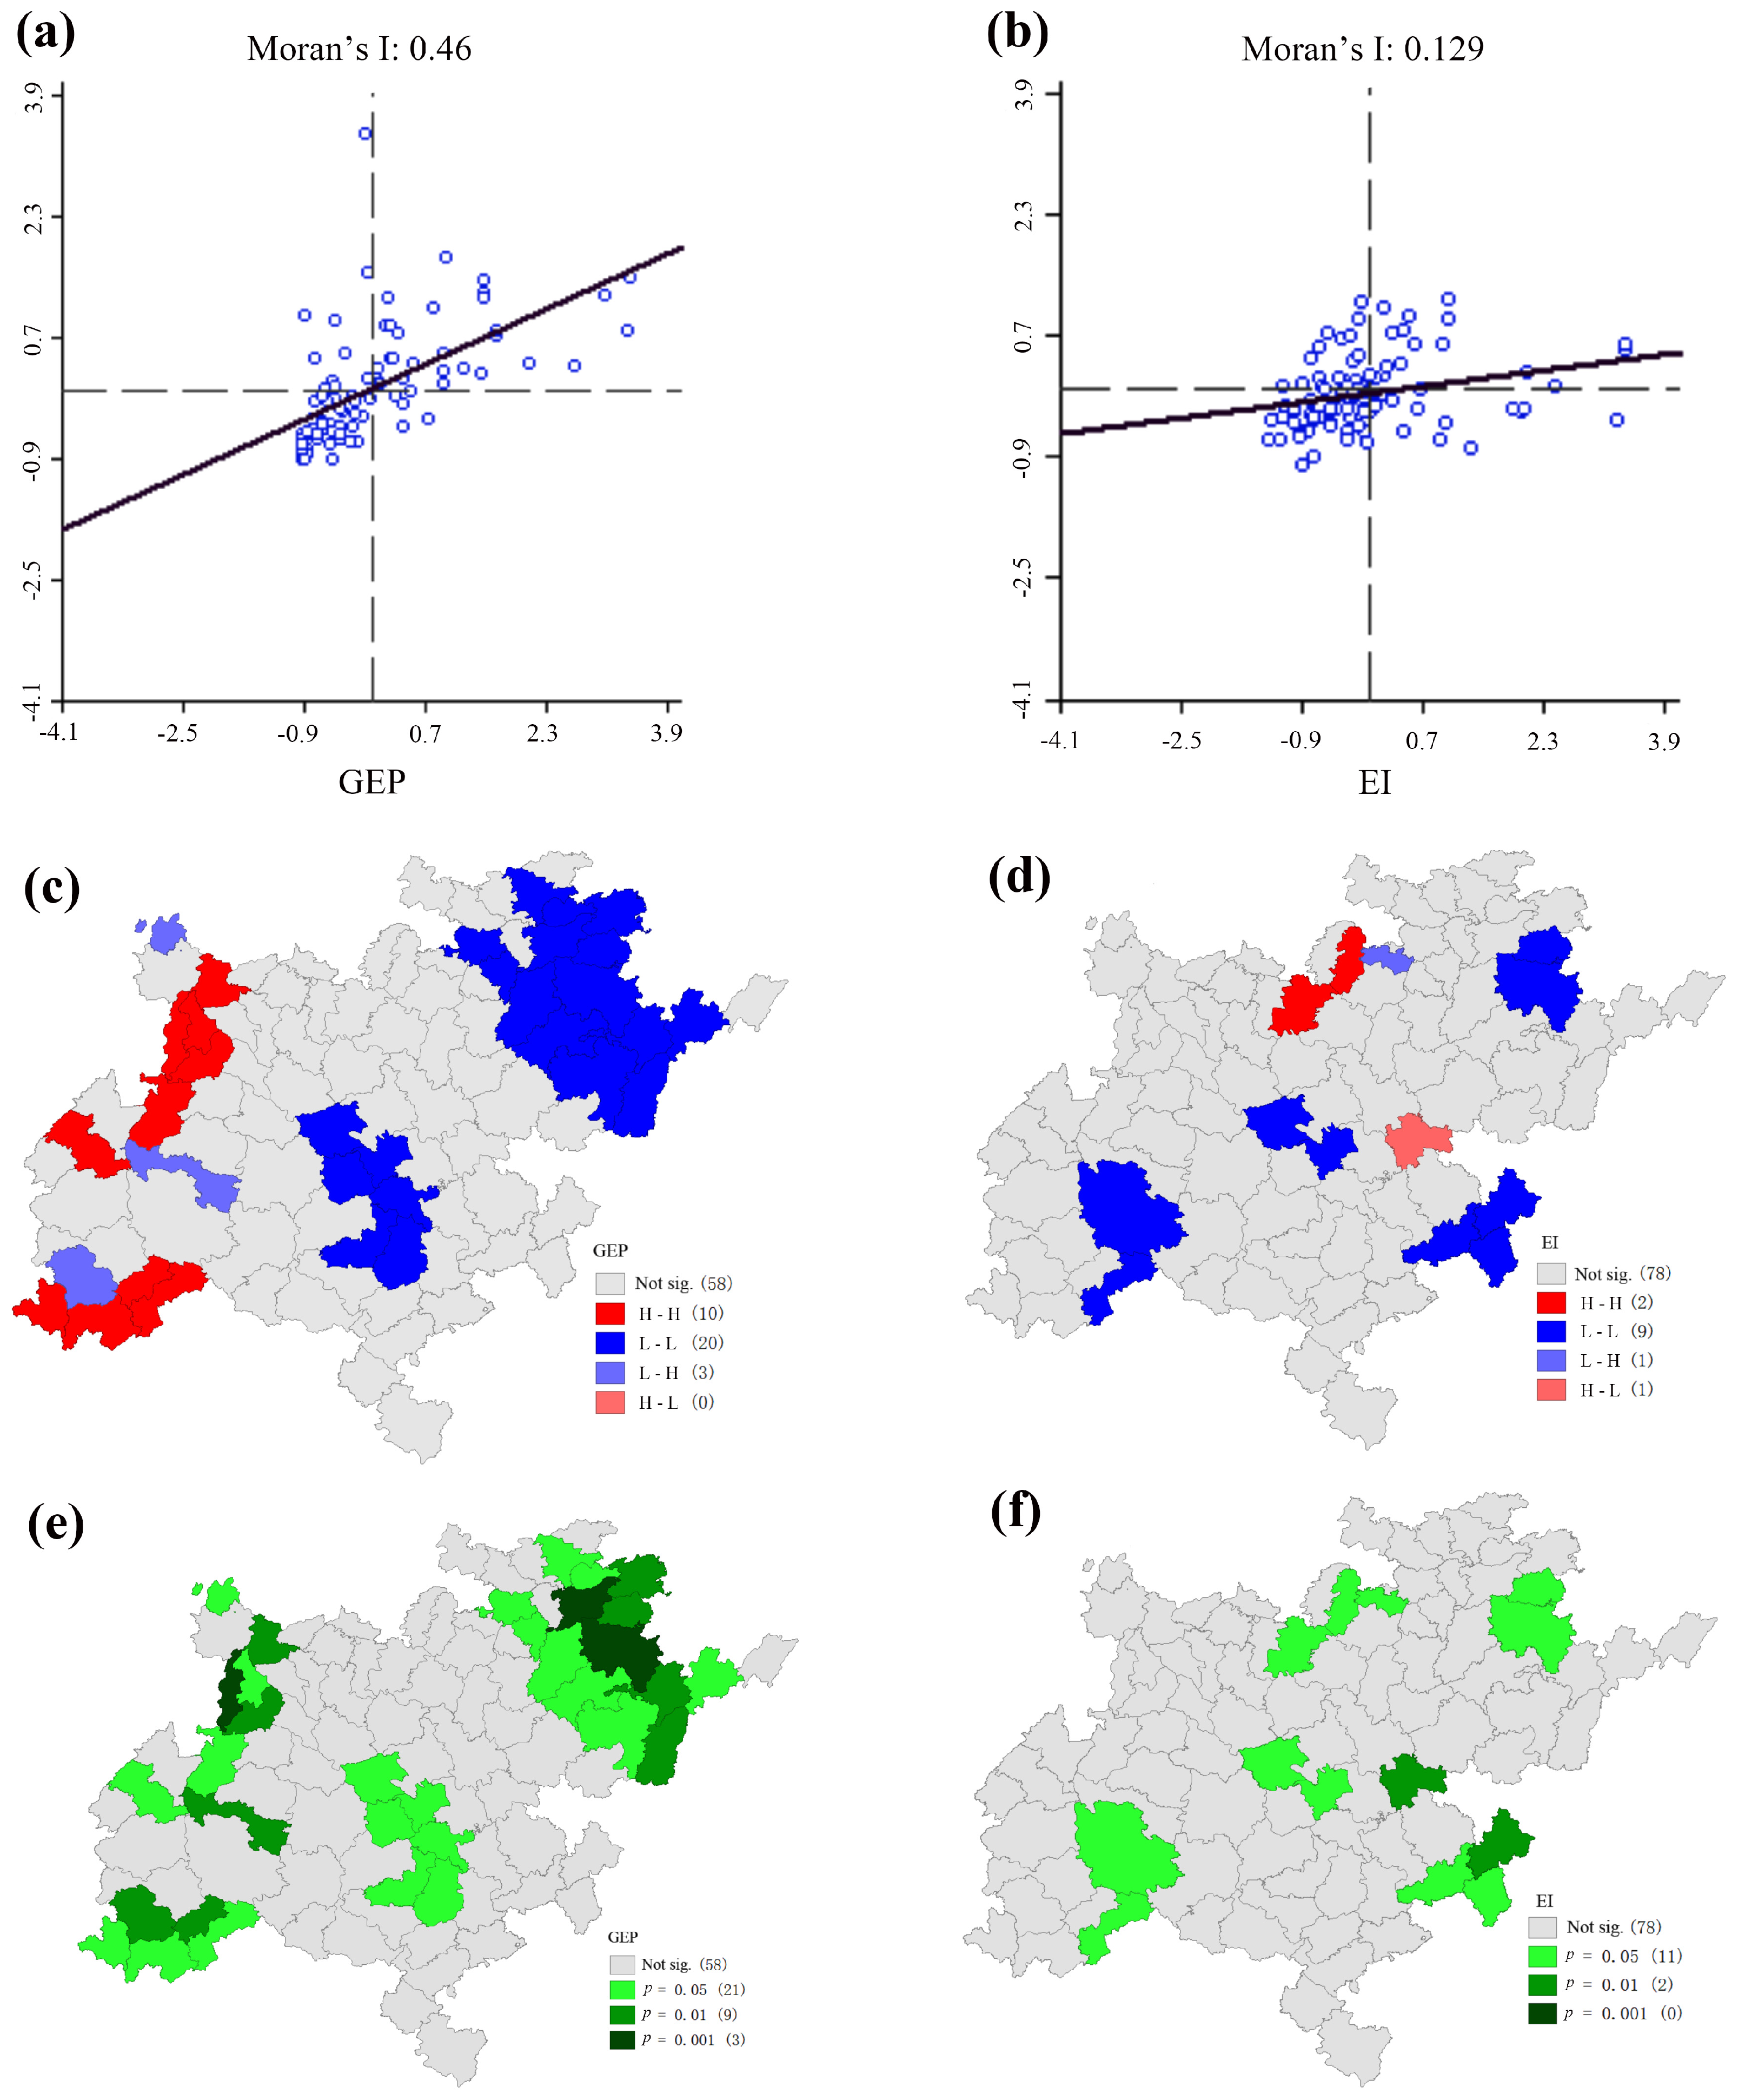
2.3.4. Spatial Autocorrelation Analysis
2.3.5. Indicator Analysis Method
3. Results
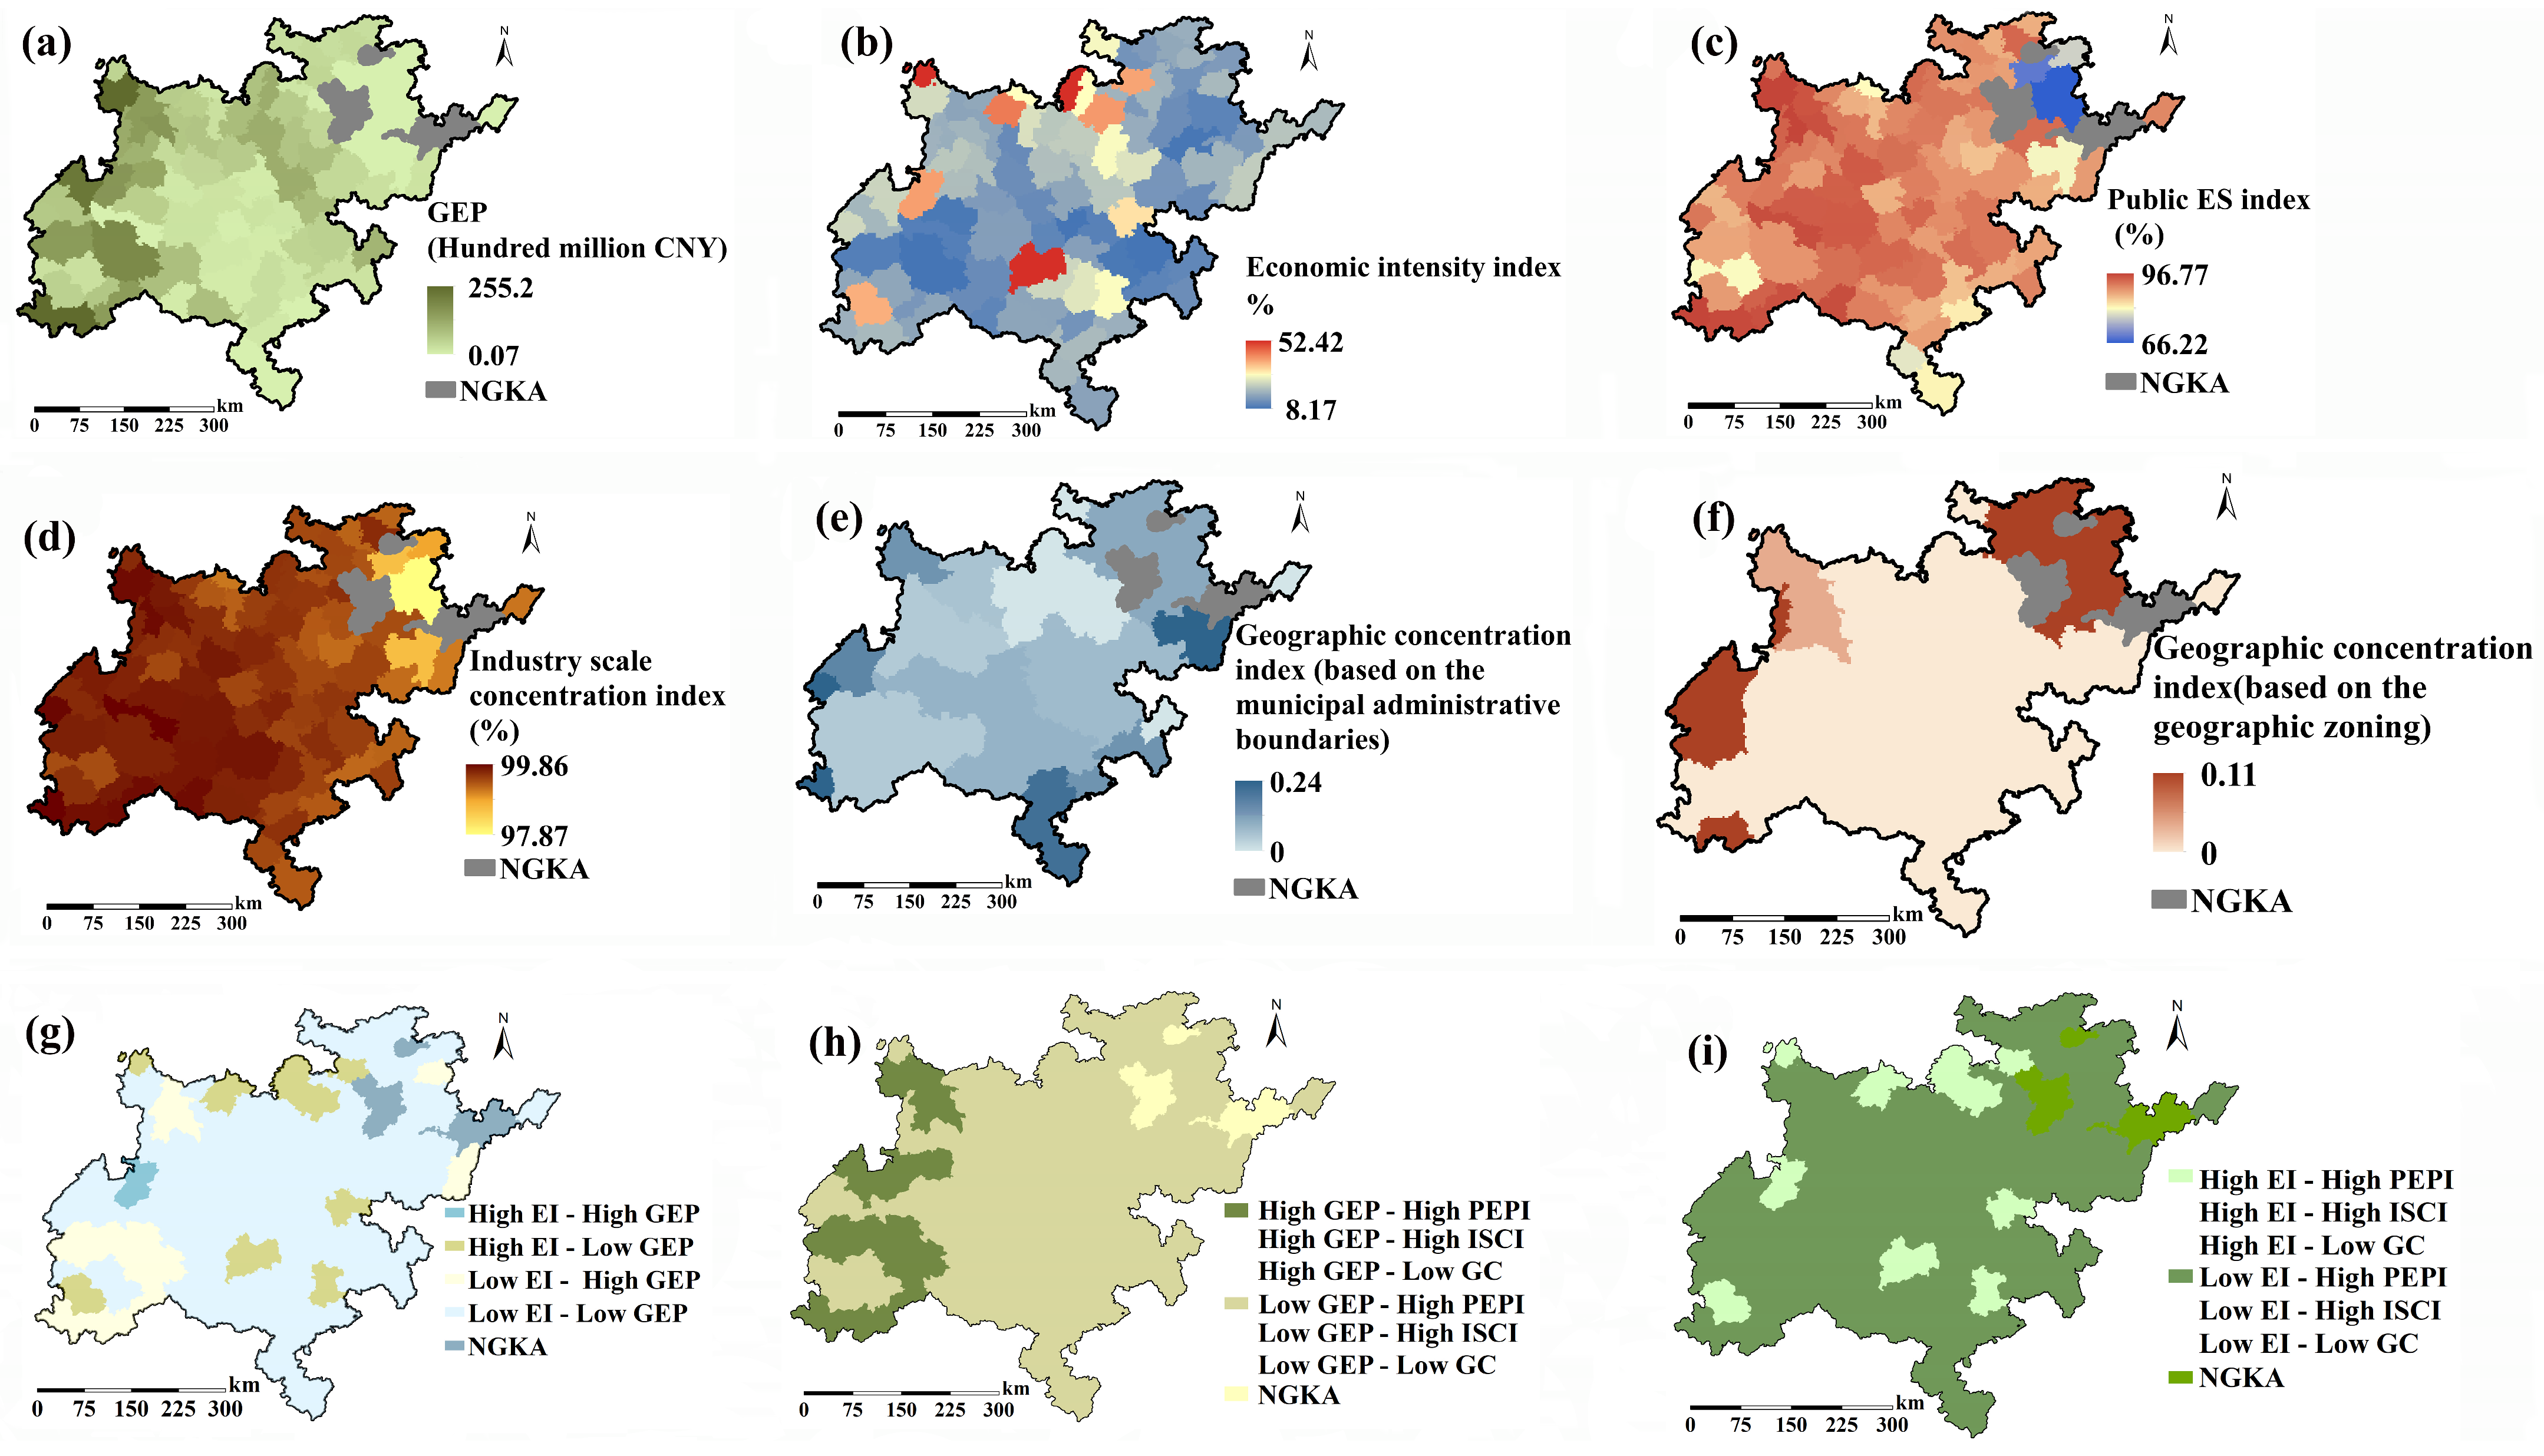
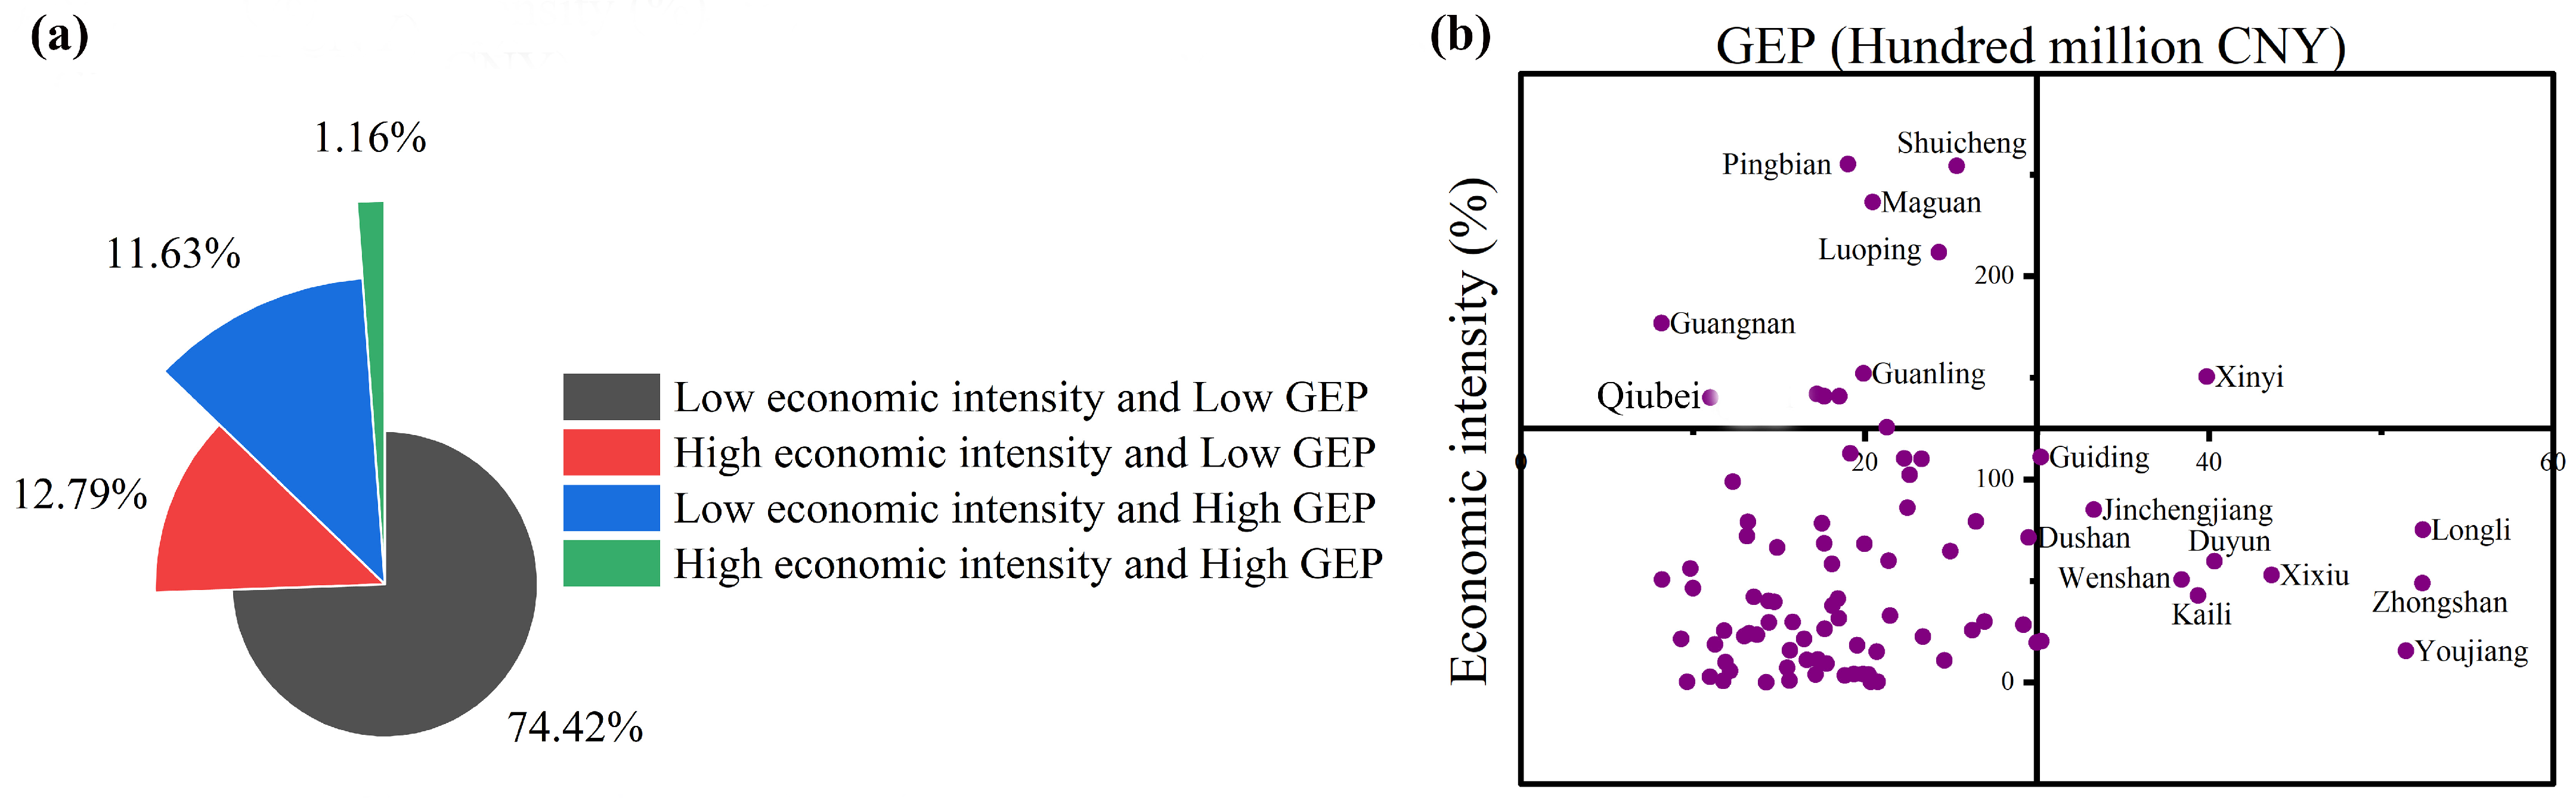
3.1. Spatial Distribution of Grassland GEP and County Economic Intensity in the KDC
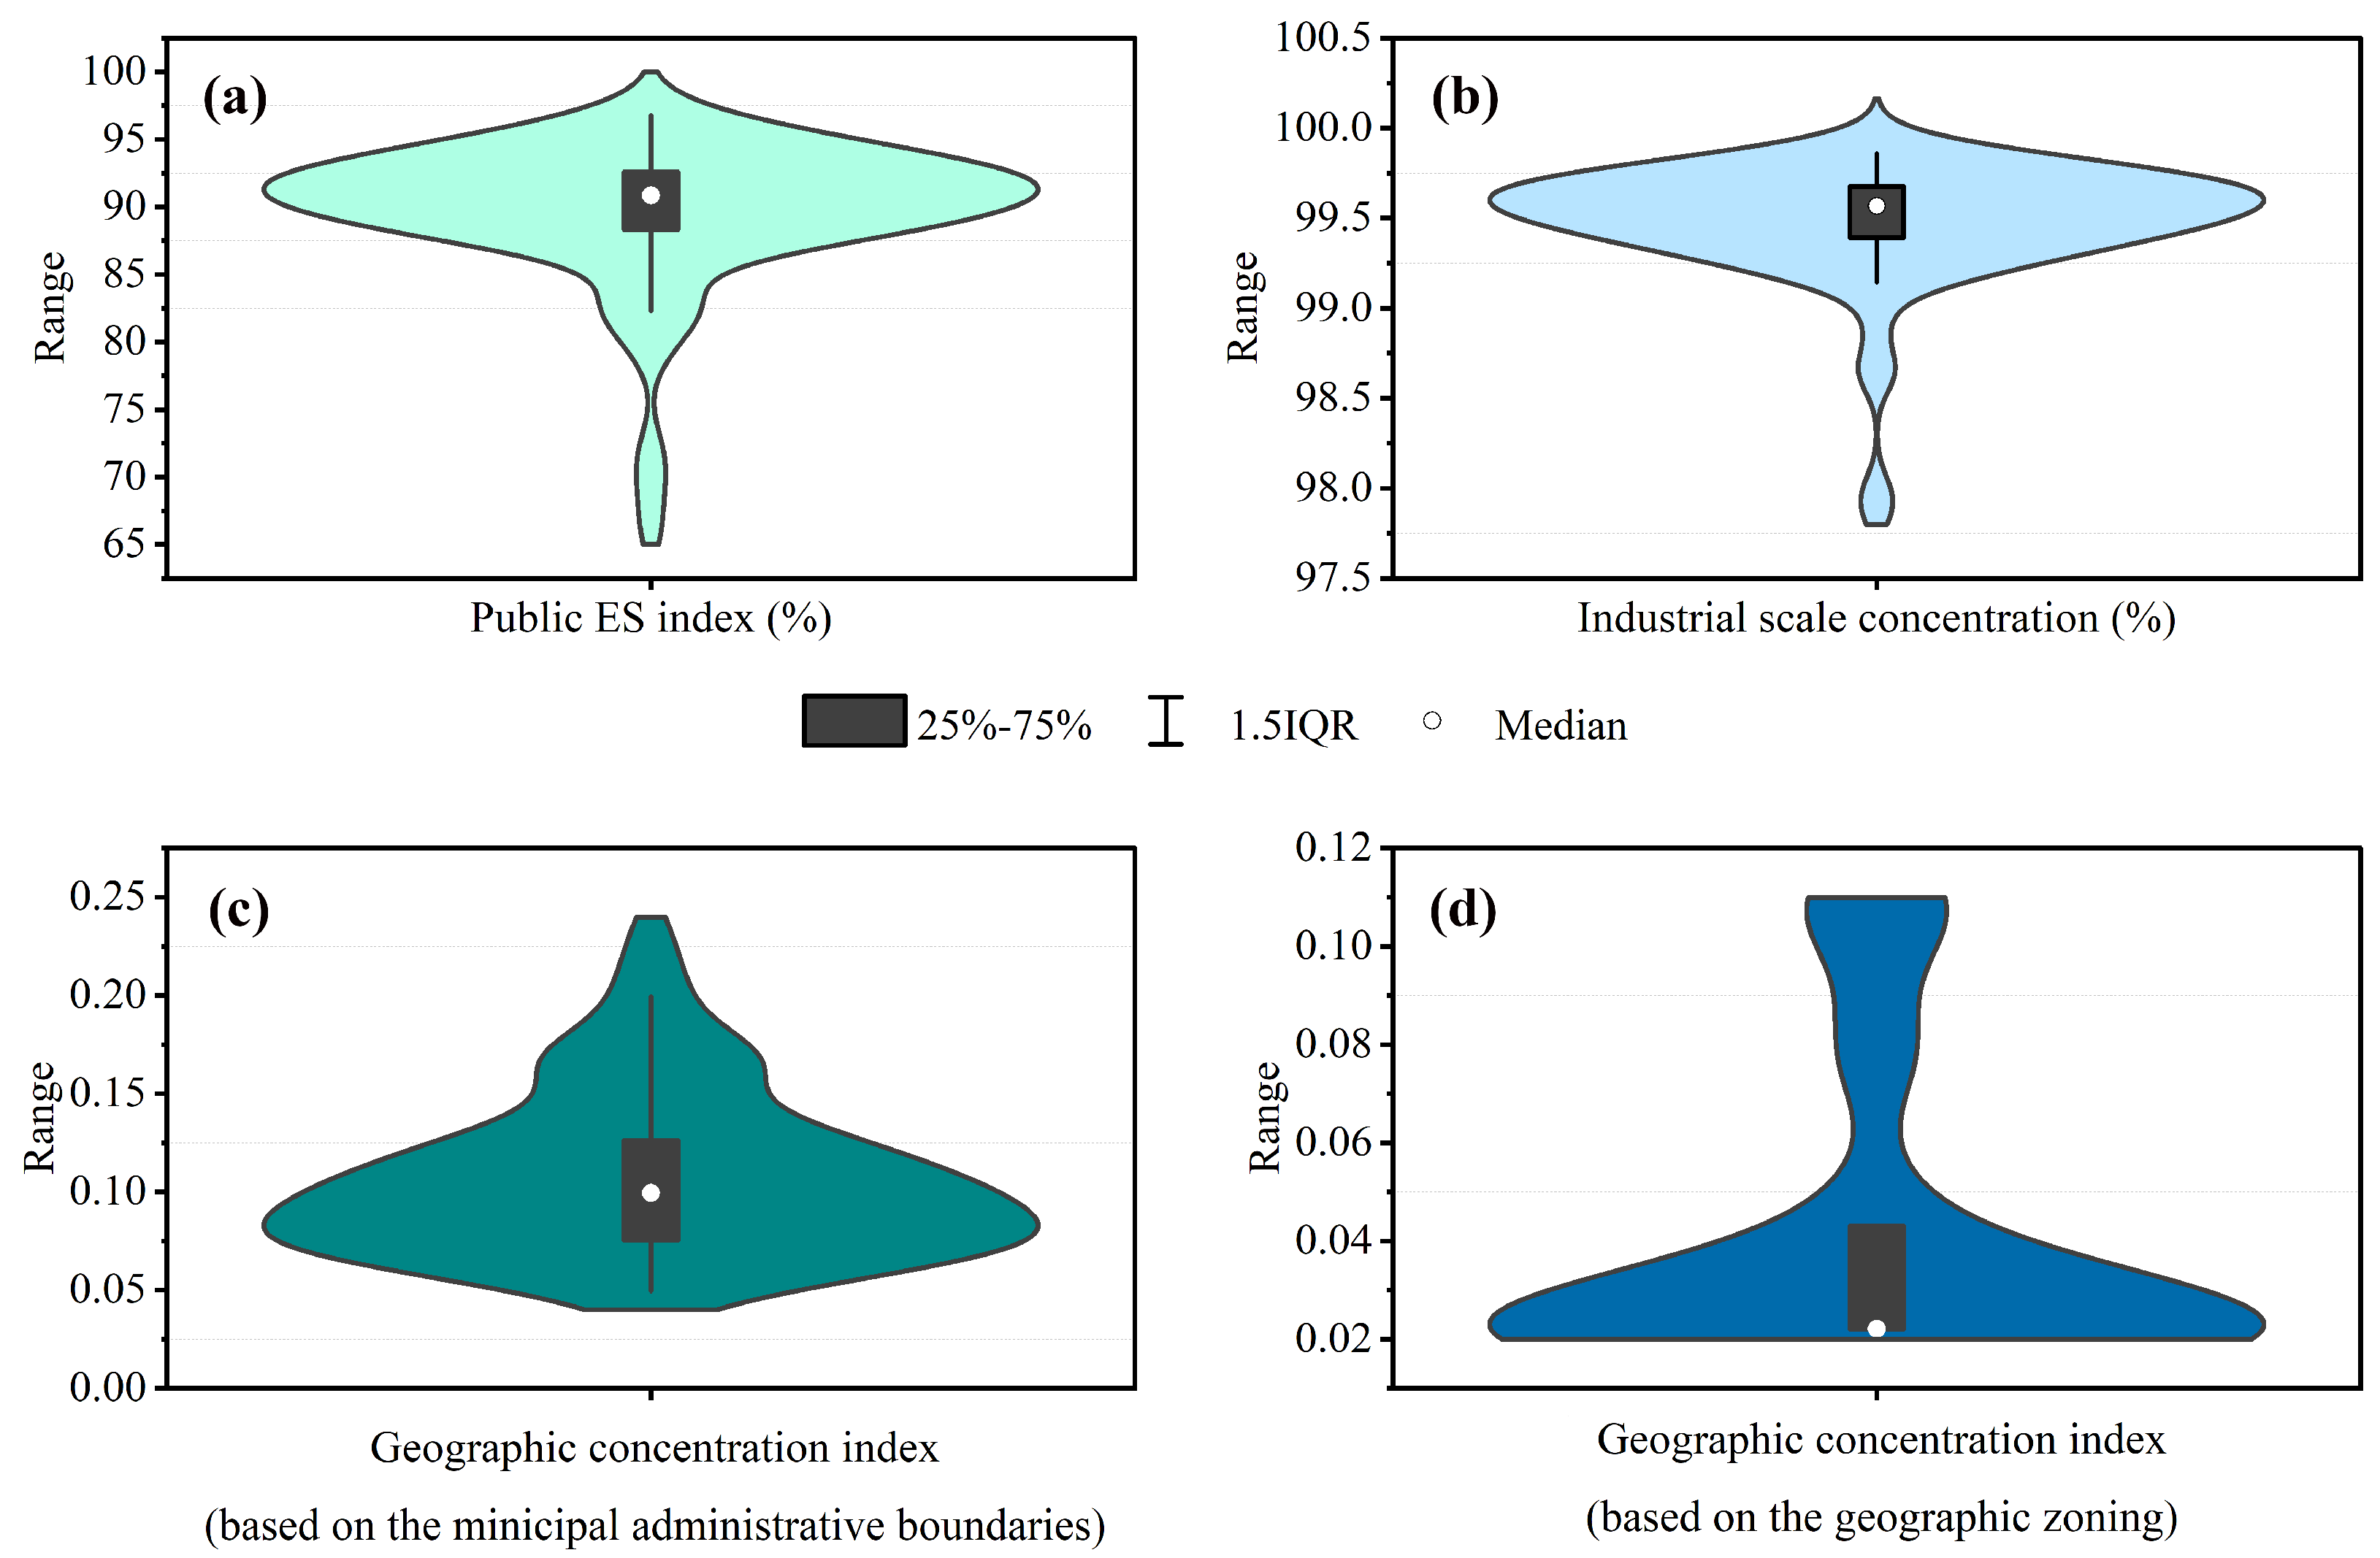
3.2. Structural Characteristics of Grassland GEP in the KDC
3.3. Spatial Characteristics of Grassland GEP in the KDC
4. Discussion
4.1. Spatial Coupling Relationship between Grassland GEP in the KDC and County Economic Intensity
4.2. Industrial Spatial Characteristics of Grassland GEP in the KDC
4.3. Structural Characteristics of the Grassland GEP in the KDC
5. Conclusions
Author Contributions
Funding
Data Availability Statement
Acknowledgments
Conflicts of Interest
Abbreviations
| ES | Ecosystem services |
| KDC | Karst desertification control |
| GEP | gross ecosystem product |
| NGKA | no grassland in the karst area |
| EI | economic intensity |
| PEPI | public eco-product index |
| ISCI | industrial scale concentration index |
| GC | geographical concentration |
References
- White, W.B.; Culver, D.C.; Herman, J.S.; Kane, T.C.; Mylroie, J.E. Karst Lands. The dissolution of carbonate rock produces unique landscapes and poses significant hydrological and environmental concerns. Am. Sci. 1995, 83, 450–459. [Google Scholar]
- Jiang, Z.C.; Lian, Y.Q.; Qin, X.Q. Rocky desertification in Southwest China: Impacts, causes, and restoration. Earth Sci. Rev. 2014, 132, 1–12. [Google Scholar] [CrossRef]
- Sweeting, M.M. Refections on the development of Karst geomorphology in Europe and a comparison with its development in China. Z. Geomorphol. 1993, 37, 127–136. [Google Scholar]
- LeGrand, H.E. Hydrological and ecological problems of karst regions: Hydrological actions on limestone regions cause distinctive ecological problems. Science 1973, 179, 859–864. [Google Scholar] [CrossRef] [PubMed]
- Ford, D.; Williams, P.W. Karst Hydrogeology and Geomorphology; John Willy and Sons: Chichester, UK, 2007; pp. 471–472. [Google Scholar]
- Wang, S.J.; Liu, Q.M.; Zhang, D.F. Karst rocky desertification in southwestern China: Geomorphology, land use, impact and rehabilitation. Land Degrad. Dev. 2004, 15, 115–121. [Google Scholar] [CrossRef]
- Xiong, K.N.; Li, P.; Zhou, Z.F.; An, Y.; Lyu, T.; Lan, A.J. Remote Sensing of Karst Rocky Desertifification—A Typical Research of GIS: Taking Guizhou Province as an Example; Geology Publishing House: Beijing, China, 2002; pp. 17–23. [Google Scholar]
- Yuan, D.X. Rock desertification in the subtropical karst of South China. Z. Geomorphol. 1997, 108, 81–90. [Google Scholar]
- Li, Y.B.; Yu, M.; Zhang, H.; Xie, Y.X. From expansion to shrinkage-exploring the evolution and transition of karst rocky desertification in karst mountainous areas of Southwest China. Land Degrad. Dev. 2022. [Google Scholar] [CrossRef]
- Zuo, T.A.; Zhang, F.T.; Zhang, J.Y.; Gao, L.; Yu, S.J. Rocky desertification poverty in Southwest China: Progress, challenges and enlightenment to rural revitalization. J. Geogr. Sci. 2022, 32, 1357–1382. [Google Scholar] [CrossRef]
- Qi, X.K.; Wang, K.L.; Zhang, C.H. Effectiveness of ecological restoration projects in a karst region of southwest China assessed using vegetation succession mapping. Ecol. Eng. 2013, 54, 245–253. [Google Scholar] [CrossRef]
- Zhu, X.Y.; Zheng, J.H.; An, Y.; Xin, X.P.; Xu, D.W.; Yan, R.R.; Xu, L.J.; Shen, B.B.; Hou, L.L. Grassland ecosystem progress: A review and bibliometric analysis based on research publication over the last three decades. Agronomy 2023, 13, 614. [Google Scholar] [CrossRef]
- Kang, B.Y.; Shao, Q.Y.; Xu, H.K.; Jiang, F.Y.; Wei, X.T.; Shao, X.Q. Research on grassland ecosystem service value in China under climate change based on meta-analysis: A case study of Qinghai province. Int. J. Clim. Chang. Str. 2020, 12, 617–637. [Google Scholar] [CrossRef]
- Qiu, S.J.; Peng, J.; Zheng, H.N.; Xu, Z.H.; Meersmans, J. How can massive ecological restoration programs interplay with social-ecological systems? A review of research in the South China karst region. Sci. Total Environ. 2021, 807, 150723. [Google Scholar] [CrossRef]
- Song, S.Z.; Xiong, K.N.; Chi, Y.K.; Shen, X.Y.; Guo, T.; Lu, N.N. Research progress and prospect of grassland and establishment and ecological animal husbandry in karst rocky desertification area. Fresen. Environ. Bull. 2018, 27, 7017–7030. [Google Scholar]
- Chen, C.; Park, T.; Wang, X.H.; Piao, S.L.; Xu, B.D.; Chaturvedi, R.K.; Fuchs, R.; Brovkin, V.; Ciais, P.; Fensholt, R.; et al. China and India lead in greening of the world through land-use management. Nat. Sustain. 2019, 2, 122–129. [Google Scholar] [CrossRef]
- Qiao, Y.N.; Jiang, Y.J.; Zhang, C.Y. Contribution of karst ecological restoration engineering to vegetation greening in southwest China during recent decade. Ecol. Indic. 2021, 121, 107081. [Google Scholar] [CrossRef]
- Tong, X.W.; Brandt, M.; Yue, Y.M.; Horion, S.; Wang, K.L.; De Keersmaecker, W.; Tian, F.; Schurgers, G.; Xiao, X.M.; Luo, Y.Q.; et al. Increased vegetation growth and carbon stock in China karst via ecological engineering. Nat. Sustain. 2018, 1, 44–50. [Google Scholar] [CrossRef]
- Zhang, J.Y.; Dai, M.H.; Wang, L.C.; Su, W.C. Household livelihood change under the rocky desertification control project in karst areas, Southwest China. Land Use Policy 2016, 56, 8–15. [Google Scholar] [CrossRef]
- Tian, Y.C.; Wang, S.J.; Bai, X.Y.; Luo, G.J.; Xu, Y. Trade-offs among ecosystem services in a typical Karst watershed, SW China. Sci. Total Environ. 2016, 566, 1297–1308. [Google Scholar] [CrossRef]
- Wang, K.L.; Zhang, C.H.; Chen, H.S.; Yue, Y.M.; Zhang, W.; Zhang, M.Y.; Qi, X.K.; Fu, Z.Y. Karst landscapes of China: Patterns, ecosystem processes and services. Landsc. Ecol. 2019, 34, 2743–2763. [Google Scholar] [CrossRef] [Green Version]
- Song, S.Z.; Xiong, K.N.; Chi, Y.K.; He, C.; Fang, J.Z.; He, S.Y. Effect of cultivated pastures on soil bacterial communities in the karst rocky desertification area. Front. Microbiol. 2022, 13, 922989. [Google Scholar] [CrossRef] [PubMed]
- Xiao, D.; Tan, Y.J.; Liu, X.; Yang, R.; Zhang, W.; He, X.Y.; Xu, Z.H.; Wang, K.L. Responses of soil diazotrophs to legume species and density in a karst grassland, southwest China. Agr. Ecosyst. Environ. 2020, 288, 106707. [Google Scholar] [CrossRef]
- Liu, C.C.; Liu, Y.G.; Guo, K.; Qiao, X.G.; Zhao, H.W.; Wang, S.J.; Zhang, L.; Cai, X.L. Effects of nitrogen, phosphorus and potassium addition on the productivity of a karst grassland: Plant functional group and community perspectives. Ecol. Eng. 2018, 117, 84–95. [Google Scholar] [CrossRef]
- Liao, C.J.; Yue, Y.M.; Wang, K.L.; Fensholt, R.; Tong, X.W.; Brandt, M. Ecological restoration enhances ecosystem health in the karst regions of southwest China. Ecol. Indic. 2018, 90, 416–425. [Google Scholar] [CrossRef]
- United Nations Decade on Ecosystem Restoration (2021–2030). Available online: https://undocs.org/A/RES/73/284 (accessed on 28 April 2023).
- Wang, K.L.; Yue, Y.M.; Chen, H.S.; Zeng, F.P. Mechanisms and realization pathways for integration of scientific poverty alleviation and ecosystem services enhancement. Bull. Chin. Acad. Sci. 2020, 35, 1264–1272. [Google Scholar]
- Lang, Y.Q.; Song, W. Quantifying and mapping the responses of selected ecosystem services to projected land use changes. Ecol. Indic. 2019, 102, 186–198. [Google Scholar] [CrossRef]
- Peng, J.; Tian, L.; Zhang, Z.M.; Zhao, Y.; Green, S.M.; Quine, T.A.; Liu, H.Y.; Meersmans, J. Distinguishing the impacts of land use and climate change on ecosystem services in a karst landscape in China. Ecosyst. Serv. 2020, 46, 101199. [Google Scholar] [CrossRef]
- Zhang, M.Y.; Wang, K.L.; Liu, H.Y.; Zhang, C.H.; Yue, Y.M.; Qi, X.K. Effect of ecological engineering projects on ecosystem services in a karst region: A case study of northwest Guangxi, China. J. Clean. Prod. 2018, 183, 831–842. [Google Scholar] [CrossRef]
- Hu, Z.Y.; Wang, S.J.; Bai, X.Y.; Luo, G.J.; Li, Q.; Wu, L.H.; Yang, Y.J.; Tian, S.Q.; Li, C.Y.; Deng, Y.H. Changes in ecosystem service values in karst areas of China. Agr. Ecosyst. Environ. 2020, 301, 107026. [Google Scholar] [CrossRef]
- Wang, Z.J.; Liu, S.J.; Li, J.H.; Pan, C.; Wu, J.L.; Ran, J.; Su, Y. Remarkable improvement of ecosystem service values promoted by land use/land cover changes on the Yungui Plateau of China during 2001–2020. Ecol. Indic. 2022, 142, 109303. [Google Scholar] [CrossRef]
- Zhang, L.L.; Hu, B.Q.; Zhang, Z.; Liang, G.D. Research on the spatiotemporal evolution and mechanism of ecosystem service value in the mountain-river-sea transition zone based on “production-living-ecological space”—Taking the Karst-Beibu Gulf in Southwest Guangxi, China as an example. Ecol. Indic. 2023, 148, 109889. [Google Scholar] [CrossRef]
- Richter, F.; Jan, P.; El Benni, N.; Lüscher, A.; Buchmann, N.; Klaus, V.H. A guide to assess and value ecosystem services of grasslands. Ecosyst. Serv. 2021, 52, 101376. [Google Scholar]
- Cheng, W.; Shen, B.B.; Xin, X.P.; Gu, Q.; Guo, T. Spatiotemporal variations of grassland ecosystem service value and its influencing factors in inner Mongolia, China. Agronomy 2022, 12, 2090. [Google Scholar] [CrossRef]
- Rao, Y.X.; Zhou, M.; Ou, G.L.; Dai, D.Y.; Zhang, L.; Zhang, Z.; Nie, X.; Yang, C. Integrating ecosystem services value for sustainable land-use management in semi-arid region. J. Clean. Prod. 2018, 186, 662–672. [Google Scholar] [CrossRef]
- NDRM (National Development and Reform Commission); NBS (National Bureau of Statistics). Gross Eco-Products Accounting Specification; People’s Publishing House: Beijing, China, 2022; pp. 1–201. [Google Scholar]
- Ouyang, Z.Y.; Song, C.S.; Zheng, H.; Polasky, S.; Xiao, Y.; Bateman, I.J.; Liu, J.G.; Ruckelshaus, M.; Shi, F.Q.; Xiao, Y.; et al. Using gross ecosystem product (GEP) to value nature in decision making. Proc. Natl. Acad. Sci. USA 2020, 117, 14593–14601. [Google Scholar] [CrossRef] [PubMed]
- Du, Y. Harmony with Nature—Exploration and Practice of Comprehensive Management of Karst Desertification; Chinese Forestry Publishing House: Beijing, China, 2011; pp. 333–345. [Google Scholar]
- Thirteenth Five-Year Plan for the Construction of the Comprehensive Management Project of Karst Desertification. Available online: https://www.ndrc.gov.cn/xxgk/zcfb/ghwb/201604/t20160422_962180.html?state=123&code=&state=123 (accessed on 27 April 2023).
- Launch Meeting on Regional Development and Poverty Alleviation in Yunnan-Guangxi-Guizhou Karst Desertification Concentrated Contiguous Area. Available online: http://www.gov.cn/ldhd/2012-06/28/content_2172407.htm (accessed on 28 April 2023).
- Chen, Q.W.; Lu, S.X.; Xiong, K.N.; Zhao, R. Coupling analysis on ecological environment fragility and poverty in South China Karst. Environ. Res. 2021, 201, 111650. [Google Scholar] [CrossRef]
- Shen, X.Y.; Xiong, K.N.; Zhang, J.B.; Zhao, K.; Chi, Y.K. Research on Mineral Nutrition of Forage Plants in Karst Areas of Southern China; China Agricultural Press: Beijing, China, 2021; pp. 8–12. [Google Scholar]
- NDRCPD (National Development and Reform Commission Price Division); NDRCPCSC (National Development and Reform Commission Price Cost Survey Center). National Agricultural Cost-Benefit Information Compendium—2021; China Statistics Press: Beijing, China, 2021; pp. 265–266. [Google Scholar]
- Xu, G.Y.; Xiong, K.N.; Shu, T.; Shi, Y.J.; Chen, L.S.; Zheng, L.L.; Fan, H.X.; Zhao, Z.M.; Yang, Z.H. Bundling evaluating changes in ecosystem service under karst rocky desertification restoration: Projects a case study of Huajiang-Guanling, Guizhou province, Southwest China. Environ. Earth Sci. 2022, 81, 302. [Google Scholar] [CrossRef]
- The Technical Guideline on Gross Ecosystem Product (GEP). Available online: http://www.caep.org.cn/zclm/sthjyjjhszx/zxdt_21932/202010/t20201029_805419.shtml (accessed on 27 April 2023).
- Grassland Ecosystem Service Function Assessment Specification. Available online: https://dbba.sacinfo.org.cn/stdDetail/f3cdabdedc60927fcb42bdf3ab66ec7b996d274a3c88502230d36c273570d6f4 (accessed on 2 April 2023).
- Xie, G.D.; Zhang, C.X.; Zhang, L.M.; Chen, W.H.; Li, S.M. Improvement of the evaluation method for ecosystem service value based on per unit area. J. Nat. Resour. 2015, 30, 1243–1254. [Google Scholar]
- Liu, Y.X.; Fu, B.J.; Wang, S.; Rhodes, J.R.; Li, Y.; Zhao, W.W.; Li, C.J.; Zhou, S.; Wang, C.X. Global assessment of nature’s contribution to people. Sci. Bull. 2023, 68, 424–435. [Google Scholar] [CrossRef]
- Costanza, R.; de Groot, R.; Braat, L.; Kubiszewski, I.; Fioramonti, L.; Sutton, P.; Farber, S.; Grasso, M. Twenty years of ecosystem services: How far have we come and how far do we still need to go? Ecosyst. Serv. 2017, 28, 1–16. [Google Scholar] [CrossRef]
- Daily, G.C.; Ruckelshaus, M. 25 years of valuing ecosystems in decision-making. Nature 2022, 606, 465–466. [Google Scholar] [CrossRef]
- Guerry, A.D.; Polasky, S.; Lubchenco, J.; Chaplin-Kramer, R.; Daily, G.C.; Griffin, R.; Ruckelshaus, M.; Bateman, I.J.; Duraiappah, A.; Elmqvist, T.; et al. Natural capital and ecosystem services informing decisions: From promise to practice. Proc. Natl. Acad. Sci. USA 2015, 112, 7348–7355. [Google Scholar] [CrossRef]
- Díaz, S.; Pascual, U.; Stenseke, M.; Martín-López, B.; Watson, R.T.; Molnár, Z.; Hill, R.; Chan, K.M.A.; Baste, I.A.; Brauman, K.A.; et al. Assessing nature’s contributions to people. Science 2018, 359, 270–272. [Google Scholar] [CrossRef] [Green Version]
- La Notte, A.; D’Amato, D.; Mäkinen, H.; Paracchini, M.L.; Liquete, C.; Egoh, B.; Geneletti, D.; Crossman, N.D. Ecosystem services classification: A systems ecology perspective of the cascade framework. Ecol. Indic. 2017, 74, 392–402. [Google Scholar] [CrossRef]
- Bennett, E.M.; Cramer, W.; Begossi, A.; Cundill, G.; Díaz, S.; Egoh, B.N.; Geijzendorffer, I.R.; Krug, C.B.; Lavorel, S.; Lazos, E.; et al. Linking biodiversity, ecosystem services, and human well-being: Three challenges for designing research for sustainability. Curr. Opin. Env. Sust. 2015, 14, 76–85. [Google Scholar] [CrossRef]
- Daily, G.C.; Matson, P.A. Ecosystem services: From theory to implementation. Proc. Natl. Acad. Sci. USA 2008, 105, 9455–9456. [Google Scholar] [CrossRef] [PubMed]
- Xu, E.Q.; Zhang, H.Q.; Li, M.X. Mining spatial information to investigate the evolution of karst rocky desertification and its human driving forces in Changshun, China. Sci. Total Environ. 2013, 458, 419–426. [Google Scholar] [CrossRef] [PubMed]
- Zhang, S.H.; Xiong, K.N.; Qin, Y.; Min, X.Y.; Xiao, J. Evolution and determinants of ecosystem services: Insights from South China karst. Ecol. Indic. 2021, 133, 108437. [Google Scholar] [CrossRef]
- Bi, X.; Li, B.; Fu, Q.; Fan, Y.; Ma, L.X.; Yang, Z.H.; Nan, B.; Dai, X.H.; Zhang, X.S. Effects of grazing exclusion on the grassland ecosystems of mountain meadows and temperate typical steppe in a mountain-basin system in Central Asia’s arid regions, China. Sci. Total Environ. 2018, 630, 254–263. [Google Scholar] [CrossRef]
- Liu, C.; Siri, M.J.; Li, H.; Ren, C.; Huang, J.; Feng, C.L.; Liu, K.S. Drought is threatening plant growth and soil nutrients of grassland ecosystems: A meta-analysis. Ecol. Evol. 2023, 13, e10092. [Google Scholar] [CrossRef]
- Dong, S.K.; Kassam, K.S.; Tourrand, J.F.; Boone, R.B. Building Resilience of Human-Natural Systems of Pastoralism in the Developing World: Interdisciplinary Perspectives; Springer International Publishing: Cham, Switzerland, 2016; p. 1. [Google Scholar]
- Ren, H.Y.; Eviner, V.T.; Gui, W.Y.; Wilson, G.W.; Cobb, A.B.; Yang, G.W.; Zhang, Y.J.; Hu, S.J.; Bai, Y.F. Livestock grazing regulates ecosystem multifunctionality in semi-arid grassland. Funct. Ecol. 2018, 32, 2790–2800. [Google Scholar] [CrossRef] [Green Version]
- Ganguli, A.C.; O’Rourke, M.E. How vulnerable are rangelands to grazing? Science 2022, 378, 834. [Google Scholar] [CrossRef] [PubMed]
- Yan, X.; Cai, Y.L. Multi-scale anthropogenic driving forces of karst rocky desertification in Southwest China. Land Degrad. Dev. 2015, 26, 193–200. [Google Scholar] [CrossRef]
- Cao, J.H.; Yuan, D.X.; Tong, L.Q.; Azim, M.; Yang, H.; Huang, F. An overview of karst ecosystem in southwest China: Current state and future management. J. Resour. Ecol. 2015, 6, 247–256. [Google Scholar]
- Grime, J.P.; Brown, V.K.; Thompson, K.; Masters, G.J.; Hillier, S.H.; Clarke, I.P.; Askew, A.P.; Corker, D.; Kielty, J.P. The response of two contrasting limestone grasslands to simulated climate change. Science 2000, 289, 762–765. [Google Scholar] [CrossRef] [PubMed]
- Xiao, J.; Xiong, K.N. A review of agroforestry ecosystem services and its enlightenment on the ecosystem improvement of rocky desertification control. Sci. Total Environ. 2022, 852, 158538. [Google Scholar]
- Bátori, Z.; Valkó, O.; Vojtkó, A.; Tölgyesi, C.; Farkas, T.; Frei, K.; Hábenczyus, A.A.; Tóth, Á.; Li, G.; Rádai, Z.; et al. Environmental heterogeneity increases the conservation value of small natural features in karst landscapes. Sci. Total Environ. 2023, 872, 162120. [Google Scholar] [CrossRef] [PubMed]
- Gao, J.B.; Zuo, L.Y.; Liu, W.L. Environmental determinants impacting the spatial heterogeneity of karst ecosystem services in Southwest China. Land Degrad. Dev. 2021, 32, 1718–1731. [Google Scholar] [CrossRef]
- Ren, J.Z. Agro-grassland system is the proper way for the karst area in Southwest China. Pratac. Sci. 2008, 9, 26–30. [Google Scholar]
- Cheng, X.M.; Liu, W.D.; Zhou, J.H.; Wang, Z.Z.; Zhang, S.Q.; Liao, S.X. Extraction of mountain grasslands in Yunnan, China, from sentinel-2 data during the optimal phenological period using feature optimization. Agronomy 2022, 8, 1948. [Google Scholar] [CrossRef]
- Costanza, R.; de Groot, R.; Sutton, P.; van der Ploeg, S.; Anderson, S.J.; Kubiszewski, I.; Farber, S.; de Groot, R.; Brander, L.; van der Ploeg, S.; et al. Global estimates of the value of ecosystems and their services in monetary units. Ecosyst. Serv. 2012, 1, 50–61. [Google Scholar]
- Turner, R.K. Changes in the global value of ecosystem services. Global Environ. Chang. 2014, 26, 152–158. [Google Scholar]
- Gao, X.L.; Xu, W.H.; Hou, Y.; Ouyang, Z.Y. Market-based instruments for ecosystem services: Framework and case study in Lishui City, China. Ecosyst. Health Sustain. 2020, 6, 1835445. [Google Scholar] [CrossRef]
- Liu, H.F.; Hou, L.L.; Kang, N.N.; Nan, Z.B.; Huang, J.K. A meta-regression analysis of the economic value of grassland ecosystem services in China. Ecol. Indic. 2022, 138, 108793. [Google Scholar] [CrossRef]
- DeFries, R.; Nagendra, H. Ecosystem management as a wicked problem. Science 2017, 356, 265–270. [Google Scholar] [CrossRef]
- Gomez-Baggethun, E.; Muradian, R. In markets we trust? Setting the boundaries of Market-Based Instruments in ecosystem services governance. Ecol. Econ. 2015, 117, 217–224. [Google Scholar] [CrossRef]
- Joppa, L.N.; Boyd, J.W.; Duke, C.S.; Hampton, S.; Jackson, S.T.; Jacobs, K.L.; Kassam, K.A.S.; Mooney, H.A.; Ogden, L.A.; Ruckelshaus, M.; et al. Government: Plan for ecosystem services. Science 2016, 351, 1037. [Google Scholar] [CrossRef]
- Adamowicz, W.; Calderon-Etter, L.; Entem, A.; Fenichel, E.P.; Hall, J.S.; Lloyd-Smith, P.; Ogden, F.L.; Regina, J.A.; Rad, M.R.; Stallard, R.F. Assessing ecological infrastructure investments. Proc. Natl. Acad. Sci. USA 2019, 116, 5254–5261. [Google Scholar] [CrossRef] [Green Version]
- Sheng, J.C.; Qiu, W.G.; Han, X. China’s PES-like horizontal eco-compensation program: Combining market-oriented mechanisms and government interventions. Ecosyst. Serv. 2020, 45, 101164. [Google Scholar] [CrossRef]
- Hahn, T.; McDermott, C.; Ituarte-Lima, C.; Schultz, M.; Green, T.; Tuvendal, M. Purposes and degrees of commodification: Economic instruments for biodiversity and ecosystem services need not rely on markets or monetary valuation. Ecosyst. Serv. 2015, 16, 74–82. [Google Scholar] [CrossRef] [Green Version]


| Data | Resolution | Source |
|---|---|---|
| Land Use (grassland) | 30 m | Resource and Environment Science and Data Center, https://www.resdc.cn (accessed on 13 December 2022) |
| Carbonate rocks | 1:500,000 | Karst Science Data Center, Institute of Geochemistry Chinese Academy of Sciences |
| DEM | 30 m | Resource and Environment Science and Data Center, https://www.resdc.cn (accessed on 5 December 2022) |
| Meteorological data | 1 km | (1) National Meteorological Science Data Center, https://data.cma.cn (accessed on 3 December 2022). (2) National Qinghai-Tibet Plateau Scientific Data Center, http://data.tpdc.ac.cn/zh-hans/ (accessed on 15 December 2022). (3) National Earth System Science Data Center, https://www.geodata.cn (accessed on 5 December 2022). |
| Soil | 1 km | Harmonized World Soil Database (HWSD) http://www.ncdc.ac.cn/portal/metadata/fcd60332-575c-4209-ae9c-d1efc1f424d4 (accessed on 5 December 2022) |
| NPP | 1 km | Resource and Environment Science and Data Center, https://www.resdc.cn (accessed on 5 December 2022) |
| Administrative Boundaries | -- | Resource and Environment Science and Data Center, https://www.resdc.cn (accessed on 5 December 2022) |
| Road network data | 1 km | Geographic remote sensing ecological network platform, www.gisrs.cn (accessed on 7 May 2023) |
| Demographic and socioeconomic data | -- | (1) Statistical Yearbook (Province, City, County, District); (2) Government Statistical Bulletin of National Economic and Social Development (County, District); (3) Annual Government Work Report (County, District); (4) Seventh National Census Bulletin (China); (5) Missing Data: Obtained by the linear interpolation method. Prioritization hierarchy of the same indicator acquisition: (1) > (2) > (3) > (5) |
| Nighttime light | 0.44 km | National earth system science data center, https://www.resdc.cn (accessed on 8 December 2022) |
| Number | Indicators | Unit | Weight |
|---|---|---|---|
| X1 | Economic density | 10,000 CNY/km2 | 0.1057 |
| X2 | Per capita GDP | CNY/capita | 0.0317 |
| X3 | The proportion of the output value of secondary and tertiary industries in GDP | % | 0.0200 |
| X4 | Local general public budget revenue per capita | CNY/capita | 0.0743 |
| X5 | General public budget expenditure per capita | CNY/capita | 0.0228 |
| X6 | Per capita household savings deposit balance | CNY/capita | 0.0465 |
| X7 | Per capita year-end loan balances of financial institutions | CNY/capita | 0.0698 |
| X8 | Number of industrial enterprises above designated size per 10,000 people | Num/10,000 capita | 0.0952 |
| X9 | Number of fixed-line telephone users per 100 people | Households/100 capita | 0.0601 |
| X10 | Urbanization rate | % | 0.0407 |
| X11 | Per capita total retail sales of consumer goods | CNY/capita | 0.0619 |
| X12 | Per capita disposable income of urban households | CNY/capita | 0.0253 |
| X13 | Per capita disposable income of rural households | CNY/capita | 0.0658 |
| X14 | Nighttime light index | -- | 0.0394 |
| X15 | Highway density | Km/km2 | 0.2406 |
| Indicators | Mean | Variation Range | Median | Skewness | Kurtosis |
|---|---|---|---|---|---|
| GEP (0.1 billion CNY) | 58.12 | 255.13 | 39.84 | 1.58 | 2.37 |
| County economic intensity (%) | 20.74 | 44.24 | 18.49 | 1.58 | 2.64 |
| Public eco-product index (%) | 89.83 | 30.55 | 90.86 | −2.36 | 7.32 |
| Industrial scale concentration index (%) | 99.48 | 1.99 | 99.56 | −2.73 | 10.03 |
| Geographical concentration (based on the municipal administrative boundaries) | 0.069 | 0.24 | 0.06 | 1.41 | 1.56 |
| Geographical concentration (based on the geographic zoning) | 0.037 | 0.11 | 0.03 | 2.68 | 0.81 |
Disclaimer/Publisher’s Note: The statements, opinions and data contained in all publications are solely those of the individual author(s) and contributor(s) and not of MDPI and/or the editor(s). MDPI and/or the editor(s) disclaim responsibility for any injury to people or property resulting from any ideas, methods, instructions or products referred to in the content. |
© 2023 by the authors. Licensee MDPI, Basel, Switzerland. This article is an open access article distributed under the terms and conditions of the Creative Commons Attribution (CC BY) license (https://creativecommons.org/licenses/by/4.0/).
Share and Cite
Li, Y.; Xiong, K.; Zhang, W.; Song, S.; Luo, L. Analyzing Characteristics of Grassland Gross Ecosystem Product to Inform Decision Making in the Karst Desertification Control. Agronomy 2023, 13, 1861. https://doi.org/10.3390/agronomy13071861
Li Y, Xiong K, Zhang W, Song S, Luo L. Analyzing Characteristics of Grassland Gross Ecosystem Product to Inform Decision Making in the Karst Desertification Control. Agronomy. 2023; 13(7):1861. https://doi.org/10.3390/agronomy13071861
Chicago/Turabian StyleLi, Yongyao, Kangning Xiong, Wenfang Zhang, Shuzhen Song, and Lu Luo. 2023. "Analyzing Characteristics of Grassland Gross Ecosystem Product to Inform Decision Making in the Karst Desertification Control" Agronomy 13, no. 7: 1861. https://doi.org/10.3390/agronomy13071861