Article

Tillage Crop Establishment and Irrigation Methods Improve the Productivity of Wheat (Triticum aestivum): Water Use Studies, and the Biological Properties and Fertility Status of Soil

1
M. S. Swaminathan School of Agriculture, Shoolini University of Biotechnology & Management Sciences Solan, Solan 508976, Himachal Pradesh, India
2
Department of Agronomy, Sardar Vallabhbhai Patel University of Agriculture & Technology, Meerut 250110, Uttar Pradesh, India
3
Krishi Vigyan Kendra Amritsar, Punjab Agricultural University, Amritsar 143601, Punjab, India
4
AICRP on Integrated Farming System, Professor Jayashankar Telangana State Agricultural University, Hyderabad 500030, Telangana, India
5
Department of Agronomy, CSSS PG College, Machhra, Chaudhary Charan Singh University, Meerut 250001, Uttar Pradesh, India
6
Department of Botany and Microbiology, College of Science, King Saud University, Riyadh 11451, Saudi Arabia
7
Department of Plant Physiology, Institute of Biology, Warsaw University of Life Sciences SGGW, 159 Nowoursynowska 159, 02-776 Warsaw, Poland
*
Author to whom correspondence should be addressed.
Agronomy 2023, 13(7), 1839; https://doi.org/10.3390/agronomy13071839
Submission received: 15 June 2023 / Revised: 9 July 2023 / Accepted: 9 July 2023 / Published: 12 July 2023
(This article belongs to the Special Issue The Role of Mineral Elements in the Crop Growth and Production)

Abstract

:
The Crop Research Centre of Sardar Vallabhbhai Patel University of Agriculture and Technology in Meerut (U.P.), India, conducted field experiments in a randomised block design, comprising three replicates, one late sown variety (DBW-90), and eight treatments, viz.: T1 was a conventional flood irrigation (CFI); T2, furrow irrigated with gated-pipe raised beds (FIGPRB); T3, all furrow irrigation (AFI); T4, alternate furrow irrigation (Alt. FI); T5, wide bed furrow irrigation (WBFI); T6, skip furrow irrigated (SFI); T7, Sprinkler irrigation (SI); and T8, Zero-till flat-irrigated using gated pipe/controlled-flood irrigation (ZTFIGP). These field experiments were conducted during the Rabi seasons of 2017–2018 and 2018–2019. The purpose of this study was to evaluate the yield, water productivity, and soil health under different tillage crop establishment methods. Test weight, spike length, and productive tillers were all considerably enhanced in treatment T5, with the treatment’s statistical significance being similar to that of treatments T8 and T2. Treatment T5 considerably outperformed the other treatments in terms of grain yield, straw yield, biological yield (44.32, 61.88, and 106.19 q ha−1, respectively), as well as harvest index (41.73). Thirty to sixty centimetres of soil were mined for the most water, followed by fifteen to thirty centimetres, zero to fifteen centimetres, and sixty to ninety centimetres. Both water-use efficiency (2.86 q ha−1 cm) and water productivity (1.91 kg cm−3) were highest under T7 (Sprinkler irrigation). The maximum total NPK (113.69; 27.45; 127.33 kg ha−1) was found in crops grown with wide bed furrow irrigation. The data also showed that treatment T6 (skip furrow irrigated) had the highest levels of accessible NPK in soil, followed closely by treatment T4 (alternate furrow irrigated). Treatment T8 (zero-till flat-irrigated using gated-pipe/controlled flood irrigation) had the highest bacterial, fungal, and actinomycete populations, followed by T5 (wide bed furrow irrigated) and T2 (furrow irrigated with gated-pipe/elevated bed). Our research showed that there may be more options for maintaining wheat crop water productivity and soil health under different agroecological conditions, including crop productivity, conservation tillage-based establishing methods, and irrigation regimes.

1. Introduction

Wheat (Triticum aestivum L.) can grow in a wide range of climates and soil types, from sandy loam to heavy black cotton, making it India’s principal grain crop. Wheat may be grown at any altitude between sea level and 3658 m in the Himalayas, and from 11 degrees North latitude to 30 degrees North latitude. From the wet soils of the deltaic coastal areas to the dry soils of Rajasthan, it is cultivated in a wide range of environments and soil types [1]. Wheat is a healthy option because it is a rich source of carbohydrates, protein, and fat. Thiamine, niacin, iron, riboflavin, calcium, and fibre are just some of the minerals it has in abundance. India’s most extensively cultivated crop, wheat, feeds 35% of the world’s population. About 215.5 million hectares are used for wheat production worldwide, leading to a harvest of 764.5 million metric tons and a productivity of 3.39 t per ha−1 [2]. India cultivates wheat on 29.65 million hectares of land, with a yearly production of 99.9 million metric tons (at a productivity of 3371 kg per hectare) [2]. About a third of the world’s food grain supply comes from wheat. With 1.35 billion inhabitants, India is only slightly less populous than China (1.41 billion). In about seven years, it will have surpassed China’s population and is expected to peak at roughly 1.7 billion by 2050. Therefore, wheat will probably continue to play a crucial role in reaching this. The ever-increasing human population makes steady wheat production a need.
It is crucial that agricultural water management be factored into irrigation schedules, as more than a third of the world’s population will face absolute water scarcity by 2025 [3]. Global wheat output has to grow by 1.6% to 2.6% per year to meet demand, and this growth may be accomplished mostly through enhanced input utilisation efficiency. The Indo-Gangetic Plains are experiencing a rate of groundwater loss that ranges from 13 to 17 km3 on an annual basis [4]. Two primary crop management practices can be implemented to increase the efficiency with which wheat inputs are used. Today, 70% of the world’s freshwater is utilised in agriculture, although only 40% of the world’s food is grown in irrigated soils. Aquifer water is used for about 10% of irrigation, which is an excessive and unsustainable amount [5]. It is generally agreed that adjusting irrigation systems for maximum efficiency saves water and improves crop yields and quality. Sprinkler irrigation should be implemented to minimise water loss, enhance water-use efficiency, and increase agricultural water yield. This method allows for the accurately application water during the presowing and subsequent watering stages. New hydro-physical features of the soil can be strongly influenced using soil tillage. As of late, there has been a lot of buzz about conservation tillage (sometimes known as “zero tillage”) and the assertions that it invariably improves soil properties for plant development and water retention. Management strategies that prioritise resource conservation are gaining favour in the rice–wheat cropping system. This approach improves soil organic matter, moisture availability, aggregation, and water transmission capacity [3].
To improve the soil’s microbial population, conservation agriculture practises such as zero tillage are preferable under a rice–wheat cropping system from both an economic and ecological standpoint. Zero-till farming has gained popularity among farmers in recent years [6,7] due to its ability to increase crop yields while reducing soil disturbance and protecting soil carbon. Conventional tillage methods are important to India’s farming tradition and have made substantial contributions to India’s food security. Before planting crops, CT entails a number of procedures, such as clearing the land of residue (either by removing it or by burning it) plough tillage (PT), harrowing, and levelling the ground. CT’s effect on the soil’s physicochemical and biological properties can have an effect on soil production and longevity [8]. Long-term mechanical disturbances of soil, such as those induced by inversion tillage or severe CT throughout the entire crop growing season, can lead to soil erosion and mycelium network damage [9]. Conventional tillage practices, such as improper straw management, can reduce soil organic carbon (SOC) storage and endanger sustainable crop production [10]. Higher C stocks in agricultural soils can be produced by returning crop residue to the soil [11], which is a key indicator of the soil’s environmental quality, and agronomic sustainability [12]. In comparison to the traditional tillage system, the rice–wheat cropping system with zero tillage had a much greater population of bacteria, fungus, actinomycetes, microbial-C, microbial-N, and SOC sequestration. Avoiding tillage can have an impact on crop productivity and, by extension, food security [13]. Therefore, methods of soil and crop management that increase organic carbon and microbial biomass carbon (while keeping yields constant) are of importance. Soil microbial biomass variations as a result of changes in soil management and environmental stresses are indicative of changes in the chemical and physical properties of agricultural ecosystems. Since the soil microbiome is responsible for supplying nutrients to plants, it regulates the availability and production of nutrients in agroecosystems. The capacity of an ecosystem to sequester the carbon fixed during photosynthesis in soil organic matter is related to its net primary output [14]. Since appropriate irrigation practises improve soil health and maximise water consumption without reducing output, they are vital for wheat production, and must be implemented by farmers. Due to the diminishing ground water level caused by improper usage and over-extraction from the ground, this study on tillage crop establishment and irrigation methods in wheat was undertaken, as we know water is the most vital natural resource for humans, animals, and the production of food-producing crops. In light of these facts, wheat (Triticum aestivum) productivity, water use efficiency, nutrient uptake, and soil health in sandy loam soils in western Uttar Pradesh, India were investigated as a result of this interest by researchers at the SVPUA&T in Meerut, U.P.

2. Materials and Methods

2.1. Selected Site

The study’s research was conducted at the Crop Research Centre of the Sardar Vallabhbhai Patel University of Agriculture and Technology in Meerut, Uttar Pradesh (U.P.). Based in the centre of western Uttar Pradesh, Meerut has a subtropical climate and is 237 m above mean sea level. Its coordinates are 29°08′ N latitude and 77°41′ E longitude. The trial field was completely level, and it had well-developed irrigation and drainage systems already in place. The experimental soil was sandy loam in texture, low in available nitrogen and organic carbon, with a medium level of available phosphorus and potassium, while being alkaline in reaction.

2.2. Climate and Weather Condition

This area experiences a semiarid, subtropical climate, with extremely hot summers and freezing winters. In the first year of the study, 2017–2018, the minimum mean temperature was recorded in the month of January 2018 at 4.80 °C (Figure 1A), and in the second year, 2018–2019, it was recorded in the month of December 2018 at 2.90 °C (Figure 1B). During both research years, the month of April saw the mean maximum temperature. During the crop seasons of 2018 and 2019, the mean relative humidity was found to be at its highest points in the months of January (95.7 and 96.7%, respectively) and its lowest points in the months of December (30.3 and 38.9%, respectively). In the first year of the experiment, the minimum evapotranspiration throughout the crop period was 1.7 mm in the month of December, and 1.3 mm in the month of January. In total, the crop years 2017–2018 and 2018–2019 saw rainfall totals of 20.5 and 127.5 mm, respectively (Figure 1A,B).

2.3. Treatments Description

In total, there were nine different treatments, eight of which were different combinations of irrigation and tillage practises, and the ninth was a late-planted variety that was given the name DBW-90. The following treatments were utilised: T1, conventional flood irrigation (CFI); T2, furrow irrigated with gated-pipe raised beds (FIGPRB); T3, all furrow irrigation (AFI); T4, alternate furrow irrigation (Alt. FI); T5, wide bed furrow irrigation (WBFI); T6, skip furrow; T7, Sprinkler irrigation (SI); and T8, Zero-till flat-irrigated using gated pipe/controlled flood irrigation (ZTFIGP). A randomised block design (RBD) with three independent replications was used to conduct controlled flood irrigation (ZTFIGP) over the 2017–2018 and 2018–2019 growing seasons.

2.4. Cultural Practices

Wheat was planted using a seed drill equipped with a dry fertiliser attachment in rows 20 cm apart, after presowing irrigation and a CT method comprising two harrowings, three ploughings (using a cultivator), and then planking. Raised beds were constructed utilising a tractor-drawn multicrop raised bed planter outfitted with inclined plate seed metering systems while using furrow-irrigated raised-bed tillage (FIRB). Narrow beds were 40 cm wide, while broad beds were 100 cm wide. Irrigated furrows were 12 cm high and 30 cm wide at the top, and a 70 cm spacing was kept between the centres of neighbouring furrows. Wheat was planted in a staggered pattern of three rows per raised bed. The crops were planted utilising the ZT method, which involves minimal tilling of the ground, and the zero-till seed drill was utilised to achieve this. With this implement, farmers could sow seeds directly into narrow slots in the ground that were only a few millimetres wide, and four to seven cm deep.

2.5. Management of Fertilisers and Crops

All of the fields were fertilised with the proper ratio of nitrogen to phosphorus to potassium (150:60:60 kg ha−1), in order to achieve optimal crop yield. At the time of planting, a full dose of phosphorus and potassium (as well as half the recommended dose of nitrogen) were applied using a seed-cum-fertiliser drill. Urea, DAP, and MOP were used together as a source of N, P, and K. The rest of the nitrogen was applied along with the urea at 25 and then at 55 days following planting. The herbicide Sulfosulfuron (postemergence) at 33.3 g a.i. per ha−1 was applied to the standing crop at 30 days, and then one round of hand weeding was performed at 45 days to control the weed population. The soil used in the experiment was a sandy loam with medium levels of accessible phosphorus and potassium and a mildly alkaline pH.

2.6. Yield Attributing Characters and Yield (q ha−1)

For each net plot, we calculated the number of effective tillers per metre of row length in a random sample of marked rows, and then translated the results to m2. The average length of each spike was determined by measuring ten spikes at random from each plot. Ten separate spikes were counted to provide an average for the number of grains per spike. By isolating the grains from the spikelets, the density of grains per unit of spikelet area could be calculated. The number of grains in a composite sample obtained from the harvest of each plot was counted using an automatic seed counter, and the weight of 1000 grains was reported in grammes.
The biological harvest from the whole net area of each plot was collected using miniature plot threshers. After harvesting the net plot area, wheat bundles were sun-dried for four days, and their final weights were converted to kilogrammes per hectare (ha) in order to calculate the biological yield (q ha−1). Straw yield (in q ha−1) was determined by subtracting the biological yield per net plot area from the grain yield. Grain yields were originally recorded in kilogrammes per hectare for the net plot area, but were converted to kilogrammes per hectare after being normalised to 14% moisture. The harvest index was determined by dividing the economic yield by the biological yield and then expressing the result as a percentage.
H a r v e s t   i n d e x ( % ) = E c o n o m i c   y i e l d B i o l o g i c a l   y i e l d × 100

2.7. Water Use Studies

2.7.1. Consumptive Use of Water

The consumptive use was worked out from the loss in soil moisture, effective rainfall, and potential evapotranspiration for 2 days following irrigation. The seasonal consumptive use was calculated using the formula given below.
U = i n E o × 0.8 + ( M 1 M 2 ) + E R

2.7.2. Water-Use Efficiency (WUE)

The economic yield (kg ha−1) was divided by the total amount of water used (cm) from the relevant plots to calculate the water-use efficiency (WUE) of various treatments.
W U E = E c o n o m i c   y i e l d   ( k g   h a 1 ) T o t a l   c o n s u m p t i v e   u s e   o f   w a t e r   ( c m ) k g   h a 1 c m 1

2.7.3. Water Productivity (WP)

By dividing the economic yield (kg ha−1) by the depth of irrigation water applied (cm) from separate plots, the WP of various treatments was calculated. It is expressed in kg m−3.
W P = E c o n o m i c   y i e l d   ( k g   h a 1 ) A m o u n t   o f   w a t e r   a p p l i e d   ( c m )   k g   m 3

2.8. Plant Analysis

Nutrient concentrations in harvested grains and straw were examined and computed separately from estimates from selected plants in each plot. To evaluate dry matter production (i.e., grains and straw), representative samples of plants were dried in a hot air oven at 60 °C after harvest.
Dried samples were pulverised in a Wiley mill and kept in polythene bags for further examination.

2.8.1. Nutrient Uptake (kg ha−1)

In order to calculate nutrient uptake, we multiplied the grain yield and straw yield by the percentage of each nutrient they contained.
Nutrient uptake (kg ha−1) = Content (%) in grains/straw × grains/straw yield
Total uptake (kg ha−1) = Uptake from grains + nutrient uptake from straw

2.8.2. Nutrient Harvest Index (NHI)

Nutrient harvest index (NHI) is the ratio of nutrient uptake in economic part of the crop plants to the total nutrient uptake in biological part of the crop plants. NHI of nitrogen, phosphorus and potassium were computed by using the formula given below:
N H I = N u t r i e n t s   u p t a k e   i n   g r a i n s   ( k g   h a 1 ) T o t a l   n u t r i e n t s   u p t a k e g r a i n s + s t r a w ( k g   h a 1 )

2.9. Economic Nutrients Use Efficiency (ENUE)

Economic Nutrients Use Efficiency is defined as the amount of INR (₹) invested on production of per kg grain yield. ENUE was calculated by using the formula given below:
N H I = G r a i n   Y i e l d   ( k g   h a 1 )   I n v e s t e d   o n   n u t r i e n t

2.10. Biological Properties

The population of bacteria, fungi, and actinomycetes were counted using a serial soil dilution method. In the beginning and at the end, soil samples were taken from the field while receiving the designated treatments, and they were then screened using a 2 mm sieve. To create a representative sample, the samples were properly combined and blended. For the purpose of identifying and isolating live bacteria, fungus, and actinomycetes count, the serial dilution approach was used, which is outlined as follows: Set up the media to support the required microbiota. Fill sterile petri plates with the cooled (45 °C) and autoclaved medium. Permit the medium to set. Then, 9 mL of sterile water blank and 1 g of sieved (2 mm) soil should be shaken for 15 to 20 min. Prepare dilutions 10−2, 10−3, 10−4, 10−5, 10−6, 10−7, and 10−8 in serial order. Add 1 mL aliquots of various dilutions to the medium in Petri plates after it has cooled and solidified. To ensure that spores are distributed equally, rotate the plates for 3–4 days at 28 °C. Check the plate for colonies growing on the medium’s surface. According to [15], the population counts of bacteria, fungi, and actinomycetes were determined using the dilution plate technique, with Martin’s rose agar, Bengal agar, and Ken Knight’s agar media, respectively.

2.11. Soil Fertility Status

The fertility status of soil was estimated using the Walkley–Black wet oxidation Method [16] for organic carbon, the alkaline potassium permanganate method [17] for the available nitrogen, Olsen’s method for the available phosphorus, and the 1 N NH4OAC extraction method [16] for the available potassium in soil after wheat harvesting.

2.12. Statistical Analysis

OPSTAT was utilised for the investigation’s comprehensive analysis of variance (ANOVA). The statistical significance level used to compare the treatment means was p 0.05.

3. Results

3.1. Yield Attributing Characters

The number of productive tillers m−2 (i.e., tillers with fertile spike) is an important yield attribute, accounting for major variation in grain yield of wheat (Figure 2). Among the tillage crop establishment methods, the greatest number of productive tillers (283.50 m−2) was recorded under T5 compared to all other treatments, with the exception of T2 and T8 during experimentation. However, treatments T1 and T7 were recorded as being superior to the remainder of the treatments, and on par with each other. Treatments T3, T4, and T6 were recorded to be on par with each other. Treatment T6 produced the lowest number of productive tillers (252.50 m−2) during our investigation. Tillage crop establishment methods exhibited a significant effect on spike length during this study. The spike length of wheat varied from 10.40 to 14.00 cm during experimentation. The maximum spike length (14.00 cm) of the wheat was recorded in T5, which was higher than all other treatments except T8 during study. However, T2 and T7 were superior to the rest of the treatments for this parameter. Treatments T1, T3 and T6 were on par with each other during experimentation, while treatment T6 was found to exhibit the minimum spike length (10.40 cm).
Number of grains per spike−1 is an important yield attribute, which directly affects the grain yield. The number of grains per spike−1 registered significant variation during this study. Among the tillage crop establishment methods, a significantly greater number of grains (53 grains per spike−1) was produced under treatment T5 than under other treatments during experimentation, with the exception of T2 and T8. T1 and T7 were both equally effective, though well beyond the other treatments. The experimental results showed that Treatments T3, T4, and T6 were all similar, with Treatment T6 yielding the fewest grains (42 grains per spike−1). An essential aspect of yield, test weight is the weight of 1000 grains divided by the weight of a single grain, so as to determine how effective the grain filling process was.
The difference in test weight of wheat varied significantly in relation to the tillage crop establishment method during both the years of study. The maximum test weight was recorded in treatment T5 than all other treatments except T1, T2 and T8. However, treatments T3, T4, T6 and T7 were on par with each other. Meanwhile, treatment T4 recorded the lowest test weight during investigation.

3.2. Yield (q ha−1)

The harvest index and yield (grain, straw, and biological, measured in q ha−1) are shown for a variety of tillage methods in Figure 2. All treatments (except T5, which produced a yield of 44.32 q ha−1) reported significantly lower yields. Compared to the other treatments, both T1 and T7 were shown to be comparably effective. After T5, the next highest grain yield was in Treatment 3 (30.10 q ha−1), followed by Treatment 4 (29.01 q ha−1), and Treatment 6 (28.29 q ha−1). The production of wheat grains differed by 20.99% between T1 and T5, 17.79% between T8 and T3, and 16.21% between T3 and T5.
Wheat straw yield varied from 46.23 to 61.88 q ha−1. While T2 and T8 had similar straw yields, T5 had the highest yield (61.88 q ha−1). There was a clear preference for T1 and T7 over the other therapies. While treatments T4 and T6 produced the most straw, treatment T3 produced the least. However, T3, T4, and T6 all functioned to about the same extent.
Tillage crop establishment with Treatment T5 was shown to be the most effective, followed by T8 and T2. T3, T4, and T6 were all equivalent in every measurable way. The T6 treatment had the lowest observed biological yield, namely, 74.98 q ha−1. Increases in grain, straw, and biological yield have all been linked to refinements in tillage methods. Increased growth and dry matter accumulation occurred because FIRB and Zero-till rapidly meet the crop’s water needs. Grain output, as indicated with metrics like effective tiller count, grain count per spike, and test weight, grew at a higher pace for plants that grow at a faster rate. The treatment with the greatest harvest index was T5, at 41.73 percent; however, treatments T8 and T2 were quite close behind. The harvest index ranged from 48.22% in Treatment 7, to 37.27% in Treatment 6. However, T1, T3, T4, and T7 all functioned similarly.

3.3. Water Input Studies

Soil moisture extraction pattern within layers was analysed, and it was found that the greatest amount of water was extracted (absorbed) from the 30–60 cm layer during the experiment, followed by the 15–30 cm, 0–15 cm, and the 60–90 cm layers (Table 1). Land arrangement under furrow-irrigated raised-beds practises enhanced the moisture extraction from the surface layer (0–15 cm) in both study years. Similarly, a modest drop in moisture extraction was seen with increasing profile depth, with the largest decrease (1.93) happening in the 60–90 cm soil layer under spray irrigation practises, due to a moisture deficit at shallower depths. The data also showed that in both years of analysis, the FIRB and zero-till plots drank more heavily from the deeper profile layer than the typical flood irrigation practise plots did.
Under plots where higher tillage procedures were used, crop water-use rose. Treatment T1 used significantly more water than treatments T2 and T5, while treatment T5 used significantly less water. Treatment T7 showed the highest water use efficiency, followed by T5, T8, and T2. Researchers found that as production grew, water productivity grew as well. In both years, T1 had significantly lower water productivity compared to T7, T5, T2, and T8. In terms of water output, the rankings were as follows: T7 > T5 > T2 > T8 > T6.

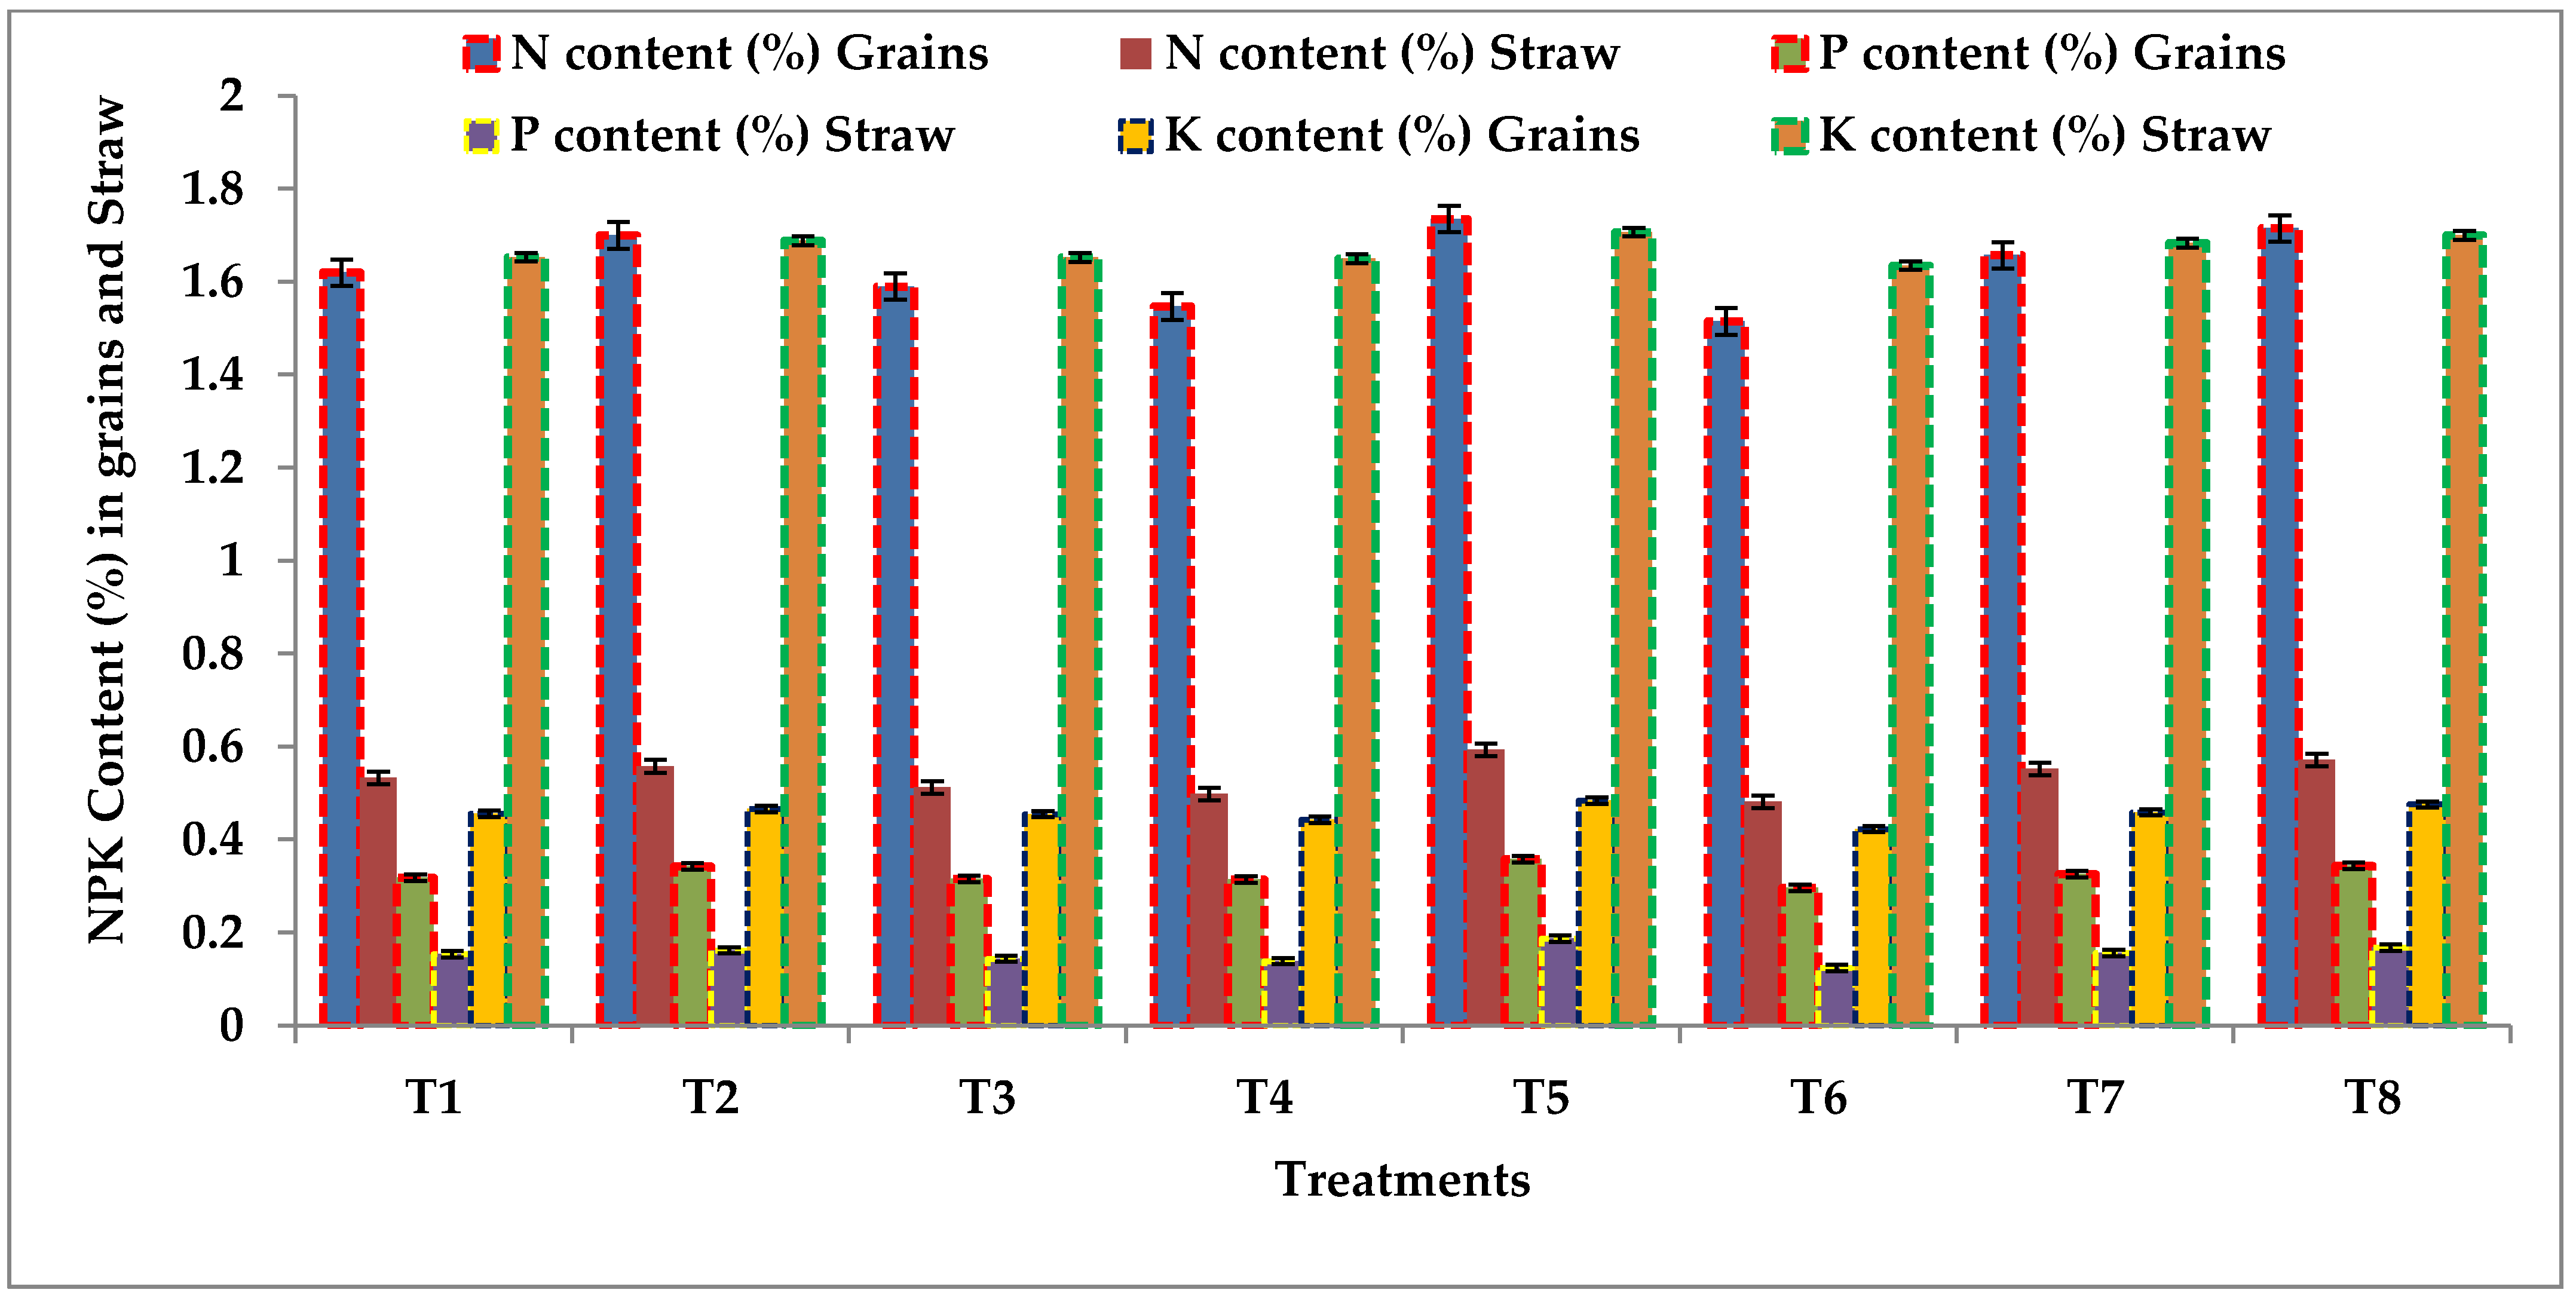
3.4. Nutrient Uptake (kg ha−1)

3.4.1. Nitrogen

Wheat’s nitrogen level ranged from 1.52% in the grains to 1.74% in the straw, and from 0.59 to 0.59 percentage points. Among the tillage crop establishment treatments, significant maximum nitrogen percentage levels in grains (1.74%) and straw (0.59%) was recorded in treatment T5, which was recorded as being statistically at par with treatment T8 (Figure 3). However, treatment T2 was recorded to be statistically superior, on a par with T7 over rest of the treatments and across all parameters, with the exception of grain yield. However, the minimum nitrogen percentage contents in the grains (1.52%) and straw (0.48%) of the wheat were recorded in treatment T6, followed by T4, T3 and T1. Among the tillage crop establishment treatments, significant maximum nitrogen uptake in grains (76.9 kg ha−1) and straw (36.8 kg ha−1) of wheat was recorded in treatment T5, followed by T8 and T2 (Figure 4). However, statistically speaking, T8 and T2 were on level with one another. Statistically speaking, T7 and T1 were equally the best treatments overall; however, for straw, T3 was the worst. Furthermore, with treatment T6, nitrogen uptake was measured at 45.2 kg ha−1 (grains) and 24.2 kg ha−1 (straw), significantly lower than the uptake under treatment T4 (52.4 kg ha−1 in grains, and 25.6 kg ha−1 in straw). However, uptake of nitrogen into straw under treatments T6 and T4 were recorded as being statistically on par with each other during investigation.
The total nitrogen uptake varied from 69.4 to 113.7 kg ha−1. Treatments T5, T8 and T2 were recorded as having 27.97, 22.73, and 19.89% more total Nitrogen uptake as compared to treatment T1 (Figure 5). However, treatment T6 was recorded as having the lowest total Nitrogen uptake (69.4 kg ha−1), followed by T4, T3 and T7 at values of 78.0, 83.4, and 92.3 kg ha−1, respectively. The nitrogen harvest index of wheat was affected by tillage crop establishment practices. The maximum nitrogen harvest index was recorded in treatments T2 and T8, with the value of 0.7, which was recorded as being statistically on par with treatments T1, T4, T3, and T6 (Figure 6). However, the minimum nitrogen harvest index (with the value of 0.6) during the course of our investigation was recorded under treatment T7, followed by T6.

3.4.2. Phosphorus

The percentage content, uptake, and harvest index of phosphorous were significantly affected by various treatments. Among the treatments, significant maximum Phosphorus percentage content in grains (0.36%) and straw (0.19%) of wheat were recorded in treatment T5 (Figure 3). However, treatments T2, T7, and T8 were found to be statistically superior over the rest of the treatments in case of wheat straw, being about on par with each other. However, significantly low percentages of phosphorus content in grains (0.30%) and straw (0.12%) were recorded under treatment T6; this was followed by T4, T3, and T1 with the value of 0.32, 0.14, and 0.32 per cent for grains, and 0.14, 0.32, and 0.15 per cent in straw, respectively. The uptake of phosphorus in the grains and straw of the wheat was affected by various treatments (Figure 4). Among the treatments, significant maximum phosphorus uptakes in the grains and straw of wheat were recorded in treatment T5 compared to all other treatments, with value of 15.9 and 11.6 kg ha−1. This was followed by T8 and T2, which were recorded as statistically superior over rest of the treatments and on par with each other. Likewise, treatments T7 and T1 were recorded on par with each other, and superior to T3, T4, and T6. However, treatment T6 recorded significantly low phosphorus uptakes, with the values of 8.87 and 6.22 kg ha−1 in grains and straw, respectively.
Total phosphorus uptake varied from 15.1 to 27.5 kg ha−1. Among the tillage crop establishment practices, significant maximum total phosphorus uptakes were recorded in treatment T5 (27.5 kg ha−1) compared to all other treatments, followed by T2 and T8 (Figure 5). However, the treatments T2 (24.6 kg ha−1) and T8 (25.2 kg ha−1) were recorded statistically superior over the rest of the treatments and on par with each other, followed by T1 and T7 which were also recorded on par with each other. However, treatment T6 was recorded significant minimum total phosphorus uptakes, followed by T3 and T4. The phosphorus harvest index differed significantly due to treatments’ effects. The phosphorus harvest index was highest in treatment T4, then T2, then T3, then T8, then T6, then T5, then Treatment1 (Figure 6), and was ultimately lowest in treatment T7.

3.4.3. Potassium

Among the treatments, significant maximum percentages of potassium content in the grains and straw of wheat were recorded in treatment T5, with the values of 0.48 and 1.71 per cent; this was recorded as being statistically on par with treatments T2 and T8 (Figure 3). However, treatments T7 and T1 were recorded as being similarly statistically superior, being on par with each other, followed by T3 and T4. Meanwhile, the minimum per cent potassium content in the grains and straw of wheat were recorded in treatment T6. As is evident from the data, potassium uptake in the grains and straw of wheat differed significantly due to treatments’ effects (Figure 4). Significant maximum potassium uptakes in both grains (21.4 kg ha−1) and straw (105.9 kg ha−1) of wheat was recorded in treatment T5 compared to all other treatments except T2 and T8, which were recorded as being statistically on par, with the exception of T2 in the case of grains. However, treatments T7, T3 and T1 were recorded as statistically superior (on par with each other) over rest of the treatments except wheat straw. Meanwhile, the minimum potassium uptake in the grains (12.7 kg ha−1) and straw (81.9 kg ha−1) were recorded in treatment T6, followed by T4. Among the treatments, significant maximum total potassium uptakes were recorded into treatment T5 (127.3 kg ha−1), which was recorded as being statistically on par with treatment T8 (Figure 5). However, the treatment T2 was recorded as statistically superior to the rest of the treatments, followed by T7, T1, and T3. However, significantly low total potassium uptake was recorded into treatment T6 (94.5 kg ha−1), followed by T4. Treatments T5 and T8 exhibited an increased total uptake of potassium compared to T1 and T6, with difference of 17.8, 34.7, and 15.4, 31.9 per cent, respectively, during course of investigation. Among the treatments, the maximum potassium harvest index was noted in treatment T5, which was recorded as being statistically on par with treatments T2 and T8, all three being greater than the rest of the treatments (Figure 6). However, the treatments T1, T3, and T4 were also recorded as possessing statistical superiority, being on par with each other over the remainder of the treatments. However, the minimum potassium harvest index of wheat was recorded in treatment T6, followed by T7.

3.5. Economic Nutrients Use Efficiency

The economic nutrient-use efficiency of wheat was significantly affected by tillage crop establishment methods during course of investigation (Figure 7). All the treatments received equal amount of nutrient, which is why the investment (INR/ha) for nutrients across all treatments was the same. An economic nutrient-use efficiency is dependent upon obtaining the ratio of productivity to the amount of INR invested on the nutrients applied. Among the treatments, maximum economic nitrogen-use efficiency (ENUE) was observed in treatment T5 (2.68), which was recorded as being statistically on par with treatments T2 and T8. After this, the treatments T1 and T7 were recorded as the next most statistically superior compared to the remainder of the treatments, being on par with each other. However, minimum ENUE was recorded under treatment T6 (1.71), followed by T4 and T3. A significant maximum Economic Phosphorus Use Efficiency was observed in treatment T5 (1.42) compared to all other treatments, with the exception of T2 and T8, which were recorded as being statistically on par. However, treatments T1 and T7 were recorded as being similarly statistically superior, on par with each other over rest of the treatments. The minimum EPUE was recorded in treatment T6, followed by T4 and T3. Economic Potassium Use Efficiency (EPUE) varied from 1.49 to 2.33. Among the treatments, the maximum EPUE was recorded in treatment T5 (2.33) over all other treatments, with the exception of T2 and T8, which were recorded as being statistically on par with it. After those, the treatments T1 and T7 were recorded as the next most statistically superior, on par with each other over rest of the other treatments. Meanwhile, the minimum EPUE was recorded in treatment T6, followed by T4 and T3.

3.6. Biological Properties of Soil

Biological properties of soil were significantly influenced by tillage crop establishment methods during experimentation (Table 2). Among the treatments, the highest bacterial population was recorded under T8 compared to other treatments. However, treatments T2 and T5 were recorded as superior to the remaining the treatments. Treatments T3, T4, T6, and T1 were recorded as being on par with each other, but treatment T7 had the lowest recorded bacterial population during both years of study. Tillage crop establishment methods resulted in significant differences in the population of fungi after wheat harvesting. Treatment T8 recorded the highest fungi population, followed by T5. However, treatments T2, T3, and T4 were recorded as similarly superior, being about on par with each other over rest of the treatments. The lowest fungi population was recorded in treatment T7, followed by T6 and T1. The highest population of actinomycetes following the wheat harvest was noted in treatment T8 compared to other treatments. However, treatments T2 and T5 were recorded as superior over remaining the treatments. Treatments T1, T4, and T3 were recorded as being on par with each other. The lowest population of actinomycetes was recorded during T7, followed by T6. Tillage crop establishment methods recorded significant differences in microbial carbon during the investigation. Treatment T8 recorded the highest microbial biomass carbon (160.21 μg g−1) compared to other treatments. However, treatments T2 and T5 were recorded as being similarly superior, being on par with each other. Treatments T3 and T4 were likewise recorded as being on par with each other. The lowest microbial-C during experimentation was recorded in treatment T7, followed by T6 and T1. The microbial biomass nitrogen was significantly affected by tillage crop establishment methods. Maximum microbial nitrogen (23.40 μg g−1) was recorded in T8 compared to other treatments, followed by T5 and T2. In addition, treatments T3 and T4 were recorded as being on par with each other. The lowest microbial-N during experimentation was recorded in treatment T7, followed by T6 and T1.

3.7. Fertility Status of Soil

Data showed that the status of soil organic carbon percentage differed only insignificantly (Table 3). Treatment T8 registered the highest organic carbon percentage compared to all other treatments. However, treatment T4 recorded the lowest organic carbon content percentage during experimentation, followed by T6, T7, T3, T2, T5, and T1. The tillage crop establishment method registered a significant difference in the fertility status of soil during the investigation (Table 3). Among the treatments, the maximum available nitrogen (228.95 kg ha−1) was recorded in T6, compared to all other treatments. However, treatments T3 and T4 were recorded as superior to the remainder of the treatments. Treatments T1, T2, and T7 were on par with each other over the rest of the treatments. Treatment T5 recorded the minimum available nitrogen during the investigation, followed by T8. The maximum available phosphorus (15.70 kg ha−1) was recorded under T6 compared to other treatments (except T4). However, treatments T1 and T3 were similarly superior, being on par with each other. Treatments T2, T5, T7, and T8 were on par with each other, while treatment T5 recorded the minimum available phosphorus. Treatment T6 (skip furrow irrigated) recorded the maximum (209.62 kg ha−1) available potassium compared to other treatments. However, treatment T5 recorded the minimum available potassium than rest of the treatments during experimentation, followed by T8, T2, T7, T3, T4, and T1.

4. Discussion

The rice plant height, number of tillers, dry matter accumulation, CGR, RGR, AGR, LAI, and NAR were recorded as being most significantly high in the wide-bed furrow-irrigated (T5) treatment, being on par with both zero-till flat irrigated using gated pipes (T8) and furrow irrigated with gated-pipe raised bed (T2). It has been hypothesised that increased rates of dry matter production, translocation, and photosynthesis conversion were responsible. Better light penetration from bed seeding wheat resulted in stronger plants and more efficient photosynthesis, both of which boosted yields [18,19]. There were more spikes produced per square metre when there were more tillers present. Larger spikes and heavier grains resulted from a bigger proportion of biomass being assigned to spikes, which in turn resulted from a greater leaf area index, allowing the crop to absorb more solar energy for dry matter formation via photosynthesis. These results are discussed further in [20,21,22,23,24,25].
Of the studied yield attributes, productive tillers, grains spike−1, spike length, and test weight were significantly increased in T5, which was statistically on par with T8 and T2. The grains, straw, and biological yield, as well as the harvest index, were significantly higher under treatment T5. The slow supply of moisture for longer times in order to enhance root and shoot growth of the crop is directly reflected in the source-to-sink transformation and boosting the metabolic activity of the crop plants. The yield per hectare rose as a result of the favourable effect of the increase in available moisture on per-plant productivity. Grain yield per plant increased as a result of an increase in moisture supply in three ways: the number of effective tillers, the number of grains per spike, and the test weight. Treatment T5 (the wide-bed furrow-irrigated treatment) was recorded as producing 20.96, 10.99 and 14.94 per cent higher grain, straw, and biological yields, respectively, over T1 (conventional flood irrigation). The same trend has been confirmed by several other investigations [26,27,28,29,30].
The significant impact that water had on the vegetative growth of the crop plant suggested that straw crop output may have increased as a result. Improved water distribution led to more vegetative growth, which in turn increased straw production. Straw production has reportedly followed a similar trend in other studies [22,31,32].
Due to the lack of surface moisture, conventional irrigation may be the leading cause of water loss. Many writers [33,34,35] have reported the same results.
The presence of soil moisture in the root zone of the crop increased root growth, which in turn enhanced nutrient uptake and boosted crop growth. Wide-bed furrow-irrigated treatment had the maximum recorded NPK content percentage and uptake in both grain and straw, as well as having the highest nutrient harvest index. Total NPK uptake was increased by approximately 27.97, 35.35, and 17.82 percent, respectively, in T5 wide-bed furrow-irrigated wheat compared to T1 conventional flood irrigation, which also boosted grain and biomass yield. The results are corroborated by the published research [35,36,37,38,39,40].
An increased porosity, increased availability of nutrients (especially P), and greater water availability in the soil profile available to be used by plants may have improved the soil’s microbiological properties. These results are also affirmed in [41,42].
The maximum population of bacteria, fungi, and actinomycetes, microbial-C, and microbial-N were recorded in treatment T8 (zero-till flat, irrigated using gated pipe/controlled-flood irrigation treatment) followed by T5 (wide-bed furrow-irrigated treatment) and T2 (furrow-irrigated with gated-pipe raised-bed treatment). The retention of previous crop residue in wheat under the rice–wheat cropping system on the surface of the soil (i.e., Conservation Agriculture, or Zero-till farming) maximised organic carbon level and microbial population, and minimised soil moisture loss, which helped the multiplication of microbes in the soil. Microbial development and, by extension, microbial circulation, are both influenced by the availability of organic matter in the soil [43]. Because of the decreased soil disturbance, the soil microbial biomass and activity were increased with full CA-based management using conservation-agriculture practices. Conservation agriculture may lead to higher microbial biomass nitrogen levels than conventional farming [44] due to the increased associated C inputs, residue retention, and decreased tillage.
The leached-down N, P, and K during treatment T5 was the outcome of increased growth, yield, nutrient uptake, and soil moisture availability over a longer period of time. The findings of [35,37,38] were consistent with this.

5. Conclusions

This study recommends sowing wheat in a wide-bed furrow-irrigated system, or a zero-till flat-irrigated using gated-pipe/controlled-flood irrigation system for the best outcomes when growing rice and wheat together under irrigated conditions. Wide-bed furrow irrigation increased the total nutrient NPK uptake in wheat, while sprinkler irrigation maximised water-use efficiency, water productivity, and consumption. The zero-till and gated-pipe/controlled-flood irrigation treatment also had larger bacterial, fungal, and actinomycete populations, as well as higher microbial-C and microbial-N levels than traditional flood irrigation. Our research suggests that farmers should use conservation tillage-based establishing tactics and irrigation strategies to increase crop productivity, water- and nutrient-use efficiency, nutrient uptake, and soil fertility in wheat-growing regions, in order to maintain crop water productivity and soil health under different agroecological conditions.

Author Contributions

Conceptualisation, R.K. and R.K.N.; methodology, R.K. and D.K.; software, R.K.; validation, R.K., R.K.N., M.S.C., R.B. and H.M.K. formal analysis, R.K. and R.B.; investigation, R.K., R.K.N. and R.B.; resources, S.A., M.H.S. and A.T.A.; data curation, R.K.; writing—original draft preparation., R.K., R.B., S.A. and M.H.S.; writing—review and editing, H.M.K., M.H.S., D.K., S.A. and A.T.A.; visualisation, R.K. and R.B.; supervision, M.S.C. and D.K.; funding acquisition, S.A. and A.T.A. All authors have read and agreed to the published version of the manuscript.

Funding

This study was supported by the Researchers Supporting Project number (RSP2023R194), King Saud University, Riyadh, Saudi Arabia.

Data Availability Statement

The data presented in this study are available in the article.

Acknowledgments

The authors would like to extend their sincere appreciation to the Researchers Supporting Project number (RSP2023R194), King Saud University, Riyadh, Saudi Arabia.

Conflicts of Interest

The authors declare no conflict of interest.

References

  1. Singh, M.; Supriya, K. Growth Rate and Trend Analysis of Wheat Crop in Uttar Pradesh, India. Int. J. Curr. Microbiol. Appl. Sci. 2017, 6, 2295–2301. [Google Scholar] [CrossRef] [Green Version]
  2. USDA Report (2019–2020); USDA: New York, NY, USA, 2019; pp. 11–12. Available online: https://www.usda.gov/media/agency-reports (accessed on 10 June 2023).
  3. Alla, M.A.; Nadine, N.; Khudhair, A.J.; Radhi, K. Effect of irrigation methods and tillage system, seed level on water use efficiency and wheat (Triticum aestivum L.) growth. Period. Eng. Nat. Sci. 2020, 8, 1701–1715. [Google Scholar]
  4. Rodell, M.; Velicogna, I.; Famiglietti, J.S. Satellite-based estimates of groundwater depletion in India. Nature 2009, 460, 999–1002. [Google Scholar] [CrossRef] [PubMed] [Green Version]
  5. Somerville, C.; Briscoe, J. Genetic engineering and water. Science 2001, 292, 2217. [Google Scholar] [CrossRef] [PubMed]
  6. Lal, R.; Follett, R.F.; Kimble, J.M. Achieving soil carbon sequestration in the United States: A challenge to thepolicy makers. Soil Sci. 2003, 1680, 827–845. [Google Scholar] [CrossRef]
  7. Husnjak, S.; Filipovie, D.; Kosutiae, S. Influence of different tillage systems on soil physical properties and crop yield. Rostl. Vyrob.-UZPI 2002, 48, 249–254. [Google Scholar] [CrossRef] [Green Version]
  8. Palm, C.; Blanco-Canqui, H.; DeClerck, F.; Gatere, L.; Grace, P. Conservation agriculture and ecosystem services: An overview. Agric. Ecosyst. Environ. 2014, 187, 87–105. [Google Scholar] [CrossRef] [Green Version]
  9. Borie, F.; Rubio, R.; Rouanet, J.L.; Morales, A.; Borie, G.; Rojas, C. Effects of tillage systems on soil characteristics, glomalin and mycorrhizal propagules in a Chilean Ultisol. Soil Tillage Res. 2006, 88, 253–261. [Google Scholar] [CrossRef]
  10. Mathew, R.P.; Feng, Y.; Githinji, L.; Ankumah, R.; Balkcom, K.S. Impact of No-tillage and conventional tillage systems on soil microbial communities. Appl. Environ. Soil Sci. 2012, 1–10. [Google Scholar] [CrossRef] [Green Version]
  11. Hobbs, P.R.; Sayre, K.D.; Gupta, R.K. The role of conservation agriculture in sustainable agriculture. Philos. Trans. R. Soc. B 2008, 363, 543–555. [Google Scholar] [CrossRef]
  12. Sharma, K.L.; Grace, J.K.; Mandal, U.K.; Gajbhiye, P.N.; Srinivas, K.; Korwar, G.R.; Bindu, V.H.; Ramesh, V.; Ramachandran, K.; Yadav, S.K. Evaluation of long-term soil management practices using key indicators and soil quality indices in a semi-arid tropical. Alfisol. Soil Res. 2008, 46, 368–377. [Google Scholar] [CrossRef]
  13. Huang, Z.Q.; Xu, Z.H.; Chen, C.R. Effect of mulching on labile soil organic matter pools, microbial community functional diversity and nitrogen transformations in two hardwood plantations of subtropical Australia. Appl. Soil Ecol. 2008, 40, 229–239. [Google Scholar] [CrossRef]
  14. Bolinder, M.A.; Janzen, H.H.; Gregorich, E.G.; Angers, D.A.; Vanden and Bygaart, A.J. An approach for estimating net primary productivity and annual carbon inputs to soil for common agricultural crops in Canada. Agric. Ecosyst. Environ. 2007, 118, 29–42. [Google Scholar] [CrossRef]
  15. Rangaswami, G. Agricultural Microbiology; Asia Publishing House: London, UK, 1966; p. 413. [Google Scholar]
  16. Jackson, M.L. Soil Chemical Analysis; Prentice Hall of India Pvt. Ltd.: New Delhi, India, 1973. [Google Scholar]
  17. Subbiah, B.V.; Asija, G.L. A rapid procedure for the estimation of available nitrogen in soil. Curr. Sci. 1956, 25, 259–260. [Google Scholar]
  18. Dhillon, S.S.; Prashar, A.; Thaman, S. Studies on bed planted wheat (Triticum aestivum L.) under different nitrogen levels and tillage methods. Curr. Sci. 2004, 5, 253–256. [Google Scholar]
  19. Tanveer, S.K.; Hussain, I.; Sohail, M.; Kissana, N.S.; Abbas, S.G. Effect of different planting methods on yield and yield component of wheat. Asian J. Plant Sci. 2003, 2, 811–813. [Google Scholar] [CrossRef]
  20. Ahmad, R.N.; Mahmood, N. Impact of Raised Bed Technology on Water Productivity and Lodging of Wheat. Pak. J. Water Resour. 2005, 9, 7–15. [Google Scholar]
  21. Ali, M.; Ali, L.; Waqar, M.Q.; Ali, M.A. Bed planting a new establishment method for wheat (Triticum aestivum L.) in cotton-wheat cropping system of southern Punjab. Int. J. Agric. Appl. Sci. 2016, 4, 1–7. [Google Scholar]
  22. Atikullah, M.N.; Sikder, R.K.; Asif, M.I.; Mehraj, H.; Jamaluddin, A.F.M. Effect of irrigation levels on growth, yield attributes and yield of wheat. J. Biosci. Agric. Res. 2014, 2, 83–89. [Google Scholar] [CrossRef] [Green Version]
  23. Sepat, R.N.; Rai, R.K.; Dhar, S. Planting systems and integrated nutrient management for enhanced wheat (Triticum aestivum) productivity. Indian J. Agron. 2010, 55, 114–118. [Google Scholar]
  24. Idnani, L.K.; Kumar, A. Relative efficiency of different irrigation schedules for conventional, ridge and raised bed seeding of wheat (Triticum aestivum L. ). Indian J. Agron. 2012, 57, 148–151. [Google Scholar]
  25. Ram, H.; Dadhwal, V.; Vashist, K.; Kaur, H. Grain yield and water use efficiency of wheat (Triticum aestivum L.) in relation to irrigation levels and rice straw mulching in North West India. Agric. Water Manag. 2013, 128, 92–101. [Google Scholar] [CrossRef]
  26. Choudhary, R.L.; Behera, U.K. Conservation agricultural and nitrogen management in maize-wheat cropping system: Effect on growth, productivity and economics of wheat. Int. J. Chem. Stud. 2020, 8, 2432–2438. [Google Scholar] [CrossRef]
  27. Singh, K.; Dwivedi, B.S.; Shukla, A.K.; Mishra, R.P. Permanent raised bed planting of the pigeon pea–wheat system on a typic-ustochrept, Effects on soil fertility, yield and water and nutrient use efficiencies. Field Crops Res. 2010, 116, 127–139. [Google Scholar] [CrossRef]
  28. Singh, V.; Naresh, R.K.; Kumar, R.; Singh, A.; Shahi, U.P.; Kumar, V. Enhancing yield and water productivity of wheat (Triticum aestivum) through sowing methods and irrigation schedules under light textured soil of western Uttar Pradesh, India. Int. J. Curr. Microbiol. Appl. Sci. 2017, 4, 1400–1411. [Google Scholar]
  29. Mollah, M.I.U.; Bhuiya, M.S.U.; Hossain, M.S.; Hossain, S.M.A. Growth of wheat (Triticum aestivum L.) under raised bed planting method in rice-wheat cropping system. Bangladesh Rice J. 2015, 19, 47–56. [Google Scholar] [CrossRef] [Green Version]
  30. Naresh, R.K.; Singh, B.; Singh, S.P.; Singh, P.K.; Kumar, A.; Kumar, A. Furrow irrigated raised bed (FIRB) planting technique for diversification of rice-wheat system for western IGP region. Int. J. Life Sci. Biotechnol. Pharma Res. 2012, 1, 134–141. [Google Scholar]
  31. Kumar, V.; Kumar, P.; Singh, R. Growth and yield of rice-wheat cropping sequence in raised bed planting system. Indian J. Agric. Res. 2013, 47, 157–162. [Google Scholar]
  32. Kumar, R.; Pandey, D.S.; Singh, V.P. Wheat (Triticum aestivum) productivity under different tillage practices and legume options in rice (Oryza sativa) and wheat cropping sequence. Indian J. Agric. Sci. 2014, 84, 101–106. [Google Scholar]
  33. Parihar, S.S.; Tiwari, R.B. Effect of irrigation and nitrogen level on yield, nutrient uptake and water use of late-sown wheat (Triticum aestivum). Indian J. Agron. 2003, 48, 103–107. [Google Scholar]
  34. Naresh, R.K.; Singh, S.P.; Kumar, V. Crop establishment, tillage and water management technologies on crop and water productivity in rice-wheat cropping system of North West India. Int. J. Sci. Life Sci. Biotechnol. Pharma. Res. 2013, 2, 1–12. [Google Scholar]
  35. Idnani, L.K.; Kumar, A. Performance of wheat (Triticum aestivum L.) under different irrigation schedules and sowing methods. Indian J. Agric. Sci. 2013, 83, 37–40. [Google Scholar]
  36. Talukder, A.S.; Mominul Haque, M.; Meisner, C.; Kabir, M.J.; Hossain, A.B.S.; Rashid, M.H. Productivity of multi-crops sown on permanent raised beds in the tropics. In New Directions for a Diverse Planet: Proceedings of the 4th International Crop Science Congress, Brisbane, Australia, 26 September–1 October 2004; Crop Science Society of America: Madison, WI, USA, 2004. [Google Scholar]
  37. Naresh, R.K.; Rathore, R.S.; Kumar, P.; Singh, S.P.; Singh, A.; Shahi, U.P. Effect of precision land leveling and permanent raised bed planting on soil properties, input use efficiency, productivity and profitability under maize (Zea mays)—Wheat (Triticum aestivum L.) cropping system. Indian J. Agric. Sci. 2014, 84, 725–732. [Google Scholar]
  38. Jat, M.L.; Gupta, R.; Saharawat, Y.S.; Khosla, R. Layering precision land leveling and furrow irrigated raised bed planting: Productivity and input use efficiency of irrigated bread wheat in Indo-Gangetic Plains. Am. J. Plant Sci. 2011, 2, 578–588. [Google Scholar] [CrossRef] [Green Version]
  39. Hossain, M.I.; Islam, K.; Sufian, A.; Abu, M.; Meisner, C.A.; Islam, S.M. Effect of planting method and nitrogen levels on the yield and yield attributes of wheat. J. Bio Sci. 2006, 14, 127–130. [Google Scholar] [CrossRef]
  40. Rajanna, G.A.; Dhindwal, A.S.; Narender, N.; Patil, M.D.; Shiva kumar, L. Alleviating moisture stress under irrigation scheduling and crop establishment techniques on productivity and profitability of wheat (Triticum aestivum) under semi-arid conditions of western India. Indian J. Agric. Sci. 2018, 88, 32–38. [Google Scholar]
  41. Sharma, A.R.; Singh, R.; Dhyani, S.K. Conservation tillage and mulching for optimizing productivity in maize-wheat cropping system in the outer western Himalayan region—A review. Indian J. Soil Conserv. 2005, 33, 35–43. [Google Scholar]
  42. Samal, S.K.; Rao, K.K.; Poonia, S.P.; Kumar, R.; Mishra, J.S.; Prakash, V.; Mondal, S.; Dwivedi, S.K.; Bhatt, B.P.; Sushanta, N.K.; et al. Evaluation of long-term conservation agriculture and crop intensification in rice-wheat rotation of Indo-Gangetic Plains of South Asia: Carbon dynamics and productivity. Eur. J. Agron. 2017, 90, 198–208. [Google Scholar] [CrossRef]
  43. Wang, Z.; Chen, Q.; Liu, L.; Wen, X.; Liao, Y. Responses of soil fungi to 5-year conservation tillage treatments in the drylands of northern China. Appl. Soil Ecol. J. 2016, 101, 132–140. [Google Scholar] [CrossRef]
  44. Wang, J.J.; Li, X.Y.; Zhu, A.N.; Zhang, X.K.; Zhang, H.W.; Liang, W.J. Effect of tillage and residue management on soil microbial communities in North China. Plant Soil Environ. 2012, 58, 28–33. [Google Scholar] [CrossRef] [Green Version]
Figure 1. Mean weekly Agro-meteorological data during the crop growing rabi season for (A) 2017–2018 and (B) 2018–2019.
Agronomy 13 01839 g001
Figure 2. Impact of tillage and crop establishment practices on yield attributing characters and yield of wheat (2017–2018 and 2018–2019 pooled) (Bars represent standard error).
Agronomy 13 01839 g002
Figure 3. Nutrient (N, P, and K) content per cent in grains and straw of wheat affected by tillage crop establishment methods (Pooled data: 2017–2018 and 2018–2019) (Bars represent standard error bars).
Agronomy 13 01839 g003
Figure 4. Nutrients (N, P, and K) uptake in grains and straw of wheat affected by tillage crop establishment methods (Pooled data: 2017–2018 and 2018–2019 (Bars represent standard error bars).
Agronomy 13 01839 g004
Figure 5. Effect of tillage crop establishment methods on total N, P, and K uptake in wheat (Pooled data: 2017–2018 and 2018–2019) (Bars represent standard error bars).
Agronomy 13 01839 g005
Figure 6. Nutrients (N, P, and K) harvest index of wheat influenced by tillage crop establishment methods (2017–2018 and 2018–2019, pooled) (Bars represent standard error bars).
Agronomy 13 01839 g006
Figure 7. Economic Nitrogen, Phosphorus and Potassium Use Efficiency of wheat, as influenced by tillage crop establishment methods (pooled data: 2017–18 and 2018–19) (Bars represent standard error bars). ENUE: Economic Nitrogen Use Efficiency; EPUE: Economic Phosphorus Use Efficiency; and EKUE: Economic Potassium Use Efficiency. Nitrogen through Urea: 276 kg ha−1 at INR 6 kg−1, Phosphorus through DAP: 130 kg ha−1 at INR 24 kg−1 and Potassium through MOP: 100 kg ha−1 at INR 19 kg−1.
Agronomy 13 01839 g007
Table 1. Effect of tillage and crop establishment practices on soil moisture depletion, consumptive use, and water-use efficiency of wheat (2017–2018 and 2018–2019, pooled).
TreatmentsSoil Moisture DepletionTotal Soil Moisture Depletion (cm)Consumptive Use
(cm)
Water-Use Efficiency
(q ha−1 cm)
Water Productivity
(kg cm−3)
Depth of Soil (cm)
0–1515–3030–6060–90
T13.663.362.832.3912.2324.831.470.94
T22.273.183.572.7811.7921.102.021.46
T32.253.753.212.4011.6019.001.581.01
T42.233.482.682.3010.6816.881.721.14
T53.043.864.423.4614.7718.252.431.72
T62.133.312.372.2210.0216.051.761.23
T74.303.342.611.9312.1712.552.861.91
T83.254.112.572.9312.8618.952.281.40
Mean2.893.553.032.5512.0018.452.011.31
Table 2. Biological properties of soil as influenced by tillage crop establishment methods (2017–2018 and 2018–2019, pooled).
TreatmentsBiological Properties of Soil
Bacteria
(105 CFU g−1)
Fungi
(104 CFU g−1)
Actinomycetes
(106 CFU g−1)
Microbial-C
(µg/g−1 Soil)
Microbial-N
(µg/g−1 Soil)
T10.730.560.53151.6318.71
T20.770.620.57156.0320.88
T30.760.600.56155.6020.28
T40.750.570.54154.5719.62
T50.800.650.59157.3121.91
T60.720.520.50147.8017.38
T70.690.500.48144.9416.14
T80.840.660.62160.2123.40
SEm±0.010.010.010.620.34
CD (p = 0.05)0.020.020.021.800.98
Table 3. Effect of tillage crop establishment methods on fertility status of soil (2017–2018 and 2018–2019, pooled).
TreatmentsOrganic Carbon
(%)
Available Nutrients (kg ha−1)
NitrogenPhosphorusPotassium
T1 0.49215.1712.94206.37
T2 0.48213.6412.30204.30
T3 0.49219.1014.15205.72
T4 0.47221.3514.45206.07
T5 0.49204.5210.99200.84
T6 0.48228.9515.70209.62
T7 0.49213.6812.64205.03
T8 0.50210.6411.82203.48
SEm±0.0011.330.440.94
CD (p = 0.05)NS3.881.272.74
Disclaimer/Publisher’s Note: The statements, opinions and data contained in all publications are solely those of the individual author(s) and contributor(s) and not of MDPI and/or the editor(s). MDPI and/or the editor(s) disclaim responsibility for any injury to people or property resulting from any ideas, methods, instructions or products referred to in the content.

