


Grain Yield of Maize Crops under Nitrogen Fertigation Using Wastewater from Swine and Fish Farming
Abstract
:1. Introduction
2. Materials and Methods
- DAR—wastewater dose to be applied (m3 ha−1);
- Nabs—N absorption to obtain the desired productivity (kg ha−1);
- Tm1—annual rate of mineralization of organic matter already existing in the soil (dimensionless);
- M.O—soil organic matter content (kg kg−1);
- ρs—soil density (t m−3);
- P—soil depth considered (m);
- n—duration of the crop cycle;
- Tm2—organic nitrogen mineralization rate (dimensionless);
- Norg—organic nitrogen (mg L−1);
- Namon—ammoniacal nitrogen (mg L−1);
- Nnitrate—nitric nitrogen (mg L−1);
- PR—recovery of mineral N by culture (dimensionless).
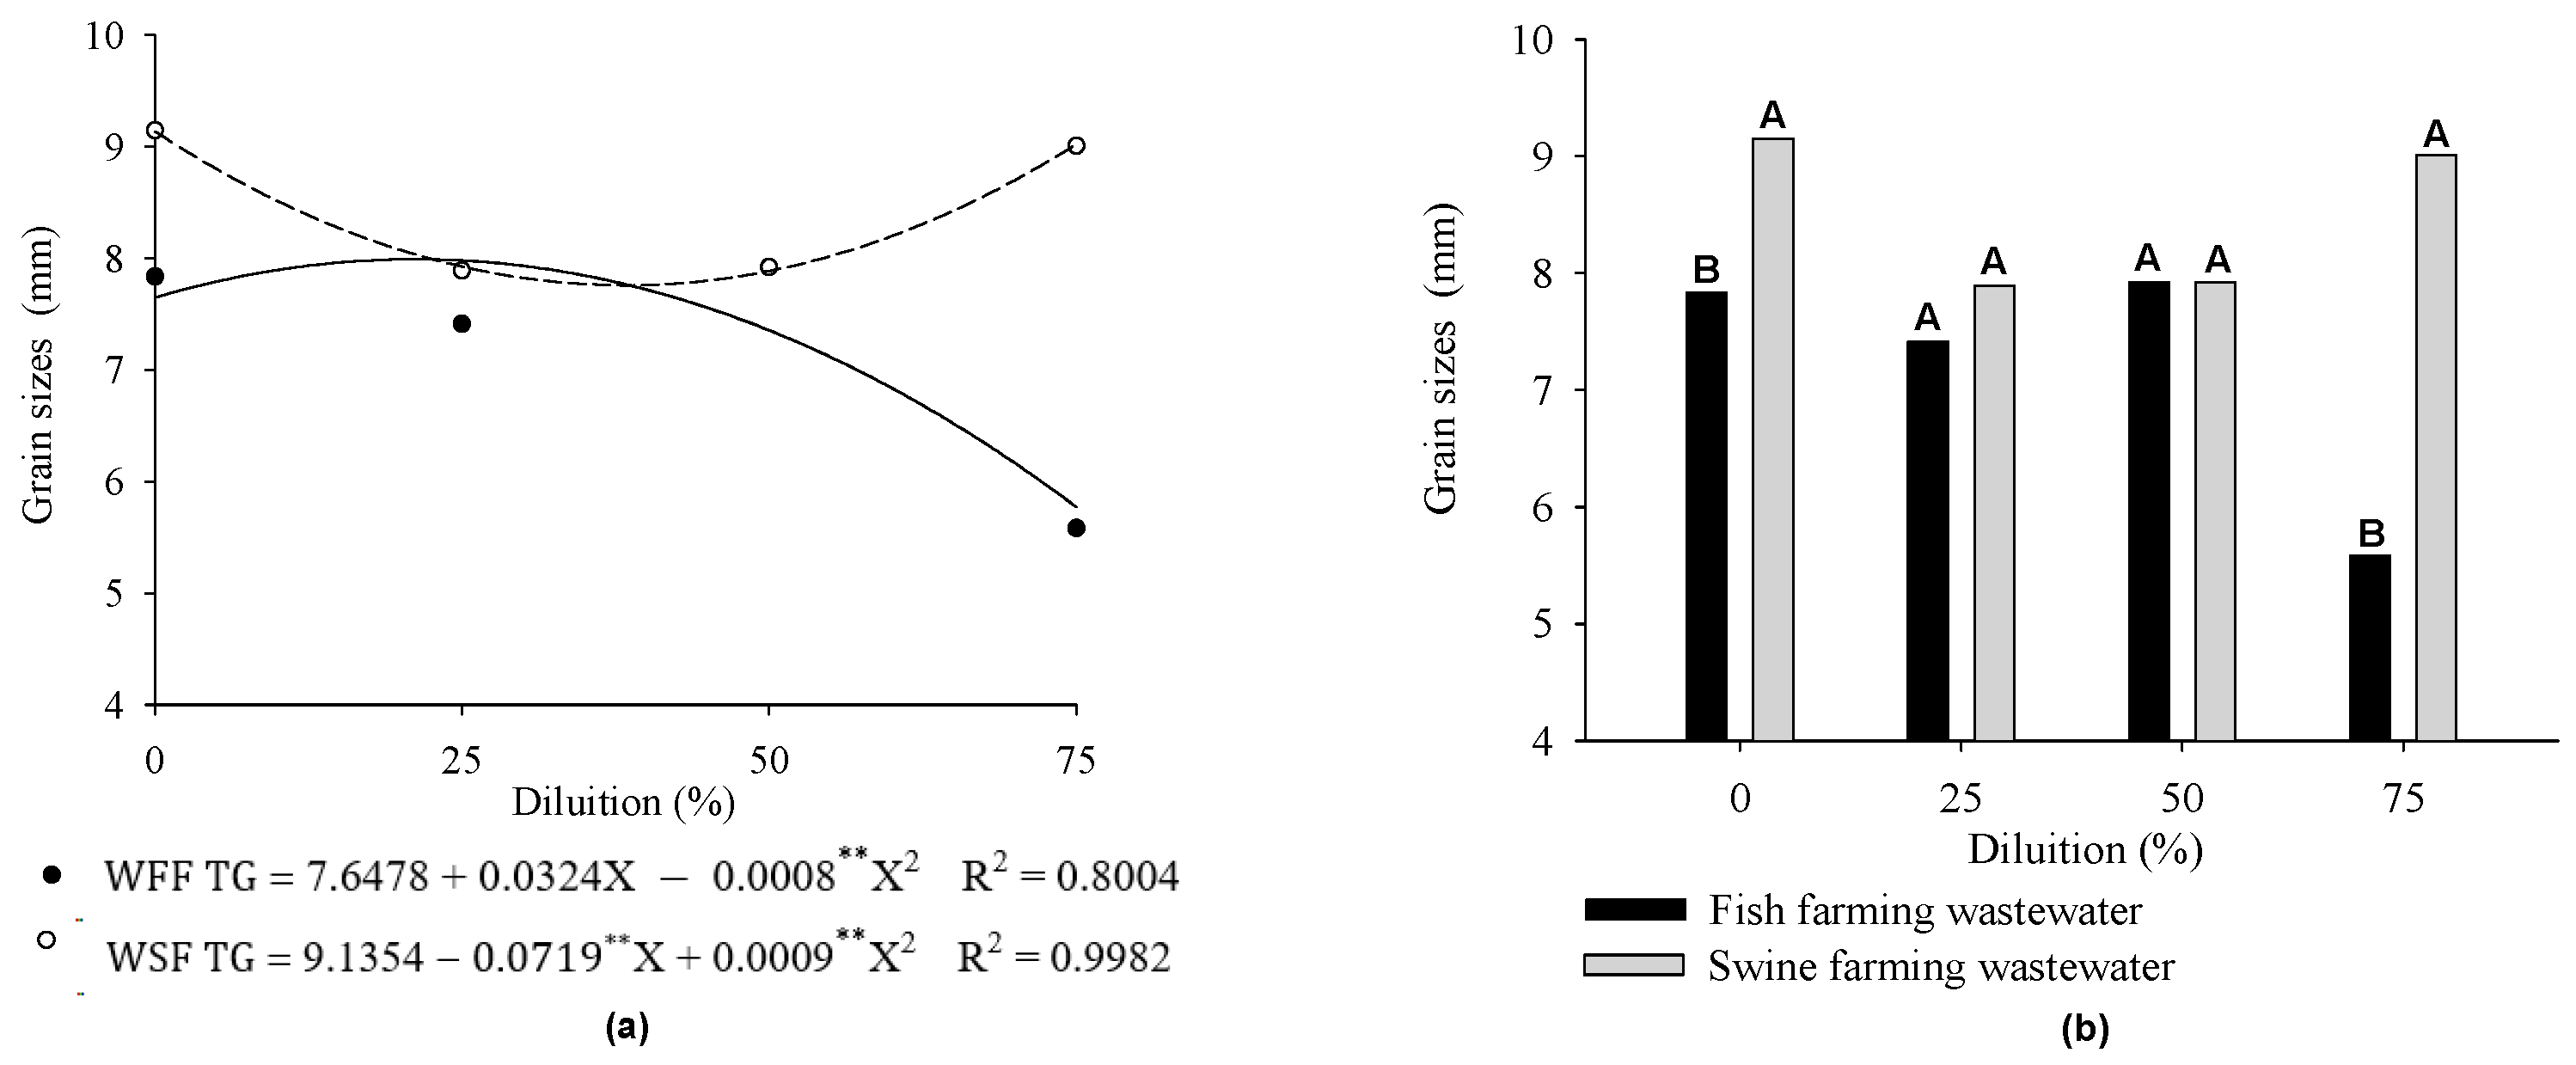
- GS—grain size (mm);
- ED—ear diameter (mm);
- CD—cob diameter (mm).
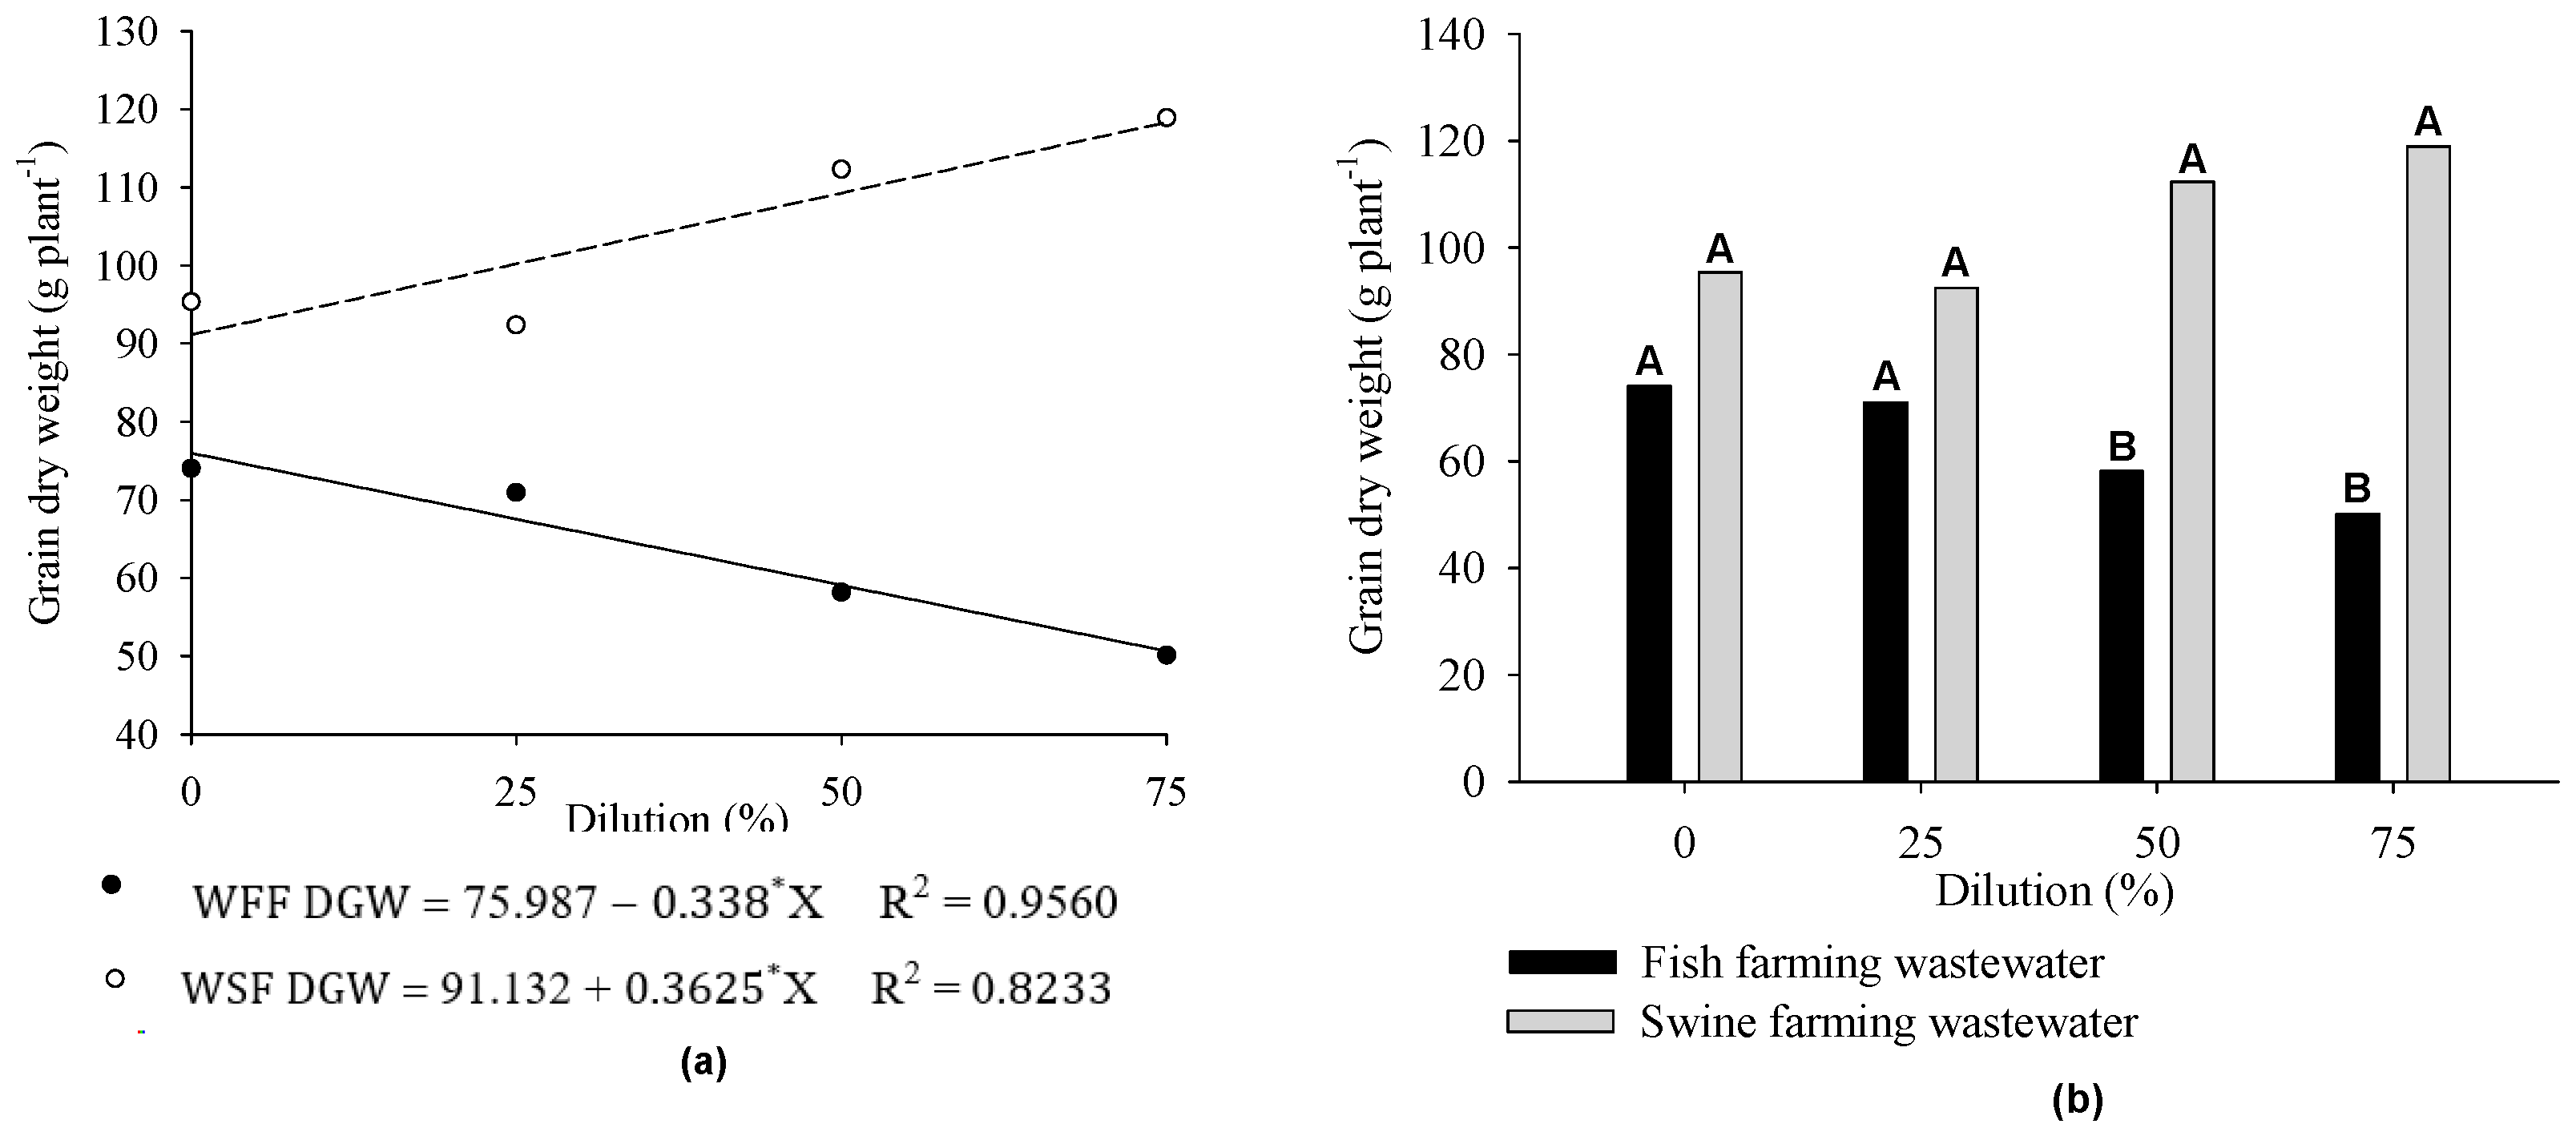
- GY—grain yield corrected to 13% moisture (kg ha−1);
- DGWe—dry grain weight per ear (kg ear−1);
- NEP—number of ears per plant;
- 70,000 = number of plants per hectare;
- HI—harvest index;
- DGW—grain dry weight (g plant−1);
- DMAP—dry matter of aerial parts (g plant−1).
3. Results
4. Discussion
5. Conclusions
Author Contributions
Funding
Data Availability Statement
Acknowledgments
Conflicts of Interest
References
- Abreu, P.A.S. Irrigação por Sulcos com Efluente de Fossa Séptica Biodigestor como Fonte de Nitrogênio na Cultura do Milho. Master’s Thesis, Universidade Estadual de São Paulo, Botucatu, Brazil, 2019. [Google Scholar]
- CONAB—Companhia Nacional de Abastecimento. Acompanhamento da Safra Brasileira de Grãos, v.6, Safra 2022/23—Nono Levantamento; CONAB: Brasília, Brazil, 2023. [Google Scholar]
- Oliveira Neto, T.I.; Costa, M.C.G.; Oliveira, V.P.V. Acúmulo de nitrogênio em plantas de milho crioulo em resposta à adubação orgânica. Rev. Equador 2016, 5, 207–220. [Google Scholar] [CrossRef]
- Sologuren, L. Demanda mundial cresce e Brasil tem espaço para expandir produção. Visão Agrícola 2015, 13, 8–13. [Google Scholar]
- Cantarella, H. Nitrogênio. In Fertilidade do Solo; Novais, R.F., Alvarez, V.V.H., Barros, N.F., Fontes, R.L.F., Cantarutti, R.B., Neves, J.C.L., Eds.; SBCS: Viçosa, Brazil, 2007; pp. 375–470. [Google Scholar]
- Silva, S.; Dantas Neto, J.; Teodoro, I.; Souza, J.L.; Lyra, G.B.; Santos, M.A.L. Demanda hídrica da cana-de-açúcar irrigada por gotejamento nos tabuleiros costeiros de Alagoas. Rev. Bras. Eng. Agrícola Ambient. 2015, 19, 849–856. [Google Scholar] [CrossRef] [Green Version]
- Fornasieri Filho, D. Manual da Cultura do Milho; Funep: Jaboticabal, Brazil, 2007. [Google Scholar]
- Alves, P.F.S.; Santos, S.R.D.; Kondo, M.K.; Araújo, E.D.; Oliveira, P.M.D. Fertirrigação do milho com água residuária sanitária tratada: Crescimento e produção. Eng. Sanitária Ambient. 2018, 23, 833–839. [Google Scholar] [CrossRef]
- Silva, J.R.M. Aplicação de Efluente de Estação de Tratamento de Esgoto em solo Cultivado com Grama Esmeralda (Zoysia japonica). Ph.D. Thesis, Universidade Federal de Lavras, Lavras, Brazil, 2017. [Google Scholar]
- Ahmad, I.; Wajid, S.A.; Ahmad, A.; Cheema, M.J.M.; Judge, J. Optimizing irrigation and nitrogen requirements for maize through empirical modeling insemi-arid environment. Environ. Sci. Pollut. Res. 2019, 26, 1227–1237. [Google Scholar] [CrossRef] [PubMed]
- Shim, S.; Reza, A.; Kim, S.; Won, S.; Ra, C. Nutrient recovery from swine wastewater at full-scale: An integrated technical, economic and environmental feasibility assessment. Chemosphere 2021, 277, 130309. [Google Scholar] [CrossRef] [PubMed]
- Ndagi, A.; Adeoye, P.A.; Usman, B.I. Effect of fishpond wastewater irrigation on receiving soils and crops in dry season farming. Direct Res. J. Eng. Inf. Technol. 2020, 7, 75–83. [Google Scholar]
- Payebo, C.O.; Ogidi, I.A. Evaluation of fish pond water on the growth and yield of maize at Wilberforce Island, Amassoma. Afr. J. Crop Sci. 2020, 8, 1–7. [Google Scholar]
- Oliveira, E.L. Manual de Utilização de Águas Residuárias em Irrigação, 1st ed.; Fepaf: Botucatu, Brazil, 2012. [Google Scholar]
- Ribeiro, J.C. Reuso de Efluentes na Agricultura. Ph.D. Thesis, Universidade Estadual Paulista (UNESP), São Paulo, Brazil, 2013. [Google Scholar]
- World Health Organization. Guidelines for the Safe Use of Wastewater, Excreta and Greywater; World Health Organization: Paris, France, 2006; Volume 2, ISBN 92-4-154683-2. [Google Scholar]
- Köppen, W.; Geiger, R. Klimate der Erde; Wall-map 150 cm × 200 cm; Verlag Justus Perthes: Gotha, Germany, 1928. [Google Scholar]
- Santos, H.G.; Dos Jacomine, P.K.T.; Anjos, L.H.C.; Dos Oliveira, V.A.; De Lumbreras, J.F.; Coelho, M.R.; Almeida, J.A.; de Araujo Filho, J.C.; De Oliveira, J.B.; De Cunha, T.J.F. Sistema Brasileiro de Classificação de Solos, 5th ed.; Embrapa: Brasília, Brazil, 2018. [Google Scholar]
- USDA-United States Department of Agriculture Natural Resources Conservation Service. Soil Taxonomy: A Basic System of Soil Classification for Making and Interpreting Soil Surveys, 2nd ed.; USDA: Washington, DC, USA, 1999; 863p. [Google Scholar]
- FAO—Food and Agriculture Organization of the United Nations. World Reference Base for Soil Resources 2014: International Soil Classification System for Naming Soils and Creating Legends for Soil Maps; FAO: Rome, Italy, 2015; 192p. [Google Scholar]
- Teixeira, W.G. Manual de Métodos de Análise de Solo, 3rd ed.; Edição Revista e Ampliada; Embrapa: Brasília, Brazil, 2017; 574p. [Google Scholar]
- Matos, A.T.; Matos, M.P. Disposição de Águas Residuárias no Solo e em Sistemas Alagados Construídos, 1st ed.; Editora UFV: Viçosa, Brazil, 2017; Volume 1, 371p. [Google Scholar]
- APHA. Standard Methods for the Examination of Water and Wastewater, 21st ed.; American Public Health Association: Washington, DC, USA, 2005. [Google Scholar]
- Ferreira, D.F. Sisvar: A computer statistical analysis system. Ciênc. Agrotec. 2011, 35, 1039–1042. [Google Scholar] [CrossRef] [Green Version]
- Nasar, J.; Khan, W.; Khan, M.Z.; Gitari, H.I.; Gbolayori, J.F.; Moussa, A.A.; Mandozai, A.; Rizwan, N.; Anwari, G.; Maroof, S.M. Photosynthetic Activities and Photosynthetic Nitrogen Use Efficiency of Maize Crop Under Different Planting Patterns and Nitrogen Fertilization. J. Soil Sci. Plant Nutr. 2021, 21, 2274–2284. [Google Scholar] [CrossRef]
- Nenova, L.; Benkova, M.; Simeonova, T.; Atanassova, I. Nitrogen, phosphorus and potassium content in maize dry biomass under the effect of different levels of mineral fertilization. Agric. Sci. Technol. 2019, 11, 311–316. [Google Scholar] [CrossRef]
- Lima, j.G.A.; Viana, T.V.A.; Sousa, G.G.; Wanderley, J.A.C.; Neto, L.G.P.; Azevedo, B.M. Crescimento inicial do milho fertirrigado com biofertilizante. Agropecuária Científica No Semiárido 2012, 8, 39–44. [Google Scholar]
- Spósito, T.H.N. Matéria Seca e Acúmulo de Nutrientes No Aguapé Utilizado para Fitorremediação em águas Residuárias de Suinocultura. Ph.D. Thesis, Faculdade de Engenharia de Ilha Solteira—UNESP, Ilha Solteira, Brazil, 2018. [Google Scholar]
- Medeiros, L.C. Dinâmica do Nitrogênio e Potássio Nos Resíduos Culturais de Milho Submetido à Adubação Mineral. Ph.D. Thesis, Universidade Federal da Paraíba, Areia, Brazil, 2018. [Google Scholar]
- Bezerra, A.K.P.; Lacerda, C.F.; Hernandez, F.F.F.; Silva, F.B.; Gheyi, H.R. Rotação cultural feijão caupi/milho utilizando-se águas de salinidades diferentes. Ciência Rural Santa Maria 2010, 40, 1075–1082. [Google Scholar] [CrossRef] [Green Version]
- Dutra, A.D. Adubação Nitrogenada via Fertirrigação em Arroz Irrigado por Aspersão. Ph.D. Thesis, Universidade Federal de Pelotas, Pelotas, Brazil, 2016. [Google Scholar]
- Simão, E.D.P.; Resende, A.V.; Gontijo Neto, M.M.; Borghi, E.; Martins, D.C.; Vanin, A. Demanda de nutrientes pelo milho safrinha em função da época de semeadura e adubação. Embrapa Milho Sorgo 2017, 16, 481–494. [Google Scholar] [CrossRef] [Green Version]
- Franco, H.C.J.; Trivelin, P.C.O.; Eduardo, F.C.; Vitti, A.C.; Otto, R. Stalk yield and technological attributes of planted cane as related to nitrogen fertilization. Sci. Agric. 2010, 67, 579–590. [Google Scholar] [CrossRef] [Green Version]
- Gloaguen, T.V.; Gonçalves, R.A.B.; Forti, M.C.; Lucas, Y.; Montes, C.R. Irrigation with domestic wastewater: A multivariate analysis of main soil changes. Rev. Bras. Ciência Solo 2010, 34, 1427–1434. [Google Scholar] [CrossRef] [Green Version]
- Cakmakci, T.; Sahin, U. Improving silage maize productivity using recycled wastewater under different irrigation methods. Agric. Water Manag. 2021, 255, 107051. [Google Scholar] [CrossRef]
- Pinheiro, R.C. Produtividade de Milho em Plantio Direto com Diferentes Doses de Adubação Química Associado à Adubação Biológica. Ph.D. Thesis, UniEvangélica, Anápolis, Brazil, 2018. [Google Scholar]
- Araújo, N.C.D.; Lima, V.L.A.D.; Sena, L.F.; Lima, G.S.D.; Andrade, E.M.G.; Cardoso, J.A.F.; Oliveira, S.J.C. Produção de milho Potiguar fertirrigado com água amarela e manipueira. Revista Ciências Agrárias 2019, 42, 161–170. [Google Scholar]
- Costa, Z.V.B.D.; Gurgel, M.T.; Costa, L.R.; Alves, S.M.C.; Ferreira Neto, M.; Batista, R.O. Efeito da aplicação de esgoto doméstico primário na produção de milho no assentamento Milagres (Apodi-RN). Revista Ambiente Água 2014, 9, 737–751. [Google Scholar]
- Cabral Filho, F.R. Desempenho Agronômico e Balanço Nutricional na Planta de Milho Fertirrigado com Vinhaça Concentrada e Cloreto de Potássio. Ph.D. Thesis, Instituto Federal Goiano—Campus Rio Verde, Rio Verde, Brazil, 2019. [Google Scholar]
- CONAB—Companhia Nacional De Abastecimento. Acompanhamento da Safra Brasileira de Grãos, v.6, Safra 2019/20—Nono Levantamento; CONAB: Brasília, Brazil, 2020. [Google Scholar]
- Locatelli, J.L.; Bratti, F.; Ribeiro, R.H.; Besen, M.R.; Turcatel, D.; Piva, J.T. Uso de dejeto líquido de suínos permite reduzir a adubação mineral na cultura do milho? Revista Ciências Agrárias 2019, 42, 628–637. [Google Scholar]
- Carvalho, N.L.; Zabot, V. Nitrogênio: Nutriente ou poluente? Rev. Eletrônica Gestão Educ. Tecnol. Ambient. 2012, 6, 960–974. [Google Scholar] [CrossRef]
- Peixoto, M.F.S.P. Ciclo do Nitrogênio; Biologia do solo; Universidade Federal do Recôncavo da Bahia, Centro de ciências agrárias, ambientais e biológicas, CCA-034: Cachoeira, Brazil, 2008; pp. 1–24. [Google Scholar]
- Vieira, R.F. Ciclo do nitrogênio em sistemas agrícolas. In Embrapa Meio Ambiente-Livro Científico, 1st ed.; Embrapa: Brasília, Brazil, 2017; pp. 1–163. [Google Scholar]
- Lane, D.R.; BassiriRad, H. Differential responses of tallgrass prairie species to nitrogen loading and varying ratios of NO3—to NH4+. Funct. Plant Biol. 2002, 29, 1227–1235. [Google Scholar] [CrossRef] [PubMed]
- Mueller, S.M.; Messina, C.D.; Vyn, T.J. Simultaneous gains in grain yield and nitrogen efficiency over 70 years of maize genetic improvement. Sci. Rep. 2019, 9, 9095. [Google Scholar] [CrossRef] [PubMed] [Green Version]
- Filho, F.R.C.; Soares, F.A.L.; Alves, D.K.M.; Teixeira, M.B.; Cunha, F.N.; da Silva, E.C.; Costa, C.T.S.; da Silva, N.F.; Cunha, G.N.; Cavalcante, W.S.D.S. Biomass Accumulation and Technical and Economic Efficiency of Potassium Sources Applied via Fertigation to Corn. Agriculture 2022, 12, 497. [Google Scholar] [CrossRef]
- Wen, B.; Xiao, W.; Mu, Q.; Li, D.; Chen, X.; Wu, H.; Li, L.; Peng, F. How does nitrate regulate plant senescence? Plant Physiol. Biochem. 2020, 157, 60–69. [Google Scholar] [CrossRef] [PubMed]
- Zhang, Z.; Xia, J.; Alfatih, A.; Song, Y.; Huang, Y.; Sun, L.; Wan, G.; Wang, S.; Wang, Y.; Hu, B.; et al. Rice NIN-LIKE PROTEIN 3 modulates nitrogen use efficiency and grain yield under nitrate-sufficient conditions. Plant Cell Environ. 2022, 45, 1520–1536. [Google Scholar] [CrossRef] [PubMed]
- Xing, Y.; Jiang, W.; He, X.; Fiaz, S.; Ahmad, S.; Lei, X.; Wang, W.; Wang, Y.; Wang, X. A review of nitrogen translocation and nitrogen-use efficiency. J. Plant Nutr. 2019, 42, 2624–2641. [Google Scholar] [CrossRef]
- Hu, Y.; Zeeshan, M.; Wang, G.; Pan, Y.; Liu, Y.; Zhou, X. Supplementary irrigation and varying nitrogen fertilizer rate mediate grain yield, soil-maize nitrogen accumulation and metabolism. Agric. Water Manag. 2023, 276, 108066. [Google Scholar] [CrossRef]
- Quan, Z.; Zhang, X.; Davidson, E.A.; Zhu, F.; Li, S.; Zhao, X.; Chen, X.; Zhang, L.; He, J.; Wei, W.; et al. Fates and Use Efficiency of Nitrogen Fertilizer in Maize Cropping Systems and Their Responses to Technologies and Management Practices: A Global Analysis on Field 15 N Tracer Studies. Earth’s Future 2021, 9, e2020EF001514. [Google Scholar] [CrossRef]
- Corrêa, R.S.; Barbosa, J.Z.; Poggere, G.C.; Magri, E.; de Oliveira, S.A. Grain and Foliar Nutritional Responses of Corn (Zea mays L.) to Sewage Sludge Soil Application. Waste Biomass-Valorization 2023, 14, 1–13. [Google Scholar] [CrossRef]
- Fernandes, J.N.V.; Dantas, M.S.M.; de Azevedo, B.M.; Fernandes, C.N.V.; Vasconcelos, D.V.; Araújo, I.C.D.S. Development of elephant grass in response to irrigation with different levels of domestic sewage. Rev. Ciência Agronômica 2022, 54, e20217846. [Google Scholar] [CrossRef]


| Ca | Mg | Ca + Mg | Al | H + Al | K | K | S | P | pH |
|---|---|---|---|---|---|---|---|---|---|
| cmolc·dm−3 | mg dm−3 | CaCl2 | |||||||
| 0.77 | 0.34 | 1.11 | 0.04 | 2.15 | 0.05 | 18 | 9.9 | 0.47 | 5.2 |
| Na | Fe | Mn | Cu | Zn | B | CTC | SB | V | m |
| Micronutrients (mg dm−3) | cmolc·dm−3 | % | % | ||||||
| - | 75.56 | 12.96 | 4.16 | 3.93 | - | 3.31 | 1.16 | 35 | 3.3 |
| Texture (g kg−1) | M.O. | Ca/Mg | Ca/K | Mg/K | Ca/CTC | Mg/CTC | K/CTC | ||
| Clay | Silt | Sand | g dm−3 | Relationship between bases | |||||
| 502 | 49 | 449 | 15.2 | 2.3 | 15.4 | 6.8 | 23.26 | 10.27 | 1.51 |
| Parameter | Wastewater | |
|---|---|---|
| Swine Farming | Fish Farming | |
| pH | 8.10 | 7.67 |
| Turbidity (NTU) | 280.00 | 3.79 |
| Temperature (°C) | 22.97 | 22.15 |
| Electrical conductivity (dS m−1) | 0.01 | 0.43 |
| Chemical oxygen demand (mg L−1) | 966.94 | 587.5 |
| Dissolved oxygen (mg L−1) | 3.43 | 4.60 |
| Total solids (mg L−1) | 5472.22 | 175.69 |
| Fixed solids (mg L−1) | 3822.92 | 73.29 |
| Volatile solids (mg L−1) | 1649.30 | 102.40 |
| Total nitrogen (mg L−1) | 478.92 | 91.17 |
| Ammonia (mg L−1) | 408.08 | 30.00 |
| Nitrite (mg L−1) | <0.01 | <0.01 |
| Nitrate (mg L−1) | 41.00 | 37.00 |
| Nitrogen-Kjeldahl (mg L−1) | 437.92 | 54.17 |
| Organic nitrogen (mg L−1) | 29.12 | 24.17 |
| Phosphorus (mg L−1) | 9.19 | 5 |
| Potassium (mg L−1) | 147.49 | 21.0 |
| Calcium (mg L−1) | 26.65 | 11.9 |
| Magnesium (mg L−1) | 26.65 | 11.9 |
| PV 1 | DF | MS | |||
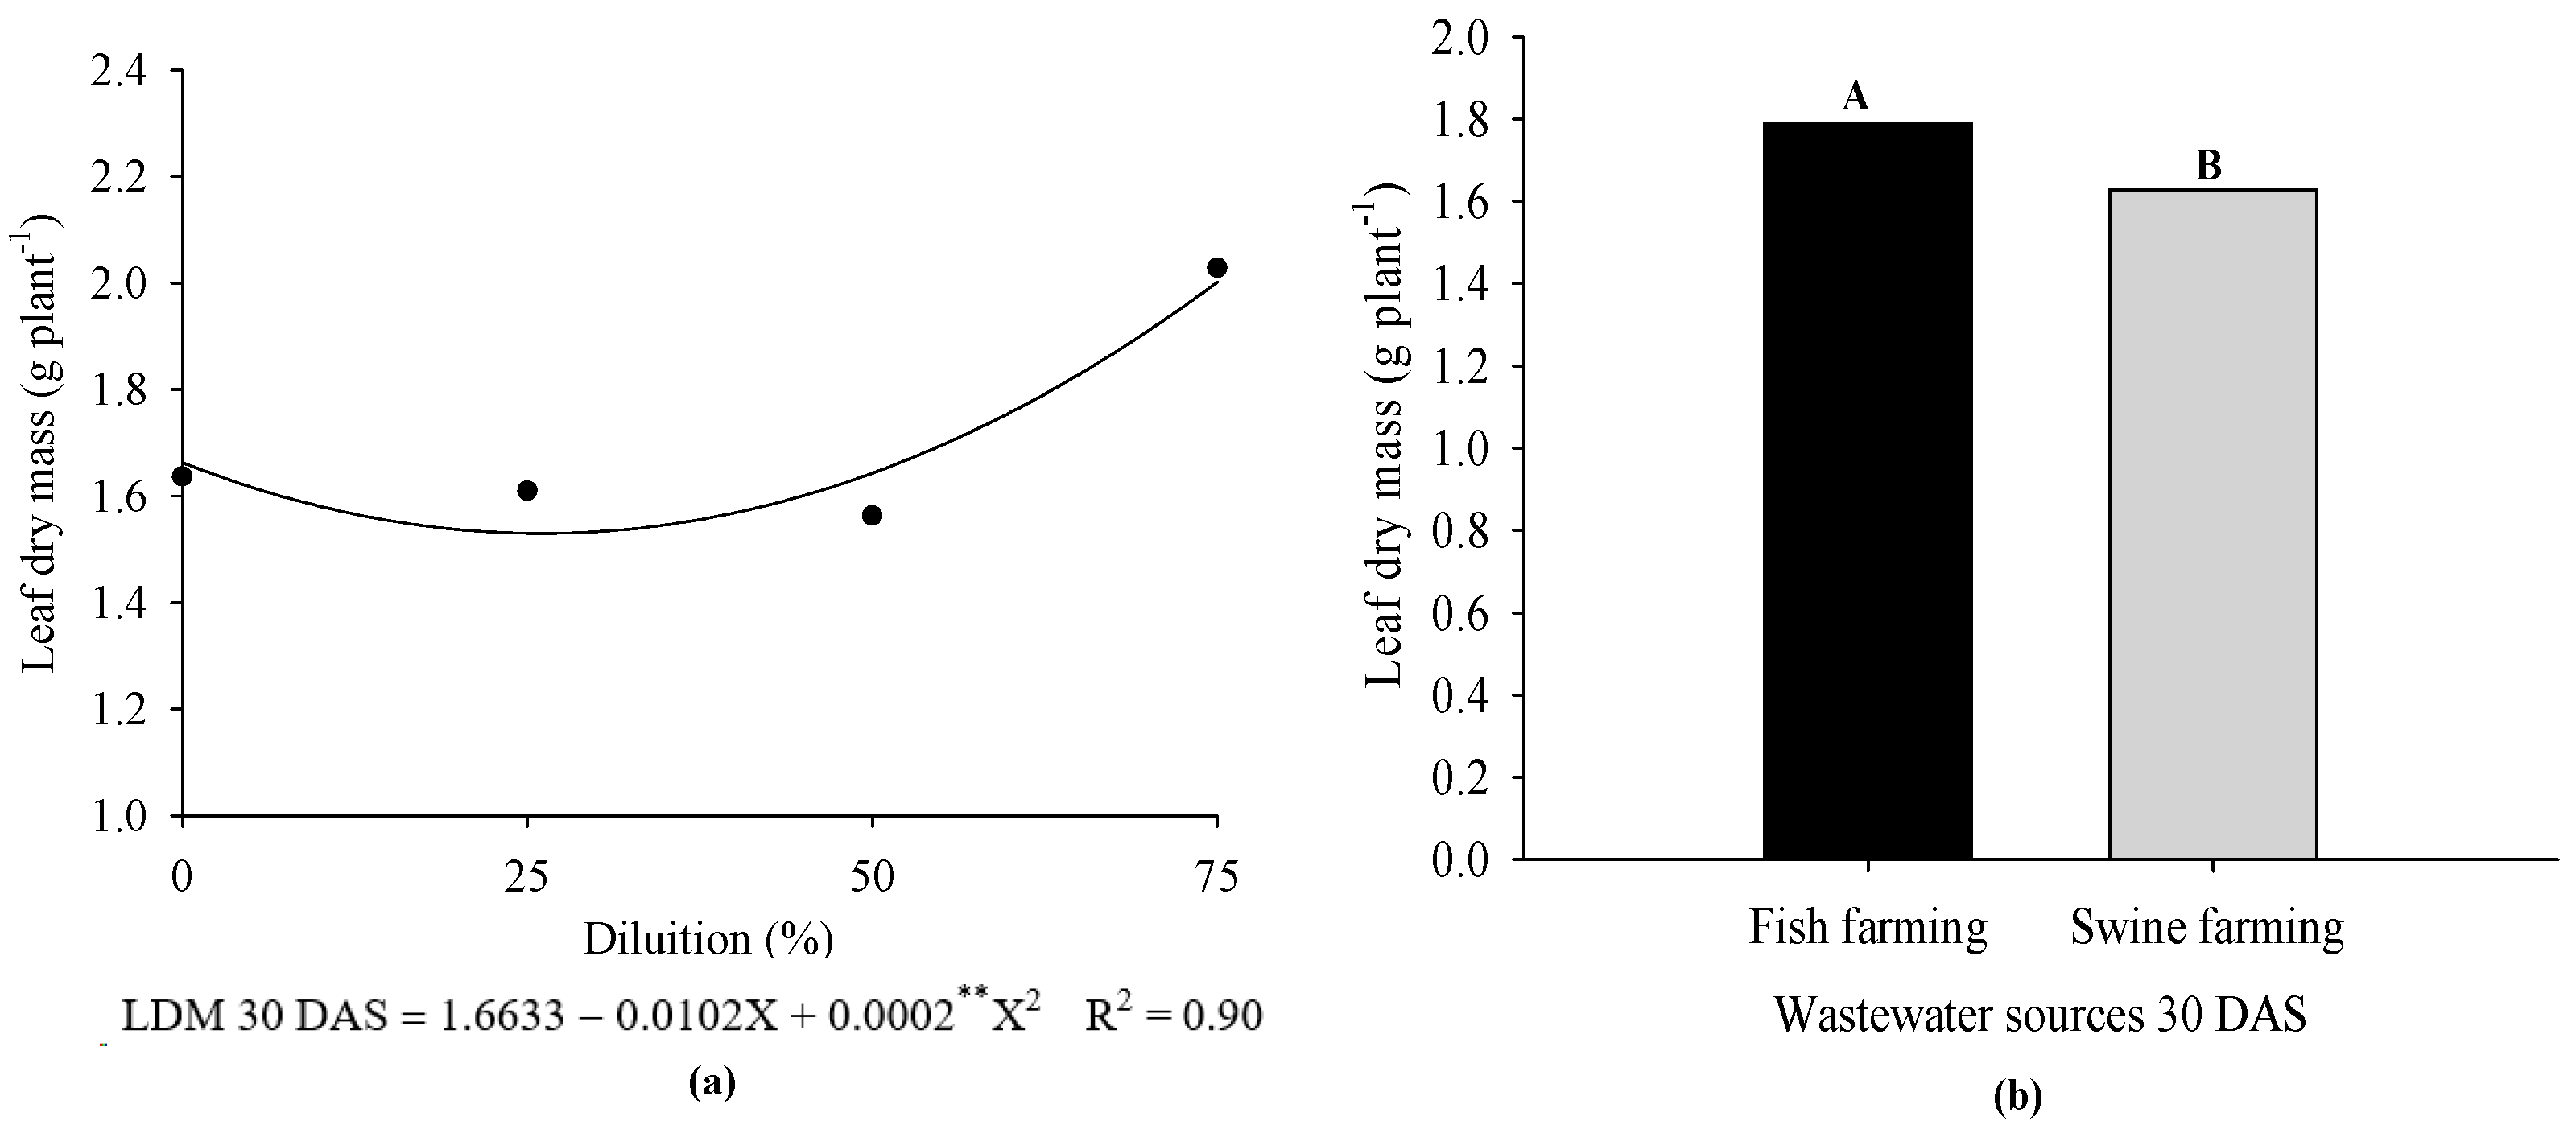
| Leaf dry matter (days after sowing) | |||||
| 30 | 60 | 90 | 110 | ||
| DR | 3 | 0.0000002 * | 0.000053 * | 0.000220 ns | 0.000590 ns |
| Block | 2 | 0.00000002 ns | 0.000008 ns | 0.000007 ns | 0.000019 ns |
| Residue 1 | 6 | 0.00000003 | 0.000008 | 0.000007 | 0.000047 |
| WS | 1 | 0.0000002 * | 0.000104 ** | 0.000021 ns | 0.000013 ns |
| DR × WS | 3 | 0.00000004 ns | 0.000025 ns | 0.000013 ns | 0.000015 ns |
| Residue 2 | 8 | 0.0000002 | 0.000009 | 0.000011 | 0.000023 |
| CV 1 (%) | - | 10.25 | 9.62 | 6.87 | 14.16 |
| CV 2 (%) | - | 7.73 | 10.34 | 8.83 | 9.85 |
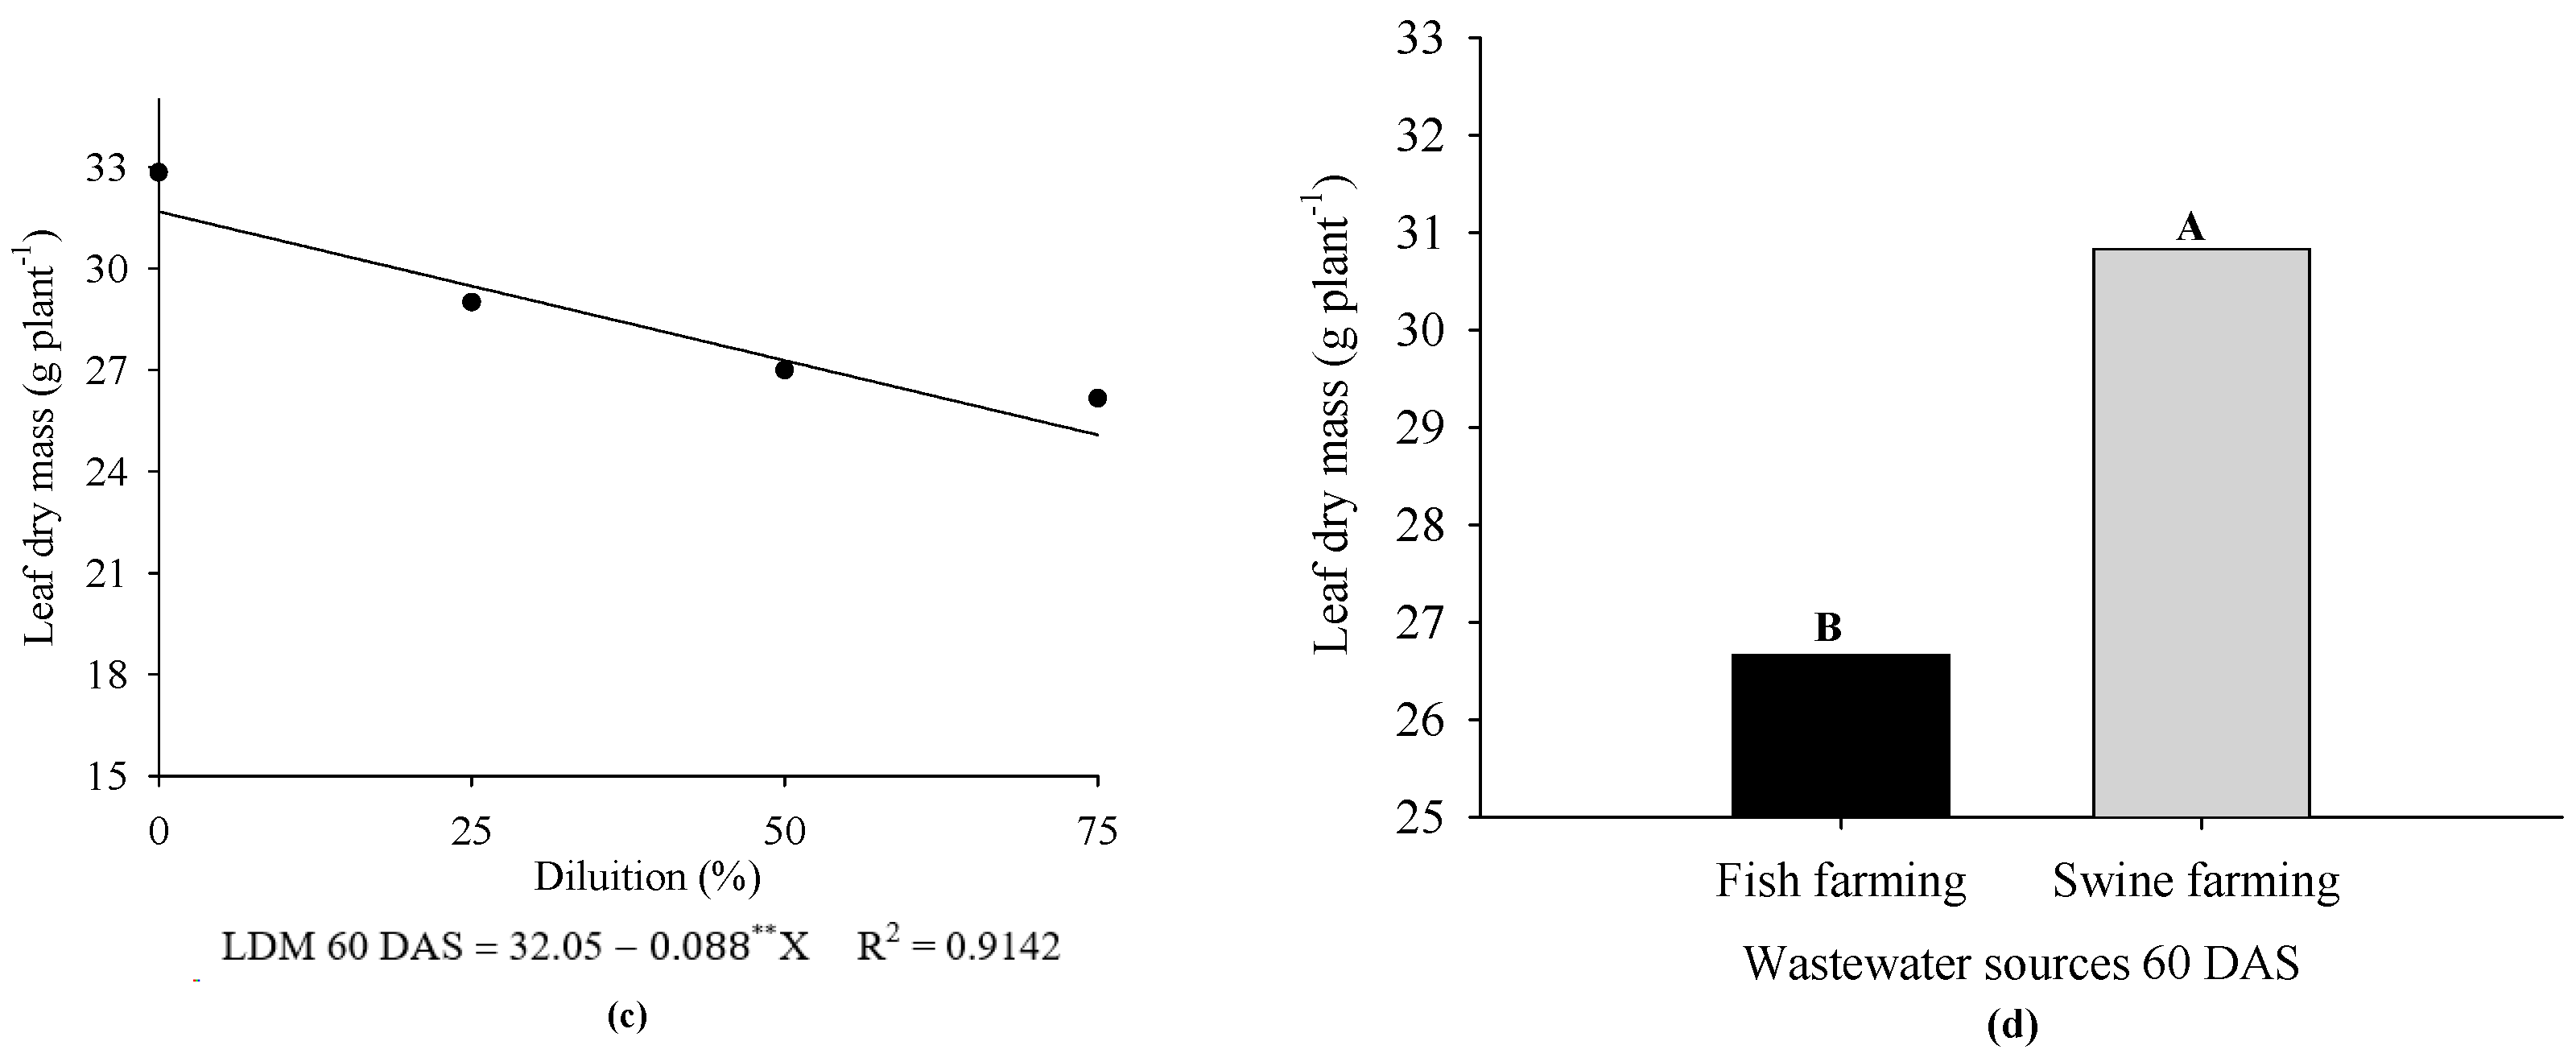
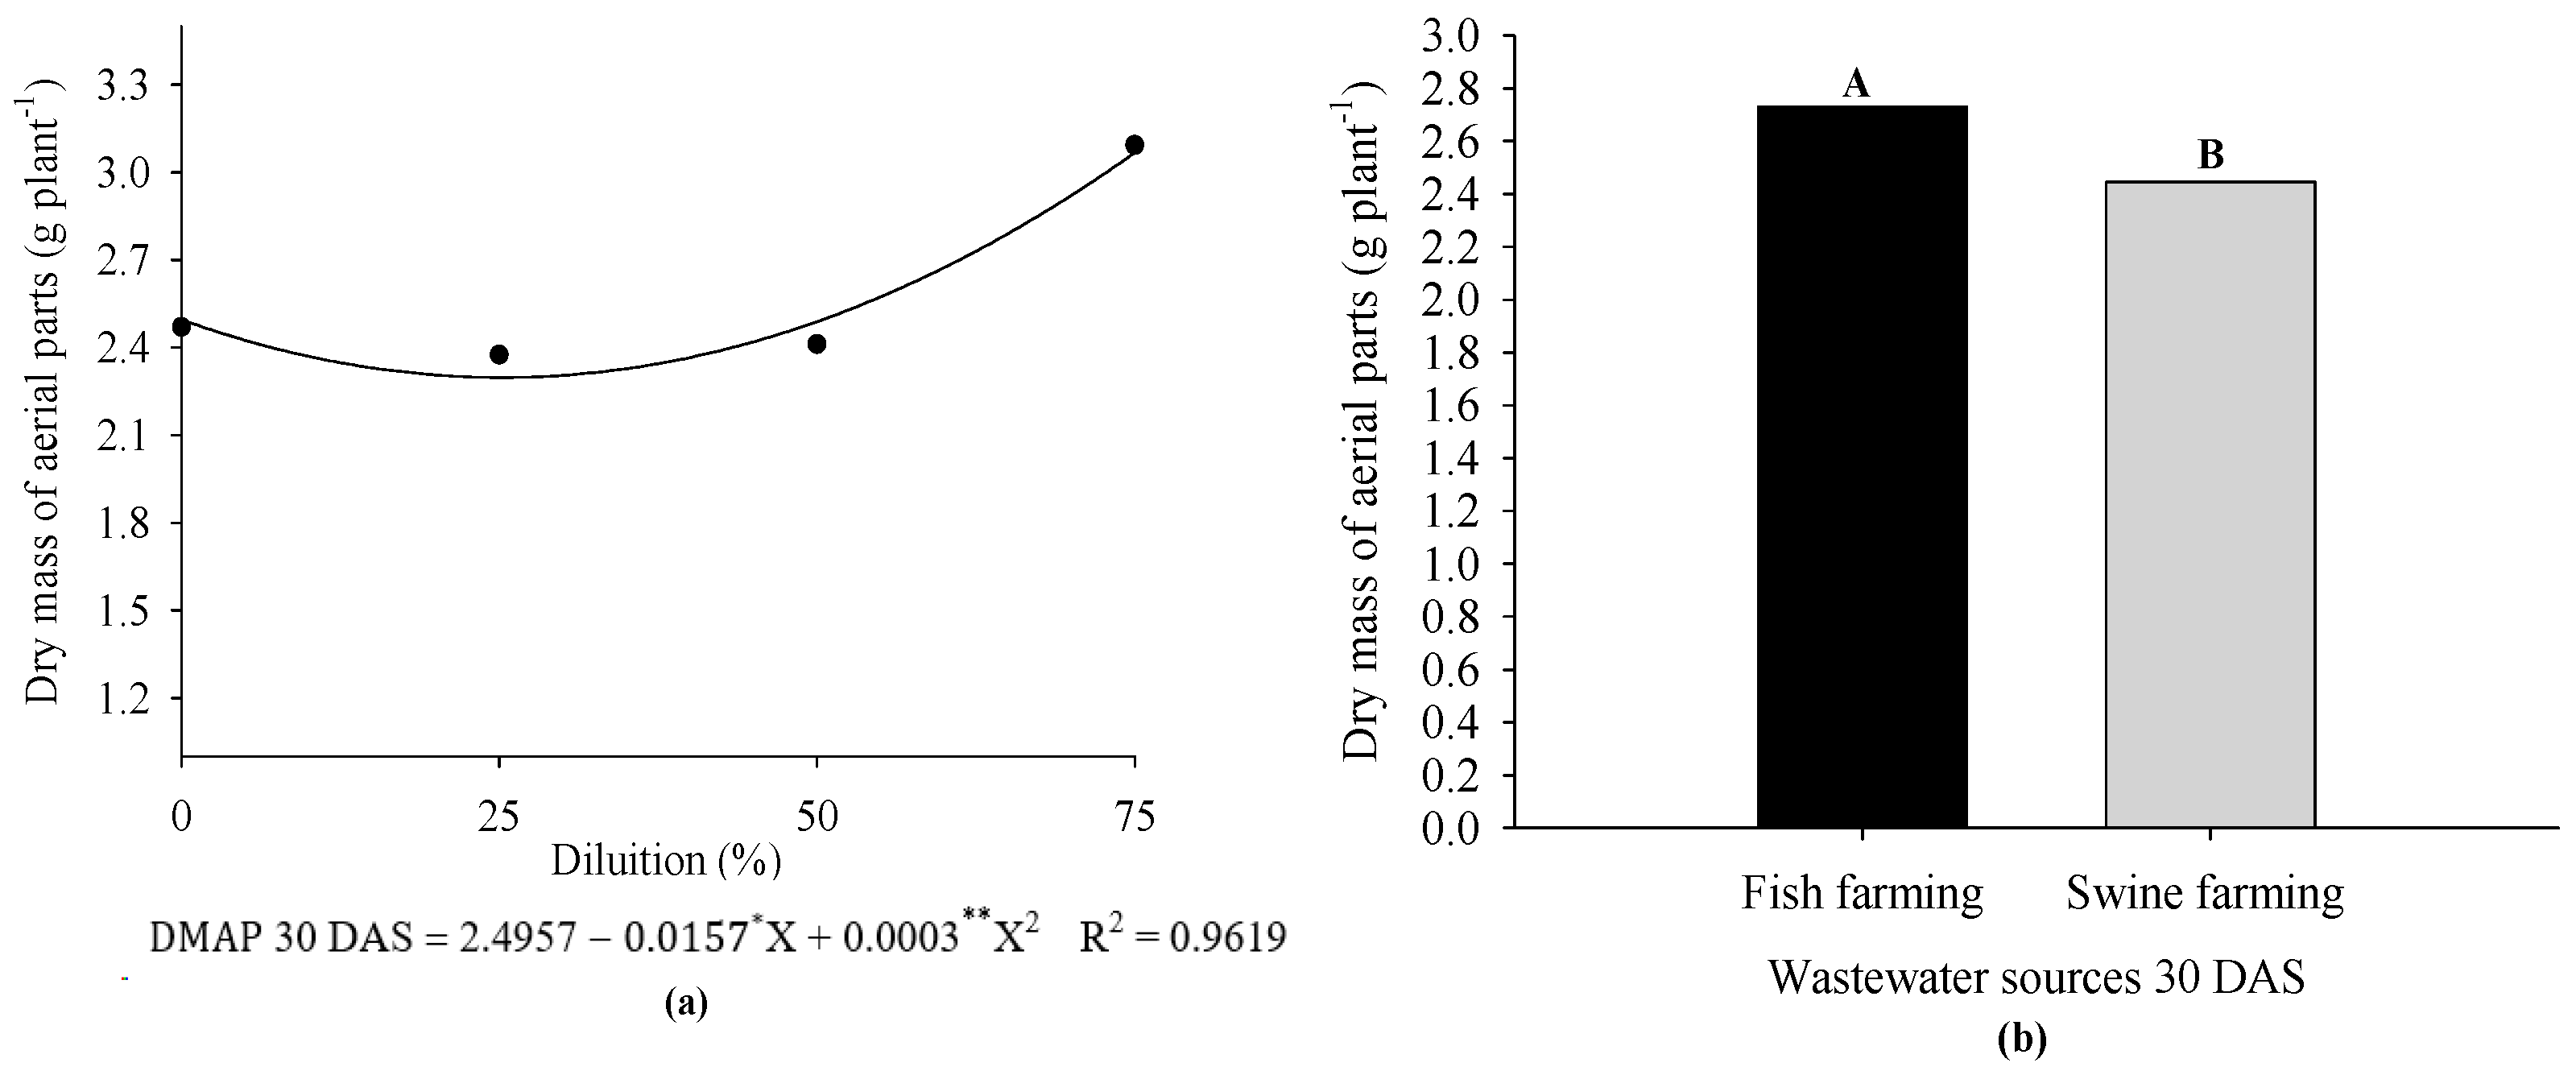
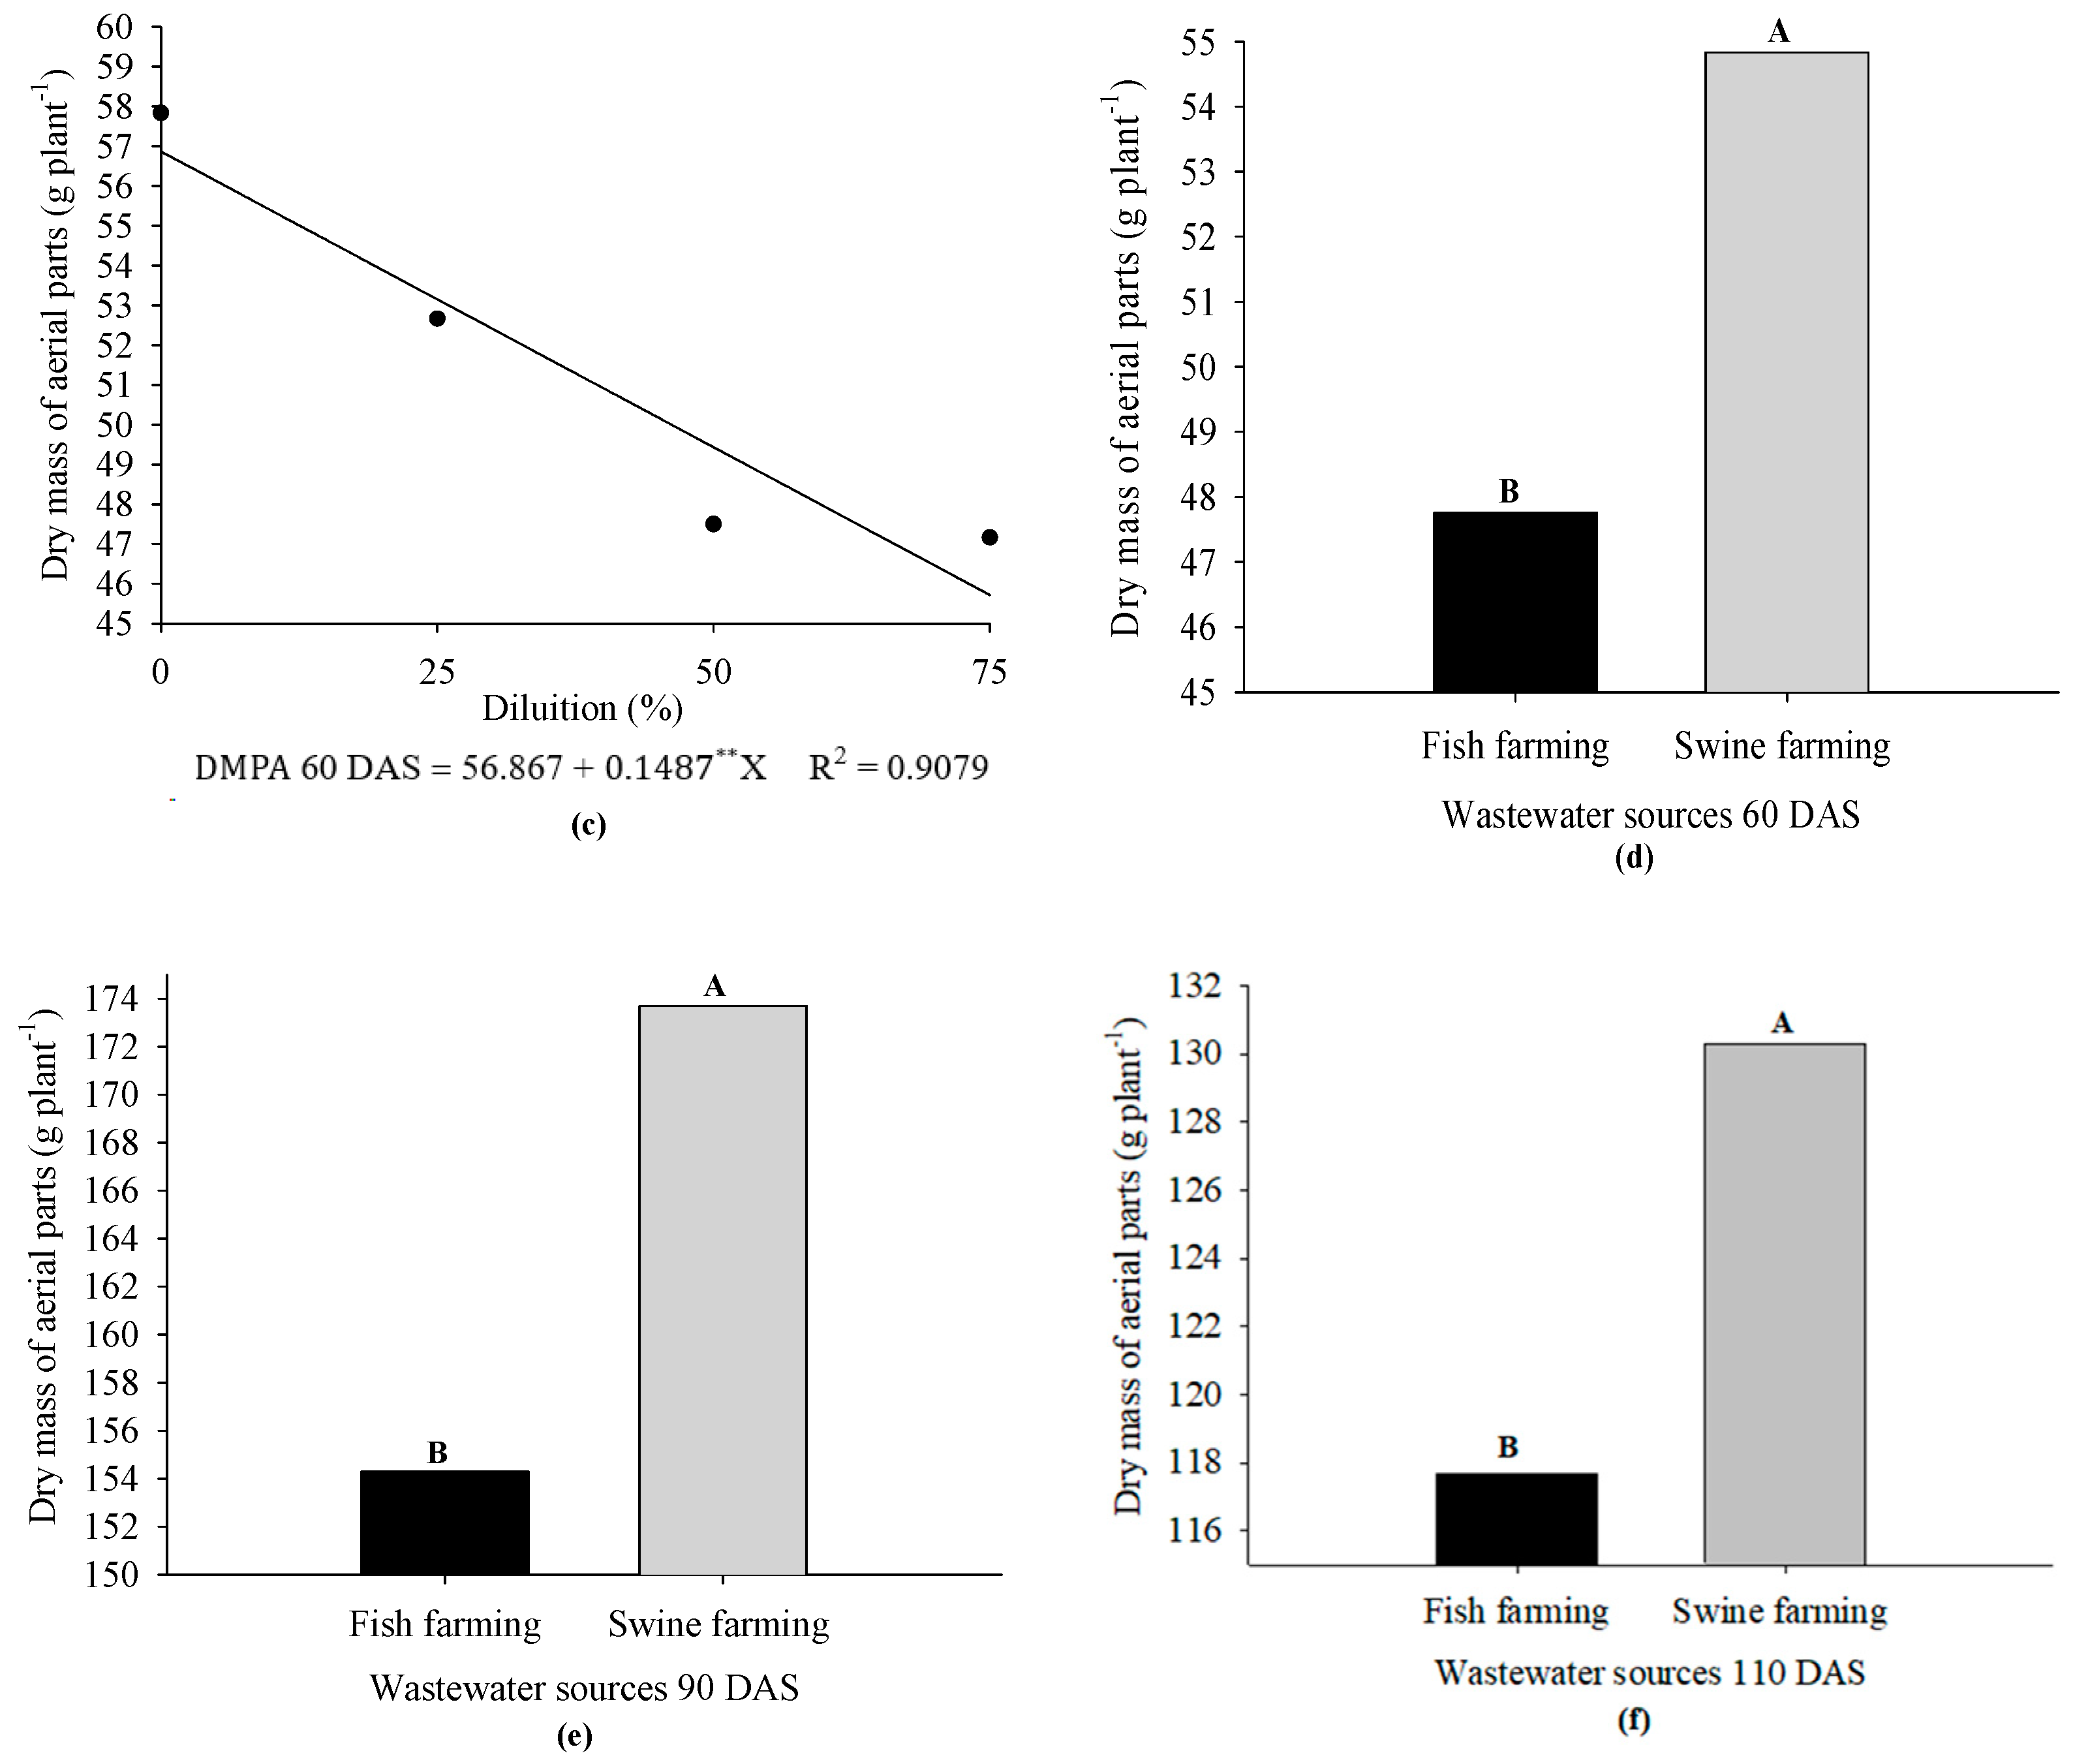
| PV 1 | DF | MS | |||
| Dry mass of the aerial part (days after sowing) | |||||
| 30 | 60 | 90 | 110 | ||
| DR | 3 | 0.0000007 ** | 0.00015 * | 0.00088 ns | 0.000030 ns |
| Block | 2 | 0.00000005 ns | 0.000071 ns | 0.000086 ns | 0.000085 ns |
| Residue 1 | 6 | 0.00000005 | 0.000017 | 0.00059 | 0.00017 |
| WS | 1 | 0.0000005 ** | 0.00030 * | 0.00226 * | 0.00087 * |
| DR × WS | 3 | 0.00000009 ns | 0.000081 ns | 0.00032 ns | 0.00010 ns |
| Residue 2 | 8 | 0.0000003 | 0.000031 | 0.00032 | 0.00013 |
| CV 1 (%) | - | 8.21 | 8.05 | 14.87 | 10.60 |
| CV 2 (%) | - | 6.30 | 10.93 | 11.02 | 9.16 |
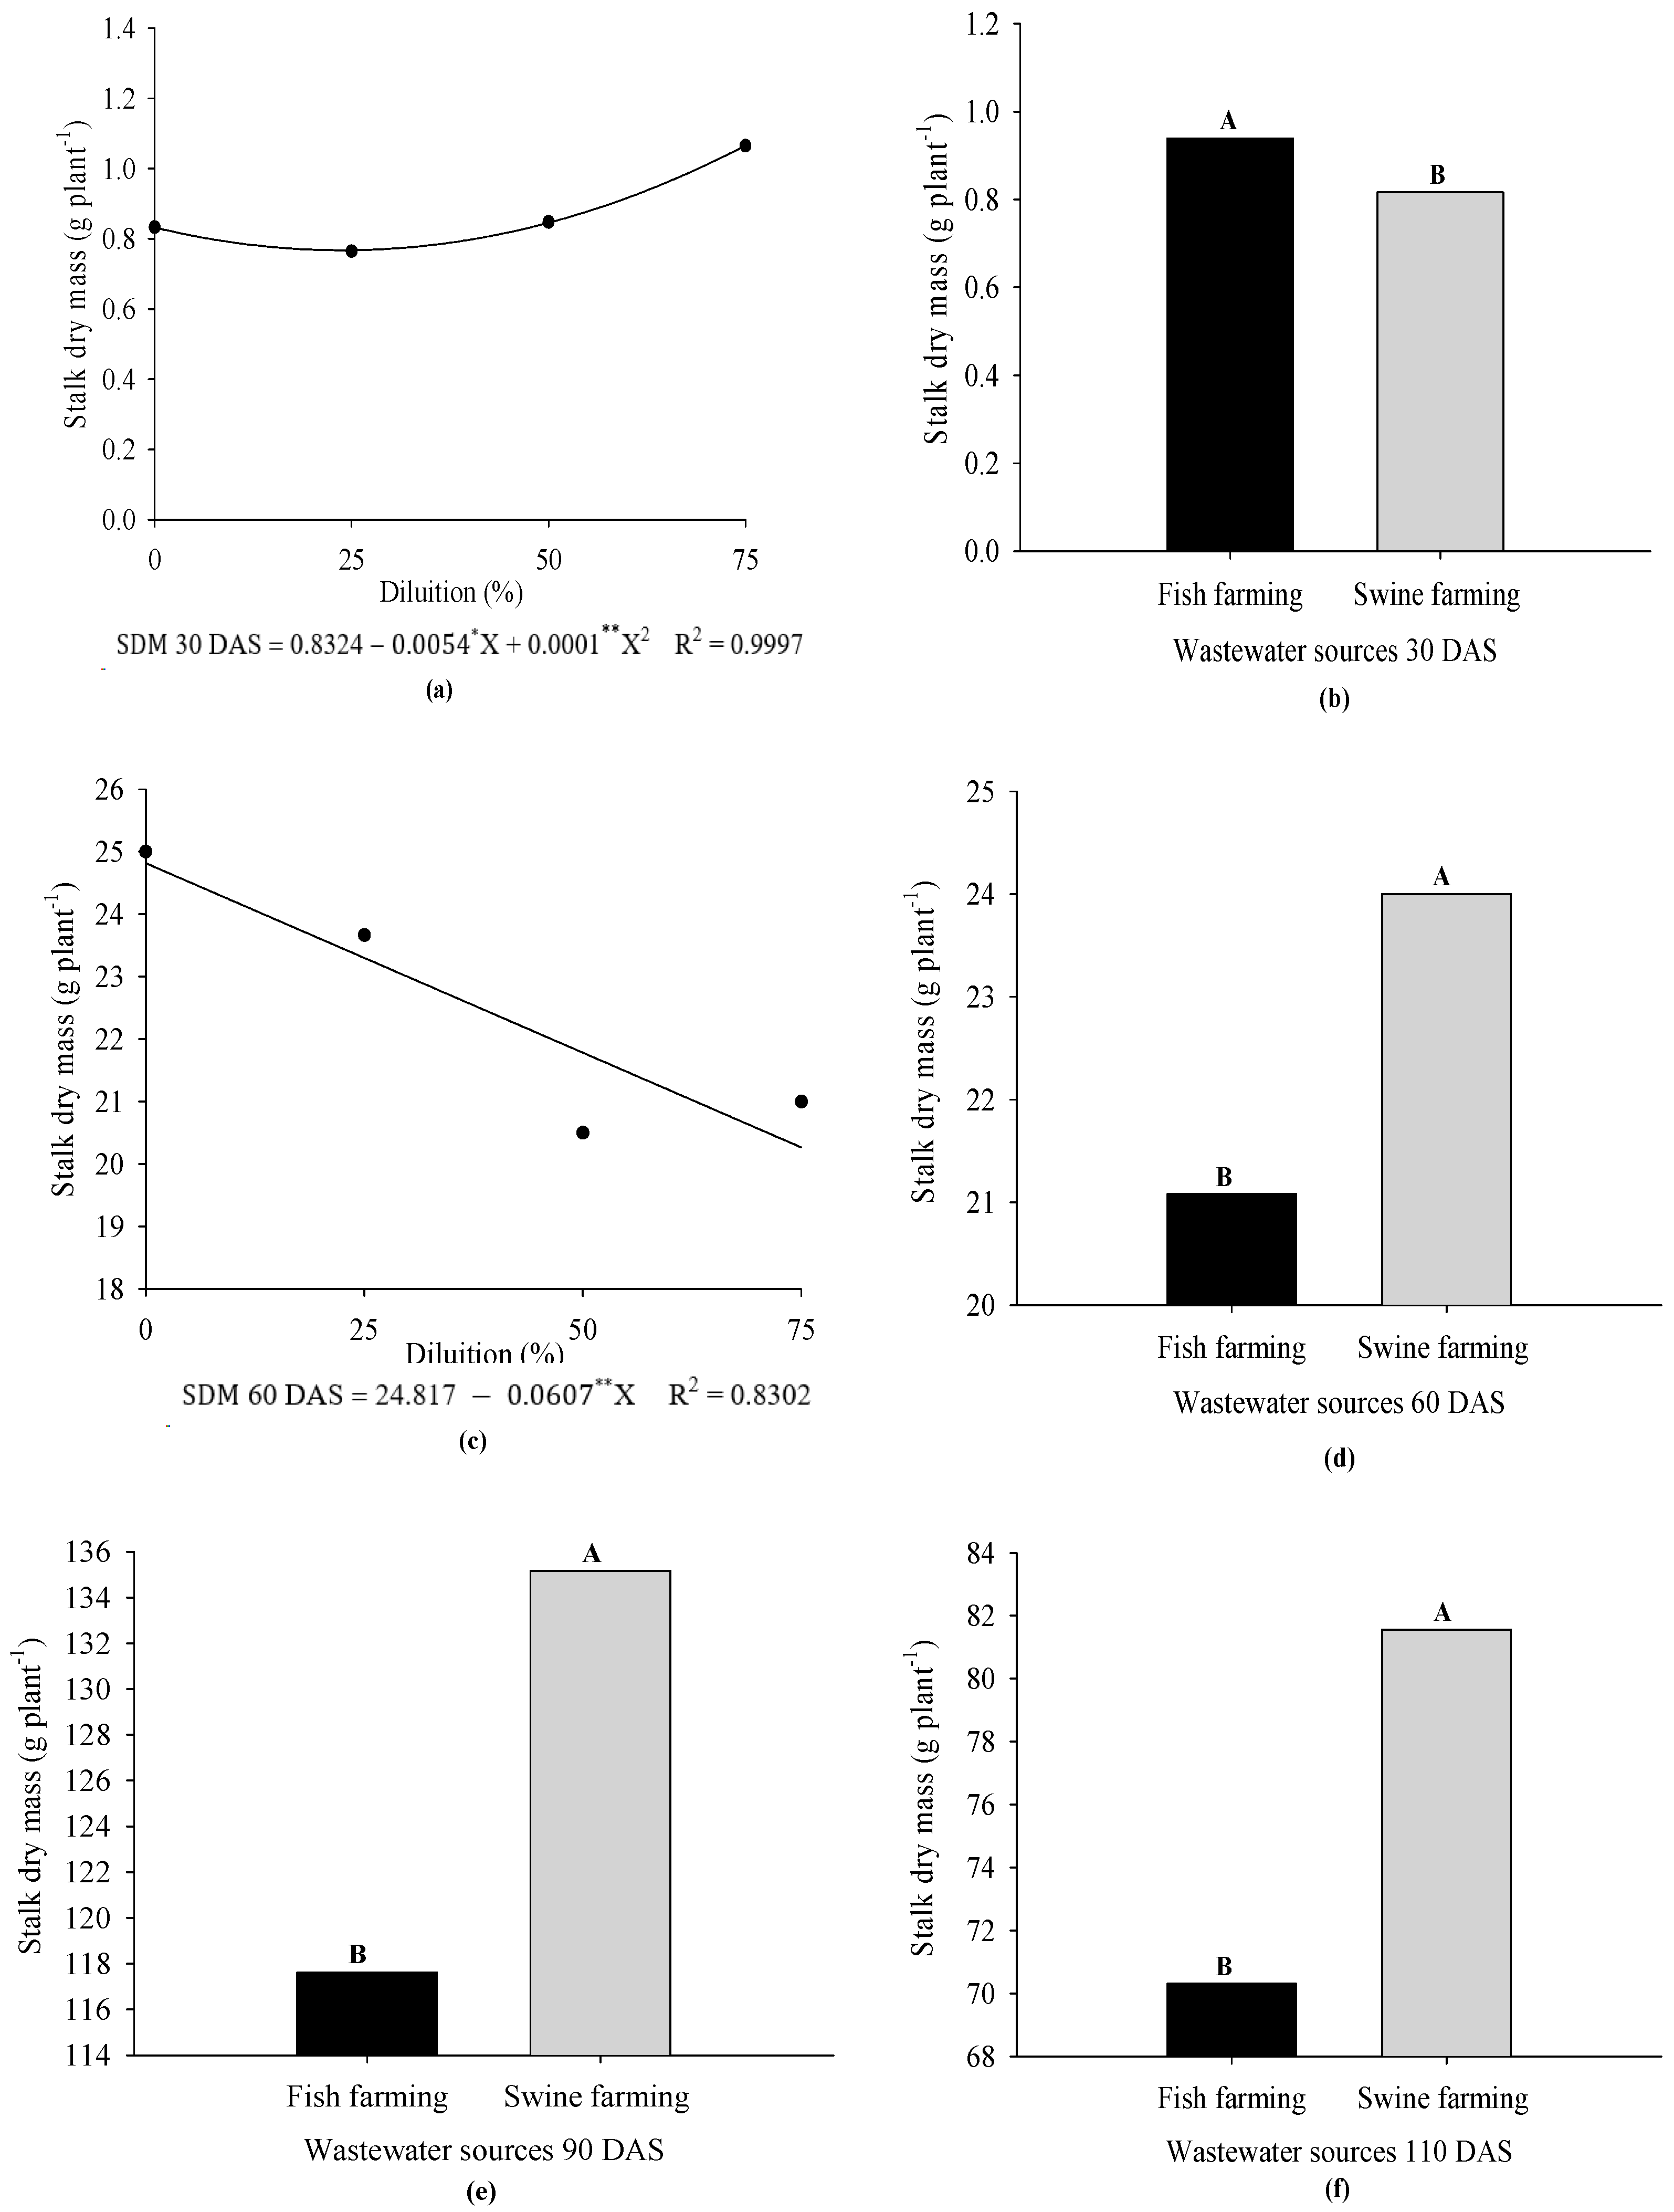
| PV 1 | DF | MS | |||
| Stalk dry mass (days after sowing) | |||||
| 30 | 60 | 90 | 110 | ||
| DR | 3 | 0.0000001 ** | 0.000028 * | 0.000851 ns | 0.000078 ns |
| Block | 2 | 0.000000009 ns | 0.000031 * | 0.000107 ns | 0.000104 ns |
| Residue 1 | 6 | 0.000000005 | 0.000003 | 0.00052 | 0.000058 |
| WS | 1 | 0.00000009 ** | 0.000051 * | 0.001846 * | 0.000776 * |
| DR × WS | 3 | 0.00000002 ns | 0.000017 ns | 0.000266 ns | 0.000123 ns |
| Residue 2 | 8 | 0.000000007 | 0.000008 | 0.000253 | 0.000070 |
| CV 1 (%) | - | 7.75 | 7.95 | 18.08 | 9.96 |
| CV 2 (%) | - | 9.51 | 12.65 | 12.59 | 10.95 |
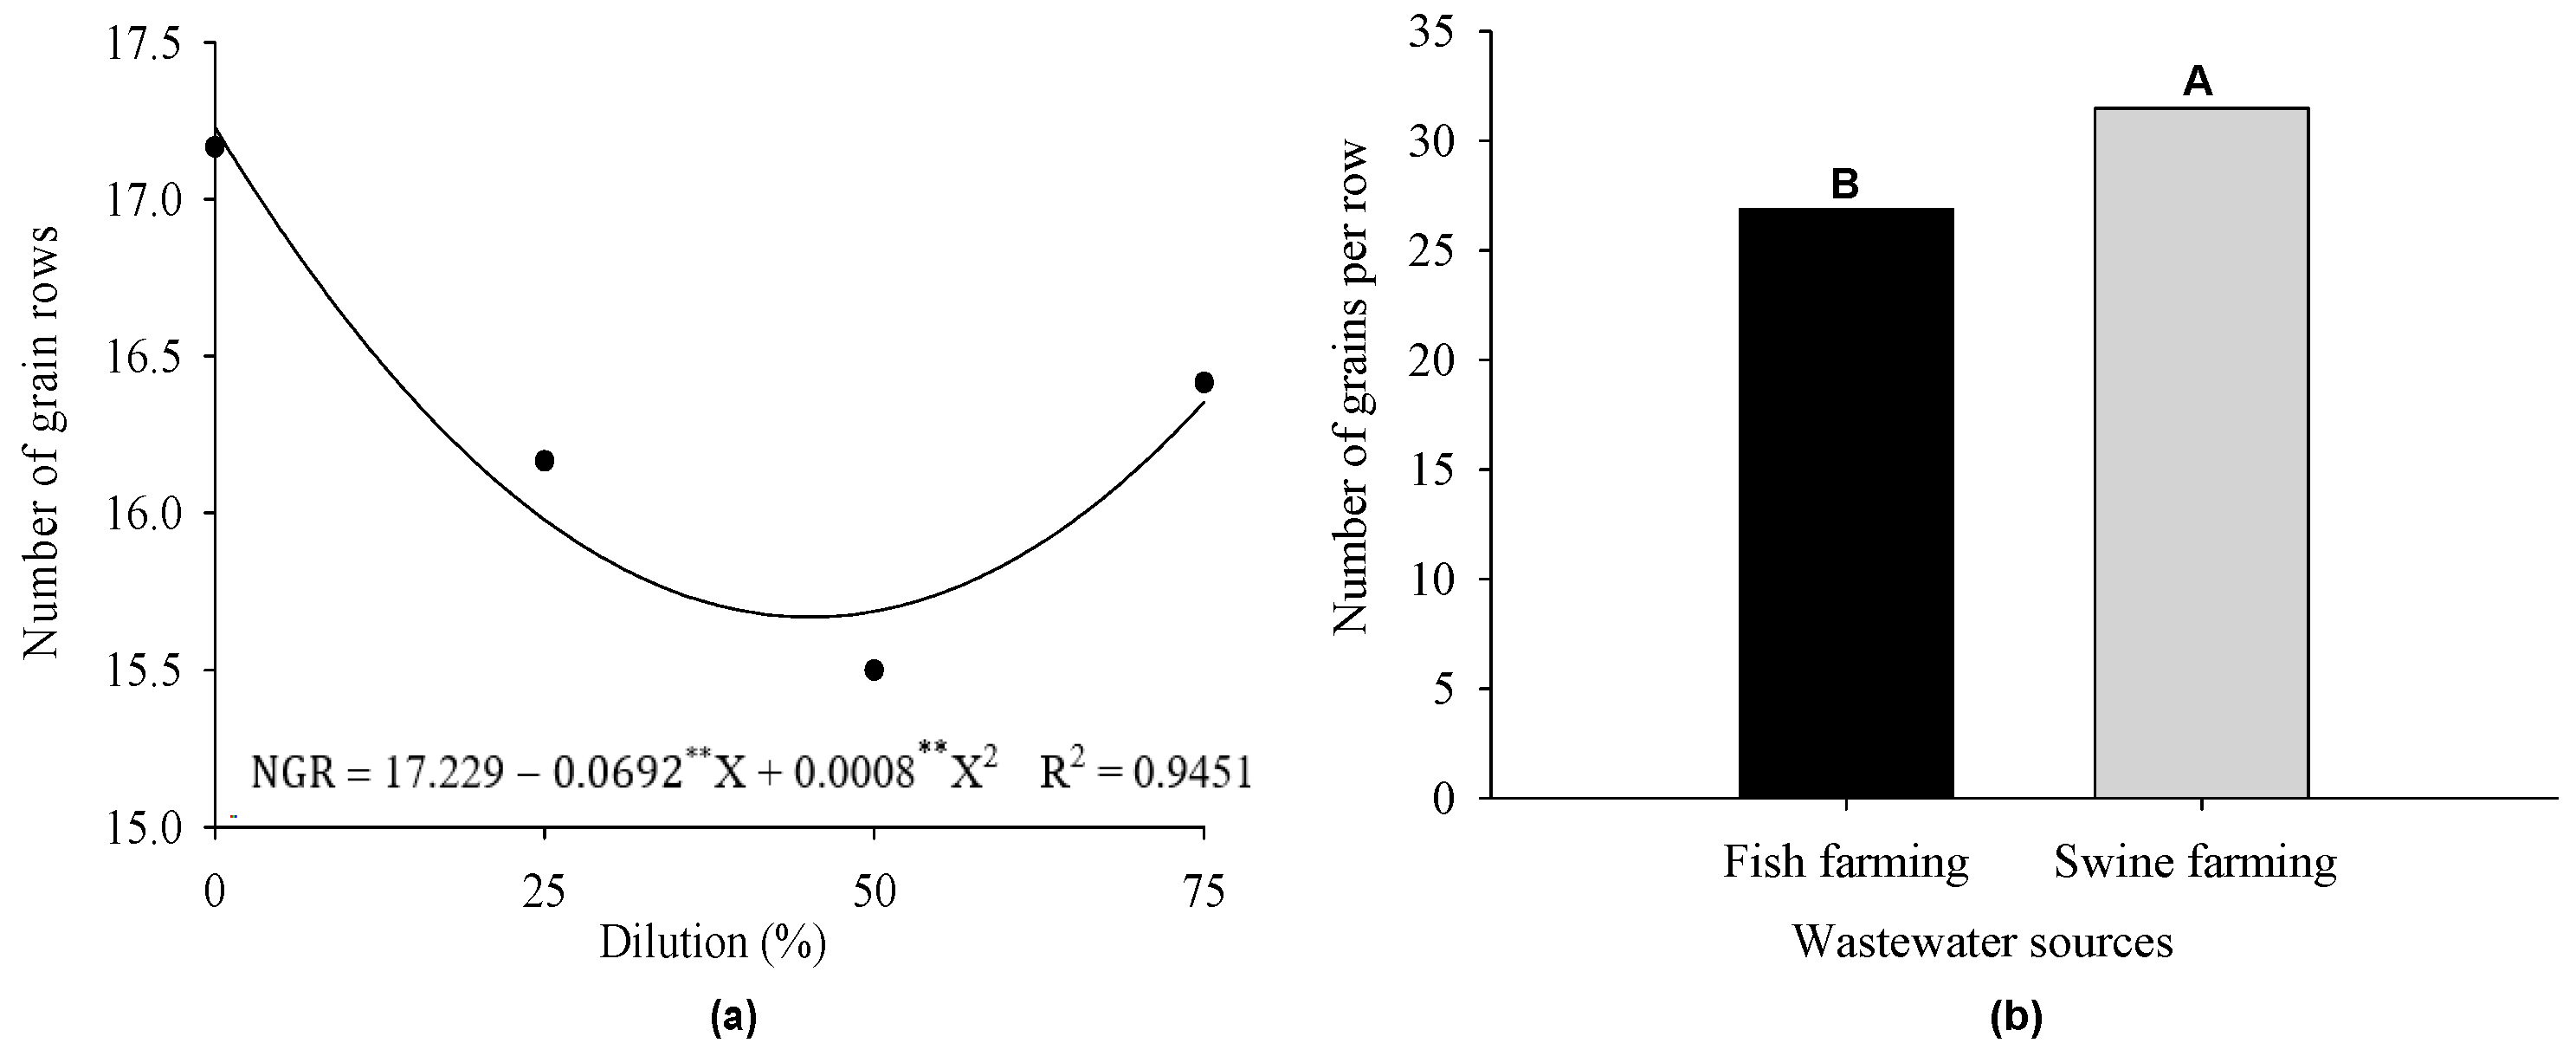
| PV 1 | DF | MS | |||||
|---|---|---|---|---|---|---|---|
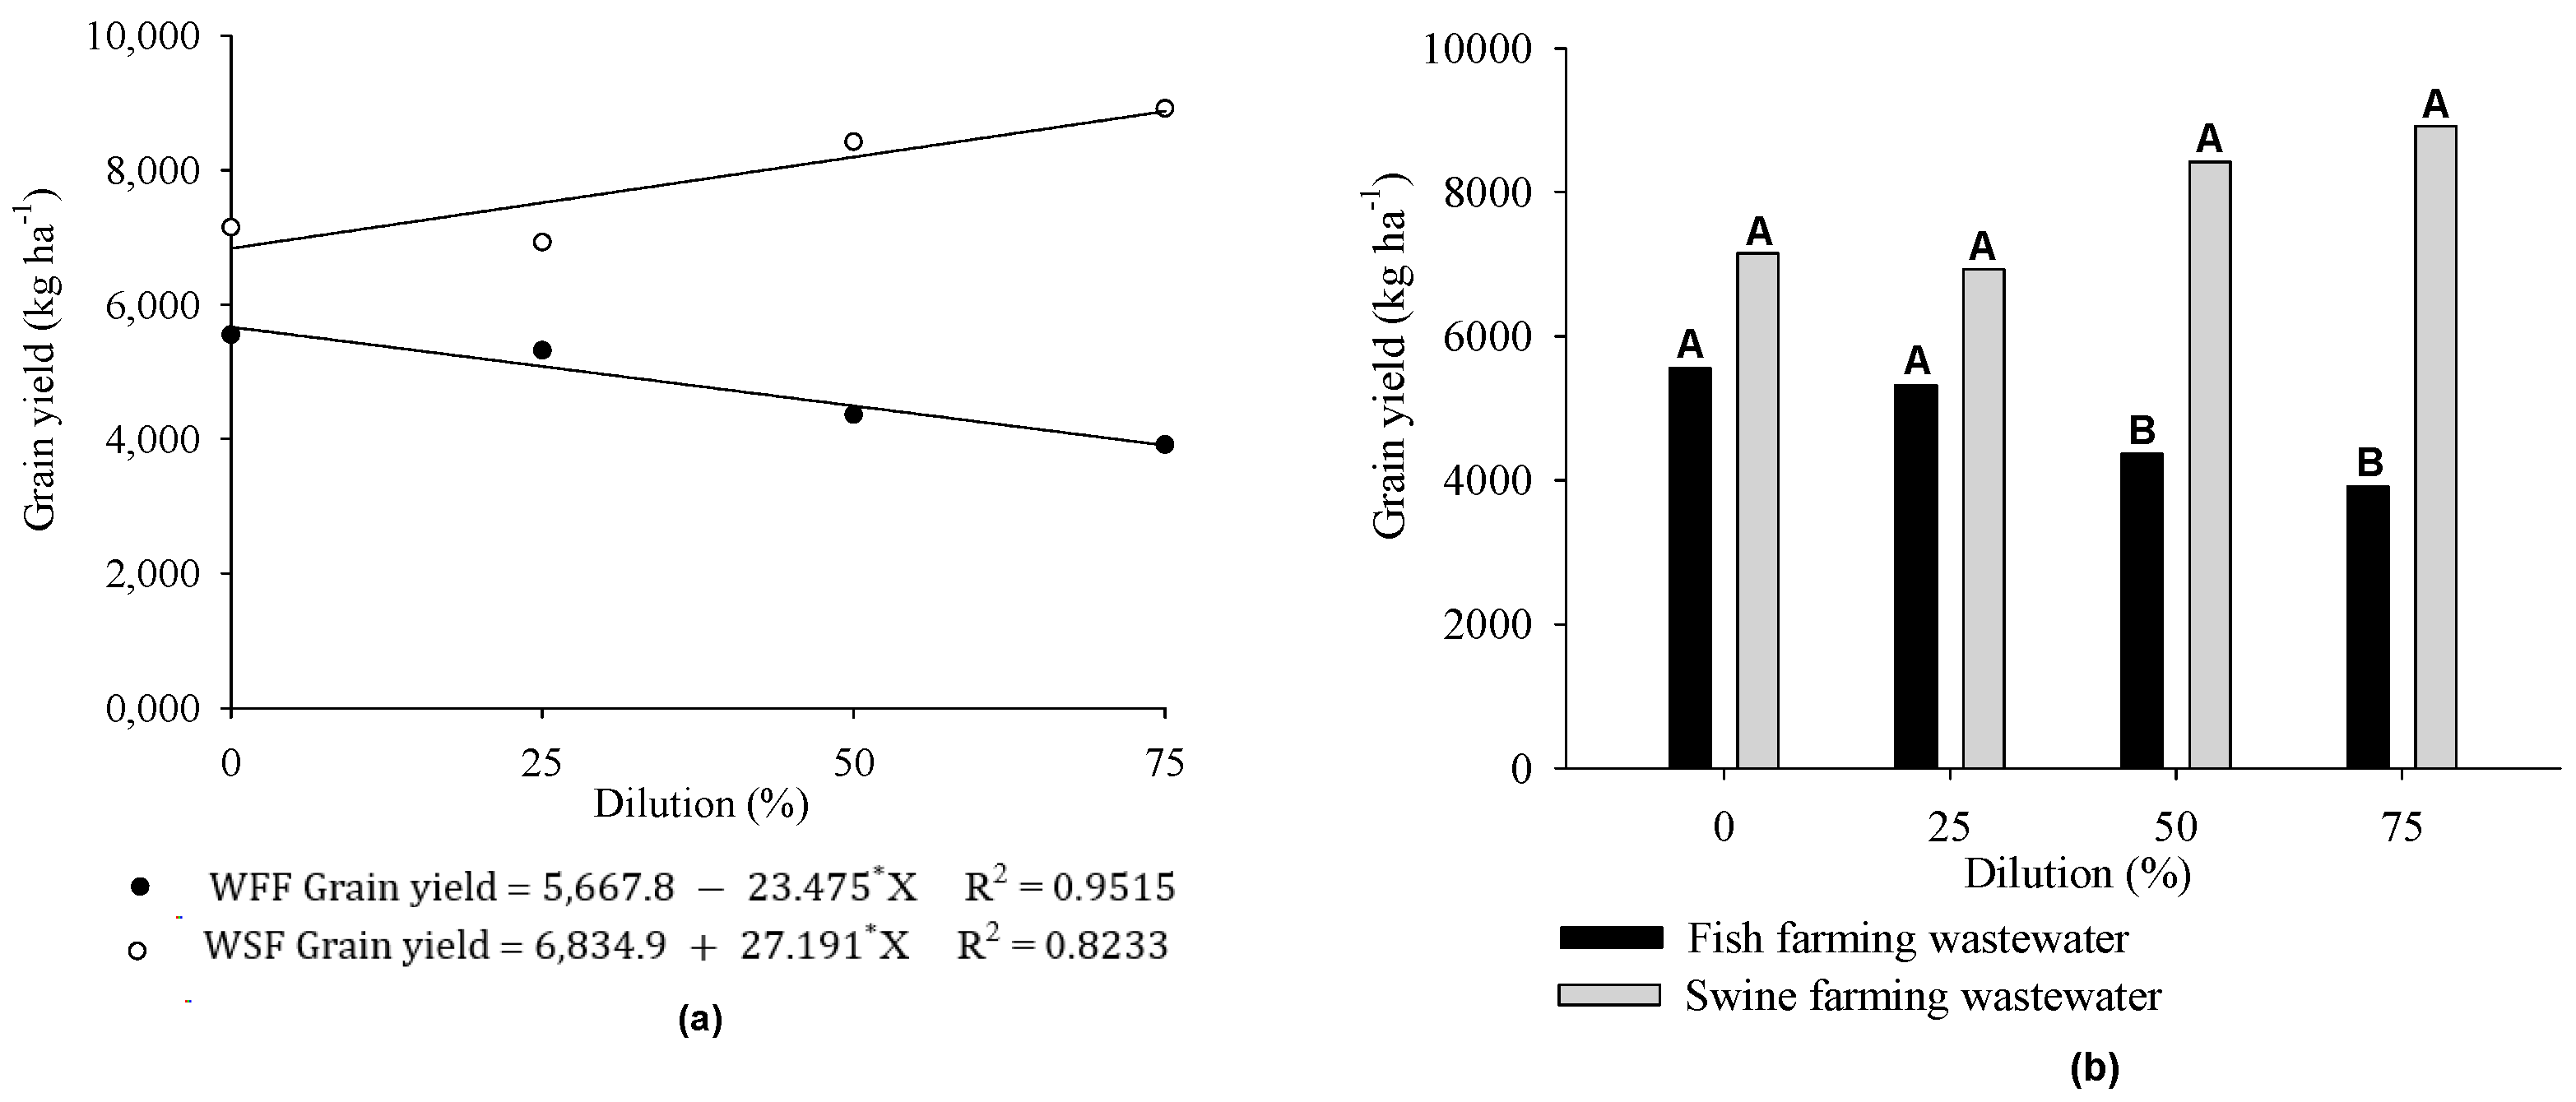
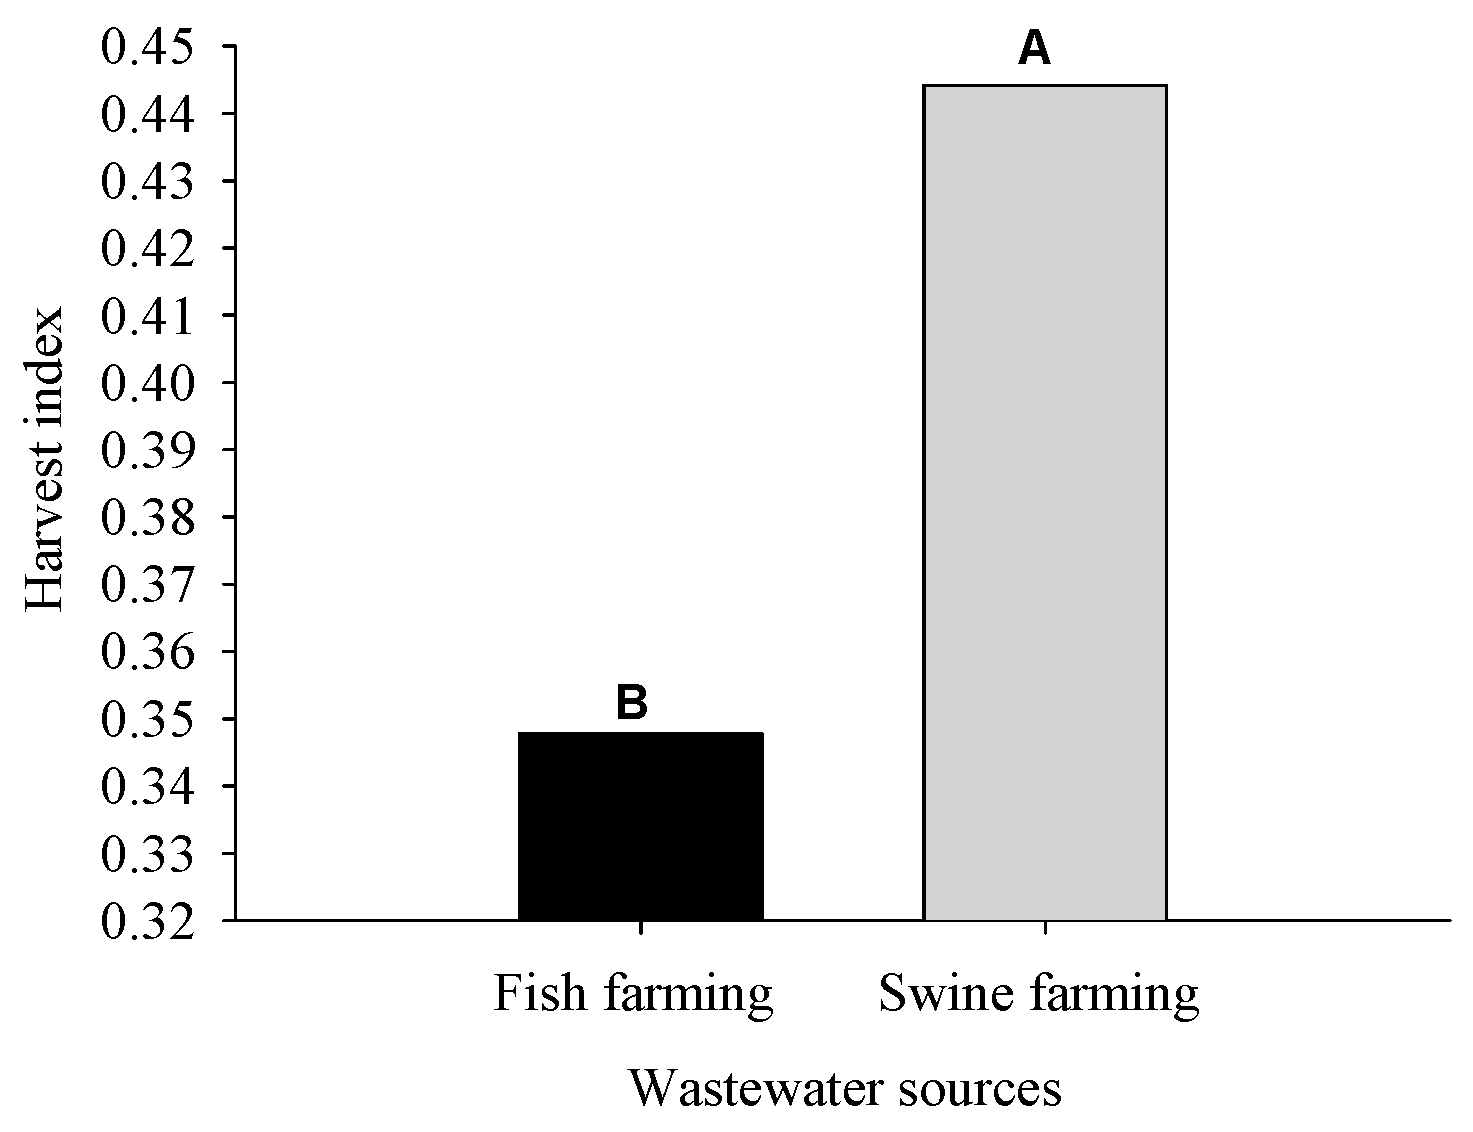
| NGR | NGPR | GS | GDW | GY | HI | ||
| DR | 3 | 2.84 * | 9.44 ns | 1.52 ** | 15.44 | 107606 ns | 29.89 ns |
| Block | 2 | 0.40 ns | 1.44 ns | 0.06 ns | 44.22 ns | 332530 ns | 92.36 ns |
| Residue 1 | 6 | 0.24 | 6.03 | 0.08 | 124.31 | 601896 | 167.19 |
| WS | 1 | 0.26 ns | 127.19 * | 10.18 ** | 10290 ns | 56441257 ns | 15678 * |
| DR × WS | 3 | 4.87 ns | 23.13 ns | 3.44 ** | 856.81 ** | 4508573 ** | 1252 ns |
| Residue 2 | 8 | 1.78 | 15.63 | 0.21 | 154.99 | 905647 | 251.56 |
| CV 1 (%) | - | 3.00 | 8.42 | 3.77 | 13.27 | 12.27 | 12.50 |
| CV 2 (%) | - | 8.18 | 13.55 | 5.90 | 14.82 | 15.06 | 17.02 |
Disclaimer/Publisher’s Note: The statements, opinions and data contained in all publications are solely those of the individual author(s) and contributor(s) and not of MDPI and/or the editor(s). MDPI and/or the editor(s) disclaim responsibility for any injury to people or property resulting from any ideas, methods, instructions or products referred to in the content. |
© 2023 by the authors. Licensee MDPI, Basel, Switzerland. This article is an open access article distributed under the terms and conditions of the Creative Commons Attribution (CC BY) license (https://creativecommons.org/licenses/by/4.0/).
Share and Cite
Alves, D.K.M.; Teixeira, M.B.; Cunha, F.N.; Cabral Filho, F.R.; Cunha, G.N.; Andrade, C.L.L.d. Grain Yield of Maize Crops under Nitrogen Fertigation Using Wastewater from Swine and Fish Farming. Agronomy 2023, 13, 1834. https://doi.org/10.3390/agronomy13071834
Alves DKM, Teixeira MB, Cunha FN, Cabral Filho FR, Cunha GN, Andrade CLLd. Grain Yield of Maize Crops under Nitrogen Fertigation Using Wastewater from Swine and Fish Farming. Agronomy. 2023; 13(7):1834. https://doi.org/10.3390/agronomy13071834
Chicago/Turabian StyleAlves, Daniely Karen Matias, Marconi Batista Teixeira, Fernando Nobre Cunha, Fernando Rodrigues Cabral Filho, Gabriela Nobre Cunha, and Christiano Lima Lobo de Andrade. 2023. "Grain Yield of Maize Crops under Nitrogen Fertigation Using Wastewater from Swine and Fish Farming" Agronomy 13, no. 7: 1834. https://doi.org/10.3390/agronomy13071834