Article

Effect of Irrigation Water Salinity on Soil Characteristics and Microbial Communities in Cotton Fields in Southern Xinjiang, China

1
Key Laboratory of Agricultural Soil and Water Engineering in Arid and Semiarid Areas, Ministry of Education, Northwest A&F University, Yangling 712100, China
2
Xinjiang Institute of Water Resources and Hydropower Research, Urumqi 830049, China
*
Authors to whom correspondence should be addressed.
Agronomy 2023, 13(7), 1679; https://doi.org/10.3390/agronomy13071679
Submission received: 29 May 2023 / Revised: 16 June 2023 / Accepted: 21 June 2023 / Published: 22 June 2023

Abstract

:
Irrigation with saline water is a possible solution to alleviate freshwater shortages. The long-term use of saline water for irrigation requires consideration of the influence of salt on the environmental conditions of the soil. The objective of this field study was to determine the effects of three continuous years of saline water irrigation on physiochemical properties and microbial communities in drip-irrigated cotton fields. The three total dissolved solid (TDS) levels of irrigation water treatments were (i) 1 g L−1 (fresh water, FWI), (ii) 3 g L−1 (brackish water, BWI), and (iii) 7 g L−1 (salt water, SWI). After three years, the electrical conductivity (EC), sodium adsorption ratio (SAR), and contents of K+, Na+, Mg2+, Cl, and SO42− in the SWI treatment were significantly higher than those in the FWI and BWI treatments, but there were no significant differences in EC and K+ between the FWI and BWI treatments. BWI treatment significantly increased microbial biomass carbon (MBC), microbial biomass nitrogen (MBN), urease, and sucrase contents. The diversity and abundance of bacteria and fungi were not affected by saline water irrigation, but the microbial community structure was altered. Saline water irrigation resulted in an elevation in the bacterial abundance of the phylum Chloroflexi and a decline in Proteobacteria and Actinobacteria. For fungi, the abundance of the phylum Ascomycota in the BWI treatment was greater than that in the FWI and SWI treatments. Linear discriminant analysis effect size (NMDS) results indicated clear variation in the microbiota profiles between the FWI, BWI, and SWI treatments for bacteria. Regarding the fungal microbiota profiles, the BWI and SWI treatments had similar microbiota profiles but were different from the FWI treatment. The number of bacterial biomarkers gradually increased with increasing total dissolved solids of irrigation water, while the number of fungal biomarkers gradually decreased. Additionally, cotton yield was significantly and positively correlated with the observed species of fungi, while it was significantly and negatively correlated with EC. Redundancy analysis (RDA) showed that bacterial community structure was regulated by SAR and fungal community structure was regulated by soil salinity and bulk density (BD). Future research will need to look into how the structure of the microbial community and the associated functional microorganisms are gradually changing with increased irrigation frequency under saline irrigation, as well as explore and screen for advantageous functional microorganisms.

1. Introduction

Xinjiang in northwest China has a continental arid climate with excellent sunshine conditions and a large temperature change between day and night, resulting in a high quality of cotton, and it has the largest concentration of cotton cultivated in China [1,2,3]. Nevertheless, scant precipitation and intense evaporation have severely impeded this region’s cotton industry development [4]. Freshwater resources are scarce in the southern Xinjiang region, but saline groundwater resources are widely available. Utilizing regionally abundant saline water resources for irrigation can greatly reduce agricultural water constraints, and hence, irrigation with saline water has been widely applied [5]. However, there are several disadvantages to utilizing saline water for irrigation, including increases in soil salinity, decreases in enzyme activity, changes in soil physical properties, and plant stress resulting from the increased osmotic potential, which negatively impacts crop growth and production [6,7]. Additionally, compared to conventional watering with fresh water, the use of saline water for irrigation may drastically alter soil microbial communities.
Microorganisms are important for soil nutrient conversion and crop growth [8,9]. The abundance and structure of the soil microbial community are highly responsive to alterations in soil environmental conditions and have been widely used to indicate soil quality changes [10,11,12]. Therefore, an understanding of soil microbiology has gained increasing recognition and importance. The effects of saltwater irrigation on crop yield, soil salt content, root density, soil physical qualities, soil nutrients, and groundwater quality have been reported in earlier research [7,13,14,15,16]. Most studies indicate that irrigation with saline water can result in secondary salinization, increase spatial variations in soil moisture, and reduce crop yield [5]. In a salt-affected environment, salinity can reduce microbial production and activity and alter the makeup of microbial communities [17]. Dong et al. [18] discovered that salinity had little impact on bacterial richness, but it was the main driver of a change in the makeup of the bacterial community and significantly reduced microbial activity. Hu et al. [19] found that long-term brackish irrigation led to an increase in electrical conductivity (EC) and sodium adsorption ratio (SAR) and a polarized distribution of microbial communities. However, less is known about the changes in biological community structure along a gradient of irrigation water salinity levels, and the key environmental factors influencing the distribution and abundance of soil microorganisms are still poorly understood.
Several studies have shown that the soil microbial community structure can be influenced by the soil pH, organic matter content, soil salinity, soil disturbance level, and moisture status [20,21,22,23,24]. In many cases, the main factor driving changes in the makeup of the microorganisms has been identified as soil salinity [25]. The decrease in soil microbial biomass with increasing soil salinity is mostly due to the dehydration and lysis of cells under osmotic stress, which is exacerbated by higher soluble salt concentrations. Salt-tolerant microbes adjust to low osmotic potential by accumulating osmolytes [26]. Hence, changes in the structure of bacterial communities in saline soils compared to non-saline soils are caused by differences in bacterial salt tolerance. Zhalnina et al. [23] argued that pH is also a key factor in determining the composition of the soil microbial community, in addition to soil salinity. Many environmental factors, such as salinity type, nutrient availability, and ions in irrigation water (e.g., CO3−2, HCO3−1), are closely related to soil pH [27]. pH can indirectly affect microbial communities by altering some of the physicochemical properties of the soil, and changes in soil nutrient availability are the way in which pH is most likely to affect microorganisms. However, Wichern et al. [17] and Kabiri et al. [28] further noted that soil microorganisms can adapt to changes in the external environment, especially when regularly confronted with drought and salinity. Consequently, the effects of external factors on microbial diversity and community formation are not always the same.
Due to the limited water resources and uneven seasonal distribution in the arid region of southern Xinjiang, saline groundwater with various total dissolved solids (1 g L−1–12 g L−1) is widely used for cotton cultivation. In order to achieve a deeper understanding of how saline irrigation affects microorganisms and to find the relationship between soil physicochemical properties and changes in the microbial community, this study conducted a three-year test of saline irrigation in drip-irrigated cotton fields. This study was conducted to fulfill the following objectives: (i) to investigate the influences of irrigation with different water salinity on soil physicochemical properties and enzyme activity; (ii) to evaluate how the soil bacterial and fungal community composition varies with the total dissolved solids gradient of irrigation water; and (iii) to explore the factors that influence alterations in soil microbial composition within cotton fields. We hypothesized that the microbial community is mainly influenced by the salinity content of the irrigation water and that soil enzyme activity, microbial diversity, and abundance decrease with increasing salinity. The findings of this study provide important insight into the consequences of drip irrigation systems utilizing saline water for microbial communities.

2. Materials and Methods

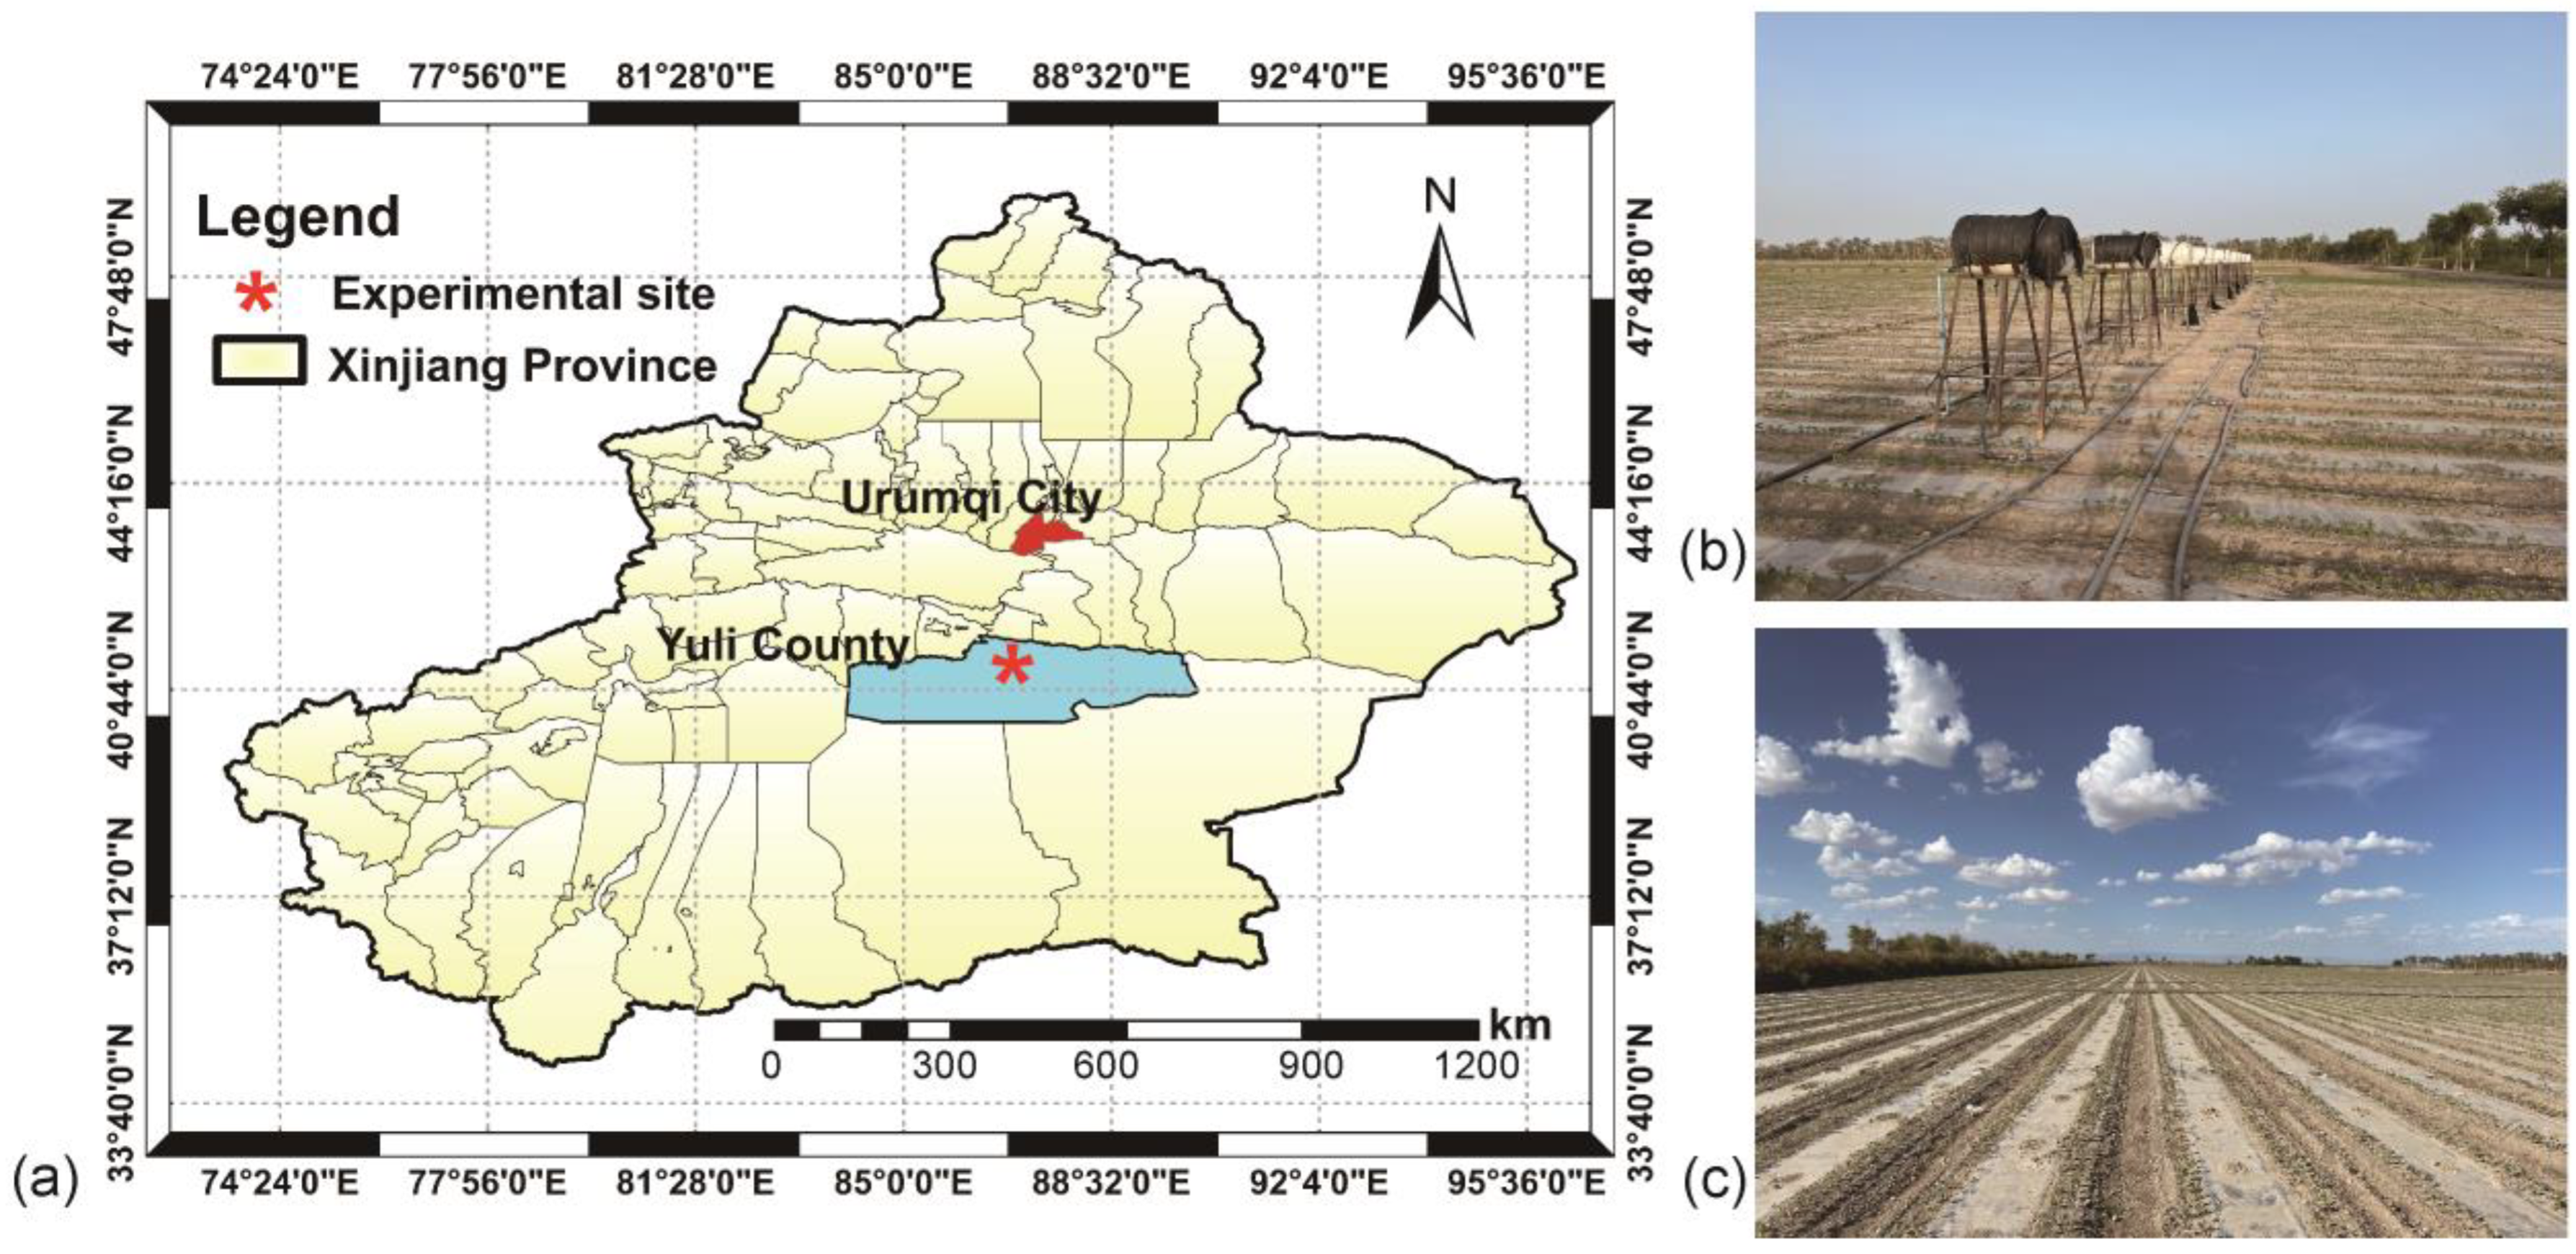
2.1. Study Site and Experimental Setup

The field study was conducted at the Test Station of the Thirty-One Group located in Korla (40°53′ N, 86°56′ E), Xinjiang Province, Northwest China (Figure 1). The location of this site is in a continental desert climate with an altitude of 802 m. The annual precipitation is recorded to be 58 mm, whereas the annual evaporation is measured to be 2788 mm. The maximum temperatures in the cotton growing season (April–October) in 2019, 2020, and 2021 were 41.6 °C, 39.0 °C, and 41.5 °C, respectively, and the minimum temperatures were 2.7 °C, 2.6 °C, and 2.1 °C, respectively. The groundwater depth ranged from 1.4 to 1.8 m. Some physicochemical properties of soil are shown in Table 1.
In the study field, cotton has been continuously planted for 18 years. In 2019, 3 irrigation water salinities were set up for the experiment: 1 g L−1 (FWI: fresh water), 3 g L−1 (BWI: brackish water), and 7 g L−1 (SWI: salt water) were the total dissolved solids for the three water levels (Table 2). The salinity of fresh water was determined by the salinity of the local irrigation water source, which comes from the Tarim River. The salinity setting for saline water was based on the salinity of saline water used locally. The different total dissolved solids water used in the irrigation experiment was mixed with groundwater and fresh water. As the total dissolved solids of the groundwater constantly change, in order to ensure the salinity concentration of the irrigation water for each treatment, the total dissolved solids of the groundwater were measured on the day of each irrigation, and the mixing ratio of fresh and saline water was calculated based on the irrigation volume. The amounts of fresh and saline water were measured by means of a water meter. The mixing device is shown in Figure 1b, and the composition of groundwater is shown in Table 3. The experiment used a randomized block design. Each treatment was carried out in three experimental plots measuring 6 m wide and 7 m in length. The cotton planting method utilized winter irrigation plus drip irrigation under plastic mulch [29]. The cotton field’s drip lines were set up in the local design (Figure S1) [30]. Throughout the growth period, the experimental area was consistently irrigated with saline water on a weekly schedule until the crop was harvested. The total irrigation amount over the entire growing season was approximately 330 mm. The irrigation schedules for the growing seasons of 2019, 2020, and 2021 are shown in Table S1. Winter flood irrigation was conducted in the study area every year with a 400 mm irrigation amount to prevent soil salt accumulation. The Tarim River provides irrigation water for winter floods as well as fresh water. From 2019 to 2021, the salt content and pH value of the river water were between 0.81 g L−1 and 1.11 g L−1 and 7.52 and 8.32, respectively.

2.2. Soil Sampling

At the harvest (6 September) in 2021, soil samples were taken randomly from 0–20 cm of soil beneath the film-covered area using a 5 cm diameter auger. Fifteen subsamples were randomly collected from different locations within each plot to constitute the soil sample. After the collection of soil samples, they were promptly preserved in a portable storage container and expeditiously transported to the laboratory. Soil bulk density (BD) was measured at three randomly selected locations in the film-covered area of each plot, at depths of 0–10 cm, 10–20 cm, and 20–30 cm.

2.3. Soil Physicochemical Analysis

The soil moisture (SM) was obtained using an indoor drying process. BD was calculated during the harvest stage in 2021 by placing steel cylinders [30]. Soil porosity (SP) was determined using the method of Carter et al. [31]. The electrical conductivity of the sample was determined utilizing a conductivity meter (model DDS-307, manufactured by INESA Scientific Instrument Co., Ltd., Shanghai, China) and using a dilution ratio of 1:5 [32]. The pH was measured using the methodology described by Gillman and Sumpter [33] with a dilution ratio of 1:5. Soil salt ions, groundwater ions, TDS, soil organic matter (SOM), total nitrogen (TN), available phosphorus (AP), and AK were measured using procedures described by Bao [32]. Briefly, SOM was determined through a wet oxidation–titration procedure using an acid dichromate system, TN concentration was determined through the micro-Kjeldahl method, AP contents were determined colorimetrically using a spectrophotometer, and an atomic adsorption spectrophotometer (TAS-990, Beijing, China) was used to determine AK concentrations [32]. The HCO3 and CO32− were determined through double indicator-neutralization titration, Cl through silver nitrate titration, SO42− through EDTA indirect complex metric titration, Ca2+ and Mg2+ through EDTA titration, and Na+ and K+ through flame photometry [32]. The soil texture, field capacity, BD, and soil salinity in Table 1 were measured using procedures described by Liang et al. [30], and were measured in April 2019. SAR calculations are based on extracts with a soil to water ratio of 1:5. The soil SAR was then determined using Equation (1) [34]:
SAR = [ Na + ] ( 0 . 5 [ Ca 2 + ] + 0 . 5 [ Mg 2 + ] ) 0 . 5

2.4. Hydro-Chemical Ions

The main anions (Cl and SO42−) were determined using an ion chromatograph (ICS-900 Starter Line IC System, Waltham, MA, USA), and the main cations (Ca2+, Mg2+, Na+, and K+) were determined using an inductively coupled plasma emission spectrometer (ICP-OES, iCAP™ PRO, Waltham, MA, USA). The levels of HCO3 and CO32− were measured using double indicator-neutralization titration (methyl orange and phenolphthalein) [32].

2.5. Microbial Biomass and Enzymatic Assay

Invertase and urease were measured through the colorimetry method of 3,5-dinitro salicylic acid and sodium hypochlorite on a spectrophotometer, respectively [35]. Briefly, soil samples were incubated at 37 °C for 24 h, then invertase activity was assayed by measuring the amount of produced glucose. Urease activity was determined by measuring the released ammonium-N (NH3-N) in the filtrate. MBC and MBN in soil were determined through the chloroform fumigation method [35,36] and measured on a TOC/TN analyzer (GER, N/C 2100).

2.6. Cotton Seed Yield and Biomass

At harvest time in 2021, three 1.0 m × 1.52 m (film width) areas were randomly selected in each plot to harvest by hand, and the seeds were then weighed to obtain seed cotton yield [37,38]. Plant samples were collected at the boll opening stage. From each plot, three cotton plants with comparable growth rates were selected, washed in deionized water, and dried at 105 °C for 30 min and then at 75 °C to achieve a constant weight [39].

2.7. Measurement of Soil Microbial Communities

Total genomic DNA samples were extracted using the OMEGA Soil DNA Kit (M5635-02) (Omega Bio-Tek, Norcross, GA, USA), following the manufacturer’s instructions, and stored at −20 °C prior to further analysis. The quantity and quality of extracted DNA samples were measured using a NanoDrop NC2000 spectrophotometer (Thermo Fisher Scientific, Waltham, MA, USA) and agarose gel electrophoresis, respectively. Afterwards, amplification was performed using the Illumina NovaSeq platform with a NovaSeq 6000 SP Reagent Kit (500 cycles) at Shanghai Personal Biotechnology Co., Ltd. (Shanghai, China). During amplification, the 16S rRNA gene’s V3V4 region was amplified for bacteria using the primer pair comprising 338F (5′-ACTCCTACGGGAGGCAGCA-3′) and 806R (5′-GGACTACHVGGGTWTCTAAT-3′) [36]. For fungi, the primer pair comprising ITS2 (5′-GCTGCGTTCTTCATCGATGC-3′) and ITS5 (5′-GGAAGTAAAAGTCGTAACAAGG-3′) was used to amplify the ITS1 region [40].

2.8. Data Tools and Statistical Analyses

The microbiome bioinformatics analysis was conducted using QIIME2 2019.4 [40,41]. The raw sequence data underwent demultiplexing using the Demux plugin and primer trimming using the cut adapt plugin [42]. To examine the significance of various treatments, Duncan’s multiple comparisons (p < 0.05) were used. The QIIME2 and R programs (v3.5.1) were primarily utilized for the analysis of sequence data. Using the amplifier sequence variation (ASV) table in QIIME2, the Shannon diversity index at the ASV level and the observed species were computed [43,44]. LEfSe analysis was utilized to determine species differences between groups. GeneCloud tools (https://www.genescloud.cn, accessed on 18 August 2022) were used to conduct the LEfSe analysis. Utilizing the “vegan” R package, redundancy analysis (RDA) was performed [45].

3. Results

3.1. Soil Physicochemical Properties

Compared to the FWI and SWI treatments, the soil bulk density in the 10–20 cm layer for the BWI treatment was significantly higher, while the corresponding soil porosity was significantly lower (Figure 2). There were no significant variations in AP, AK, SM, or pH between all treatments. The SWI treatment had significantly higher concentrations of EC, K+, Na+, Mg2+, Cl, SO42−, and SAR compared to the FWI and BWI treatments, although there were no appreciable variations in EC and K+ between the FWI and BWI treatments. The SWI treatment had significantly higher TN, SOM, and SOC contents than the BWI treatment (Table 4).

3.2. Microbial Biomass and Enzymatic Activity

The results indicate that the concentrations of MBC, MBN, urease, and sucrase were significantly higher in the BWI treatment compared to the FWI and SWI treatments (Figure 3). The order of concentrations was observed to be BWI > SWI > FWI. However, no significant differences were observed between the FWI and SWI treatments. The observed ratio of MBC/MBN in the FWI and SWI treatments was significantly higher than that in the BWI treatment (Figure 3c).

3.3. The Richness and Diversity of Bacterial and Fungal Communities

A total of 25,315 bacterial ASVs were observed in the FWI, BWI, and SWI groups (Figure 4), with 2522 shared ASVs (9.96% of the total). The number of shared ASVs between FWI and BWI, FWI and SWI, and BWI and SWI was 1233, 1283, and 1378, respectively. In comparison, the proportion of ASVs in the BWI treatment (31.69%) was higher than that in the FWI and SWI treatments (31.54% and 26.81%, respectively). A total of 1505 fungal ASVs were obtained for the fungal community in the FWI, BWI, and SWI groups, and 203 of these ASVs (13.49% of the total) were shared. The number of shared ASVs between FWI and BWI, FWI and SWI, and BWI and SWI were 94, 60, and 90, respectively. In comparison to the FWI and SWI treatments, which had ASV proportions of 24.52% and 24.91%, respectively, the BWI had an ASV proportion of 37.08%. The Shannon indices and observed species of soil microorganisms were not significantly different between the FWI, BWI, and SWI treatments (Figure 5a,b). In comparison, the SWI treatment had the largest Shannon index for bacterial communities, and the BWI treatment had the largest Shannon index for fungal communities. The BWI treatment had the highest abundance of bacteria and fungi species (Figure 5a,b). The genus-level clustering of samples using nonmetric multidimensional scaling (NMDS) was analyzed (Figure 5c,d). The results indicated clear variation in the microbiota profiles between the FWI, BWI, and SWI treatments for bacteria (Figure 5c). For fungal microbiota profiles, the BWI and SWI treatments had similar microbiota profiles but were different from the FWI treatment (Figure 5d).

3.4. Microbial Community Composition

The abundance of the main phyla in the FWI, BWI, and SWI treatments is illustrated in Figure 6a. All three of the FWI, BWI, and SWI treatments were predominated by the phyla Proteobacteria (44.31–50.11%), Actinobacteria (13.24–14.41%), Chloroflexi (10.03–12.84%), Acidobacteria (7.05–8.58%), Gemmatimonadetes (5.05–6.92%), and Firmicutes (2.60–3.22%), which accounted for more than 88.98% of the total reads in each library. The predominant fungal phyla of the FWI, BWI, and SWI treatments were Ascomycota (87.41–88.56%) and Basidiomycota (2.72–5.23%), which accounted for more than 91.29% of the total reads in each library (Figure 6c). Overall, changes in the dominant phylum (>10%) are more indicative of changes in the bacterial community in response to the environment [40]. In our study, the FWI treatment exhibited a higher abundance of the bacterial phyla Proteobacteria and Actinobacteria compared to the BWI and SWI treatments. Additionally, the Chloroflexi abundance was observed to be the lowest in the FWI treatment and the highest in the BWI treatment out of all the treatments (Figure 6b). In comparison to the FWI and SWI treatments, the BWI treatment had a higher abundance of the fungal phylum Ascomycota (Figure 6d).

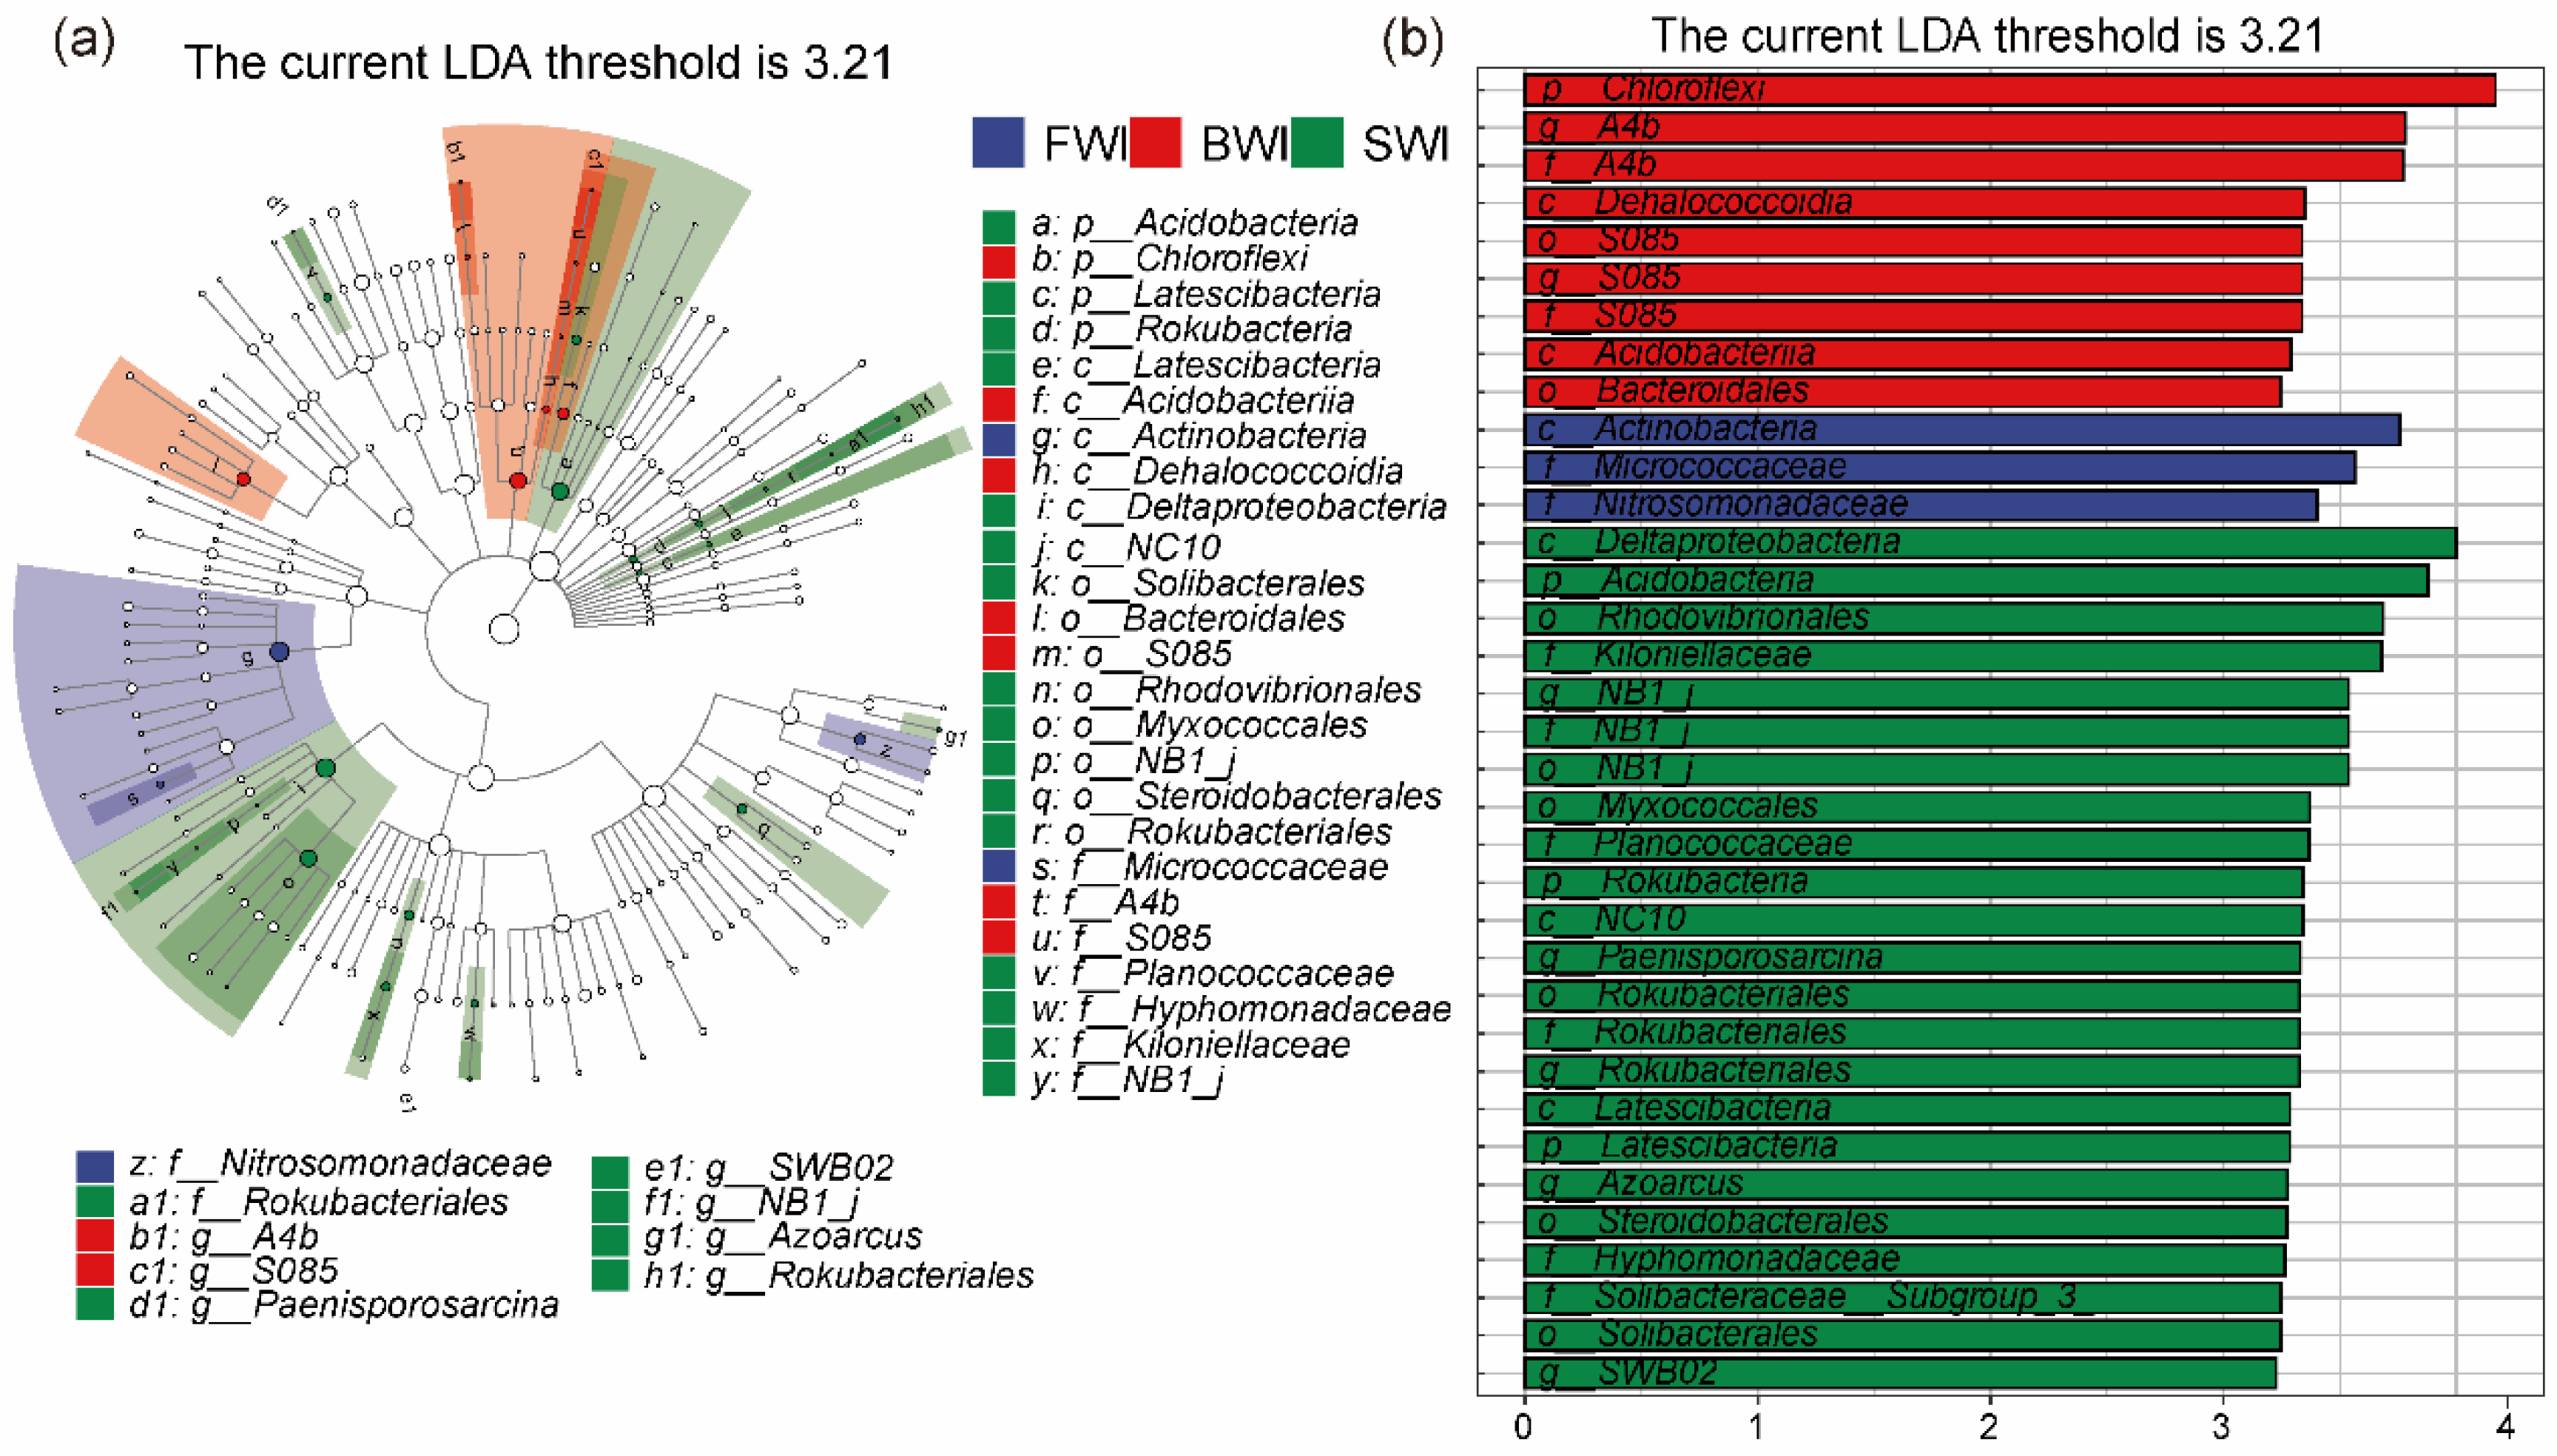
3.5. Analysis of Biomarkers in Microbial Communities

In order to find high-dimensional biomarker taxa with statistically differing abundances across all treatments, LEfSe analysis from the phylum to genus levels was carried out (Figure 7 and Figure 8). Regarding the bacterial communities, a total of 35 bacterial biomarker taxa presented significant differences, and 3, 9, and 23 biomarker taxa were enriched in FWI, BWI, and SWI, respectively (Figure 7b). Actinobacteria (class), Micrococcaceae (family), and Nitrosomonadaceae (family) were the three most abundant biomarkers in FWI soils. The relative abundances of Chloroflexi (phylum), Dehalococcoidia (class), and A4b (family) were especially enriched in BWI soils. In addition, the three most abundant biomarkers of SWI soils were Acidobacteria (phylum), Deltaproteobacteria (class), and Rhodovibrionales (order).
For the fungal communities, a total of 49 fungal biomarker taxa presented significant differences, and 27, 13, and 9 biomarker taxa were enriched in FWI, BWI, and SWI, respectively (Figure 8b). The three most abundant biomarkers in FWI soils were Dothideomycetes (class), Capnodiales (order), and Mycosphaerellaceae (family). The relative abundances of Microascales_fam_Incertae_sedis (family), Tricharina (genus), and Wardomyces (genus) were primarily changed in BWI soils. In addition, Basidiomycota (phylum), Tremellomycetes (class), and Cephalotrichum (genus) were the three most abundant biomarkers in SWI soils. In this study, LEfSe analysis indicated that the number of bacterial biomarkers gradually increased with increasing total dissolved solids in irrigation water, while the number of fungal biomarkers gradually decreased.

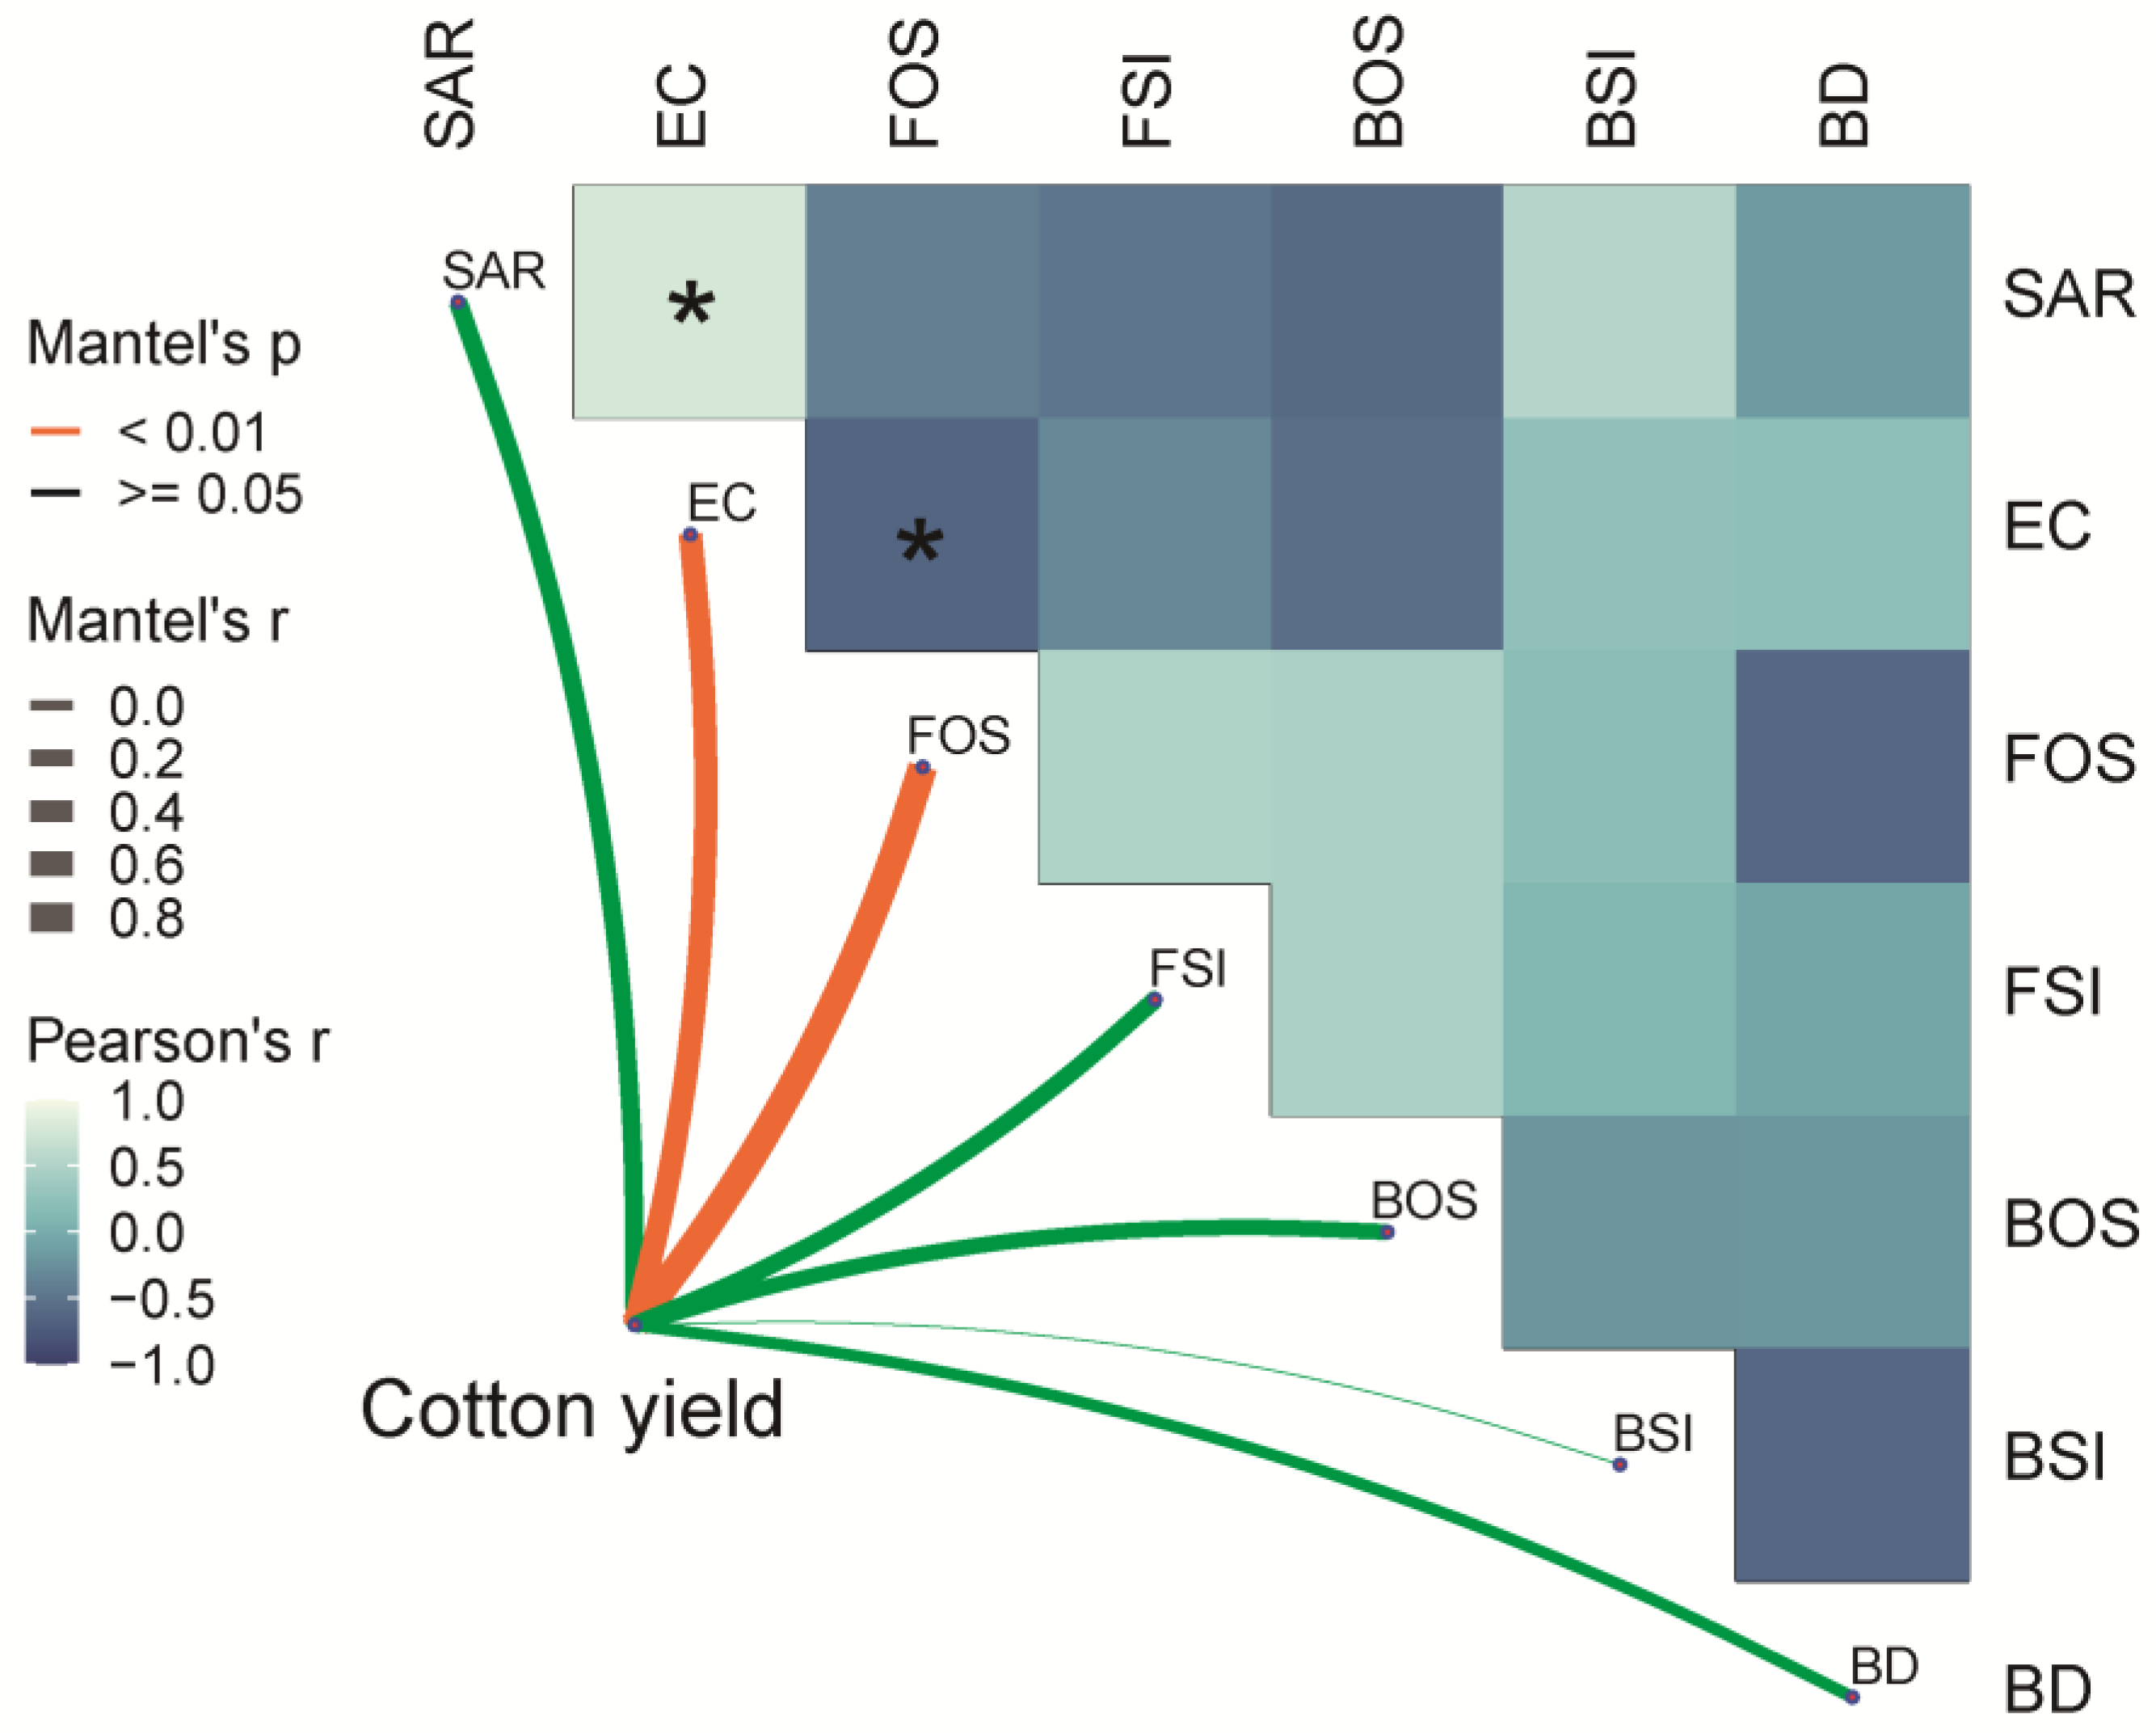
3.6. Correlation Analysis of Yield Index with Soil Physicochemical Properties and Microbial Community

Redundancy analysis (RDA) identifies the relationship between community structure and environmental factors (Figure 9). Axis 1 and axis 2 explained 77.19% and 11.06% of the total variation in the bacterial community structure, respectively. The alteration in the structure of the bacterial communities exhibited a strong correlation with SAR (F = 4.6, p = 0.038, Explain% = 34.9%) (Figure 9a). For the structure of the fungal community, axis 1 and axis 2 explained 84.61% and 13.38% of the total variation, respectively. The alteration in the structure of the fungal communities exhibited a strong correlation with EC (F = 12.9, p = 0.028, Explain% = 11.9%) and BD (F = 6.0, p = 0.038, Explain% = 28.2%) (Figure 9b).
The results of the correlation analysis of cotton yield, soil physicochemical properties, microbial abundance, and microbial diversity are shown in Figure 10. The statistical analysis revealed that there was no statistically significant correlation between the cotton yield and the observed bacterial species. In contrast, cotton yield was significantly and positively correlated with the observed species of fungi, while it was significantly and negatively correlated with EC (Figure 10 and Figure S2). The BWI treatment had the highest seed cotton yield and dry matter (Figure S3). The observed species of fungi were significantly and negatively correlated with EC. In addition, SAR was significantly and positively correlated with EC.

4. Discussion

4.1. Effect of Saline Water Irrigation on Physicochemical Characteristics and Biological Properties of Soil

In this research, the data revealed a significant difference in soil Na+, Mg2+, HCO3, Cl, SO42−, and SAR between the different treatments (Table 4). The SWI treatment had higher salt and salt ion contents than the other treatments, which was mainly due to the high salt content of the irrigation water. These results are in line with the findings of Zhang et al. [46] Soil bulk and porosity can be altered by the accumulation of soil salts due to saline irrigation [47]. Therefore, BD was highest in the BWI treatment in the 10–20 cm soil layer (p < 0.05) (Figure 2). The significantly higher concentrations of MBC, MBN, urease, and sucrase in the BWI treatment (Figure 3) indicate that brackish water (3 g L−1) application may also have positive effects on microbial biomass and enzymatic activity. However, there were no significant differences in MBC, MBN, urease, and sucrase between the FWI and SWI treatments. Our findings are inconsistent with the results of Singh [48], who found that the values of microbial biomass and potential soil enzyme activity generally decreased as soil salinity and alkalinity increased. This may be attributed to alterations in the makeup of the microbial community in the long-term saline stress environment, and the salt-tolerant microorganisms had a better living environment under the BWI treatment conditions, resulting in higher MBC, MBN, urease, and sucrase contents in the BWI treatment. Microorganisms are the main providers of soil enzymes under stress from saline irrigation, with a consequent decrease in soil enzyme synthesis [48,49]; however, the BWI treatment in this study had the highest bacterial and fungal richness and, therefore, the BWI had higher enzyme activity. Zahran [50] also noted that the activity of soil enzymes produced by salt-tolerant bacteria is higher than the corresponding activity of soil enzymes produced by non-salt-tolerant bacteria, so higher soil enzyme activity may still be present in the soil even under high-salinity water irrigation conditions. On the other hand, plant roots can also secrete soil enzymes, and root secretions and organic carbon input from above-ground plants also provide nutrients for soil enzymes [51]. The BWI treatment in our study had the highest yield and biomass and, therefore, may have produced more root secretions (Figure S3). The enzyme activity of various soils and enzymes can vary significantly [52]. Rath and Rousk [53] also noted that the carbon content of microbial biomass stored in soil organic matter does not exhibit a consistent relationship with salinity levels.

4.2. Effect of Irrigation with Saline Water on Bacterial and Fungal Communities

The activity of microorganisms is the primary factor driving the cycling of soil nutrients [54]. The results of our study showed that the Shannon indices and observed species were not significantly different between the FWI, BWI, and SWI treatments (Figure 5a,b). This demonstrates that the increased salinity of irrigation water has no significant effect on the diversity and abundance of microbial communities under long-term irrigation conditions. Our findings are in accordance with those of Hu et al. [19], who discovered no appreciable variations in the microbial Shannon indices between cotton fields watered with freshwater drip for 10 years and those irrigated with brackish water. Yan and Marschner [55] found that microbial growth in various soils exhibited varying responses to increasing salinity in the field. The impact of brackish water usage on microbial community abundance and diversity may be attributed to the final salinity level, rather than the salinity at the beginning. As a result of continuous saline water sub-membrane drip irrigation [56], soil salinity was at a higher level (1.03 ms cm−1–3.18 ms cm−1) under the BWI and SWI treatment conditions (Table 4). In addition, the amount of irrigation for film-covered drip irrigation is relatively low, and strong evaporation causes salt to accumulate on the surface. Flood irrigation in the winter is carried out every year in November-December to eliminate salt from the cotton plants’ roots. Approximately 4000 m3/ha of winter irrigation water is used annually. Flood irrigation is also an important factor affecting microbial community diversity and abundance. The Venn diagrams of microbial community ASV richness (Figure 4a,b) and the observed species of soil bacteria and fungi (Figure 5a,b) further show that the microbial communities’ abundance in the BWI treatment exhibited a higher level compared to the FWI and SWI treatments. One possible reason is that brackish water contains some trace elements that can stimulate crop growth [57]. If the initial soil salinity is relatively low, generally, the first 1–3 years of brackish water irrigation may be more beneficial to crop growth than freshwater irrigation, and crops will have more developed root systems compared with FWI and SWI treatments [7,58,59]. Root exudates are the key factors that regulate the vitality and function of rhizosphere micro-ecosystems. Under stress, many plants can actively or passively release various chemical substances from their roots into the environment, and the number and type of root exudates will increase. Different types of root secretions are key factors in determining the type and number of rhizosphere microorganisms, ultimately influencing their growth, reproduction, and metabolic activities [60,61].
The results of our investigation showed that the microorganisms exhibited varying responses to irrigation with freshwater, brackish water, and saltwater (Figure 6). The results indicated clear variation in the microbiota profiles between the FWI, BWI, and SWI treatments for bacteria (Figure 5c). Regarding the fungal microbiota profiles, the BWI and SWI treatments had similar microbiota profiles but were different from the FWI treatment (Figure 5d). This is mostly due to the fact that different irrigation treatments altered the soil conditions (Table 4), which, in turn, impacted the distribution of the microorganism community. Members of the microbial phylum have various adaptations to different soil conditions [62,63,64,65]. High-salt environments can adversely affect microbes, such as by reducing their respiration and growth [66]. However, organisms can change their physiology by producing osmolytes and altering the structure of cell membranes [47]. Microbes can adapt physiologically to minimize some of the harmful consequences of salinity [67]. The most dominant bacterial phylum in our study is consistent with the dominant phylum in the studies of Ma and Gong [68] and Guo et al. [45]. Saline water irrigation resulted in an elevation in the bacterial abundance of the phylum Chloroflexi and a decline in that of Proteobacteria and Actinobacteria (Figure 6b). This was mainly because the phylum Chloroflexi is generally found in hypersaline environments, while Proteobacteria and Actinobacteria were found only in moderate and low-salinity environments [69]. Proteobacteria, Actinobacteria, and Chloroflexi are the most prevalent halophilic bacteria in saline soils [68]. Regarding the fungal communities, the most prevalent fungal phyla are consistent with prior research on agricultural soils, as reported by Pan et al. [70] and Muneer et al. [71]. Ascomycota represent the most prevalent and varied phylum of eukaryotic organisms, exhibiting abilities in the process of organic substrate decomposition [72]. In comparison to the FWI and SWI treatments, the BWI treatment soil samples had a higher abundance of the fungal phylum Ascomycota (Figure 6d). One possible reason for this is that Ascomycota decrease with increasing organic matter content [73], and the content of soil SOM and SOC under the BWI treatment conditions was the lowest compared to the FWI and SWI treatments (Table 4).
In our study, the LEfSe analysis revealed that the microorganisms exhibited significant variation in response to changes in the total dissolved solids content of the irrigation water. The number of bacterial biomarkers gradually increased with increasing total dissolved solids in water, while the number of fungal biomarkers gradually decreased. The primary reason for this phenomenon is the adaptive capacity of soil microbes to external environmental changes, with fungi being more tolerant of salinity than bacteria [74]. Zheng et al. [75] noted that high salinity can enhance microbial interactions. The community’s composition change, resulting in the replacement of less-adapted species by better-adapted ones, is a significant factor that influences the changing distribution of tolerant features within communities [76,77]. The specific bacterial taxa whose relative abundance increased with community salt tolerance might be employed as indicators for high community salt tolerance [45,78].

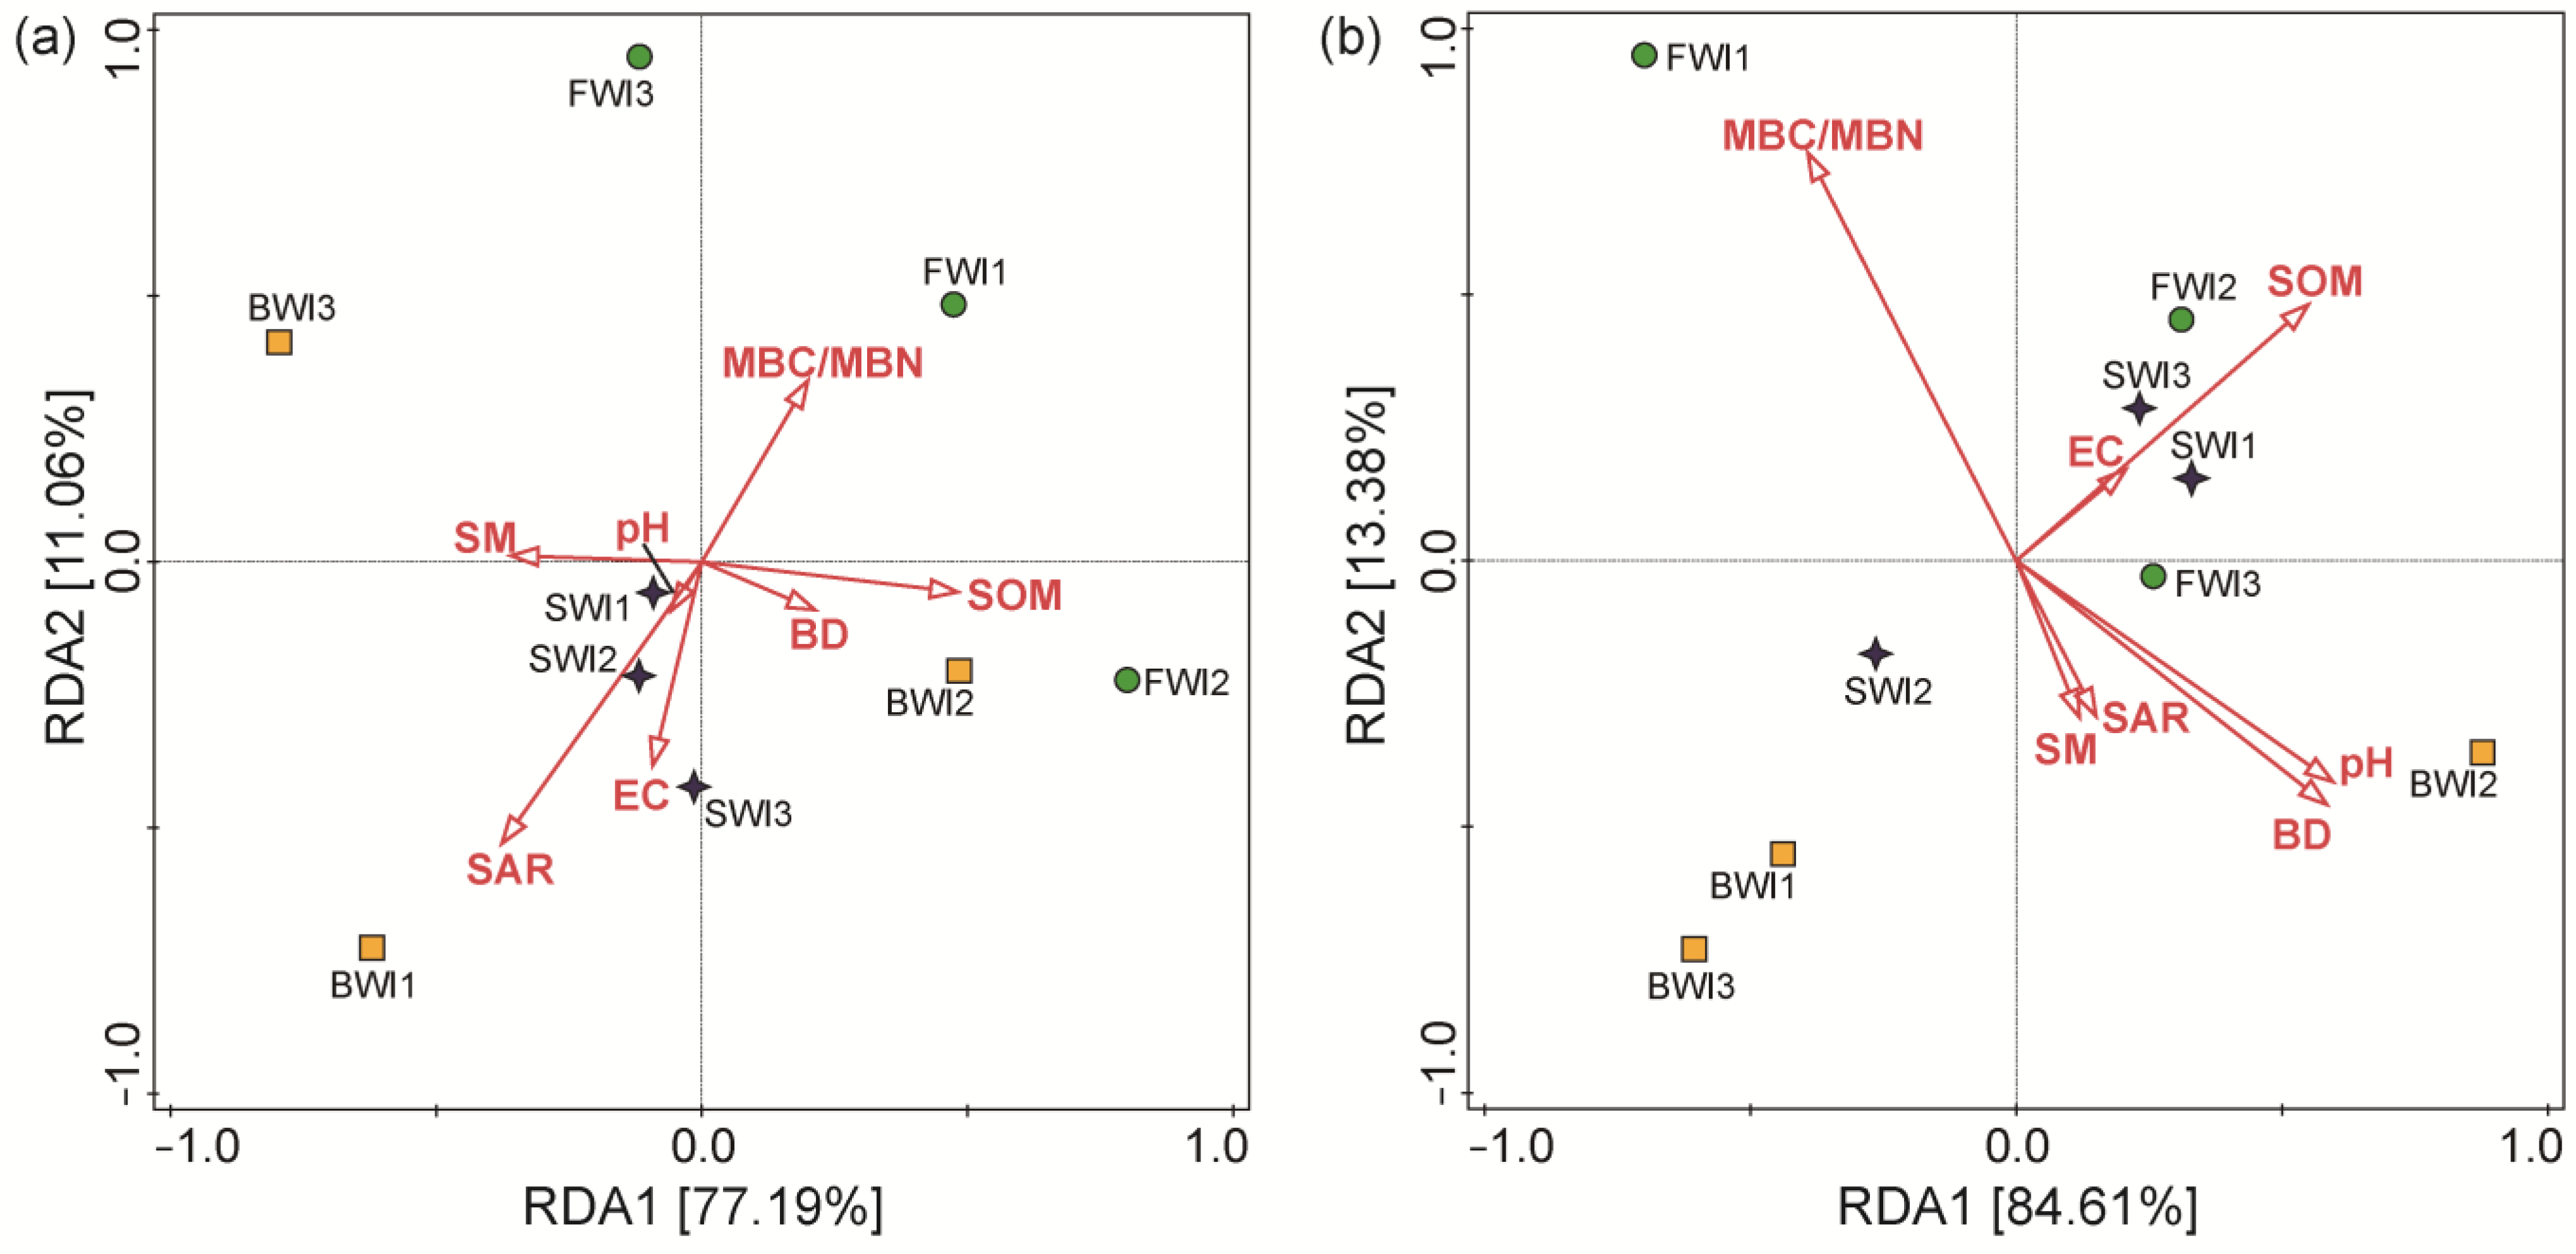
4.3. Relationship between Microorganisms and Soil Physicochemical Properties

The results of our experiment showed that SAR significantly alters the makeup of bacterial community structure (Figure 9a). This is inconsistent with the results of Tong et al. [79], who observed that soil salt concentration is the primary factor regulating soil microbial diversity and soil microbiome formation and that soil microbial diversity varied with soil salt contents. Dong et al. [18] also revealed that bacterial abundance was not significantly impacted by salinity; however, it was identified as the primary factor responsible for the alteration in bacterial community composition, leading to a notable decline in microbial activity. However, the correlation between the microbial species and salt ions exhibited complexity and ion specificity [80], and the potential effects of soil salinity on soil microbial communities are not detailed enough to be represented by EC gradients or total dissolved solids. The study conducted by Hu et al. [19] involved an analysis of correlations between pivotal species, EC, and salinity ions in brackish and freshwater-irrigated cotton fields. The findings revealed that, apart from the overall impact of EC, distinct major ions exhibited varying correlations with soil microbial pivotal species. This indicates the importance of identifying ion-specific soil microbial species, which supports our finding that SAR is the primary factor accounting for alterations in bacterial community structure. Additionally, the RDA analysis indicated that soil EC and BD significantly impacted the composition of the fungal community (Figure 9b). This finding is in accordance with earlier research that suggested salinity, moisture, and porosity may play a crucial role in regulating the makeup of microbial communities. Fungi may benefit from exchangeable ions provided to the soil by high salinity, and some fungal species under high salinity conditions can increase the absorption of various ions while reducing the transport of certain toxic ions [81,82,83]. We also found that EC had a strong relationship with the observed species of fungi (Figure 10).
The observed species of fungi were significantly and positively connected with cotton production, indicating that they are important for improving cotton yield. This is most likely related to the fact that fungi have a decomposing effect on plant material. In the study area, cotton straw residues were shredded and returned to the field each year. In general, fungi are thought to be the primary organisms that break down plant matter [84]. This is attributed to their capacity to decompose both organic materials that are readily degradable (e.g., cellulose) and those that are resistant to degradation (e.g., polyphenols) by making a range of external depolymerizing enzymes [85]. Zhang et al. [86] noted that there was a significant correlation between the number of fungi and the dry weight of plants, indicating that plant productivity had an impact on fungal abundance. Chen et al. [87] also found that soil fungi utilize straw more efficiently than soil bacteria, which gives them a significant competitive advantage. Cotton production was significantly and negatively correlated with EC. This is consistent with previous studies [88].

5. Conclusions

In conclusion, irrigation with saline water of different salinity levels increased soil salinity and SAR but had no significant effect on the diversity and abundance of bacteria and fungi. SAR regulated the structure of the bacterial community, whereas salinity and porosity regulated the structure of the fungal community. The microbial community structure was altered. The number of bacterial biomarkers gradually increased with increasing total dissolved solids in irrigation water, while the number of fungal biomarkers gradually decreased. Soil microorganisms can adapt to changes in a high-salt environment after a prolonged period of irrigation with saline water. Future research should explore the process of changes in the functional groups of microorganisms under saline water irrigation and screen for functional genes for salt tolerance, which are important for the improved use of saline alkali soils and the growth of salt-tolerant plants.

Supplementary Materials

The following supporting information can be downloaded at: https://www.mdpi.com/article/10.3390/agronomy13071679/s1, Table S1: The irrigation schedule in the growing seasons of 2019, 2020, and 2021; Figure S1: Schematic diagram of cotton planting; Figure S2: Results of the correlation analysis between seed cotton yield and fungal observed species and EC; Figure S3: Comparison of seed cotton yield and dry matter between the fresh (FWI), brackish (BWI), and salt (SWI) irrigation water treatments.

Author Contributions

Conceptualization, Y.B. and H.C.; methodology, Y.B., S.G. and H.C.; formal analysis, B.D.; investigation, B.D., S.G., Z.H., H.L. and J.Z.; writing—original draft, B.D.; project administration, B.W.; funding acquisition, Y.B. and H.C. All authors have read and agreed to the published version of the manuscript.

Funding

This study was supported by the Natural Science Foundation of China (52269017, 52179047). The National Key Research and Development Program of China (2022YFD190010404). Tianshan Talent Project, Xinjiang Uygur Autonomous Region, China (2022TSYCLJ0069).

Data Availability Statement

The datasets used in the current study are available from the corresponding author on reasonable request. DNA sequencing data were deposited in the NCBI Sequence Read Archive and can be accessed using the accession number SRP353419.

Conflicts of Interest

The authors declare no conflict of interest.

References

  1. Lambers, H. Introduction, dryland salinity: A key environmental issue in southern Australia. Plant Soil 2003, 257, 5–7. [Google Scholar] [CrossRef]
  2. Chen, W.; Jin, M.; Ferré, T.P.A.; Liu, Y.; Xian, Y.; Shan, T.; Ping, X. Spatial distribution of soil moisture, soil salinity, and root density beneath a cotton field under mulched drip irrigation with brackish and fresh water. Field Crop. Res. 2018, 215, 207–221. [Google Scholar] [CrossRef]
  3. Li, X.; Jin, M.; Zhou, N.; Huang, J.; Jiang, S.; Telesphore, H. Evaluation of evapotranspiration and deep percolation under mulched drip irrigation in an oasis of Tarim basin, China. J. Hydrol. 2016, 538, 677–688. [Google Scholar] [CrossRef] [Green Version]
  4. Wang, R.; Kang, Y.; Wan, S.; Hu, W.; Liu, S.; Liu, S. Salt distribution and the growth of cotton under different drip irrigation regimes in a saline area. Agric. Water Manag. 2011, 100, 58–69. [Google Scholar] [CrossRef]
  5. Cheng, M.; Wang, H.; Fan, J.; Wang, X.; Sun, X.; Yang, L.; Zhang, S.; Xiang, Y.; Zhang, F. Crop yield and water productivity under salty water irrigation: A global meta-analysis. Agric. Water Manag. 2021, 256, 107105. [Google Scholar] [CrossRef]
  6. Chunxia, W.; Guang, Y.; Junfeng, L.; Xinlin, H.; Lianqing, X.; Aihua, L. Effects of timing and duration under brackish water mulch drip irrigation on cotton yield in northern Xinjiang, China. Int. J. Agric. Biol. Eng. 2017, 10, 115–122. [Google Scholar] [CrossRef]
  7. Yang, G.; Li, F.; Tian, L.; He, X.; Gao, Y.; Wang, Z.; Ren, F. Soil physicochemical properties and cotton (Gossypium hirsutum L.) yield under brackish water mulched drip irrigation. Soil Tillage Res. 2020, 199, 104592. [Google Scholar] [CrossRef]
  8. Gong, X.; Liu, C.; Li, J.; Luo, Y.; Yang, Q.; Zhang, W.; Yang, P.; Feng, B. Responses of rhizosphere soil properties, enzyme activities and microbial diversity to intercropping patterns on the Loess Plateau of China. Soil Tillage Res. 2019, 195, 104355. [Google Scholar] [CrossRef]
  9. Zhang, H.; Luo, G.; Wang, Y.; Fei, J.; Xiangmin, R.; Peng, J.; Tian, C.; Zhang, Y. Crop rotation-driven change in physicochemical properties regulates microbial diversity, dominant components, and community complexity in paddy soils. Agric. Ecosyst. Environ. 2023, 343, 108278. [Google Scholar] [CrossRef]
  10. Chen, J.; Liu, X.; Zheng, J.; Zhang, B.; Lu, H.; Chi, Z.; Pan, G.; Li, L.; Zheng, J.; Zhang, X.; et al. Biochar soil amendment increased bacterial but decreased fungal gene abundance with shifts in community structure in a slightly acid rice paddy from Southwest China. Appl. Soil Ecol. 2013, 71, 33–44. [Google Scholar] [CrossRef]
  11. Hall, R.M.; Penke, N.; Kriechbaum, M.; Kratschmer, S.; Jung, V.; Chollet, S.; Guernion, M.; Nicolai, A.; Burel, F.; Fertil, A.; et al. Vegetation management intensity and landscape diversity alter plant species richness, functional traits and community composition across European vineyards. Agr. Syst. 2020, 177, 102706. [Google Scholar] [CrossRef]
  12. Liu, H.; Xu, W.; Li, J.; Yu, Z.; Zeng, Q.; Tan, W.; Mi, W. Short-term effect of manure and straw application on bacterial and fungal community compositions and abundances in an acidic paddy soil. J. Soils Sediments 2021, 21, 3057–3071. [Google Scholar] [CrossRef]
  13. Selim, T.; Berndtsson, R.; Persson, M.; Somaida, M.; El-Kiki, M.; Hamed, Y.; Mirdan, A.; Zhou, Q. Influence of geometric design of alternate partial root-zone subsurface drip irrigation (APRSDI) with brackish water on soil moisture and salinity distribution. Agric. Water Manag. 2012, 103, 182–190. [Google Scholar] [CrossRef]
  14. Li, X.; Jin, M.; Huang, J.; Yuan, J. The soil–water flow system beneath a cotton field in arid north-west China, serviced by mulched drip irrigation using brackish water. Hydrogeol. J. 2015, 23, 35–46. [Google Scholar] [CrossRef]
  15. Qi, Z.; Feng, H.; Zhao, Y.; Zhang, T.; Yang, A.; Zhang, Z. Spatial distribution and simulation of soil moisture and salinity under mulched drip irrigation combined with tillage in an arid saline irrigation district, northwest China. Agric. Water Manag. 2018, 201, 219–231. [Google Scholar] [CrossRef]
  16. Wang, R.; Wan, S.; Sun, J.; Xiao, H. Soil salinity, sodicity and cotton yield parameters under different drip irrigation regimes during saline wasteland reclamation. Agric. Water Manag. 2018, 209, 20–31. [Google Scholar] [CrossRef]
  17. Wichern, J.; Wichern, F.; Joergensen, R.G. Impact of salinity on soil microbial communities and the decomposition of maize in acidic soils. Geoderma 2006, 137, 100–108. [Google Scholar] [CrossRef]
  18. Dong, Y.; Zhang, J.; Chen, R.; Zhong, L.; Lin, X.; Feng, Y. Microbial community composition and activity in saline soils of coastal agro-ecosystems. Microorganisms 2022, 10, 835–846. [Google Scholar] [CrossRef] [PubMed]
  19. Hu, Y.; Li, X.; Jin, M.; Wang, R.; Chen, J.; Guo, S. Reduced co-occurrence and ion-specific preferences of soil microbial hub species after ten years of irrigation with brackish water. Soil Tillage Res. 2020, 199, 104599. [Google Scholar] [CrossRef]
  20. Chowdhury, N.; Nakatani, A.S.; Setia, R.; Marschner, P. Microbial activity and community composition in saline and non-saline soils exposed to multiple drying and rewetting events. Plant Soil 2011, 348, 103–113. [Google Scholar] [CrossRef]
  21. Chaudhry, V.; Rehman, A.; Mishra, A.; Chauhan, P.S.; Nautiyal, C.S. Changes in bacterial community structure of agricultural land due to long-term organic and chemical amendments. Microb. Ecol. 2012, 64, 450–460. [Google Scholar] [CrossRef]
  22. Yan, N.; Marschner, P. Response of soil respiration and microbial biomass to changing EC in saline soils. Soil Biol. Biochem. 2013, 65, 322–328. [Google Scholar] [CrossRef]
  23. Zhalnina, K.; Dias, R.; de Quadros, P.D.; Davis-Richardson, A.; Camargo, F.A.O.; Clark, I.M.; McGrath, S.P.; Hirsch, P.R.; Triplett, E.W. Soil pH Determines Microbial Diversity and Composition in the Park Grass Experiment. Microb. Ecol. 2015, 69, 395–406. [Google Scholar] [CrossRef] [PubMed]
  24. Soman, C.; Li, D.; Wander, M.M.; Kent, A.D. Long-term fertilizer and crop-rotation treatments differentially affect soil bacterial community structure. Plant Soil 2017, 413, 145–159. [Google Scholar] [CrossRef]
  25. Zhang, K.; Shi, Y.; Cui, X.; Yue, P.; Li, K.; Liu, X.; Tripathi, B.M.; Chu, H.; Lozupone, C. Salinity is a key determinant for soil microbial communities in a desert ecosystem. mSystems 2019, 4, e218–e225. [Google Scholar] [CrossRef] [PubMed] [Green Version]
  26. Oren, A. The bioenergetic basis for the decrease in metabolic diversity at increasing salt concentrations: Implications for the functioning of salt lake ecosystems. Hydrobiologia 2001, 466, 61–72. [Google Scholar] [CrossRef]
  27. Rousk, J.; Bååth, E.; Brookes, P.C.; Lauber, C.L.; Lozupone, C.; Caporaso, J.G.; Knight, R.; Fierer, N. Soil bacterial and fungal communities across a pH gradient in arable soil. ISME J. 2010, 4, 1340–1351. [Google Scholar] [CrossRef]
  28. Kabiri, V.; Raiesi, F.; Ghazavi, M.A. Tillage effects on soil microbial biomass, SOM mineralization and enzyme activity in semi-arid Calcixerepts. Agric. Ecosyst. Environ. 2016, 232, 73–84. [Google Scholar] [CrossRef]
  29. Yang, P.; Zia-Khan, S.; Wei, G.; Zhong, R.; Aguila, M. Winter Irrigation Effects in Cotton Fields in Arid Inland Irrigated Areas in the North of the Tarim Basin, China. Water 2016, 8, 47. [Google Scholar] [CrossRef] [Green Version]
  30. Liang, J.; Li, Y.; Si, B.; Wang, Y.; Chen, X.; Wang, X.; Chen, H.; Wang, H.; Zhang, F.; Bai, Y.; et al. Optimizing biochar application to improve soil physical and hydraulic properties in saline-alkali soils. Sci. Total Environ. 2021, 771, 144802. [Google Scholar] [CrossRef]
  31. Carter, D.L.; Mortland, M.M.; Kemper, W.D. Methods of Soil Analysis Part I: Physical and Mineralogical Methods; Amer Society of Agronomy: Madison, WI, USA, 1986. [Google Scholar]
  32. Bao, S.D. Soil Agricultural Chemistry Analysis; Agriculture Press: Beijing, China, 1999. [Google Scholar]
  33. Gillman, G.P.; Sumpter, E.A. Modification to the compulsive exchange method for measuring exchange characteristics of soils. Aust. J. Soil. Res. 1986, 24, 61–66. [Google Scholar] [CrossRef]
  34. Brady, N.C.; Weil, R.R.; Brady, N.C. Elements of Nature and Properties of Soils; Prentice Hall: Hoboken, NJ, USA, 2000. [Google Scholar]
  35. Yan, M.; Li, T.; Li, X.; Liu, Y.; Zhang, J. Microbial biomass and activity restrict soil function recovery of a post-mining land in eastern Loess Plateau. Catena 2021, 199, 105107. [Google Scholar] [CrossRef]
  36. Caporaso, J.G.; Lauber, C.L.; Walters, W.A.; Berg-Lyons, D.; Lozupone, C.A.; Turnbaugh, P.J.; Fierer, N.; Gordon, K. Supplement 1: Microbes and Health || Global patterns of 16S rRNA diversity at a depth of millions of sequences per sample. Proc. Natl. Acad. Sci. USA 2011, 108, 4516–4522. [Google Scholar] [CrossRef] [Green Version]
  37. Liang, J.; He, Z.; Shi, W. Cotton/mung bean intercropping improves crop productivity, water use efficiency, nitrogen uptake, and economic benefits in the arid area of Northwest China. Agric. Water Manag. 2020, 240, 106277. [Google Scholar] [CrossRef]
  38. Li, Y.; Yao, N.; Liang, J.; Wang, X.; Niu, B.; Jia, Y.; Jiang, F.; Yu, Q.; Liu, D.L.; Feng, H.; et al. Rational biochar application rate for cotton nutrient content, growth, yields, productivity, and economic benefits under film-mulched trickle irrigation. Agric. Water Manag. 2023, 276, 108079. [Google Scholar] [CrossRef]
  39. Liang, J.; Shi, W. Cotton/halophytes intercropping decreases salt accumulation and improves soil physicochemical properties and crop productivity in saline-alkali soils under mulched drip irrigation: A three-year field experiment. Field Crop. Res. 2021, 262, 108027. [Google Scholar] [CrossRef]
  40. Bellemain, E.; Carlsen, T.; Brochmann, C.; Coissac, E.; Kauserud, H. Its as an environmental DNA barcode for fungi: An in silico approach reveals potential PCR biases. BMC Microbiol. 2010, 10, 189–198. [Google Scholar] [CrossRef] [PubMed] [Green Version]
  41. Bolyen, E.; Rideout, J.R.; Dillon, M.R.; Bokulich, N.A.; Caporaso, J.G. QIIME 2: Reproducible, interactive, scalable, and extensible microbiome data science. PeerJ 2018, 25, 16–70. [Google Scholar] [CrossRef] [PubMed]
  42. Martin, M. Cutadapt removes adapter sequences from high-throughput sequencing reads. EMBnet. J. 2011, 17, 11–12. [Google Scholar] [CrossRef]
  43. Callahan, B.J.; Mcmurdie, P.J.; Rosen, M.J.; Han, A.W.; Johnson, A.; Holmes, S.P. DADA2: High-resolution sample inference from Illumina amplicon data. Nat. Methods 2016, 13, 581–583. [Google Scholar] [CrossRef] [Green Version]
  44. Bokulich, N.A.; Kaehler, B.D.; Ram, R.J.; Matthew, D.; Evan, B.; Rob, K.; Huttley, G.A.; Gregory, C.J. Optimizing taxonomic classification of marker-gene amplicon sequences with QIIME 2′s q2-feature-classifier plugin. Microbiome 2018, 6, 90. [Google Scholar] [CrossRef]
  45. Guo, H.; Shi, X.; Ma, L.; Yang, T.; Min, W. Long-term irrigation with saline water decreases soil nutrients, diversity of bacterial communities, and cotton yields in a gray desert soil in China. Pol. J. Environ. Stud. 2020, 29, 4077–4088. [Google Scholar] [CrossRef]
  46. Zhang, A.; Zheng, C.; Li, K.; Dang, H.; Cao, C.; Rahma, A.E.; Zhang, J.; Feng, D. Responses of soil water-salt variation and cotton growth to drip irrigation with saline water in the low plain near the Bohai Sea. Irrig. Drain. 2020, 69, 448–459. [Google Scholar] [CrossRef]
  47. Li, X.; Jin, M.; Zhou, N.; Jiang, S.; Hu, Y. Inter-dripper variation of soil water and salt in a mulched drip irrigated cotton field: Advantages of 3-D modelling. Soil Tillage Res. 2018, 184, 186–194. [Google Scholar] [CrossRef]
  48. Singh, K. Microbial and enzyme activities of saline and sodic soils. Land Degrad. Dev. 2015, 27, 706–718. [Google Scholar] [CrossRef]
  49. Doongar, R.; Chaudhary, A.P.; Rathore, B.J. Effects of seawater irrigation on soil microbial community structure and physiological function. Int. J. Environ. Sci. Technol. 2016, 13, 2199–2208. [Google Scholar] [CrossRef] [Green Version]
  50. Zahran, H.H. Diversity, adaptation and activity of the bacterial flora in saline environments. Biol. Fertil. Soils 1997, 25, 211–223. [Google Scholar] [CrossRef]
  51. Zhai, H.; Cao, C.; Liu, M. Effects of long-term brackish water irrigation on soil enzyme activity and reaction kinetics. Agric. Water Manag. 2018, 36, 95–101, (In Chinese with English Abstract). [Google Scholar] [CrossRef]
  52. Bowles, T.M.; Acosta-Martínez, V.; Calderón, F.; Jackson, L.E. Soil enzyme activities, microbial communities, and carbon and nitrogen availability in organic agroecosystems across an intensively-managed agricultural landscape. Soil Biol. Biochem. 2014, 68, 252–262. [Google Scholar] [CrossRef]
  53. Rath, K.M.; Rousk, J. Salt effects on the soil microbial decomposer community and their role in organic carbon cycling: A review. Soil Biol. Biochem. 2015, 81, 108–123. [Google Scholar] [CrossRef]
  54. Wang, Y.; Liu, L.; Yang, J.; Duan, Y.; Luo, Y.; Taherzadeh, M.J.; Li, Y.; Li, H.; Awasthi, M.K.; Zhao, Z. The diversity of microbial community and function varied in response to different agricultural residues composting. Sci. Total Environ. 2020, 715, 136983. [Google Scholar] [CrossRef]
  55. Yan, N.; Marschner, P. Response of microbial activity and biomass to increasing salinity depends on the final salinity, not the original salinity. Soil Biol. Biochem. 2012, 53, 50–55. [Google Scholar] [CrossRef]
  56. He, H.; Wang, Z.; Guo, L.; Zheng, X.; Zhang, J.; Li, W.; Fan, B. Distribution characteristics of residual film over a cotton field under long-term film mulching and drip irrigation in an oasis agroecosystem. Soil Tillage Res. 2018, 180, 194–203. [Google Scholar] [CrossRef]
  57. Wang, Q.; Shan, Y. Review of research development on water and soil regulation with brackish water irrigation. J. Agric. Mach. 2015, 46, 117–126. [Google Scholar] [CrossRef]
  58. Chen, W.; Jin, M.; Ferré, T.P.A.; Liu, Y.; Huang, J.; Xian, Y. Soil conditions affect cotton root distribution and cotton yield under mulched drip irrigation. Field Crop. Res. 2020, 249, 107743. [Google Scholar] [CrossRef]
  59. Singh, G.; Mukerji, K. Root Exudates as Determinant of Rhizospheric Microbial Biodiversity. In Microbial Activity in the Rhizoshere; Mukerji, K.G., Manoharachary, C., Eds.; Springer: Berlin/Heidelberg, Germany, 2006. [Google Scholar]
  60. Gao, Y.; Cui, J.; Ren, G.; Wei, S.; Yang, P.; Yin, C.; Liang, H.; Chang, J. Changes in the root-associated bacteria of sorghum are driven by the combined effects of salt and sorghum development. Environ. Microbiome 2021, 16, 14. [Google Scholar] [CrossRef] [PubMed]
  61. Eisenhauer, N.; Scheu, S.; Jousset, A. Bacterial diversity stabilizes community productivity. PLoS ONE 2012, 7, e34517. [Google Scholar] [CrossRef] [PubMed] [Green Version]
  62. Naether, A.; Foesel, B.U.; Naegele, V.; Wust, P.K.; Weinert, J.; Bonkowski, M.; Alt, F.; Oelmann, Y.; Polle, A.; Lohaus, G. Environmental factors affect Acidobacterial communities below the subgroup level in grassland and forest soils. Appl. Environ. Microb. 2012, 78, 7398. [Google Scholar] [CrossRef] [Green Version]
  63. Yin, C.; Hulbert, S.H.; Schroeder, K.L.; Mavrodi, O.; Mavrodi, D.; Dhingra, A.; Schillinger, W.F.; Paulitz, T.C. Role of Bacterial Communities in the Natural Suppression of Rhizoctonia solani Bare Patch Disease of Wheat (Triticum aestivum L.). Appl. Environ. Microb. 2013, 79, 7428–7438. [Google Scholar] [CrossRef] [Green Version]
  64. Paungfoo-Lonhienne, C.; Yeoh, Y.K.; Kasinadhuni, N.; Lonhienne, T.; Robinson, N.; Hugenholtz, P.; Ragan, M.A.; Schmidt, S. Nitrogen fertilizer dose alters fungal communities in sugarcane soil and rhizosphere. Sci. Rep. 2015, 5, 8678. [Google Scholar] [CrossRef] [Green Version]
  65. Couturier, M.; Tangthirasunun, N.; Xie, N.; Brun, S.; Berrin, J.G. Plant biomass degrading ability of the coprophilic ascomycete fungus Podospora anserina. Biotechnol. Adv. 2016, 34, 976–983. [Google Scholar] [CrossRef]
  66. Setia, R.; Marschner, P.; Baldock, J.; Chittleborough, D.; Smith, P.; Smith, J. Salinity effects on carbon mineralization in soils of varying texture. Soil Biol. Biochem. 2011, 43, 1908–1916. [Google Scholar] [CrossRef]
  67. Kakumanu, M.L.; Williams, M.A. Osmolyte dynamics and microbial communities vary in response to osmotic more than matric water deficit gradients in two soils. Soil Biol. Biochem. 2014, 79, 14–24. [Google Scholar] [CrossRef]
  68. Ma, B.; Gong, J. A meta-analysis of the publicly available bacterial and archaeal sequence diversity in saline soils. World J. Microb. Biotechnol. 2013, 29, 2325–2334. [Google Scholar] [CrossRef] [PubMed]
  69. Valenzuela-Encinas, C.; Neria-Gonzalez, I.; Alcantara-Hernandez, R.J.; Estrada-Alvarado, I.; Zavala-Diaz, D.L.S.F.; Dendooven, L.; Marsch, R. Changes in the bacterial populations of the highly alkaline saline soil of the former lake Texcoco (Mexico) following flooding. Extremophiles 2009, 13, 609–621. [Google Scholar] [CrossRef] [PubMed]
  70. Pan, H.; Chen, M.; Feng, H.; Wei, M.; Song, F.; Lou, Y.; Cui, X.; Wang, H.; Zhuge, Y. Organic and inorganic fertilizers respectively drive bacterial and fungal community compositions in a fluvo-aquic soil in northern China. Soil Tillage Res. 2020, 198, 104540. [Google Scholar] [CrossRef]
  71. Muneer, M.A.; Huang, X.; Hou, W.; Zhang, Y.; Cai, Y.; Munir, M.Z.; Wu, L.; Zheng, C. Response of fungal diversity, community composition, and functions to nutrients management in red soil. J. Fungi 2021, 7, 554–572. [Google Scholar] [CrossRef]
  72. Huang, X.; Muneer, M.A.; Li, J.; Hou, W.; Ma, C.; Jiao, J.; Cai, Y.; Chen, X.; Wu, L.; Zheng, C. Integrated nutrient management significantly improves pomelo (citrus grandis) root growth and nutrients uptake under acidic soil of southern China. Agronomy 2021, 11, 1231. [Google Scholar] [CrossRef]
  73. Ding, J.; Jiang, X.; Guan, D.; Zhao, B.; Ma, M.; Zhou, B.; Cao, F.; Yang, X.; Li, L.; Li, J. Influence of inorganic fertilizer and organic manure application on fungal communities in a long-term field experiment of Chinese Mollisols. Appl. Soil Ecol. 2017, 111, 114–122. [Google Scholar] [CrossRef]
  74. Rath, K.M.; Maheshwari, A.; Bengtson, P.; Rousk, J. Comparative Toxicities of Salts on Microbial Processes in Soil. Appl. Environ. Microb. 2016, 82, 2012–2020. [Google Scholar] [CrossRef] [Green Version]
  75. Zheng, W.; Xue, D.; Li, X.; Deng, Y.; Rui, J.; Feng, K.; Wang, Z. The responses and adaptations of microbial communities to salinity in farmland soils: A molecular ecological network analysis. Appl. Soil Ecol. 2017, 120, 239–246. [Google Scholar] [CrossRef]
  76. Lau, J.A.; Lennon, J.T. Rapid responses of soil microorganisms improve plant fitness in novel environments. Proc. Natl. Acad. Sci. USA 2012, 109, 14058–14062. [Google Scholar] [CrossRef] [PubMed] [Green Version]
  77. Shade, A.; Peter, H.; Allison, S.D.; Baho, D.L.; Berga, M.; Bürgmann, H.; Huber, D.H.; Langenheder, S.; Lennon, J.T.; Martiny, J.B.H.; et al. Fundamentals of microbial community resistance and resilience. Front. Microbiol. 2012, 3, 417. [Google Scholar] [CrossRef] [PubMed] [Green Version]
  78. Rath, K.M.; Maheshwari, A.; Rousk, J. Linking Microbial Community Structure to Trait Distributions and Functions Using Salinity as an Environmental Filter. mBio 2019, 10, e1607–e1619. [Google Scholar] [CrossRef] [PubMed] [Green Version]
  79. Tong, H.; Lili, Y.; Cecilie, H.; Baojian, W.; Ji, C.; Li, Z.; Jiawen, Y.; Xinlin, H. Linking microbial community compositions to cotton nitrogen utilization along soil salinity gradients. Field Crop. Res. 2022, 288, 108697. [Google Scholar] [CrossRef]
  80. Zhou, Z.; Hua, J.; Xue, J. Salinity drives shifts in soil microbial community composition and network complexity along vegetation community succession in coastal tidal flats. Estuar. Coast. Shelf Sci. 2022, 276, 108005. [Google Scholar] [CrossRef]
  81. Navarro, A.; Elia, A.; Conversa, G.; Campi, P.; Mastrorilli, M. Potted mycorrhizal carnation plants and saline stress: Growth, quality and nutritional plant responses. Sci. Hortic. 2012, 140, 139–148. [Google Scholar] [CrossRef]
  82. Gómez-Bellot, M.J.; Ortuño, M.F.; Nortes, P.A.; Vicente-Sánchez, J.; Bañón, S.; Sánchez-Blanco, M.J. Mycorrhizal euonymus plants and reclaimed water: Biomass, water status and nutritional responses. Sci. Hortic. 2015, 186, 61–69. [Google Scholar] [CrossRef]
  83. Nie, S.; Lei, X.; Zhao, L.; Brookes, P.C.; Wang, F.; Chen, C.; Yang, W.; Xing, S. Fungal communities and functions response to long-term fertilization in paddy soils. Appl. Soil Ecol. 2018, 130, 251–258. [Google Scholar] [CrossRef]
  84. Fontaine, S.; Henault, C.; Aamor, A.; Bdioui, N.; Bloor, J.M.G.; Maire, V.; Mary, B.; Revaillot, S.; Maron, P.A. Fungi mediate long term sequestration of carbon and nitrogen in soil through their priming effect. Soil Biol. Biochem. 2011, 43, 86–96. [Google Scholar] [CrossRef]
  85. Swift, M.J.; Heal, O.W.; Anderson, J.M. Decomposition in terrestrial ecosystems. Stud. Ecol. 1979, 5, 2772–2774. [Google Scholar] [CrossRef]
  86. Zhang, X.; Fu, G.; Xing, S.; Fu, W.; Liu, X.; Wu, H.; Zhou, X.; Ma, Y.; Zhang, X.; Chen, B. Structure and diversity of fungal communities in long-term copper-contaminated agricultural soil. Sci. Total Environ. 2022, 806, 151302. [Google Scholar] [CrossRef] [PubMed]
  87. Chen, L.; Zhang, J.; Zhao, B.; Yan, P.; Zhou, G.; Xin, X. Effects of straw amendment and moisture on microbial communities in Chinese fluvo-aquic soil. J. Soils Sediments 2014, 14, 1829–1840. [Google Scholar] [CrossRef]
  88. Wei, K.; Zhang, J.; Wang, Q.; Guo, Y.; Mu, W. Irrigation with ionized brackish water affects cotton yield and water use efficiency. Ind. Crop. Prod. 2022, 175, 114244. [Google Scholar] [CrossRef]
Figure 1. Schematic diagram of the study area. (a) Map of the study area; (b) irrigation water mixing device; (c) cotton planting pattern.
Agronomy 13 01679 g001
Figure 2. Comparison of bulk density (a) and porosity (b) in different layers (0–10 cm, 10–20 cm, and 20–30 cm) between the fresh (FWI), brackish (BWI), and salt (SWI) water irrigation treatments. Error bars represent standard errors. The different lower-case letters indicate significant differences between treatments (p < 0.05; Fisher’s LSD test).
Agronomy 13 01679 g002
Figure 3. Comparison of (a) soil microbial biomass carbon (MBC), (b) soil microbial biomass nitrogen (MBN), (c) MBC/MBN, (d) urease, and (e) sucrase between the fresh (FWI), brackish (BWI), and salt (SWI) water irrigation treatments. Error bars represent standard errors. The different lower-case letters indicate significant differences between treatments (p < 0.05; Fisher’s LSD test).
Agronomy 13 01679 g003
Figure 4. Venn diagrams of bacterial ASV richness and fungal ASV richness. FWI, fresh water; BWI, brackish water; SWI, salt water.
Agronomy 13 01679 g004
Figure 5. Comparison of the Shannon index and observed species of soil microbes between the fresh water, brackish water, and saline water treatment. (a) The Shannon index and observed species of bacteria; (b) the Shannon index and observed species of fungi; (c) NMDS of bacteria; (d) NMDS of fungi. The “p” indicates the K-W test at a significance level of 0.05. The “Stress” indicates the difference between the distance of a point in the 2-dimensional space and the distance of a point in the multi-dimensional space.
Agronomy 13 01679 g005
Figure 6. Distribution of the top 10 soil bacterial phyla (a,b) and fungal phyla (c,d) in different treatments.
Agronomy 13 01679 g006
Figure 7. The LEfSe method utilizing linear discriminant analysis was employed to detect statistically significant variations in the abundance of bacterial taxa across all treatments. (a) Taxonomic representation of important variations among groups shown in the cladogram. (b) LDA scores histogram.
Agronomy 13 01679 g007
Figure 8. The LEfSe method utilizing linear discriminant analysis was employed to detect statistically significant variations in the abundance of fungal taxa across all treatments. (a) Taxonomic representation of important variations among groups shown in the cladogram. (b) LDA scores histogram.
Agronomy 13 01679 g008
Figure 9. RDA ordination diagram for soil indicators and bacterial community structure (a) and fungal community structure (b). Abbreviations are BD, bulk density; SOM, soil organic matter; SOC, soil organic carbon; TN, total nitrogen; SAR, sodium adsorption ratio; SM, soil moisture content; MBC/MBN, the ratio of microbial biomass carbon to microbial biomass nitrogen. FWI1, FWI2, FWI3 are the three samples for the FWI treatment, and the same three samples are included in the BWI and SWI treatments.
Agronomy 13 01679 g009
Figure 10. Results of the correlation analysis between cotton yield, microbial community characteristics, and soil physicochemical properties. BOS, bacterial observed species; BSI, bacterial Shannon indices; FOS, fungal observed species; FSI, fungal Shannon index. The correlation values are mapped by the color of the heat map: the darker the shade of blue, the stronger the negative correlation, and the closer the color to white, the stronger the positive correlation. * means p < 0.05. The thickness of the line between the three nodes and each environmental factor indicates the magnitude of the correlation: the thicker the line, the stronger the correlation, and the weaker, the opposite. The color of the line between the node and the environmental factor indicates the p-value.
Agronomy 13 01679 g010
Table 1. Experimental site soil physical and chemical qualities.
Soil Layer (cm)Soil
Texture
Bulk Density
(g cm−3)
Field Capacity
(%)
Soil Salinity
(g kg−1)
pH
(1:5)
Ions (g L−1)
K+Ca2+Na+Mg2+CO32−ClHCO32−SO42−
0–20Sandy loam1.5921.753.678.330.080.080.900.100.011.140.690.49
20–40Silt loam1.5816.783.268.370.070.090.720.130.020.860.670.57
40–60Sandy loam1.6319.893.078.340.070.090.670.120.010.850.540.58
60–80Sandy1.6412.202.328.320.080.080.520.060.010.640.560.26
Table 2. Total dissolved solids (TDS) (g L−1), electrical conductivity (EC) (mS cm−1), and main element contents (g L−1) of irrigation water in 2019, 2020, and 2021.
YearTreatmentECTDSK+Ca2+Na+Mg2+CO32−ClHCO32−SO42−
2019FWI0.121.000.02 ± 0.002 0.07 ± 0.01 0.15 ±0.020.04 ± 0.01 -0.32 ± 0.05 0.22 ± 0.02 0.13 ± 0.04
BWI0.563.000.06 ± 0.011 0.14 ± 0.010.68 ± 0.080.21 ± 0.03 -0.96 ± 0.030.38 ± 0.030.54 ± 0.06
SWI1.577.000.14 ± 0.018 0.11 ± 0.071.68 ± 0.130.33 ± 0.01 -2.77 ± 0.080.31 ± 0.101.62 ± 0.07
2020FWI0.121.000.01 ± 0.003 0.05 ± 0.010.17 ± 0.010.06 ± 0.01 -0.31 ± 0.05 0.21 ± 0.02 0.19 ±0.02
BWI0.563.000.06 ± 0.009 0.14 ± 0.010.63 ± 0.070.26 ± 0.02 -1.01 ± 0.020.36 ± 0.030.51 ± 0.08
SWI1.577.000.10 ± 0.016 0.16 ± 0.011.67 ± 0.150.28 ± 0.03 -2.76 ± 0.080.47 ± 0.081.52 ± 0.15
2021FWI0.121.000.02 ± 0.002 0.07 ± 0.010.16 ± 0.01 0.06 ± 0.01 -0.28 ± 0.05 0.26 ± 0.02 0.16 ±0.03
BWI0.563.000.04 ± 0.0150.14 ± 0.010.68 ± 0.090.28 ± 0.02 -0.96 ± 0.030.41 ± 0.020.48 ± 0.08
SWI1.577.000.09 ± 0.015 0.16 ± 0.011.55 ± 0.220.29 ± 0.02 -2.78 ± 0.050.49 ± 0.081.60 ± 0.10
“-” indicates no detected content and “±” indicates standard errors.
Table 3. Total nitrogen (TN) (mg L−1), total dissolved solids (TDS) (g L−1), and the primary element contents (g L−1) of groundwater from 2019 to 2021.
DateTNTDSK+Ca2+Na+Mg2+CO32−ClHCO32−SO42−SAR
2019Jun-7.450.020.111.790.330.022.470.312.393.82
Jul-7.760.030.161.980.34-2.720.621.893.96
Aug-8.860.010.202.130.680.023.200.542.073.21
2020Jun-10.680.020.323.140.53-4.650.331.704.82
Jul-8.370.020.372.380.41-3.440.371.393.81
Aug-7.530.010.342.060.31-3.130.351.323.61
2021Jun2.7911.970.060.583.650.45-5.050.351.835.09
Jul-9.980.070.443.010.45-4.110.351.554.51
Aug-11.130.070.553.390.47-4.620.341.704.75
Table 4. Soil physicochemical characteristics (0–20 cm) of the cotton field under different irrigation water treatments.
VariableUnitTreatment
FWIBWISWI
TNg kg−10.42 ab0.38 b0.46 a
APmg kg−112.79 a12.97 a14.30 a
AKmg kg−1180.60 a188.20 a236.17 a
SOMg kg−17.01 ab6.30 b7.71 a
SOCg kg−14.07 ab3.66 b4.47 a
SM%16.31 a16.52 a17.85 a
pH 8.11 a8.25 a8.26 a
ECmS cm−10.93 b1.03 b3.18 a
K+g kg−10.07 b0.06 b0.12 a
Ca2+g kg−10.53 a0.27 b0.58 a
Na+g kg−10.69 c0.92 b1.94 a
Mg2+g kg−10.23 b0.19 c0.42 a
CO32−g kg−1---
HCO3g kg−10.15 c0.20 a0.16 b
Clg kg−10.89 c1.17 b2.49 a
SO42−g kg−11.12 b0.56 c1.34 a
SAR 1.11 c1.92 b2.75 a
TN: total nitrogen; TP: total phosphorus; AK: available potassium; SOM: soil organic matter; SOC: soil organic carbon; SM: soil moisture; SAR: sodium adsorption ratio. Different letters in each line represent significant differences between different treatments (p < 0.05; Fisher’s LSD test). “-” indicates no detected content.
Disclaimer/Publisher’s Note: The statements, opinions and data contained in all publications are solely those of the individual author(s) and contributor(s) and not of MDPI and/or the editor(s). MDPI and/or the editor(s) disclaim responsibility for any injury to people or property resulting from any ideas, methods, instructions or products referred to in the content.

