Article

Evaluation of Vegetative Development of Quinoa under Water Stress by Applying Different Organic Amendments

by
Muhammad Zubair Akram
1,2,*,†,
Angela Libutti
3,*,† and
Anna Rita Rivelli
2
1
Ph.D. Program in Agricultural, Forest and Food Sciences, University of Basilicata, Via dell’Ateneo Lucano, 10, 85100 Potenza, Italy
2
School of Agricultural, Forest, Food and Environmental Sciences, University of Basilicata, Via dell’Ateneo Lucano, 10, 85100 Potenza, Italy
3
Department of Science of Agriculture, Food, Natural Resources and Engineering, University of Foggia, Via Napoli, 25, 71122 Foggia, Italy
*
Authors to whom correspondence should be addressed.
These authors contributed equally to this work.
Agronomy 2023, 13(5), 1412; https://doi.org/10.3390/agronomy13051412
Submission received: 22 April 2023 / Revised: 16 May 2023 / Accepted: 17 May 2023 / Published: 19 May 2023
(This article belongs to the Special Issue Sustainable Resource Management for Crop Production and Quality)

Abstract

:
Prolonged drought periods, increasingly occurring worldwide due to global climate change, could affect the growth and productivity of both traditional and climate-resilient crops, including quinoa. Specifically, the vegetative growing cycle of this species is highly sensitive to drought conditions. In this context, using organic amendments could help plants cope with drought due to their ability to enhance soil water status. So, the current study aimed to investigate the effect of different organic amendments, i.e., two biochars (from woodchips and vineyard prunings) and a vermicompost (from cattle manure), applied to the soil alone and mixed at 2% rate (w/w), on the vegetative development of quinoa (cv. Titicaca), during which a period of water stress was imposed from the twelve-leaf stage to the bud stage. A set of growth-related parameters were measured both during and at the end of the experiment, along with a set of water-related parameters, at the end of the water-stress period and after soil re-watering. The results showed that woodchip biochar, both alone and mixed with vermicompost, significantly affected plant growth during the water-stress period, also allowing a quicker recovery once drought conditions ended. Indeed, the leaf number and area, SPAD index, leaf and stem fresh weight, and dry matter content in plants treated with woodchip biochar, alone and mixed with vermicompost, were higher than vineyard pruning biochar, alone and mixed with vermicompost and similar to the well-watered control plants. Similar results were observed considering the yield contributing traits detected at the end of the experiment, including the main panicle length, number of sub-panicle, as well as fresh weight and dry matter content of both panicle and sub-panicles. Additionally, the water-related parameters, especially the low turgid weight to dry weight ratio of woodchip biochar treated plants, showed evidence of better growth than vineyard pruning biochar. At the end of the experiment, the WUE of plants treated with woodchip biochar and vermicompost, both alone and mixed, was higher than vineyard pruning biochar alone and mixed with vermicompost. Among the tested organic amendments, woodchip biochar alone and mixed with vermicompost positively affected the vegetative growth response of quinoa under water-stress conditions.

1. Introduction

Recently, there is a growing interest in the use of climate-resilient crops to improve global food production and secure future food supply. These crops have the potential to adapt rapidly to changing climatic conditions, providing means to better cope with extreme events, such as drought, flooding, heat, chilling, freezing, and salinity [1]. Among climate-resilient crops intended to maintain or increase crop yield under environmental stress conditions, there is quinoa (Chenopodium quinoa Willd.) [2]. Quinoa is an annual herbaceous dicotyledonous species from the Andean region [3]. Around 7000 years ago, quinoa was cultivated as a main staple food in the Andes region countries, with Bolivia and Peru being the countries that oversaw the most production. Later, from 1980 to 2014, it rapidly spread from 8 to 75 other countries and is now widely cultivated in Canada, the UK, Denmark, China, India, Netherlands, Brazil, Cuba, Italy, and Pakistan [2,3,4]. The General Assembly of the United Nations declared 2013 as the “International Year of Quinoa” due to its important role in food security as global attention focuses more on nutrition and poverty eradication [5]. The plant forms a hollow erect stem with goosefoot-shaped leaves and two types of inflorescences, i.e., glomerulate and amaranthiform, with the glomerulate ones (compact type) considered high yielding [6]. Quinoa has a superior nutritional profile than other traditional crops because of the high content of proteins rich in all essential amino acids, vitamins (E, C and B complex), minerals (Ca, Cu, Mg, Mn, Fe, P, K, Na and Zn), and fiber, along with bioactive compounds, including ferulic and sinapinic acids, flavanols, kaempferol, and quercetin [7]. Its seeds are used to obtain multigrain flour, biscuits, and beer [8]. This species does not contain gluten and has a low glycemic index [9].
Due to the diversity of quinoa ecotypes originating in contrasting agro-environmental conditions, this species has the ability to adapt to various levels of drought via both morphological and physiological adaptive strategies. The whole-plant response to drought involves changes in root and leaf growth and, in some cases, a few ontogenic variations [10]. Growth is much more sensitive to drought stress than photosynthesis. In stressed plants, growth reduction is not just from carbon starvation, i.e., reduced carbon concentrations that can amplify biotic attack because of low production of carbon-based defensive compounds such as resins [11]; there is a sharp and rapid decrease in leaf elongation rate in many plant species, including quinoa [12,13]. In addition, root architecture traits may vary due to many interacting factors, such as growth conditions, drought duration, drought intensity, and plant phenology [14]. Quinoa shows various drought resistance mechanisms, although not all in every genotype, such as tissue elasticity, thick-walled cells, and special epidermal cell bladders that can be used as external water reservoirs and vesicular glands [15,16,17]. Many studies have revealed that quinoa evolved adoptive mechanisms to mitigate drought stress through high water-use efficiency and high shoot/root ratios. Garrido et al. [18] showed a significant interaction between genotypes and the environment for harvest index and grain yield/m2. Considerable variability was observed among stressed quinoa genotypes for grain yield and water-use efficiency. Geerts et al. [19] also found a negative effect of water stress on grain yield and water-use efficiency. Drought stress at the grain filling stage can reduce quinoa plant yield sustainability by affecting plant leaf water potential [10]. It also reduces the crop fresh and dry weights, as well as leaf area [20]. According to several authors [21,22], the high resilience and tolerance of quinoa to adverse climatic conditions make it a good alternative to traditional Mediterranean crops.
Different agronomic strategies could be adopted to mitigate the adverse effects of drought on plant growth and productivity, including the application of organic amendments due to their role in improving soil water retention. Among the organic amendments, biochar and compost have gained even more attention over the last decades for their agronomic and environmental benefits [23,24]. Biochar is a carbon-rich, porous, low-density material derived from the thermochemical decomposition of different biomasses (forest and agriculture residues, manure, sewage sludge) in the absence or limited supply of oxygen (pyrolysis or gasification) [25]. Due to its long-term stability in soil, it provides a useful amendment to mitigate global climate change by sequestering atmospheric CO2 in the soil and reducing greenhouse gas (CO2, CH4, N2O) emissions [26]. Moreover, because of its highly porous structure, large inner surface area, greater negative surface charge, and charge density, biochar may have a positive impact on the physical, chemical, and microbiological properties of soil. It is reported to improve soil’s structure and porosity, water-holding capacity and hydraulic conductivity, cation and anion exchange capacity, nutrient retention and availability (to decrease soil bulk density), and nutrient leaching to stimulate soil microbial biomass and activity [27,28,29,30]. In particular, the ability of biochar to increase soil water retention has been extensively reported in the literature, under both controlled (laboratory, lysimeters and pots) [31] and open-field conditions [32,33,34], although the effect is dependent on the characteristics of both soil (texture and structure) and biochar (feedstock and thermochemical treatment). Compost is a humus-like product derived from the decomposition, stabilization, and sanitation of organic residues from plants and animals through the action of aerobic microorganisms under controlled conditions [35]. It is widely recognized as an organic amendment with beneficial agronomic advantages, with its effect depending on compost amount, type, degree of humification, and soil properties [36,37]. It is reported to efficiently enhance soil organic matter and nutrient content, including N, P, K, Ca, and Mg [38], to improve soil structure, porosity [39], water retention, and hydraulic conductivity [40]. Compost also enhances soil fertility, plant growth, and productivity [40,41,42,43,44,45]. Using organic amendments, such as biochar and compost, from eco-friendly technologies regarding the residue recycling of plant and animal organic waste [46,47,48,49,50] is now recognized as a sustainable strategy of soil management and agricultural productivity. This is also in line with most of the 17 Sustainable Development Goals (SDG) of the United Nations (2030 Agenda), including sustainable production and consumption and climate action, as well as with the targets for sustainable food production outlined by the “Farm to the Fork” (F2F) Strategy within the European Green Deal (e.g., reducing at least 20% of fertilizer application whilst retaining soil fertility).
Only a few studies are available in the literature regarding the cultivation of quinoa by using organic amendments. Kamman et al. [51] found increased growth, drought tolerance, leaf N, and water-use efficiency despite larger leaf areas following the application of biochar from peanut hull residues to soil. Ramzani et al. [52] reported that the application of acidified biochar is more valuable for improving the growth and yield of quinoa than acidified compost. They also observed an increase in the nutritional value of quinoa due to an increase in antioxidant levels, decrease in reactive oxygen species levels, and antinutrients (phytate and polyphenols). Moreover, the natural ability of quinoa to cope with water stress was mostly investigated when drought occurs during the reproductive growth stages [53,54,55] rather than the vegetative ones. However, the susceptibility of quinoa to drought is reported to be high during the vegetative stages of the growing cycle [56]. In light of this and also considering the capability of organic amendments in addressing drought stress among plants [57,58], the current study aimed to investigate the effect of two biochar types and a vermicompost on a set of growth- and water-related parameters when quinoa is under water-stress conditions during vegetative development, i.e., from the twelve-leaf stage to the bud stage. We hypothesized that the application of organic amendments could improve the vegetative growth performance of quinoa (cv Titicaca) when facing water-stress conditions.

2. Materials and Methods

2.1. Experimental Layout and Characteristics of Soil and Organic Amendments

The experiment was carried out during spring–summer in 2022 on quinoa (Chenopodium quinoa, Wild.), cultivar “Titicaca”, at the University of Basilicata, Potenza (PZ, 40°38′ N–15°48′ E, 819 m a.s.l.) in Southern Italy, under natural light in a temperature-controlled glasshouse maintained at 26 °C during the day and 18 °C during the night.
Plants were grown in pots on soil treated with different organic amendments, including two types of biochar, one derived from woodchips (B1) and the other from vineyard prunings (B2), and a vermicompost derived from cattle manure (V). Each organic amendment was applied to the soil alone (B1, B2, or V) at a rate of 2% of soil dry weight (dw) and mixed (B1+V or B2+V) with a B1:V and B2:V ratio equal to 1:1 (both biochar and vermicompost at 2% rate). An untreated soil was considered as the control and was replicated six times in order to have two set of control pots, indicated as Cw and Cs. While Cw was well-irrigated throughout the whole experimental trial, Cs was utilized in the water-stress period described in Section 2.2. Each experimental treatment was replicated three times. The resulting 21 experimental units were arranged according to a completely randomized design.
For the experiment, a soil collected from the 0–0.30 m upper soil layer within an agricultural farm located in the Potenza district was used. Based on analytical characterization performed before the experiment started and according to the official analytical methods reported in the Italian Official Gazette n. 248 [59], the resulting soil had a sandy-loam texture (USDA classification), with the physico-chemical characteristics reported in Table 1.
The biochar from woodchips was provided by a company located in northern Italy (Ivrea, Torino district), which specializes in producing commercial biochar in an industrial pyrolysis plant of one’s own design, using wood wastes from the cleaning of green areas and woods within a controlled supply chain. The biochar from vineyard pruning residues was self-produced at the STAR*Facility Centre of Foggia University (South Italy region). The residual biomasses from the pruning of a vineyard located in the agricultural area of the Foggia district were firstly dried (15% humidity), then chipped (approx. 50 mm), and finally pyrolyzed in a pilot-scale plant with a fixed-bed tubular reactor (30 L capacity) at a temperature of 750 °C (heating rate of 10 °C min−1) for 8 h. Before the experiment, both biochars were crushed in finer fractions and sieved to ≤2 mm. The vermicompost was provided by a company located in southern Italy (Montescaglioso, Matera district), which specializes in producing high-quality organic fertilizers and amendments through an industrial composting process of organic residues from olive mills, crops, and livestock. More specifically, it was a commercial product derived from cattle manure bio-stabilization. Before use in the experiment, both biochars and the vermicompost were analyzed to determine the set of chemical properties shown in Table 2. The applied analytical procedures are detailed in Rivelli and Libutti [43].
The two biochars were characterized by the typical alkaline pH value and high C content. They fully complied with the standards fixed by both the European Biochar Certificate (EBC) [60] and the International Biochar Initiative (IBI) [61], in terms of C (>50%) and Corg (>60%) contents as well as H/Corg (≤0.7) and O/Corg (≤0.4) molar ratio values, both resulting in Class 1 biochar. The vermicompost was a stabilized organic amendment with good Corg and N content and a slightly alkaline pH value. Further information about the chemical properties of the two biochars and the vermicompost are shown in Table 2.

2.2. Experimental Set-up and Conditions

Plastic pots (25 cm height, 18 cm width and length) were filled with 5 kg of soil. The biochars and vermicompost were mixed into the soil before pot filling. After, the soil water content was brought to FC (previously determined at −0.03 MPa, along with the permanent wilting point (PWP) at −1.5 MPa) for each experimental treatment by using a pressure plate apparatus (Soil moisture Equipment Corp., Goleta, CA, USA). Then, 10 quinoa seeds were sown in each pot. After the complete seedlings emerged, the latter were thinned out to have one plant per pot. After thinning, soil surface was covered with a 3 cm layer of polythene beads in order to prevent water loss through evaporation.
All the treatments were well-watered until they reached the phenological twelve-leaf stage, i.e., at 26 days DAS. After that, they were subjected to a water-stress period that lasted up until the bud stage, i.e., at 35 DAS. An extra three control pots were maintained and well-watered throughout the whole experimental period (Cw). The well-watered conditions (for each experimental treatment) consisted of the application of an amount of water that brought the soil water content to FC at each watering by fixing the intervention limit at the depletion of 40% of the available water, and this was checked daily by weighing the pots at the same hour (8:00–9:00). For each experimental treatment, the water-stress period consisted of the application of two successive drought cycles by withholding watering until the soil water content reached the PWP. At the end of each drought cycle, re-watering increased soil water content to FC. After the second drought cycle, the well-watered conditions were maintained until the end of the experiment, when plants reached the phenological stage of flowering initiation, i.e., at 48 DAS. At this time, plants were cut from the pots and divided into stems, leaves, panicles, and sub-panicles for the following measurements.

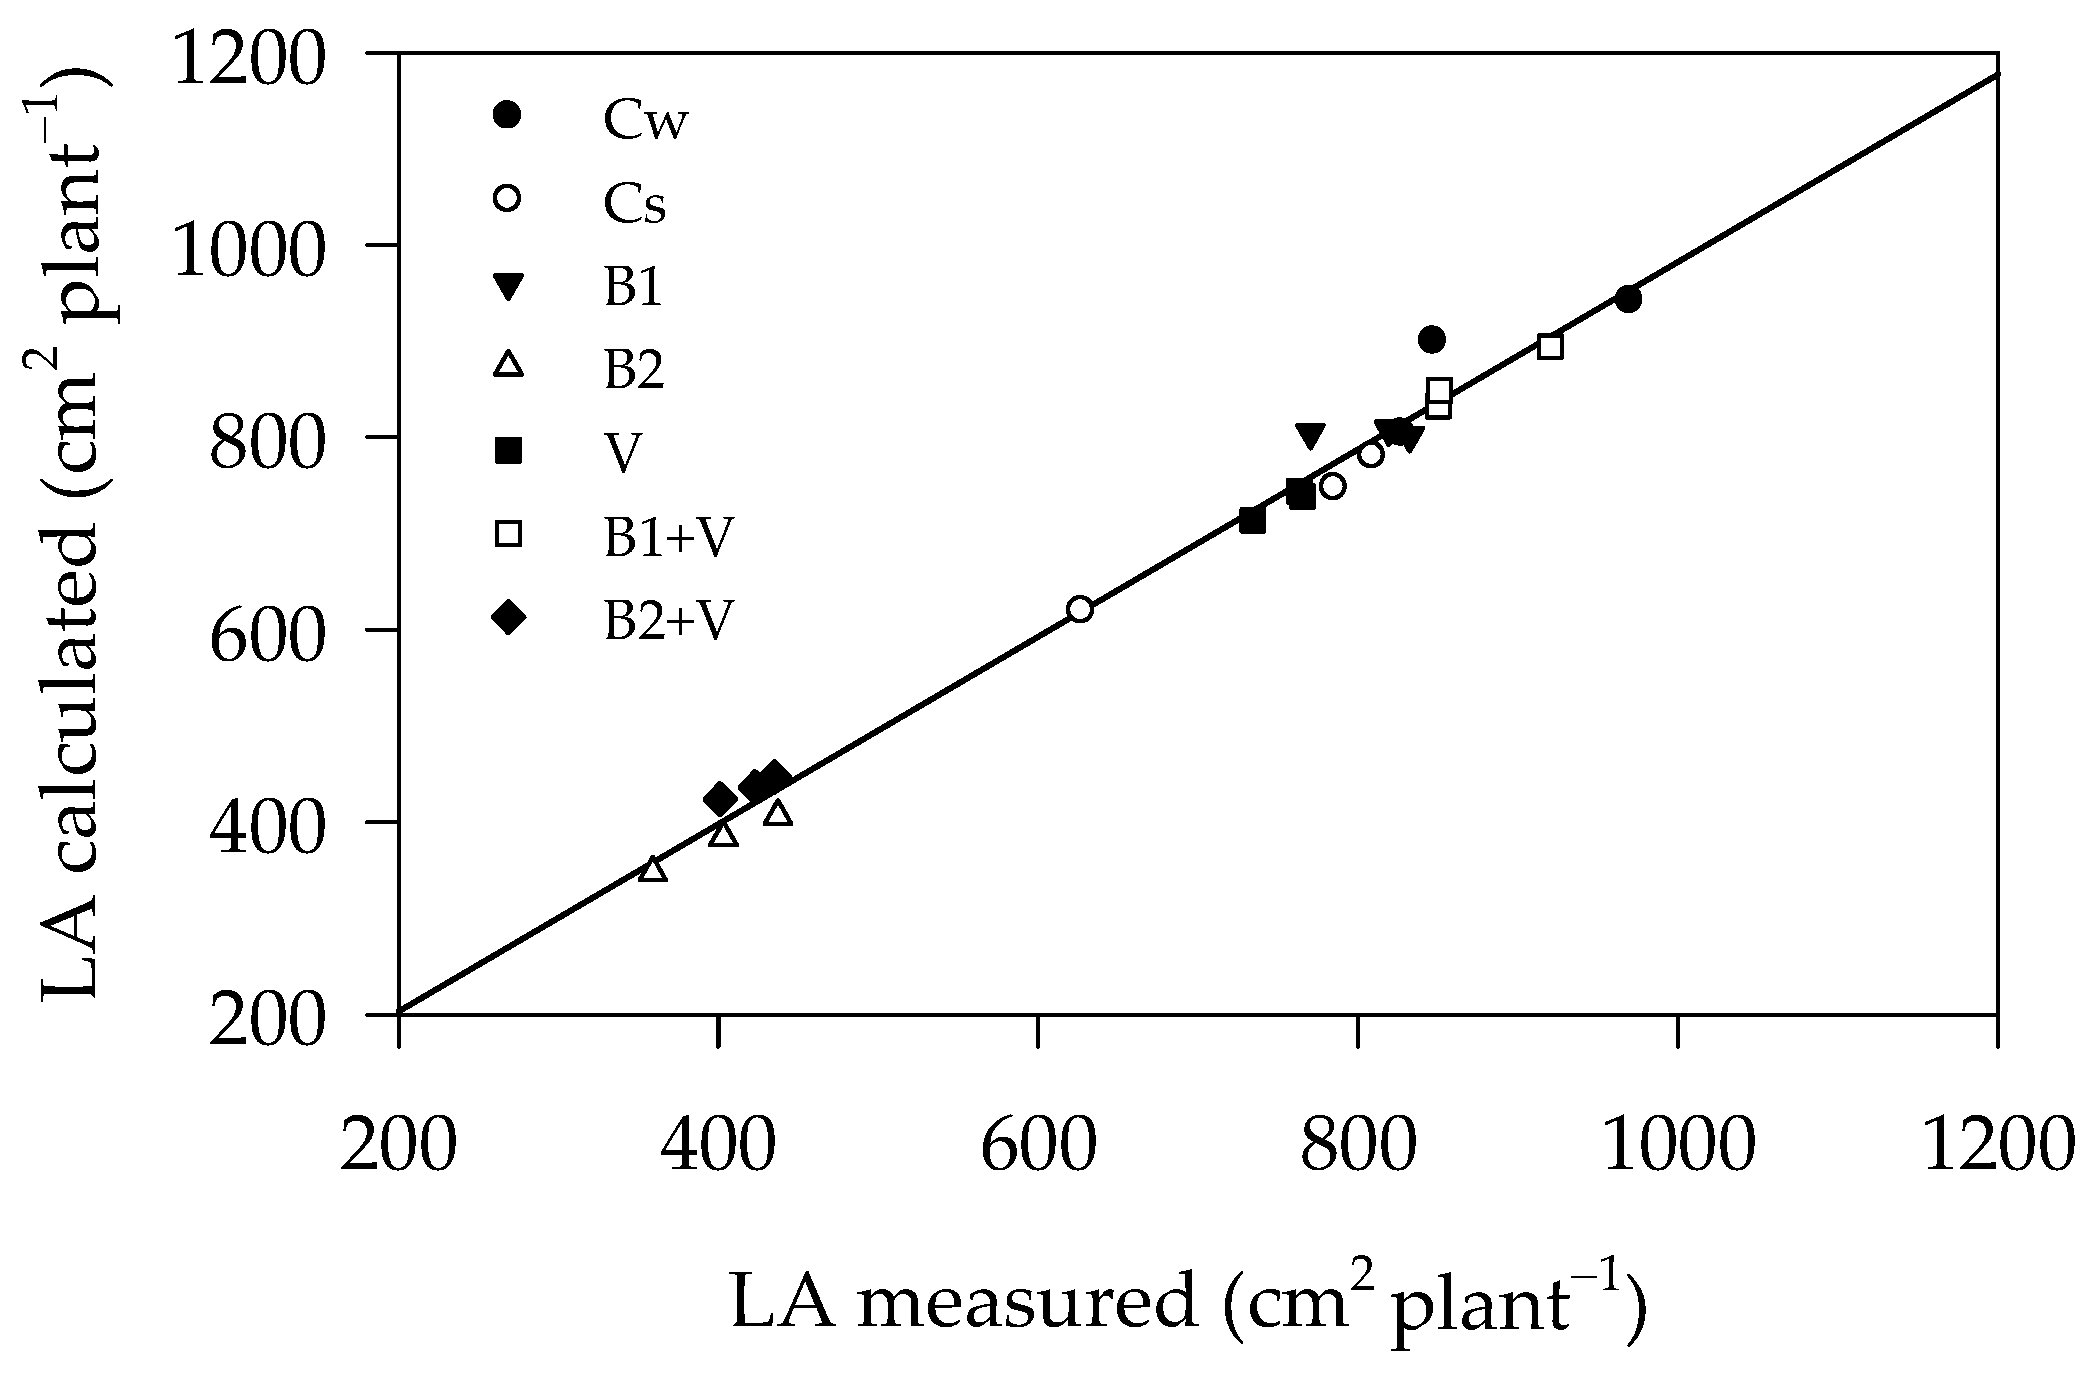
2.3. Plant Measurements

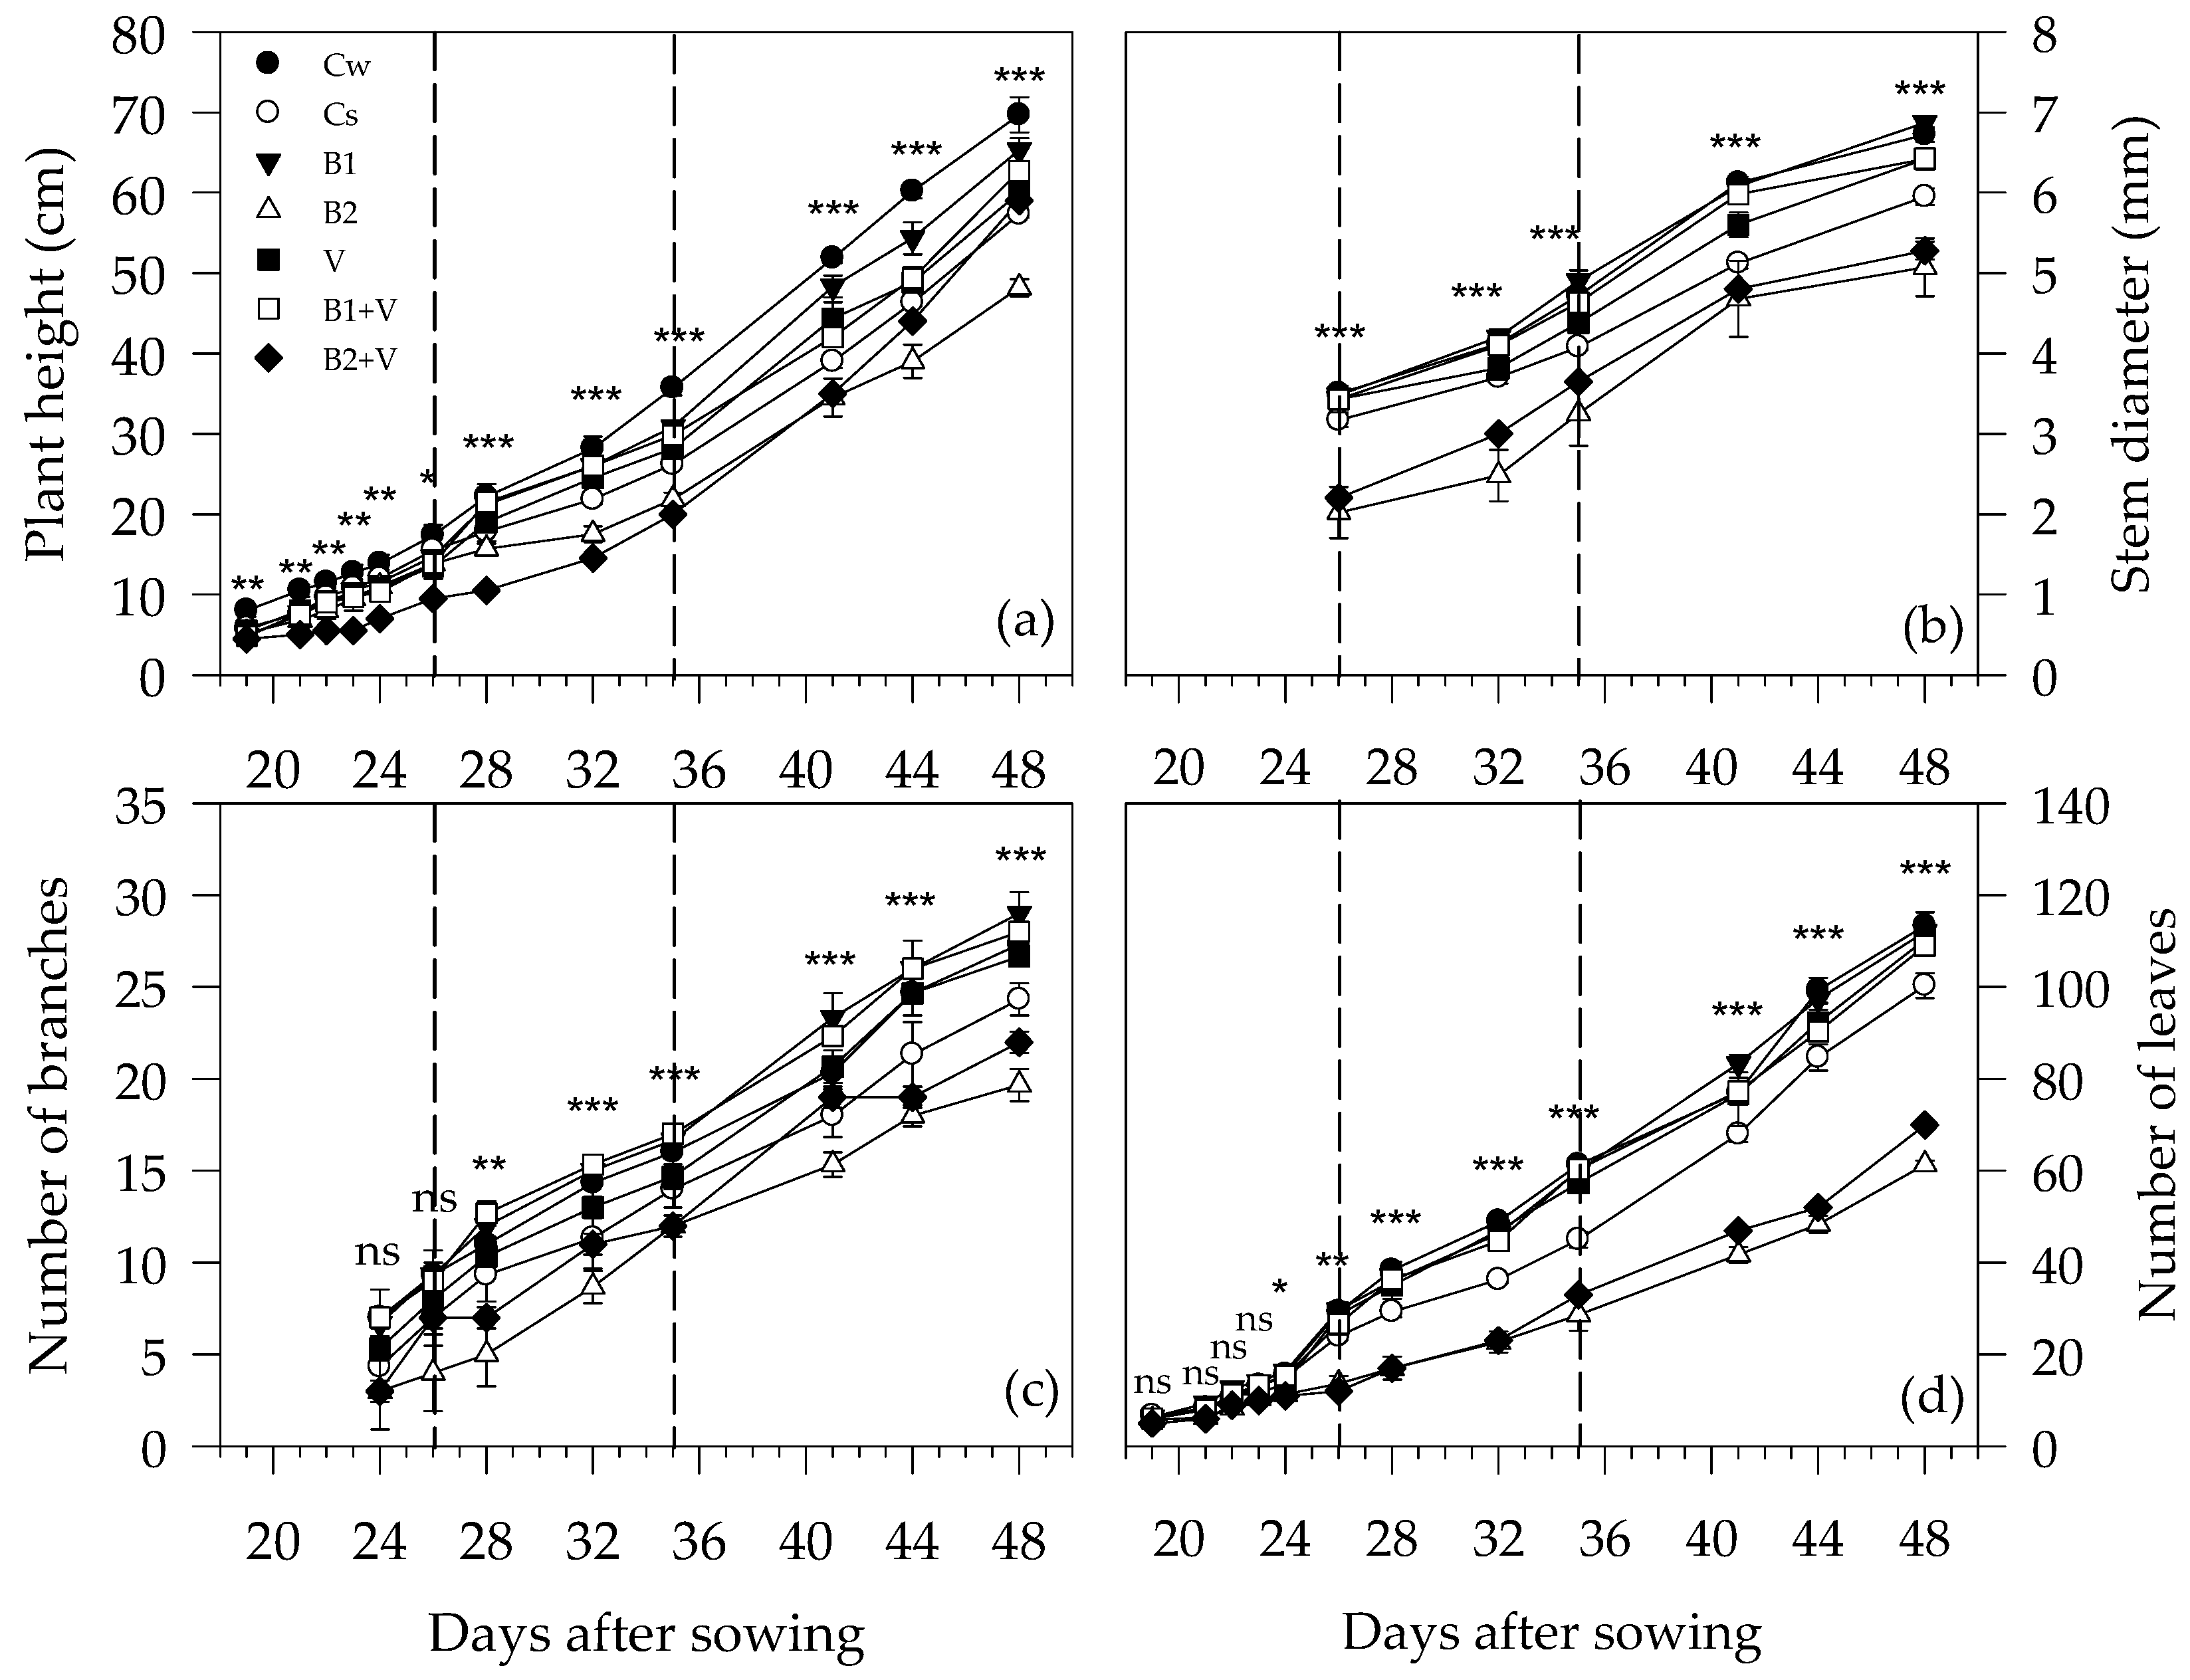
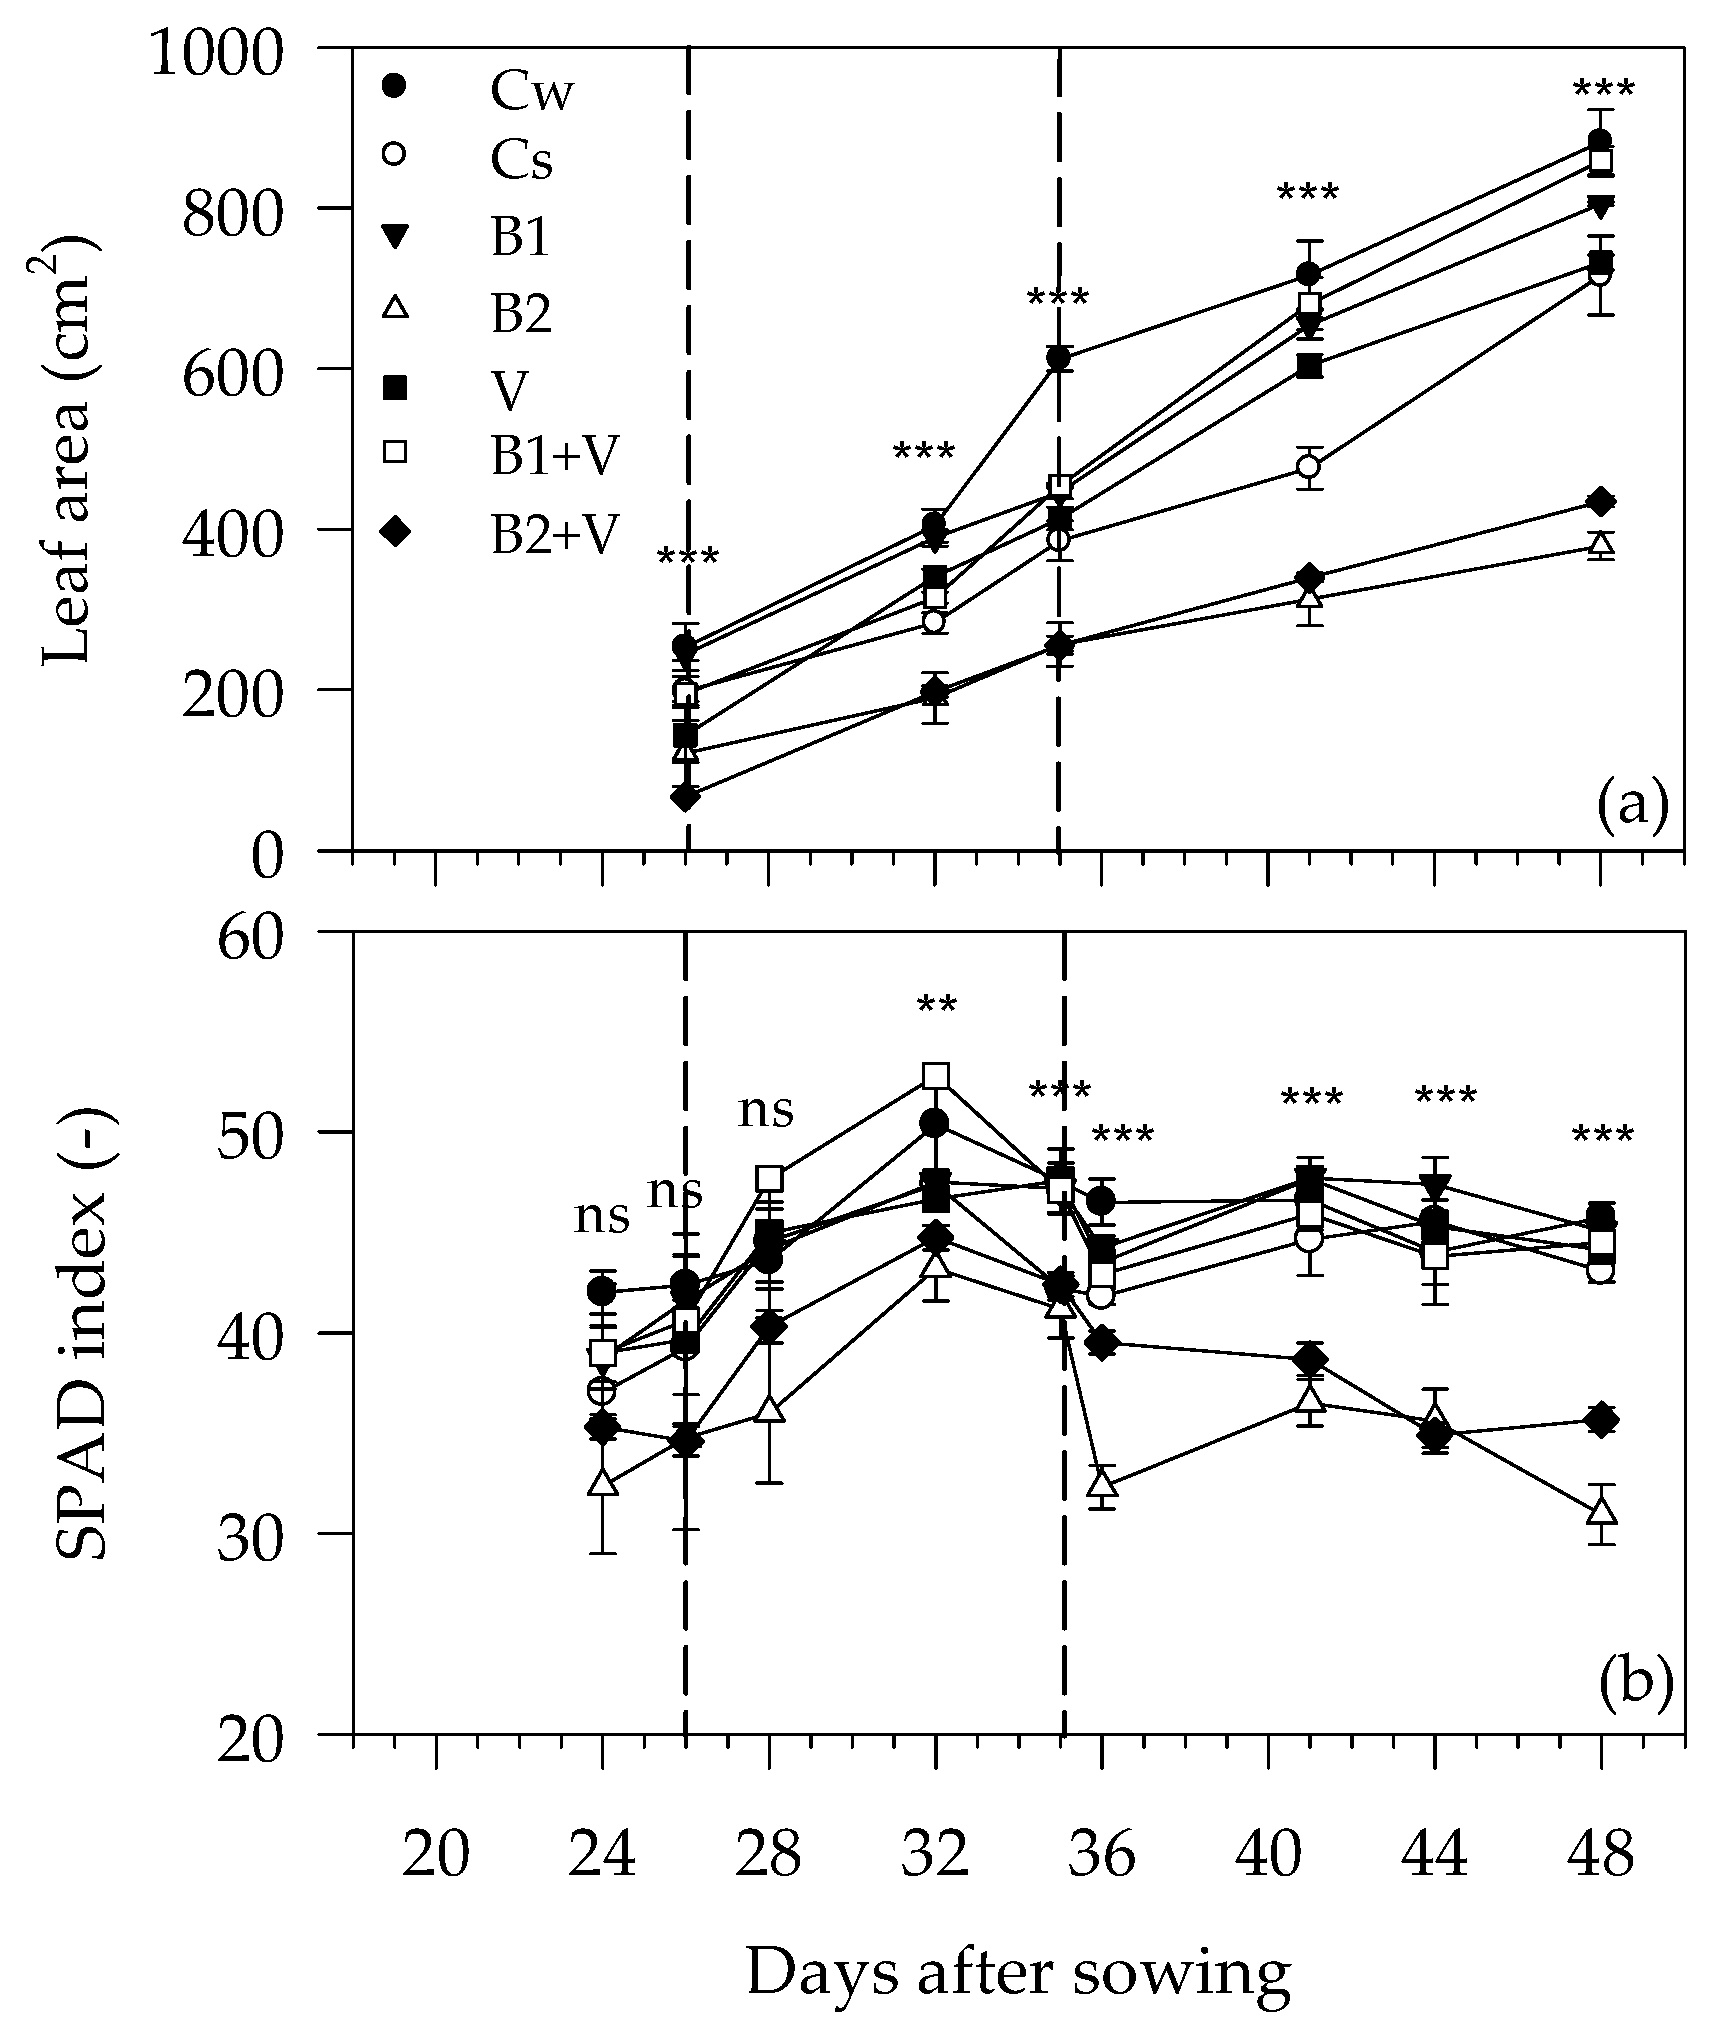
2.3.1. Growth-Related Parameters

From sowing until the end of the experiment, phenological stages were monitored, according to the scale defined by Jacobsen and Stolen [62], by visiting the experimental area daily. The times of seedling emergence, leaf development stages (two-, six-, eight-, ten-, and twelve-leaf), bud and flowering initiation were recorded when more than 50% of plants in each treatment reached those stages.
During the experiment, a set of plant growth-related parameters was also measured, on average, twice a week. More specifically, the plant height (cm), stem diameter (mm), number of branches (n°), and leaves per plant (n°), as well as the length and width (cm) of each leaf per plant were recorded. Similarly, the SPAD index per plant was measured. For this, a hand-held SPAD-502 m (Konica-Minolta corporation, Ltd., Osaka, Japan) was used to obtain three SPAD readings on the youngest, fully expanded leaf per plant.
At the end of the experiment, the fresh weights (FW, g) of leaves, stems, main panicle, and sub-panicles per plant were measured. In addition, the length of main panicle (cm) and the number of sub-panicles per plant were recorded. The leaf area per plant (LA, cm2) was measured by using a LI-COR leaf area meter (Model 3100, Inc., Lincoln, NE, USA). After that, the leaves, stems, main panicle, and sub-panicles of each plant were dried in a ventilated oven at 70 °C until they reached a steady weight to determine the corresponding dry weights (DW, g). Then, their dry matter content (DM, %) was calculated.
The LA per plant was also calculated by using the leaf length (L) and width (W) measurements obtained at the end of the experiment. For this, the LA of each leaf was first determined by applying Equation (1), proposed for the “Titicaca” cultivar grown under glasshouse conditions by Talebnejad and Sepaskhah [63]:
LA = 0.64   ( L × W ) ,
Then, the LA per plant was calculated by summing the LA of each leaf. A set of more than 600 leaves from all treatments was considered.
Successively, in order to verify the model validity within our experimental conditions, a correlation analysis was applied to measure and calculate LA data (Figure 1).
A strong correlation (r2 = 0.98; p < 0.0001) was observed between the two sets of data. Therefore, using the leaf length and width measurements obtained during the experiment, the model was applied to obtain the LA per plant over the whole growing cycle.
Finally, the Absolute Growth Rate (AGR, cm d−1) per plant was calculated in the following three periods of the growing cycle: (1) from six- to twelve-leaf stage; (2) from twelve-leaf stage to bud stage (water-stress period); (3) from bud stage to flowering initiation stage. For this, the plant height measurements obtained at the start (H1, cm) and end (H2, cm) of each period, as well as the duration (t2–t1, days) of each period, were used to determine the AGR1, AGR2, and AGR3 values, respectively.

2.3.2. Water-Related Parameters

A set of water-related parameters was measured both at the end of the water-stress period and after the re-watering that restored soil water content at FC. More specifically, the leaf relative water content (RWC, %) was determined by taking a segment from the youngest, fully expanded leaf per plant and immediately weighing it for FW. After that, the leaf segment was kept in distilled water for 24 h at 4 °C to determine its turgid weight (TW, g). After drying in a ventilated oven at 70 °C until a steady weight, the DW was determined. The RWC was then calculated by Equation (2):
RWC = FW DW TW DW   ×   100 ,
The leaf turgid weight to dry weight ratio (TW/DW) per plant was also calculated.
In addition, the leaf water potential (Ψ, MPa), osmotic potential (Ψπ, MPa), and turgor (Ψp, MPa) were measured. In particular, the Ψ was measured at mid-day on the youngest, fully expanded leaf per plant by using the Scholander pressure chamber (PMS model 1000, Corvallis, OR, USA). For Ψπ measurement, leaf samples were frozen immediately in liquid nitrogen and stored at −20 °C. The Ψπ was determined by extracting sap from leaf tissues, according to Smith and Lüttge [64]. Osmolarity of the sap was measured with a Micro-Digital Osmometer type 6, freezing point depression osmometer (Roebling Berlin, Germany), and then Ψπ was calculated from osmolarity by using the van’t Hoff equation. Ψp was estimated to be the difference between Ψ and Ψπ.
At the end of the experiment, the total water consumption (TWC, L) over the growing cycle was determined by cumulating the amount of water supplied to the plants at each watering, along with the water-use efficiency (WUE, g L−1), calculated as the ratio of total plant fresh weight (TFW, g) to TWC.

2.4. Statistical Analysis

All the experimental data were first checked for normality and homogeneity of variance and then processed by one-way analysis of variance (ANOVA). When significant differences among means were detected, the latter were compared by Tukey’s honest significance difference post hoc test at the 5% probability level.
Statistical analysis was carried out by using “Statistix” software version 8.1. Correlation analysis, applied in order to estimate the relationship between measured and calculated LA values, was performed using the same software.

3. Results

3.1. Phenological Stages

The time of the phenological stages recorded during the experiment, expressed as DAS, are reported in Table 3. Only the seedling emergence and the two-leaf stages were significantly influenced by soil treatment with organic amendments.
In particular, the time for seedling emergence was significantly higher (p ≤ 0.001) in the soil amended with biochar from vineyard prunings, both mixed with vermicompost (B2+V) and alone (B2), than the controls (Cw and Cs). The contrary occurred in soil amended with biochar from woodchips and vermicompost, both applied alone (B1 and V, respectively) and mixed (B1+V), which resulted in similar seedling emergence times than Cw and Cs. The time of the two-leaf stage was higher in Cs, B1, and B2+V than Cw and V, with these latter not statistically different from B2 and B1+V.
Considering the other phenological stages, no statistical differences were found among the treatments. Irrespective of the latter, the plants showed the same phenological performance, taking a similar amount of time to get into the stages from six- to twelve-leaf development, bud initiation, and flowering initiation.

3.2. Growth-Related Parameters during the Experiment

The time-trends of the growth-related parameters, i.e., plant height, stem diameter, number of branches, and number of leaves, as determined during the growing cycle, are reported in Figure 2. Plant height was significantly influenced by soil treatment with organic amendments. Initially, both at 19 and 21 DAS, plant height (Figure 2a) showed the highest (p ≤ 0.01) value in Cw than the other treatments, but successively, at 22 DAS, this parameter was higher (p ≤ 0.01) in Cw than B1, B2, B1+V, and B2+V, without any statistical difference from Cs and V. At 23 and 24 DAS, as well as at the beginning of the water-stress period (at 26 DAS), plant height was also higher (p ≤ 0.01) in B1, B2, and B1+V, with the lowest value in B2+V. Conversely, as the drought conditions proceeded, at 28 and 32 DAS, plant height was higher (p ≤ 0.001) in Cw than Cs, B2, V, and B2+V, without any statistical differences from B1 and B1+V. At the end of the stress period, at 35 DAS, plant height reached the highest (p ≤ 0.001) value again in Cw, with the lowest one in B2+V, and this trend was reflected in the subsequent period of the vegetative growth until the end of the experiment (from 35 to 48 DAS).
Additionally, with regards to the stem diameter (Figure 2b), the significant influence of the experimental treatments was observed. At the start of the drought period, at 26 DAS, both Cw and Cs, as well as B1, V, and B1+V, which did not differ from each other, showed a higher (p ≤ 0.001) stem diameter than B2 and B2+V. As the water stress increased, at 32 and 35 DAS, the stem diameter of plants grown in Cw resulted in a higher (p ≤ 0.001) value than Cs, B2, and B2+V, with no statistical differences from B1, V, and B1+V. These latter proved to minimize the drought effects and support aspects of plant development, such as Cw, and this was also observed after the water-stress period, from 36 to 48 DAS.
The number of branches (Figure 2c) was shown to be significantly influenced by soil treatment with organic amendments by the fact that, at 28 DAS, Cw-, as well as B1 and B1+V-treated plants, exhibited a higher (p ≤ 0.001) number of branches than Cs, B2, and B2+V. The same trend was observed during the water-stress period (32 and 35 DAS) and successively until the end of the experiment.
A very similar response was observed regarding the number of leaves (Figure 2d). The plants grown on B1, V, and B1+V always produced a significantly (p ≤ 0.001) number of leaves (similar to Cw) than Cs, B2, and B2+V, starting from 24 to 48 DAS.
Additionally, the leaf area (LA) was significantly influenced by the experimental treatments, as reported in Figure 3a. When the water-stress period started (26 DAS), the two controls, Cw and Cs, as well as B1, V, and B1+V, which did not differ from each other, showed higher LA (p ≤ 0.001) than B2 and B2+V. At 32 DAS, as drought conditions intensified, only Cw and B1 showed higher (p ≤ 0.001) LA than the other treatments. At the end of the water-stress period (35 DAS), the highest (p ≤ 0.001) LA was observed in Cw. Once removed from the water-stress conditions, from 41 DAS until the end of the experiment, B1 and B1+V treated plants increased their LA, with no statistical difference from Cw (p ≤ 0.001).
The SPAD index (Figure 3b) proved to be influenced by soil treatment with organic amendments starting from 32 DAS until the end of the experiment. At 32 DAS, a higher (p ≤ 0.01) SPAD index was recorded in Cw compared to Cs, B2, V, and B2+V. Moreover, this SPAD index was not statistically different from B1 and B1+V. At the end of the water-stress period (35 DAS), V also reached a higher SPAD index (p ≤ 0.001) than Cs, B2, and B2+V, similar to Cw, B1, and B1+V. A similar trend of SPAD index was observed after the water-stress period until the end of the experiment.
Among the considered growth parameters, the Absolute Growth Rate (AGR) periodically determined throughout the vegetative cycle (Table 4) was shown to be influenced by the experimental treatments. Initially, the AGR1 calculated from the six-to twelve-leaf stage was similar in all the considered experimental treatments, except for B2+V, which, on the contrary, showed the lowest (p ≤ 0.05) value. The AGR2, calculated successively, from the twelve-leaf to bud stage when water stress was applied, resulted in a higher (p ≤ 0.001) value in Cw than Cs, B2, and B2+V, without any statistical difference from B1 and B1+V. In contrast, in the final period of the vegetative cycle, from the bud to flowering initiation stage, the calculated AGR3 showed the highest (p ≤ 0.001) value in B2+V than the other treatments. No statistical differences were found among the two controls (Cw and Cs), B1, V, and B1+V, with the lowest value in B2.

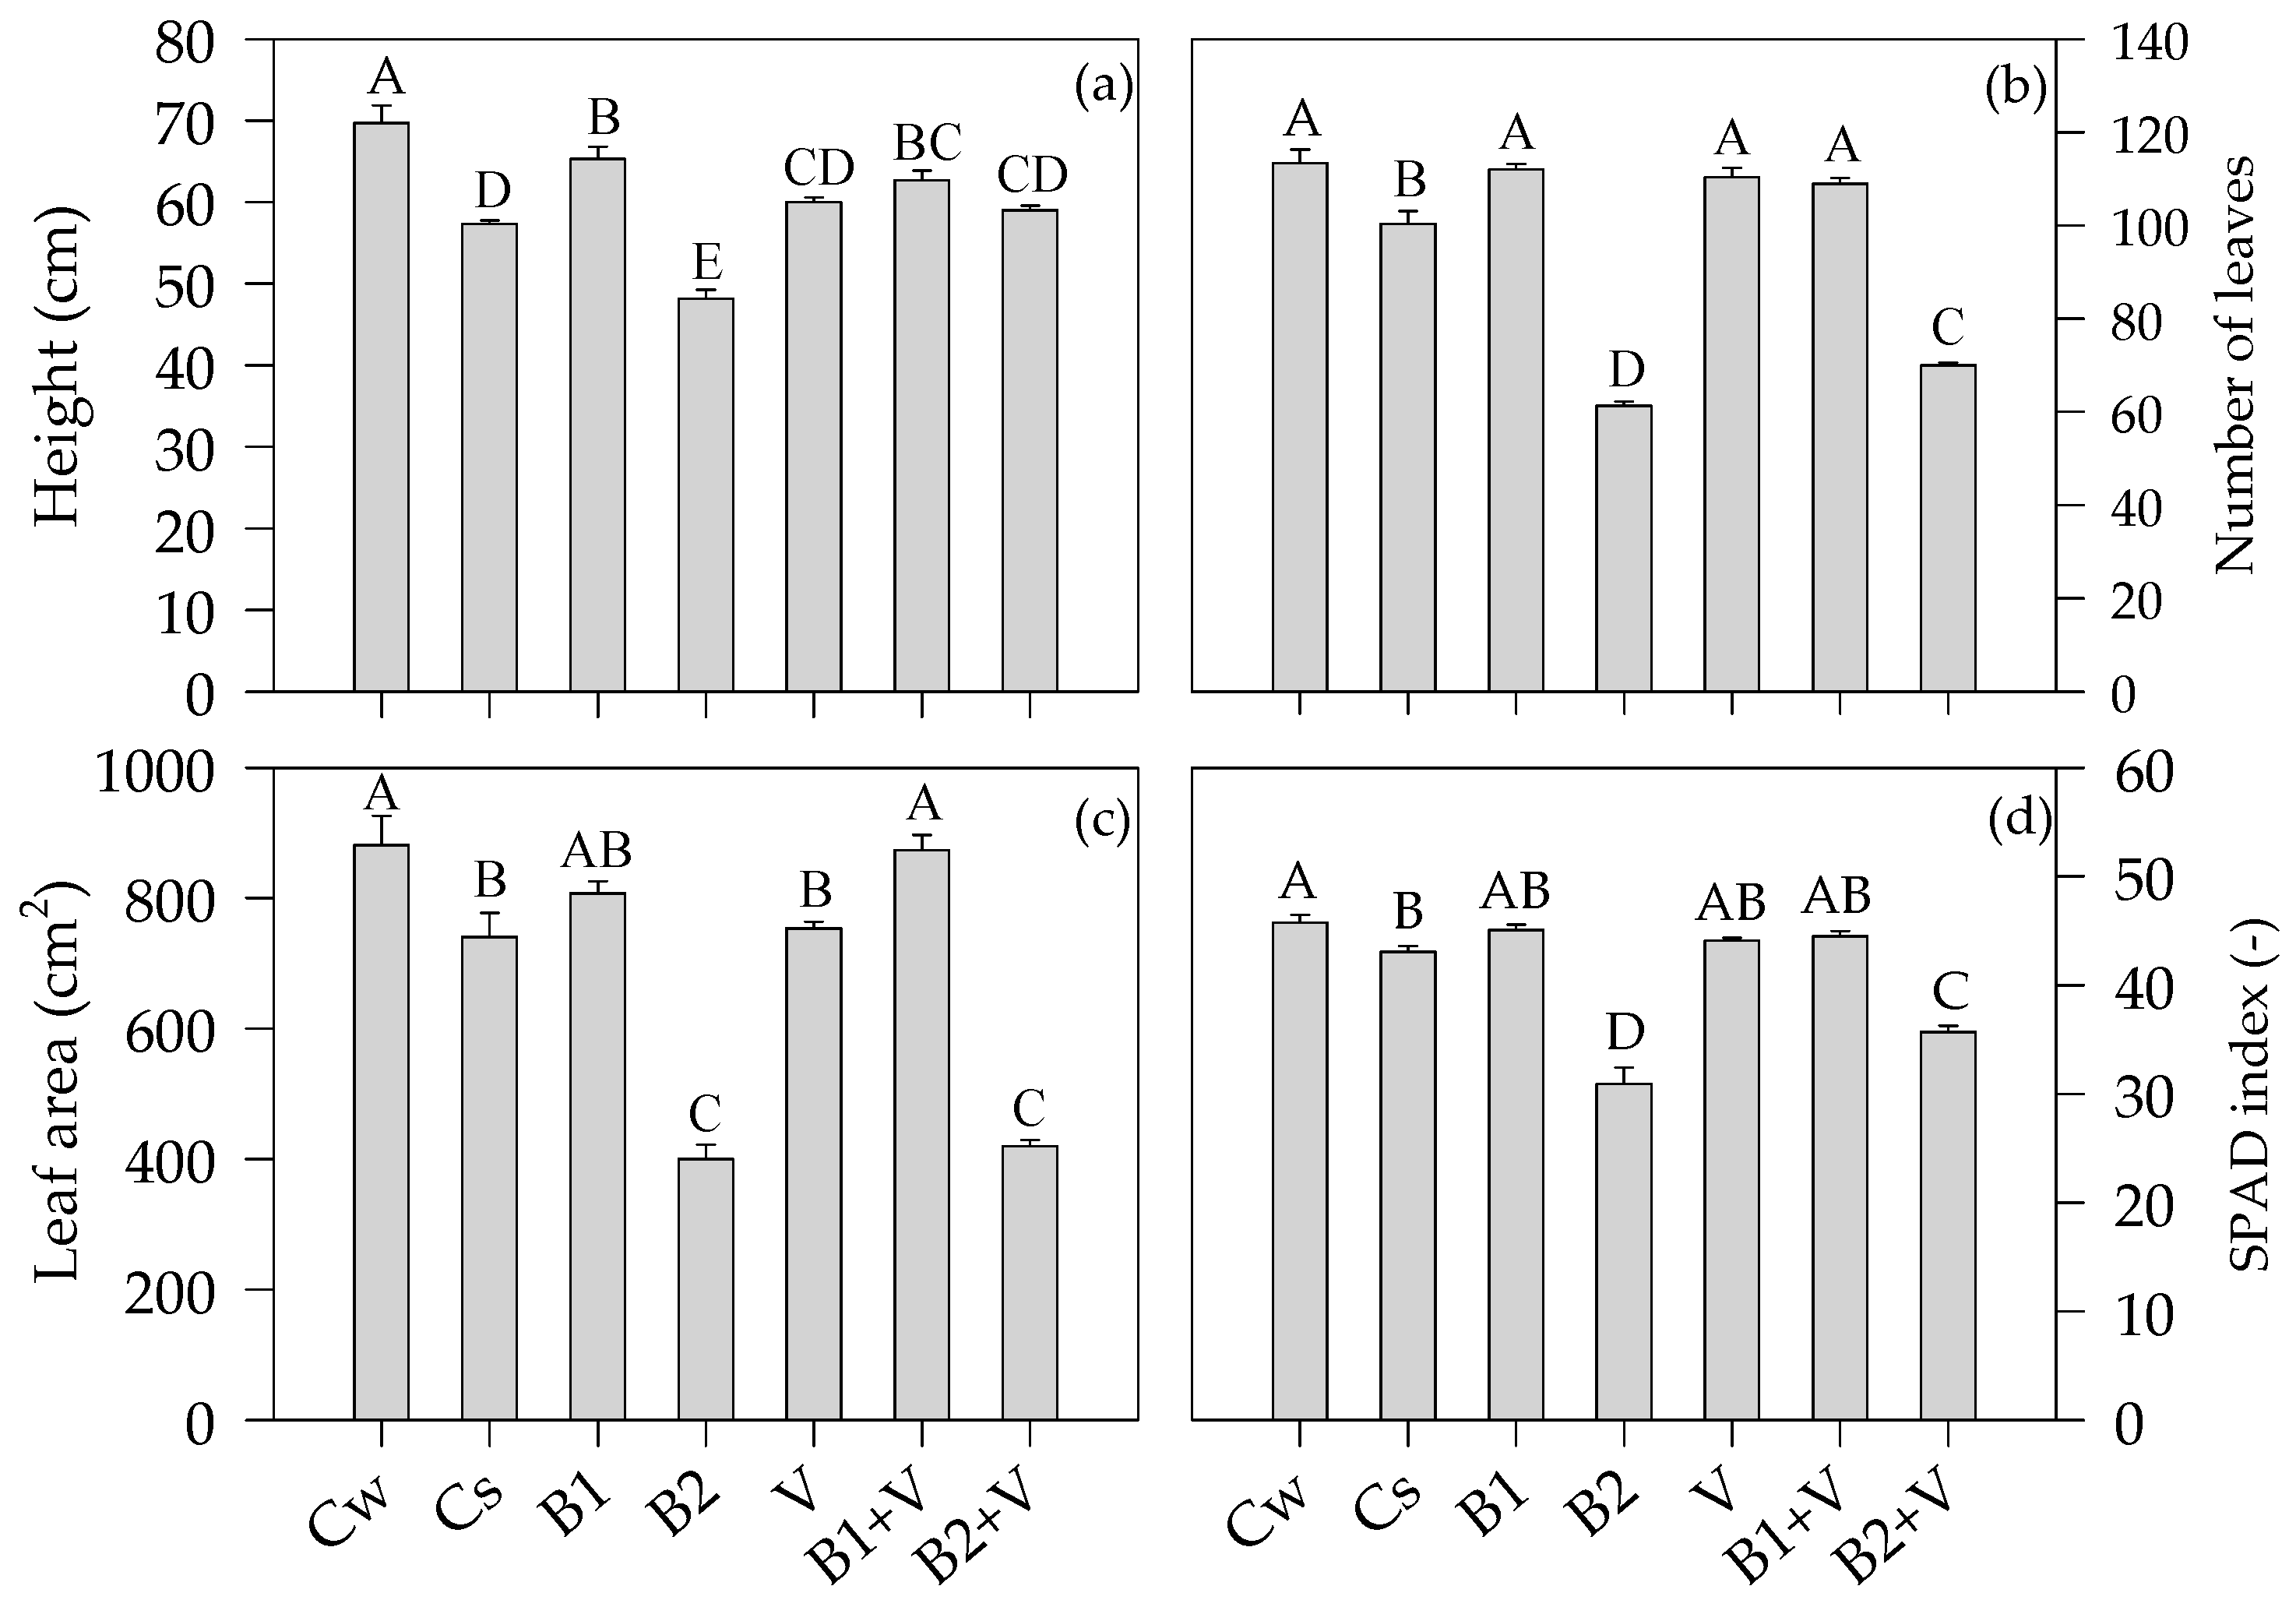
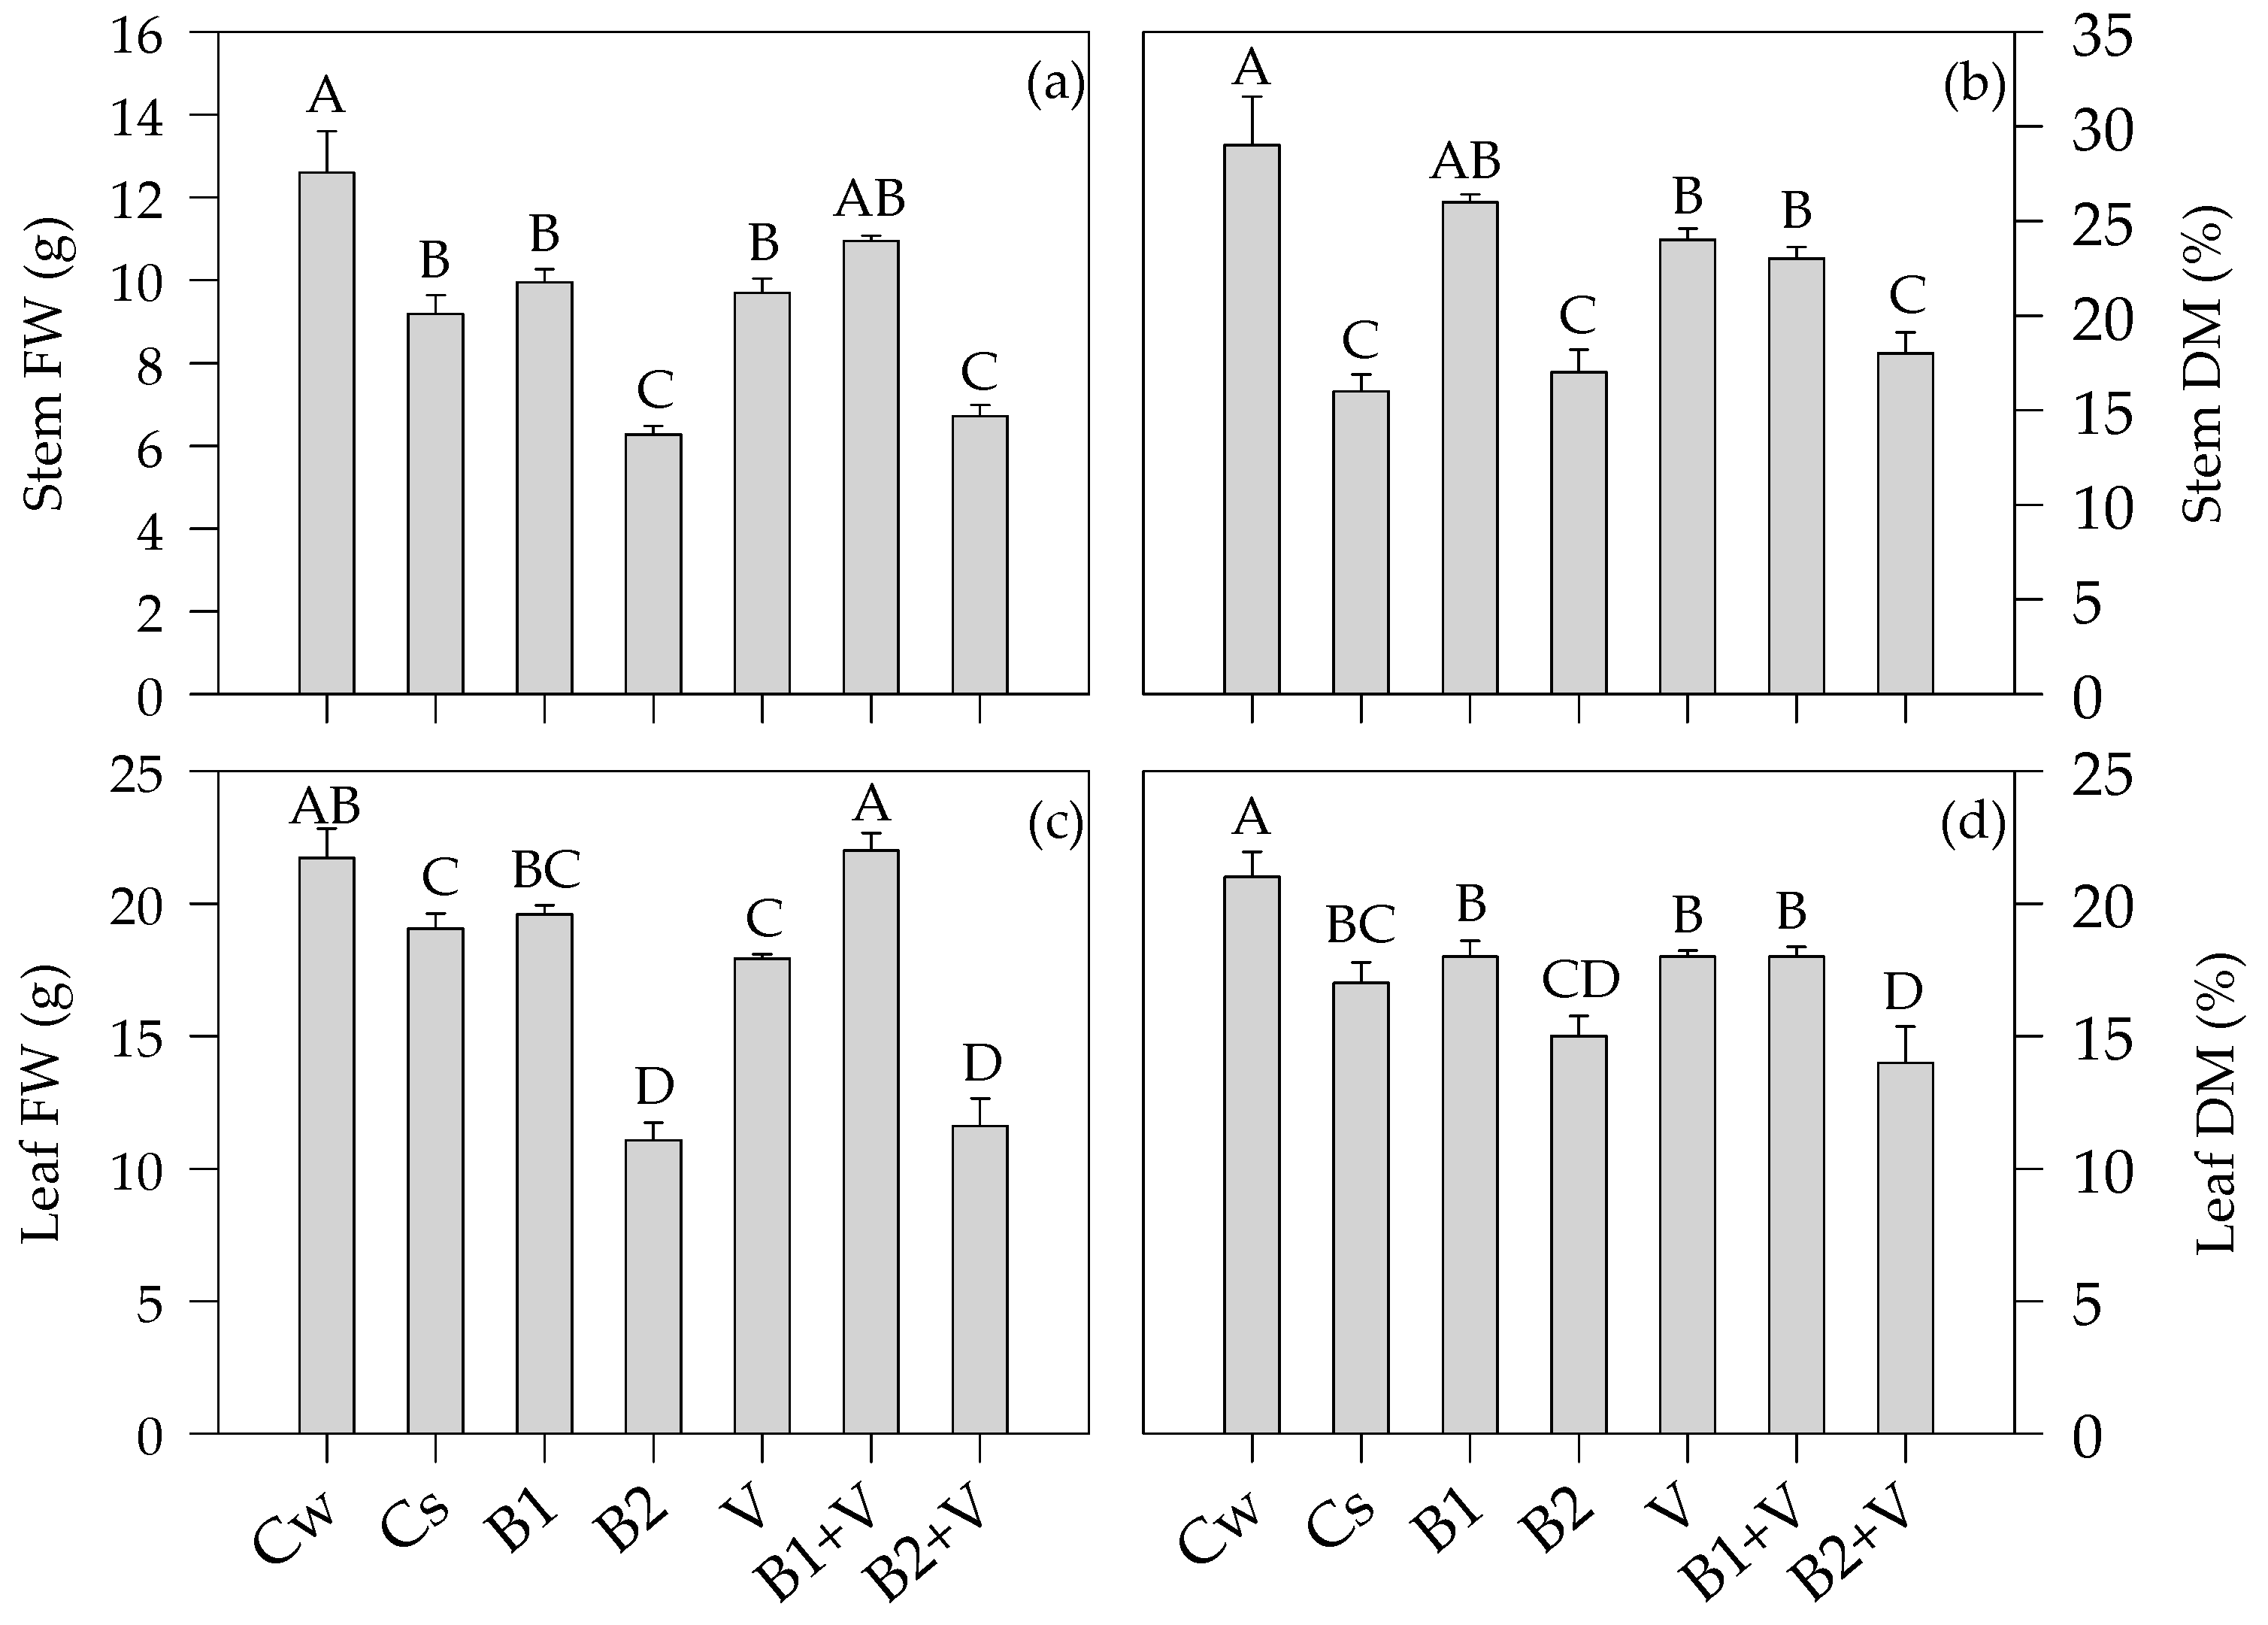
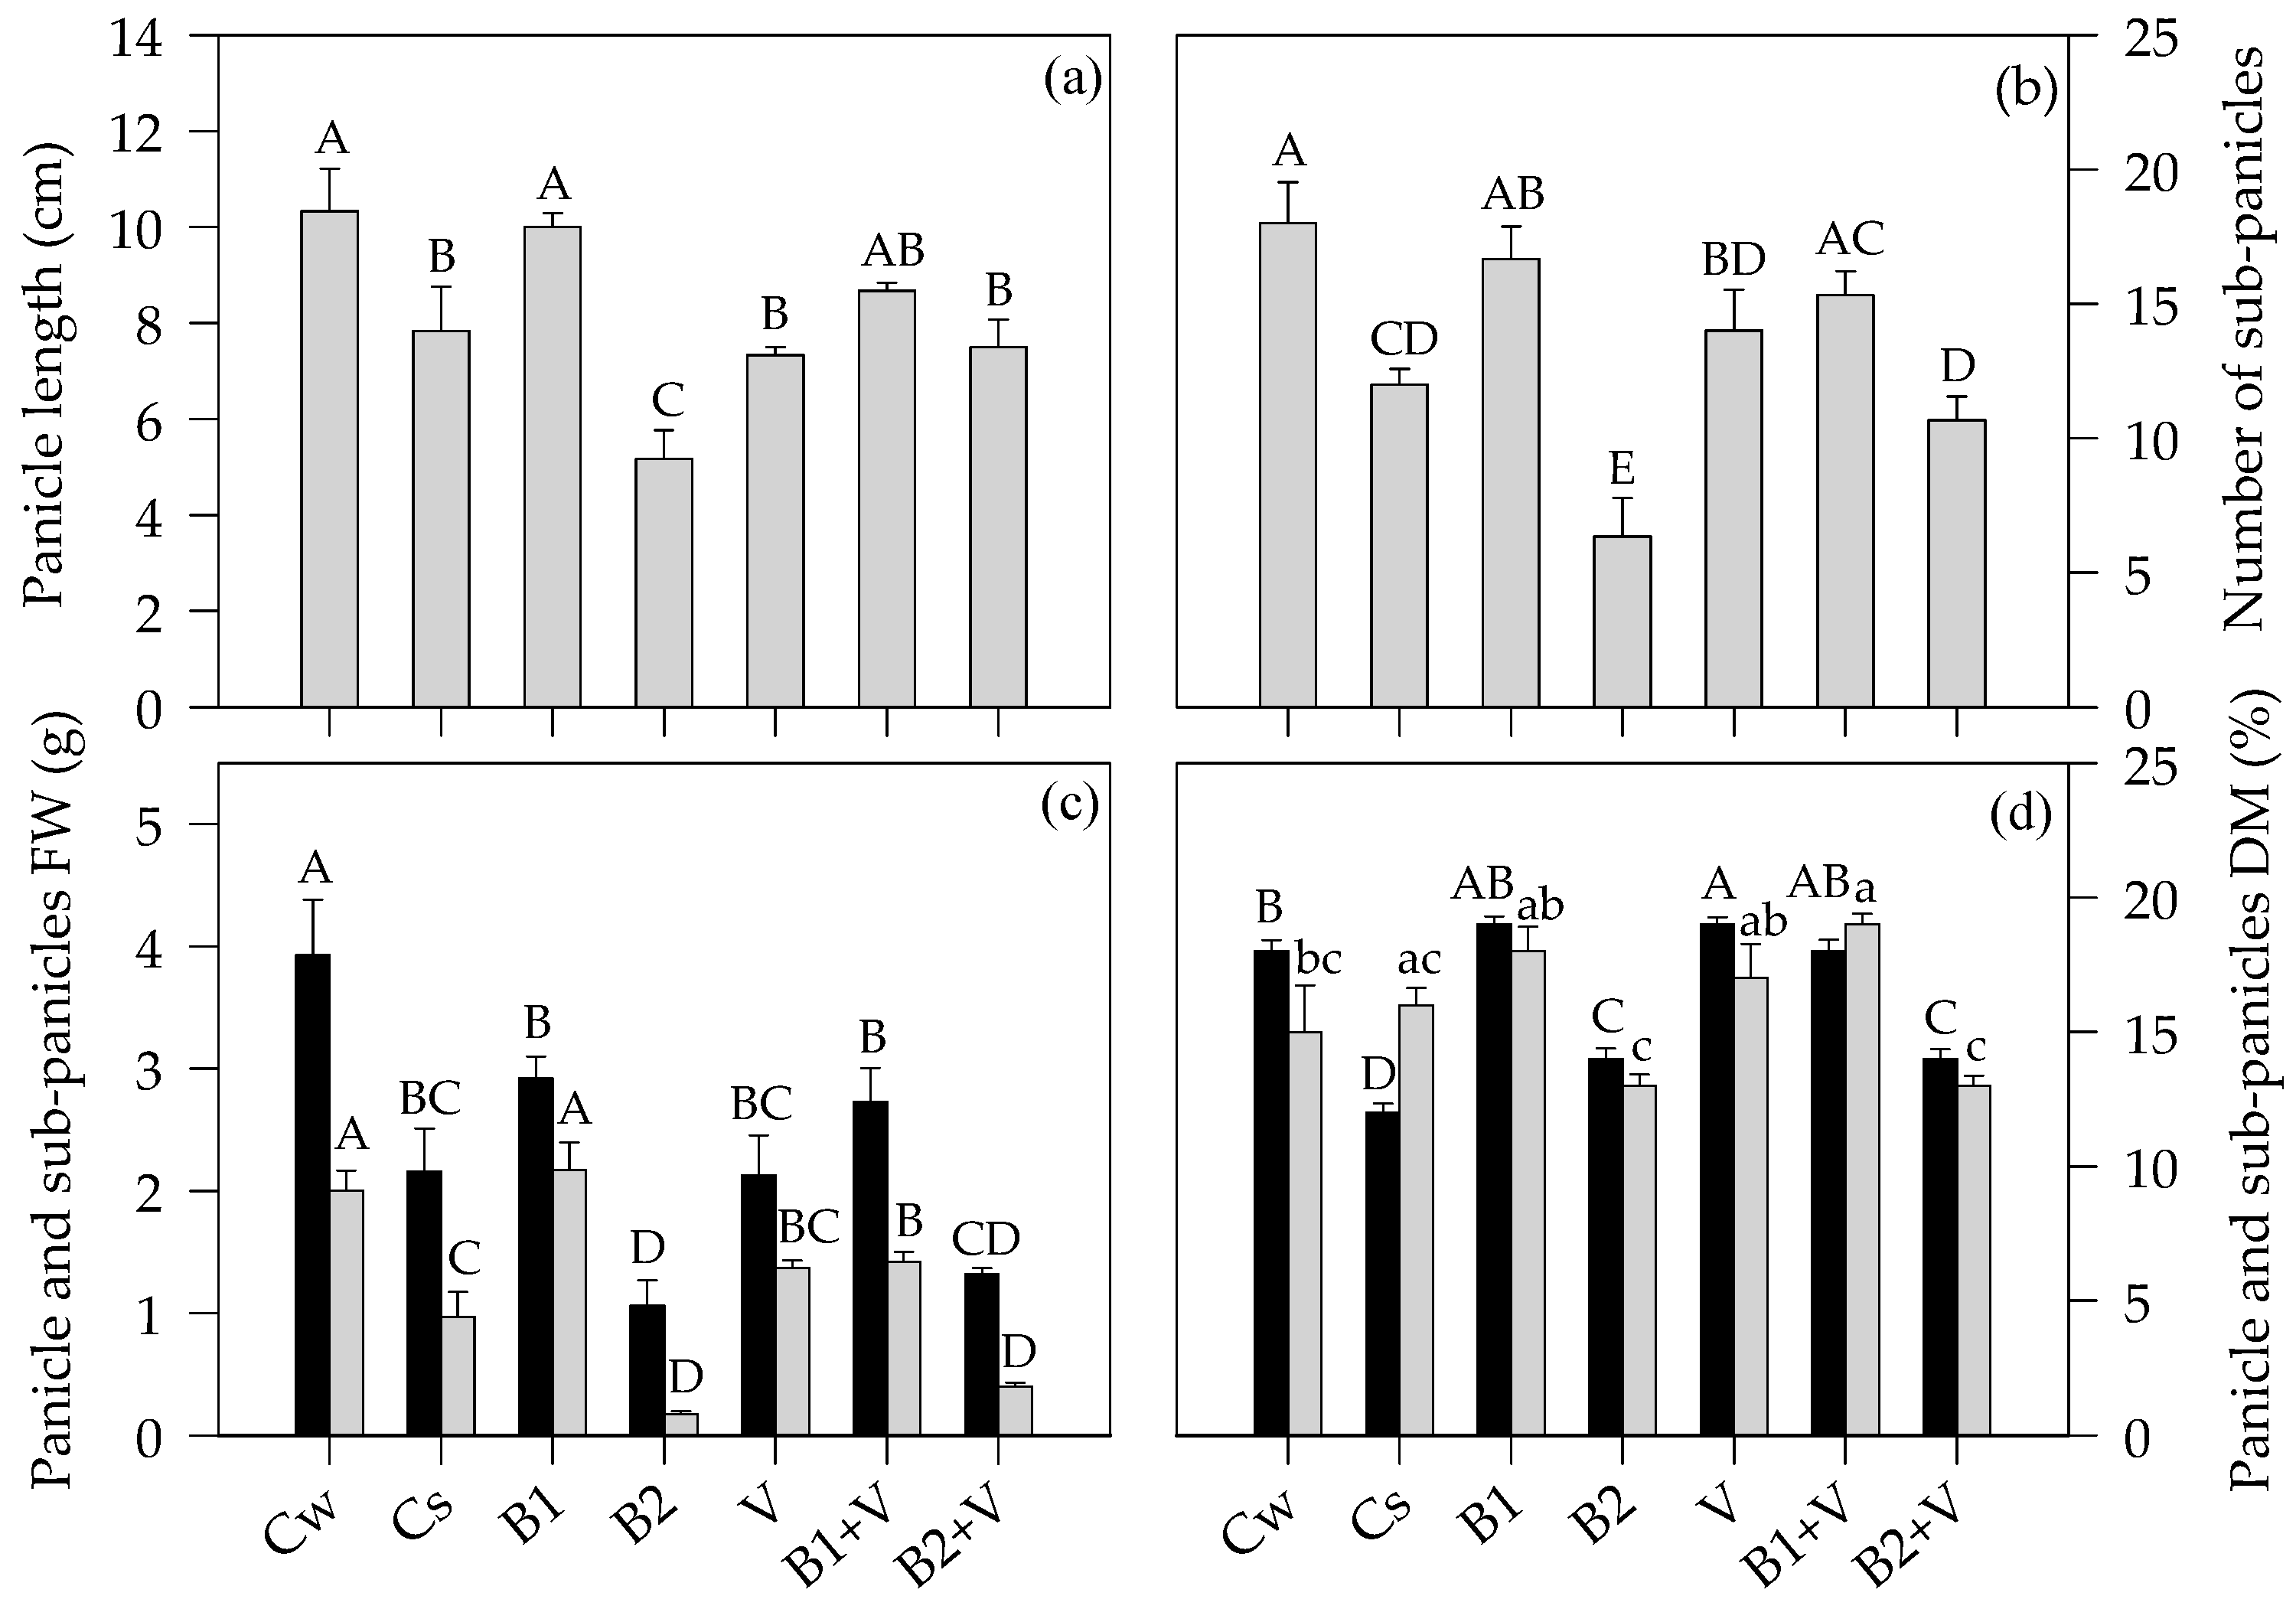
3.3. Growth-Related Parameters at the End of the Experiment

At the end of the experiment, the significant effect of biochars and vermicompost on plant growth was clearly highlighted by all the considered parameters (Figure 4).
More specifically, the plant height (Figure 4a), number of leaves (Figure 4b), leaf area (Figure 4c), and the SPAD index (Figure 4d) were always higher (p ≤ 0.001) in the well-irrigated control (Cw) than the water-stressed one (Cs) and in B1, V, and B1+V treatments than B2 and B2+V.
A significant effect of the experimental treatments was observed also considering the fresh weights (FW) and dry matter (DM) contents of stem and leaves, as measured at the end of the experiment (Figure 5).
More specifically, 37% higher (p ≤ 0.001) stem FW was observed in Cw than Cs (Figure 5a). The latter was not statistically different from the stem FW of B1, V, and B1+V (on average, 10 g). In addition, the stem FW of Cs, B1, V, and B1+V were, on average, 57% higher (p ≤ 0.001) than B2 and B2+V, which did not differ from each other (on average, 6 g).
The stem DM (Figure 5b) was not statistically different in Cw and B1, showing 83% and 63% higher (p ≤ 0.001) values than Cs, respectively. B1 did not differ from V and B1+V and were 39% higher, on average, than B2 and B2+V.
Regarding the leaf FW (Figure 5c), Cw was not statistically different from B1+V, which showed a 14% higher (p ≤ 0.001) value than Cs (22 vs. 19 g). B2 and B2+V showed the lowest (p ≤ 0.001) values (on average, 11 g).
The leaf DM (Figure 5d) reached the highest (p ≤ 0.001) value in Cw (22%), with no significant differences among Cs, B1, V, and B1+V (on average, 18%), which, in turn, showed 29% higher leaf dry matter content than B2 and B2+V (on average, 14%).
The panicle length and number, as well as the panicle and sub-panicles FW and DM contents, were also affected by the experimental treatments (Figure 6).
In particular, 32% higher (p ≤ 0.001) panicle length (Figure 6a) was detected in Cw compared to Cs. No statistical differences were found among Cw, B1, and B1+V (on average, 10 cm). The latter showed, in turn, a panicle length not statistically different from V and B2+V, while the lowest value of this parameter was observed in B2 (5 cm).
Additionally, the number of sub-panicles (Figure 6b) was higher (p ≤ 0.001) in Cw than in Cs (18 vs. 12), with about a 50% increase. Cw was not statistically different from B1 and B1+V (on average, 16), B2+V resulted in a similar number of sub-panicles compared to Cs (on average, 11), while B2 had the fewest (6).
Regarding the panicle FW (Figure 6c), Cw showed the highest (p ≤ 0.001) value (4 g). Cs was not statistically different from B1, V, and B1+V (on average, about 2 g), while B2 and B2+V showed the lowest value (on average, about 1 g). The sub-panicles FW (Figure 6c) did not differ between Cw and B1 (on average, 2 g), which showed values that were 115% higher (p ≤ 0.001) than Cs. The lowest (p ≤ 0.01) FW was shown in sub-panicles produced by B2 and B2+V (on average, 0.3 g).
Considering the panicle DM content (Figure 6d), V showed a value that was 33% higher (p ≤ 0.001) than Cw, with no statistical difference from B1 and B1+V (on average 19%). The lowest value was observed in Cs (12%). The sub-panicle DM content (Figure 6d) did not differ among B1, V, and B1+V (on average, 19%), with the lowest (p ≤ 0.01) values in both B2 and B2+V (on average, 13%).

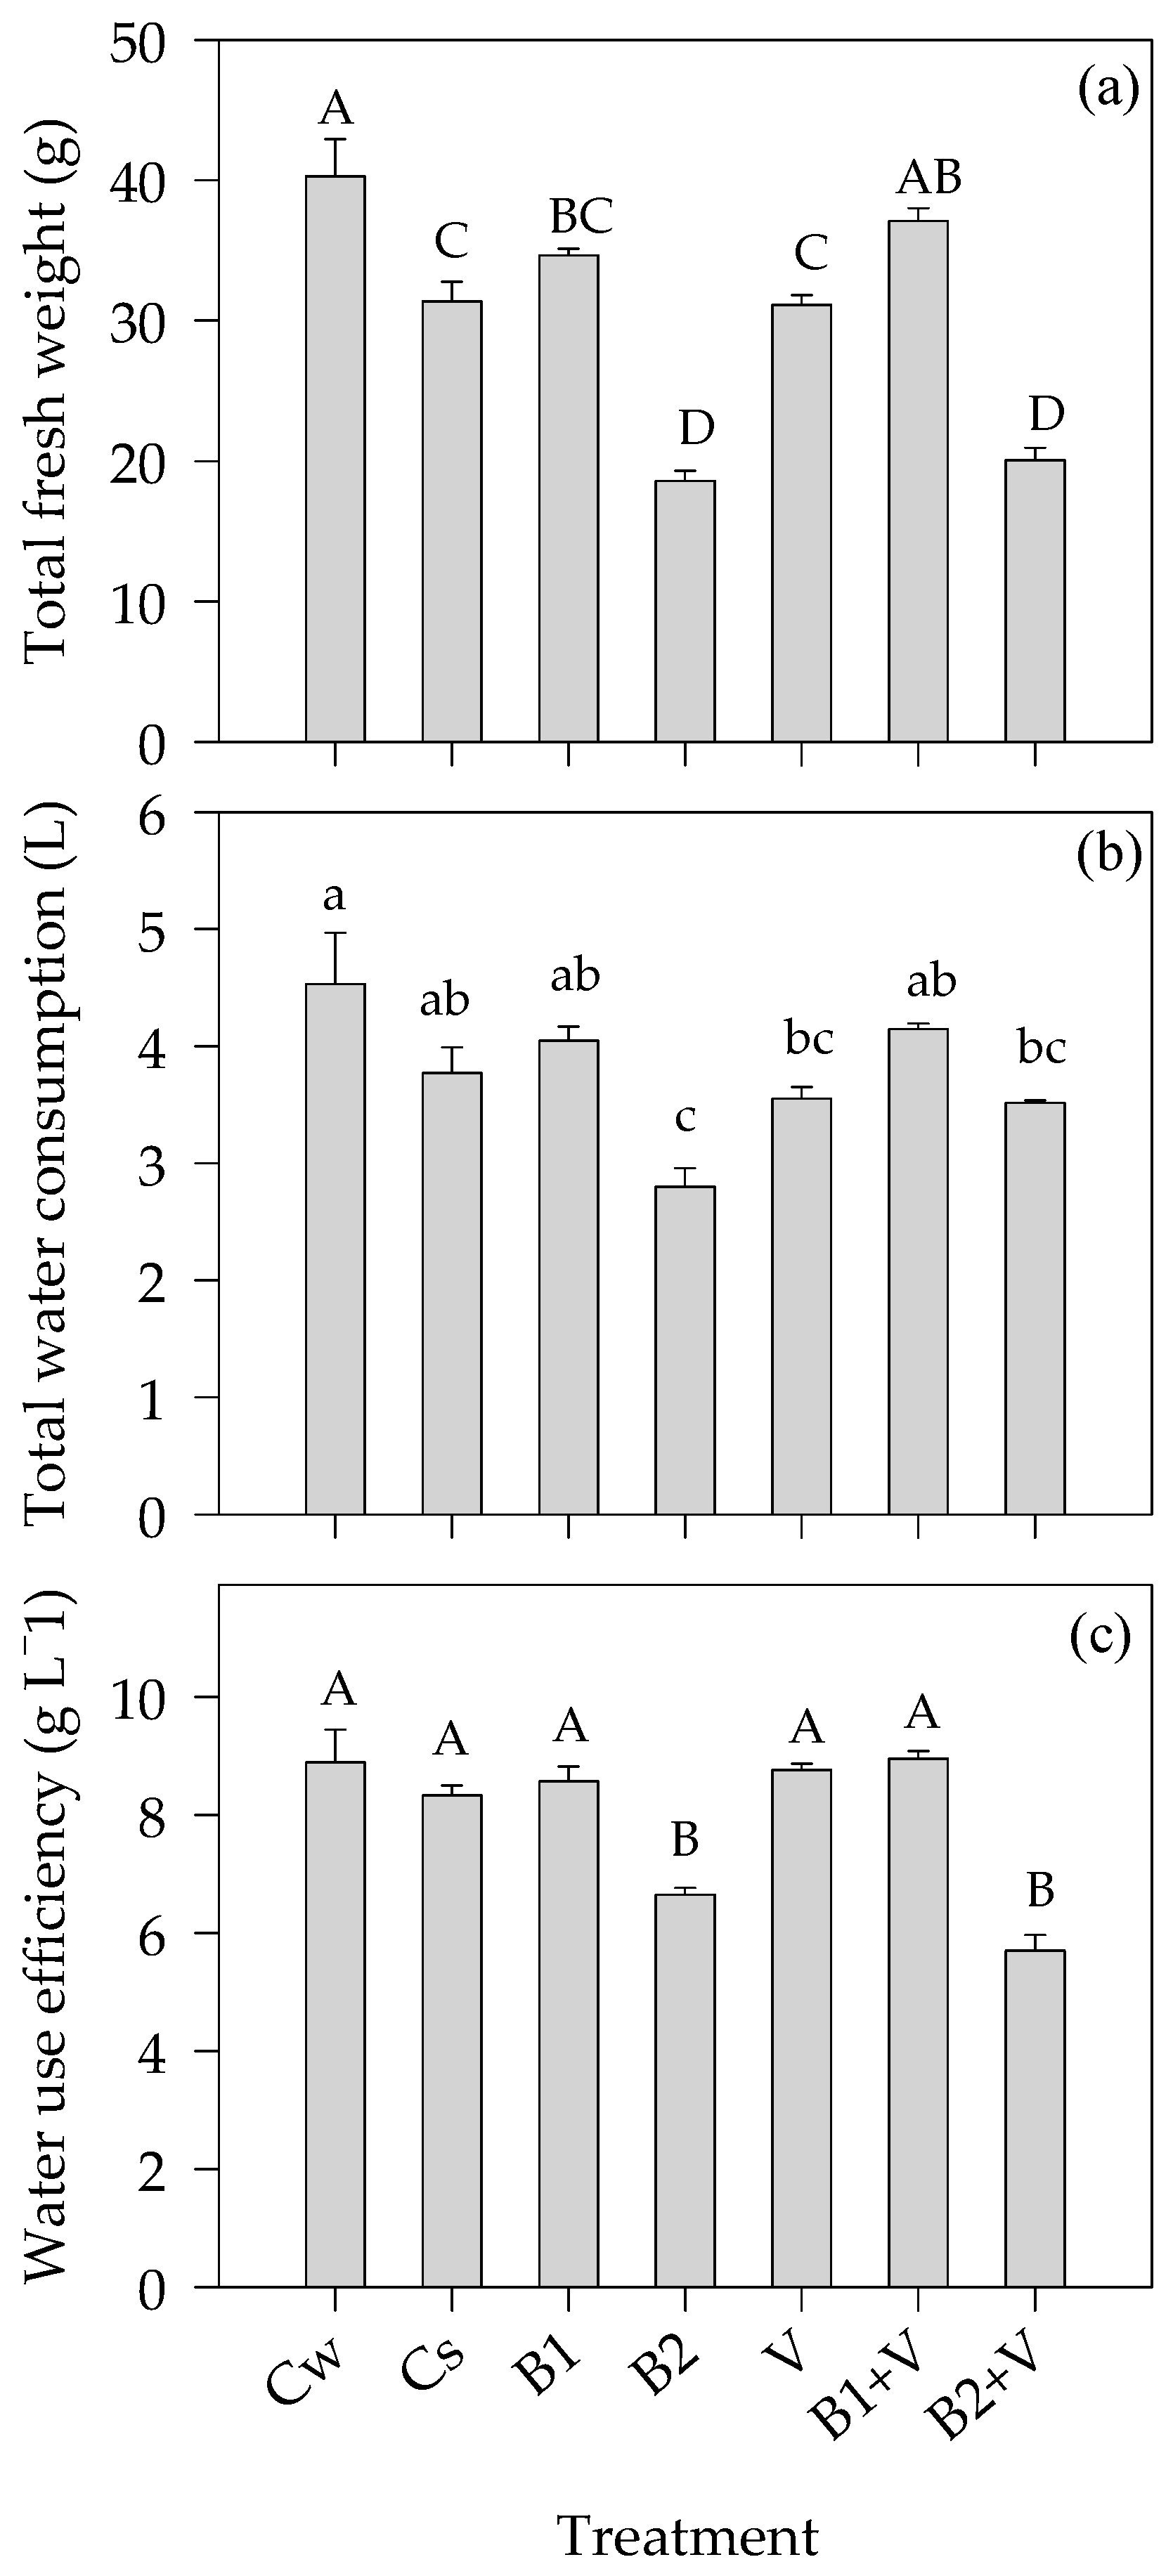
3.4. Water-Related Parameters

At the end of the water-stress period, except for the leaf turgid weight to dry weight ratio (TW/DW), the water-related parameters were significantly affected by the application of biochars and vermicompost to the soil, as shown in Table 5. In particular, a higher (p ≤ 0.01) value of leaf relative water content (RWC) was shown in Cw compared to Cs, which, in turn, did not differ from B1, V, and B1+V. B2, when combined with V, was not statistically different from Cw. Regarding the leaf water potential (Ψ), Cw and B2+V were not statistically different from each other and both significantly higher (p ≤ 0.01) than the other treatments. A similar trend was observed with regard to the leaf osmotic potential (Ψπ). Except for Cw, the turgor (Ψp) was close to zero in all treatments (data not shown).
Additionally, after soil re-watering, except for Ψp, the experimental factors significantly influenced RWC, Ψ, Ψπ, and TW/DW (Table 5). More specifically, a higher (p ≤ 0.01) RWC value was observed in Cw, followed by B2, B2+V, and B1; on the contrary, a lower RWC value was detected in Cs, which did not differ from V and B1+V. Regarding Ψ and Ψπ, the trends were very similar to those already observed at the end of water-stress period, with Cw, B2, and B2+V showing higher (p ≤ 0.05) values than Cs, B1, and B1+V. On the contrary, Ψp did not result in any statistical difference among the experimental treatments. Finally, the TW/DW ratio was 21% higher (p ≤ 0.05) in both B2 and B2+V than the other treatments.
The significant effect of soil treatment with biochars and vermicompost was also observed by considering the total fresh weight (TFW) and the total water consumption (TWC) per plant (Figure 7).
In particular, the TFW (Figure 7a) was significantly higher (p ≤ 0.001) in the well-watered control (Cw) compared to the stressed one (Cs), accounting for an increase of 28%. Moreover, Cs did not differ from both B1 and V (on average, 32 g plant−1). A drastic TFW reduction was observed in B2 and B2+V in comparison to both Cw (108%) and Cs (62%), while a TFW value that was not statistically different from Cw was observed in B1+V (on average, 39 g plant−1).
The TWC (Figure 7b) was 38% higher (p ≤ 0.05) in Cw than B2, V, and B2+V, with no statistically differences from Cs, B1, and B1+V (on average, 4 L plant−1). The TWC reflected in the water-use efficiency (WUE) (Figure 7c) was higher (p ≤ 0.001) in Cw than B2 and B2+V, with no statistical differences from Cs, B1, V, and B1+V.

4. Discussion

Due to increasing water scarcity and its negative impact on agricultural production, nowadays, there is an increasing interest in the use of organic amendments, especially compost and biochar, to improve soil-water relations, enhance plant-available water, and growth response [65]. Therefore, the current study was carried out to investigate the role of two different biochar types and a vermicompost, both alone and mixed, under water-stress conditions occurring during the vegetative growing cycle of quinoa when the species is more susceptible to drought [56].
Regarding the phenological growth stages of quinoa, the application of biochar from woodchips and vermicompost, alone and mixed, reduced the number of days between sowing and seedling emergence. This positive effect is also reflected in the successive two-leaf stage. On the contrary, biochar from vineyard prunings, particularly when combined with vermicompost, prolonged the two phenological stages. Therefore, the two biochars resulted in different phenological plant responses. According to Busch et al. [66], the high ash content in biochar, particularly when produced at higher temperatures, can negatively influence seed germination due to saline stress. Moreover, seed germination can be also affected by high soil pH [67]. This likely occurred in our experiment, considering both the higher ash content and electrical conductivity of vineyard pruning biochar, as well as the higher pH of the soil after its addition (data not shown) compared to woodchip biochar. In accordance with our results, the application of vineyard pruning biochar decreased the germination index in lettuce and watercress [68]; instead, woodchip biochar positively affected the seed germination rate of Robinia pseudoacacia L., which reached 100% 2 days before the control [69].
The application of biochar from woodchips and vermicompost, both alone and mixed, also positively affected plant growth performance during the water-stress period, as clearly shown by the higher values for plant height, stem diameter, number of branches, and number of leaves. Interestingly, this plant growth response was very similar to that observed in the well-watered control, showing that the two organic amendments, i.e., woodchip biochar and vermicompost, both when applied alone and in mixture, helped the plants to cope with the water-stress conditions they experienced from the twelve-leaf stage to the bud stage. Similar results were observed during the water-stress period if considering the leaf area, which showed a marked reduction in plants treated with vineyard pruning biochar, alone and in mixture with vermicompost, and a very similar value to the well-watered control in plants treated with woodchip biochar. Consistent with the enhancement of growth was also the SPAD index following soil treatment with biochar from woodchips, both alone and mixed with vermicompost. On the contrary, vineyard pruning biochar, both alone and mixed with vermicompost, led to a drastically reduced SPAD index value. This prompted us to hypothesize a lower nitrogen availability for plant uptake in the soil treated with biochar from vineyard prunings, likely due to a higher porosity of biochar [70,71] that bound nutrients, especially N [72,73]. Ventura et al. [74] applied different mixed fruit tree pruning biochars and highlighted that the changes in the SPAD index depend on the type and source of biochar. For instance, Wang et al. [75] revealed an increased SPAD index with biochar from wood residues, while Akhtar et al. [76] reported a decreased SPAD index after the application of biochar from mixed rice husk and shells of cotton seeds.
Except for the plants treated with vineyard pruning biochar, both alone and mixed with vermicompost, the limited plant-available water, progressively observed from 26 to 35 DAS, drastically reduced the water-related parameters in all the water-stressed plants, as shown by the lower RWC, Ψ, and Ψπ values they reached at the end of the water-stress period—when soil was at the permanent wilting point. Moreover, these plants did not show turgor, suggesting a closure of stomata, probably also because the high temperatures registered at mid-day in the experimental site were concurrent with the end of the water-stress period. The negative effect of the high temperatures was confirmed by the well-watered plants showing a positive Ψp, which although expected, was very low (0.11 MPa). The plants treated with biochar from vineyard prunings, alone and mixed with vermicompost, resulted in higher RWC, Ψ, and Ψπ values (similar to well-watered control). Increases in water relations were observed following the application of biochar in wheat by Haider et al. [77]. In our study, the different effects of the two biochar types on plant water relations could be explained by considering that the Titicaca cultivar, usually characterized by fast growth and high leaf expansion [78], when grown on woodchip biochar-treated soil, showed far greater development (higher height, leaf number, and area), when more exposed to water-stress in comparison to vineyard pruning biochar-treated plants, which showed limited growth. Additionally, Jenson et al. [53] found that quinoa maintained positive turgor down to zero turgor under severe water-stress imposition. Interestingly, only in plants treated with woodchip biochar, alone and mixed with vermicompost, the turgid weight to dry weight ratio showed a lower value. This result is in accordance with Andersen et al. [79] who reported that, on a physiological level, drought tolerance can be expressed as low osmotic potential, low ratio of turgid weight to dry weight, less elasticity, and capacity to maintain positive turgor even at low leaf water potentials. After soil re-watering, plants treated with both the two biochars and vermicompost similarly increased their Ψ, Ψπ, and Ψp values, also showing a positive Ψp. The turgid weight to dry weight ratio that was non-significant at the end of the water-stress cycle became significant, and still, the minimum value was observed in woodchip biochar alone and mixed with vermicompost, revealing more tolerance to drought than other treatments. Jensen et al. [53] examined the effects of drying soil and concluded that the high net photosynthesis and specific leaf area in the early vegetative stage of quinoa resulted in early plant vigor by maintaining a low turgid/dry weight ratio. In this study, Titicaca cultivar showed a higher absolute growing rate and larger leaf area, but during drought stress, a significant reduction in leaf area, which was not recovered even after 7 days of re-irrigation, was observed, making this cultivar sensitive to drought [78]; in our experiment, after 5 days of soil re-watering, Titicaca that suffered from drought had a sudden increase in leaf expansion rate—more pronounced in plants treated with woodchip biochar alone and in mixture with vermicompost.
At the end of the vegetative growing cycle, plant response in terms of biomass, both total and partitioned into stems and leaves (fresh weight and dry matter content), as well as of yield contributing traits (main panicle and sub-panicles length, number, fresh weight, and dry matter content), confirmed the positive effect of woodchip biochar, both alone and mixed with vermicompost, in helping plants recover from water-stress conditions. Particularly, the higher main panicle and sub-panicles production in plants treated with this biochar type leads us to hypothesize a probable enhanced response in terms of grain yield. In this regard, our findings are in agreement with Kammann et al. [80], who reported an increase in Chenopodium quinoa biomass of 305% following the application of different organic manures, along with 2% woodchip biochar (co-composted biochar) to a mixture of poor sandy soil. Using biochar boosted the nutritional availability and source–sink relationship, increasing panicle length and grain yield in rapeseed [81]. Biochar application boosted spike number and length and grain yield in water-stressed wheat plants compared to no biochar application in droughted plants. A similar positive response of biochar has been described by Zhang et al. [82] in rice, Foster et al. [83] in maize, Mannan et al. [84] in soybeans, and Agbna et al. [85] in tomato plants.
A very interesting result also concerns the WUE of plants treated with biochar from woodchips, alone and mixed with vermicompost, and subjected to water stress, which was similar to that observed on well-watered control plants. Although the woodchip biochar-treated plants received 10% less water than the well-irrigated control, the water-use efficiency was not different, showing that quinoa had the ability to produce more with less water consumption. Additionally, Telahigue et al. [86] and Aslam et al. [87] reported a similar result in quinoa under drought conditions. It should be noted that the increase in biomass and yield in the plants after biochar soil amendment is mainly due to the enhancement of the water content at the permanent wilting point [88], as well as an improvement in the uptake of essential mineral elements [89]. On the other hand, in our study, woodchip biochar addition at a rate of 2% reduced the bulk density more effectively than vineyard pruning biochar (data not shown), which might also be a reason for the improved plant growth because less bulk density helps in better root penetration [90]. Moreover, in our experiment, it can also be assumed that woodchip biochar has superior absorption and can better release water and nutrients compared to vineyard pruning biochar. However, further investigation is necessary to verify this hypothesis.

5. Conclusions

Due to current climate change conditions, regional droughts are occurring more intensively, threatening agricultural crop production. The keys to ensuring crop yield and food security are to identify the significant long-term impacts of climate change and the means for reducing its effect. In this context, increasing attention is now being paid to the use of organic amendments and the cultivation of climate-resilient crops.
The present study focused on quinoa, cv Titicaca, grown on soil treated with different organic amendments, such as two types of biochar from woodchips and vineyard prunings, respectively, along with a vermicompost derived from cattle manure, tested alone and in mixture, during the vegetative growing cycle under water-stress conditions. The results showed that, among the tested organic amendments, woodchip biochar, both alone and mixed with vermicompost, clearly improved plant vegetative development, also allowing a quickly recovery after the period of water stress, as well as an enhancement of WUE in comparison to vineyard pruning biochar. Furthermore, a similar positive effect was also observed on panicle and sub-panicle production, leading us to also hypothesize an enhancement of yield contributing traits.
In conclusion, the findings of the present study suggest that the use of soil treated with organic amendments, especially woodchip biochar and vermicompost, could be a useful approach to mitigate drought conditions during the vegetative growing cycle of quinoa, helping plants to develop. This could open new perspectives to boost the ability of quinoa to better cope with water stress and potentially broaden its spatial distribution across agricultural areas affected by drought and water scarcity.

Author Contributions

Conceptualization, M.Z.A., A.L. and A.R.R.; methodology, M.Z.A., A.L. and A.R.R.; software, M.Z.A. and A.L.; validation, A.L. and A.R.R.; formal analysis, M.Z.A. and A.L.; investigation, M.Z.A., A.L. and A.R.R.; resources, A.L. and A.R.R.; data curation, M.Z.A., A.L. and A.R.R.; writing—original draft preparation, M.Z.A. and A.L.; writing—review and editing, A.L.; visualization, A.L. and A.R.R.; supervision, A.L. and A.R.R.; project administration, A.L. and A.R.R.; funding acquisition, A.L. and A.R.R. All authors have read and agreed to the published version of the manuscript.

Funding

This research received no external funding.

Data Availability Statement

The data presented in this study are available upon request from the corresponding authors.

Acknowledgments

We would like to thank Simone Orlandini and Leonardo Verdi for providing seeds of quinoa for the current experiment. The authors are grateful to Giuseppe Mercurio for his technical assistance in the greenhouse experiment and the laboratory analyses.

Conflicts of Interest

The authors declare no conflict of interest.

References

  1. Ain, Q.T.; Siddique, K.; Bawazeer, S.; Ali, I.; Mazhar, M.; Rasool, R.; Mubeen, B.; Ullah, F.; Unar, A.; Jafar, T.H. Adaptive mechanisms in quinoa for coping in stressful environments: An update. PeerJ 2023, 11, e14832. [Google Scholar] [CrossRef] [PubMed]
  2. Akram, M.Z.; Basra, S.M.A.; Hafeez, M.B.; Khan, S.; Nazeer, S.; Iqbal, S.; Saddiq, M.S.; Zahra, N. Adaptability and yield potential of new quinoa lines under agro-ecological conditions of Faisalabad-Pakistan. Asian J. Agric. Biol. 2021, 2, 202005301. [Google Scholar] [CrossRef]
  3. Hafeez, M.B.; Iqbal, S.; Li, Y.; Saddiq, M.S.; Basra, S.M.; Zhang, H.; Zahra, N.; Akram, M.Z.; Bertero, D.; Curti, R.N. Assessment of phenotypic diversity in the USDA collection of quinoa links genotypic adaptation to germplasm origin. Plants 2022, 11, 738. [Google Scholar] [CrossRef] [PubMed]
  4. Bazile, D.; Bertero, H.D.; Nieto, C. State of the Art Report on Quinoa around the World in 2013; FAO Headquarter: Rome, Italy, 2015. [Google Scholar]
  5. FAO. Home-International Year of Quinoa 2013; FAO Headquarters: Rome, Italy, 2013; Available online: http://www.fao.org/quinoa-2013/en (accessed on 22 April 2023).
  6. Wu, Q.; Bai, X.; Zhao, W.; Shi, X.; Xiang, D.; Wan, Y.; Wu, X.; Sun, Y.; Zhao, J.; Peng, L. Investigation into the underlying regulatory mechanisms shaping inflorescence architecture in Chenopodium quinoa. BMC Genom. 2019, 20, 658. [Google Scholar] [CrossRef] [PubMed]
  7. Voronov, S.; Pleskachiov, Y.; Shitikova, A.; Zargar, M.; Abdelkader, M. Diversity of the Biological and Proteinogenic Characteristics of Quinoa Genotypes as a Multi-Purpose Crop. Agronomy 2023, 13, 279. [Google Scholar] [CrossRef]
  8. Coţovanu, I.; Mironeasa, C.; Mironeasa, S. Nutritionally Improved Wheat Bread Supplemented with Quinoa Flour of Large, Medium and Small Particle Sizes at Typical Doses. Plants 2023, 12, 698. [Google Scholar] [CrossRef]
  9. Bastidas, E.; Roura, R.; Rizzolo, D.; Massanés, T.; Gomis, R. Quinoa (Chenopodium quinoa Willd), from nutritional value to potential health benefits: An integrative review. J. Nutr. Food Sci. 2016, 6, 497. [Google Scholar]
  10. Zurita Silva, A.; Jacobsen, S.-E.; Razzaghi, F.; Álvarez Flores, R.; Ruiz, K.B.; Morales, A.; Silva Ascencio, H. Quinoa Drought Responses and Adaptation. In State of the Art Report of Quinoa in the World in 2013 by FAO and CIRAD; FAO Headquarter: Roma, Italy, 2015; pp. 157–171. Available online: https://repositorio.uchile.cl/handle/2250/130689 (accessed on 22 April 2023).
  11. McDowell, N.; Pockman, W.T.; Allen, C.D.; Breshears, D.D.; Cobb, N.; Kolb, T.; Plaut, J.; Sperry, J.; West, A.; Williams, D.G. Mechanisms of plant survival and mortality during drought: Why do some plants survive while others succumb to drought? New Phytol. 2008, 178, 719–739. [Google Scholar] [CrossRef]
  12. Skirycz, A.; Inzé, D. More from less: Plant growth under limited water. Curr. Opin. Biotechnol. 2010, 21, 197–203. [Google Scholar] [CrossRef]
  13. Jacobsen, S.-E.; Liu, F.; Jensen, C.R. Does root-sourced ABA play a role for regulation of stomata under drought in quinoa (Chenopodium quinoa Willd.). Sci. Hortic. 2009, 122, 281–287. [Google Scholar] [CrossRef]
  14. Nicotra, A.; Babicka, N.; Westoby, M. Seedling root anatomy and morphology: An examination of ecological differentiation with rainfall using phylogenetically independent contrasts. Oecologia 2002, 130, 136–145. [Google Scholar] [CrossRef] [PubMed]
  15. Al-Naggar, A.; Abd El-Salam, R.; Badran, A.; El-Moghazi, M. Genotype and drought effects on morphological, physiological and yield traits of quinoa (Chenopodium quinoa Willd.). Asian J. Adv. Agric. Res. 2017, 3, 1–15. [Google Scholar] [CrossRef]
  16. Otterbach, S.L.; Khoury, H.; Rupasinghe, T.; Mendis, H.; Kwan, K.H.; Lui, V.; Natera, S.H.; Klaiber, I.; Allen, N.M.; Jarvis, D.E. Characterization of epidermal bladder cells in Chenopodium quinoa. Plant Cell Environ. 2021, 44, 3836–3852. [Google Scholar] [CrossRef] [PubMed]
  17. Shabala, L.; Mackay, A.; Tian, Y.; Jacobsen, S.E.; Zhou, D.; Shabala, S. Oxidative stress protection and stomatal patterning as components of salinity tolerance mechanism in quinoa (Chenopodium quinoa). Physiol. Plant. 2012, 146, 26–38. [Google Scholar] [CrossRef] [PubMed]
  18. Garrido, M.; Silva, P.; Silva, H.; Muñoz, R.; Baginsky, C.; Acevedo, E. Evaluación del rendimiento de nueve genotipos de quinua (Chenopodium quinoa Willd. j bajo diferentes disponibilidades hídricas en ambiente mediterráneo. Idesia 2013, 31, 69–76. [Google Scholar] [CrossRef]
  19. Geerts, S.; Raes, D.; Garcia, M.; Mendoza, J.; Huanca, R. Crop water use indicators to quantify the flexible phenology of quinoa (Chenopodium quinoa Willd.) in response to drought stress. Field Crops Res. 2008, 108, 150–156. [Google Scholar] [CrossRef]
  20. Stikić, R.; Jovanović, Z.; Marjanović, M.; Djordjević, S. The effect of drought on water regime and growth of quinoa (Chenopodium quinoa Willd.). Ratar. I Povrt. 2015, 52, 80–84. [Google Scholar] [CrossRef]
  21. Beccari, G.; Quaglia, M.; Tini, F.; Pannacci, E.; Covarelli, L. Phytopathological threats associated with quinoa (Chenopodium quinoa Willd.) cultivation and seed production in an area of Central Italy. Plants 2021, 10, 1933. [Google Scholar] [CrossRef]
  22. Bilalis, D.; Roussis, I.; Kakabouki, I.; Folina, A. Quinoa (Chenopodium quinoa Willd.) crop under Mediterranean conditions: A review. Cienc. E Investig. Agrar. Rev. Latinoam. Cienc. Agric. 2019, 46, 51–68. [Google Scholar] [CrossRef]
  23. Das, S.K.; Ghosh, G.K.; Avasthe, R. Application of biochar in agriculture and environment, and its safety issues. Biomass Convers. Biorefin. 2020, 13, 1359–1369. [Google Scholar] [CrossRef]
  24. Sayara, T.; Basheer-Salimia, R.; Hawamde, F.; Sánchez, A. Recycling of organic wastes through composting: Process performance and compost application in agriculture. Agronomy 2020, 10, 1838. [Google Scholar] [CrossRef]
  25. Lee, J.; Sarmah, A.K.; Kwon, E.E. Production and formation of biochar. In Biochar from Biomass and Waste; Elsevier: Amsterdam, The Netherlands, 2019; pp. 3–18. [Google Scholar]
  26. Laird, D.A. The charcoal vision: A win–win–win scenario for simultaneously producing bioenergy, permanently sequestering carbon, while improving soil and water quality. Agron. J. 2008, 100, 178–181. [Google Scholar] [CrossRef]
  27. Lei, O.; Zhang, R. Effects of biochars derived from different feedstocks and pyrolysis temperatures on soil physical and hydraulic properties. J. Soils Sediments 2013, 13, 1561–1572. [Google Scholar] [CrossRef]
  28. Manolikaki, I.; Diamadopoulos, E. Agronomic potential of biochar prepared from brewery byproducts. J. Environ. Manag. 2020, 255, 109856. [Google Scholar] [CrossRef] [PubMed]
  29. Murtaza, G.; Ahmed, Z.; Usman, M.; Tariq, W.; Ullah, Z.; Shareef, M.; Iqbal, H.; Waqas, M.; Tariq, A.; Wu, Y. Biochar induced modifications in soil properties and its impacts on crop growth and production. J. Plant Nutr. 2021, 44, 1677–1691. [Google Scholar] [CrossRef]
  30. Subedi, R.; Bertora, C.; Zavattaro, L.; Grignani, C. Crop response to soils amended with biochar: Expected benefits and unintended risks. Ital. J. Agron. 2017, 12, 161–173. [Google Scholar] [CrossRef]
  31. Libutti, A.; Francavilla, M.; Monteleone, M. Hydrological properties of a clay loam soil as affected by biochar application in a pot experiment. Agronomy 2021, 11, 489. [Google Scholar] [CrossRef]
  32. Libutti, A.; Cammerino, A.R.B.; Francavilla, M.; Monteleone, M. Soil amendment with biochar affects water drainage and nutrient losses by leaching: Experimental evidence under field-grown conditions. Agronomy 2019, 9, 758. [Google Scholar] [CrossRef]
  33. Wang, D.; Li, C.; Parikh, S.J.; Scow, K.M. Impact of biochar on water retention of two agricultural soils—A multi-scale analysis. Geoderma 2019, 340, 185–191. [Google Scholar] [CrossRef]
  34. Abd El-Mageed, T.A.; Rady, M.M.; Taha, R.S.; Abd El Azeam, S.; Simpson, C.R.; Semida, W.M. Effects of integrated use of residual sulfur-enhanced biochar with effective microorganisms on soil properties, plant growth and short-term productivity of Capsicum annuum under salt stress. Sci. Hortic. 2020, 261, 108930. [Google Scholar] [CrossRef]
  35. Zhao, S.; Schmidt, S.; Gao, H.; Li, T.; Chen, X.; Hou, Y.; Chadwick, D.; Tian, J.; Dou, Z.; Zhang, W. A precision compost strategy aligning composts and application methods with target crops and growth environments can increase global food production. Nat. Food 2022, 3, 741–752. [Google Scholar] [CrossRef] [PubMed]
  36. Adugna, G. A review on impact of compost on soil properties, water use and crop productivity. Acad. Res. J. Agric. Sci. Res. 2016, 4, 93–104. [Google Scholar]
  37. Azim, K.; Soudi, B.; Boukhari, S.; Perissol, C.; Roussos, S.; Thami Alami, I. Composting parameters and compost quality: A literature review. Org. Agric. 2018, 8, 141–158. [Google Scholar] [CrossRef]
  38. Rivier, P.-A.; Jamniczky, D.; Nemes, A.; Makó, A.; Barna, G.; Uzinger, N.; Rékási, M.; Farkas, C. Short-term effects of compost amendments to soil on soil structure, hydraulic properties, and water regime. J. Hydrol. Hydromech. 2022, 70, 74–88. [Google Scholar] [CrossRef]
  39. Abdelfattah, M.A.; Rady, M.M.; Belal, H.E.; Belal, E.E.; Al-Qthanin, R.; Al-Yasi, H.M.; Ali, E.F. Revitalizing fertility of nutrient-deficient virgin sandy soil using leguminous biocompost boosts Phaseolus vulgaris performance. Plants 2021, 10, 1637. [Google Scholar] [CrossRef]
  40. Libutti, A.; Rivelli, A.R. Quanti-qualitative response of Swiss chard (Beta vulgaris L. var. cycla) to soil amendment with biochar-compost mixtures. Agronomy 2021, 11, 307. [Google Scholar] [CrossRef]
  41. Libutti, A.; Trotta, V.; Rivelli, A.R. Biochar, vermicompost, and compost as soil organic amendments: Influence on Growth Parameters, Nitrate and Chlorophyll Content of Swiss Chard (Beta vulgaris L. var. cycla). Agronomy 2020, 10, 346. [Google Scholar] [CrossRef]
  42. Libutti, A.; Russo, D.; Lela, L.; Ponticelli, M.; Milella, L.; Rivelli, A.R. Enhancement of Yield, Phytochemical Content and Biological Activity of a Leafy Vegetable (Beta vulgaris L. var. cycla) by Using Organic Amendments as an Alternative to Chemical Fertilizer. Plants 2023, 12, 569. [Google Scholar] [CrossRef]
  43. Rivelli, A.R.; Libutti, A. Effect of biochar and inorganic or organic fertilizer co-application on soil properties, plant growth and nutrient content in Swiss chard. Agronomy 2022, 12, 2089. [Google Scholar] [CrossRef]
  44. Cheng, Y.; Bu, X.; Li, J.; Ji, Z.; Wang, C.; Xiao, X.; Li, F.; Wu, Z.-h.; Wu, G.; Jia, P. Application of biochar and compost improved soil properties and enhanced plant growth in a pb–zn mine tailings soil. Environ. Sci. Pollut. Res. 2023, 30, 32337–32347. [Google Scholar] [CrossRef]
  45. Huang, X.; Wang, H.; Zou, Y.; Qiao, C.; Hao, B.; Shao, Q.; Wu, W.; Wu, H.; Zhao, J.; Ren, L. Rice Straw Composting Improves the Microbial Diversity of Paddy Soils to Stimulate the Growth, Yield, and Grain Quality of Rice. Sustainability 2023, 15, 932. [Google Scholar] [CrossRef]
  46. Lim, S.L.; Lee, L.H.; Wu, T.Y. Sustainability of using composting and vermicomposting technologies for organic solid waste biotransformation: Recent overview, greenhouse gases emissions and economic analysis. J. Clean. Prod. 2016, 111, 262–278. [Google Scholar] [CrossRef]
  47. Ullah, N.; Ditta, A.; Imtiaz, M.; Li, X.; Jan, A.U.; Mehmood, S.; Rizwan, M.S.; Rizwan, M. Appraisal for organic amendments and plant growth-promoting rhizobacteria to enhance crop productivity under drought stress: A review. J. Agron. Crop Sci. 2021, 207, 783–802. [Google Scholar] [CrossRef]
  48. Monlau, F.; Francavilla, M.; Sambusiti, C.; Antoniou, N.; Solhy, A.; Libutti, A.; Zabaniotou, A.; Barakat, A.; Monteleone, M. Toward a functional integration of anaerobic digestion and pyrolysis for a sustainable resource management. Comparison between solid-digestate and its derived pyrochar as soil amendment. Appl. Energy 2016, 169, 652–662. [Google Scholar] [CrossRef]
  49. Zabaniotou, A.; Rovas, D.; Delivand, M.; Francavilla, M.; Libutti, A.; Cammerino, A.; Monteleone, M. Conceptual vision of bioenergy sector development in Mediterranean regions based on decentralized thermochemical systems. Sustain. Energy Technol. Assess. 2017, 23, 33–47. [Google Scholar] [CrossRef]
  50. Zabaniotou, A.; Rovas, D.; Libutti, A.; Monteleone, M. Boosting circular economy and closing the loop in agriculture: Case study of a small-scale pyrolysis–biochar based system integrated in an olive farm in symbiosis with an olive mill. Environ. Dev. 2015, 14, 22–36. [Google Scholar] [CrossRef]
  51. Kammann, C.I.; Linsel, S.; Gößling, J.W.; Koyro, H.-W. Influence of biochar on drought tolerance of Chenopodium quinoa Willd and on soil–plant relations. Plant Soil 2011, 345, 195–210. [Google Scholar] [CrossRef]
  52. Ramzani, P.M.A.; Shan, L.; Anjum, S.; Ronggui, H.; Iqbal, M.; Virk, Z.A.; Kausar, S. Improved quinoa growth, physiological response, and seed nutritional quality in three soils having different stresses by the application of acidified biochar and compost. Plant Physiol. Biochem. 2017, 116, 127–138. [Google Scholar] [CrossRef]
  53. Jensen, C.; Jacobsen, S.-E.; Andersen, M.; Nunez, N.; Andersen, S.; Rasmussen, L.; Mogensen, V. Leaf gas exchange and water relation characteristics of field quinoa (Chenopodium quinoa Willd.) during soil drying. Eur. J. Agron. 2000, 13, 11–25. [Google Scholar] [CrossRef]
  54. Razzaghi, F.; Jacobsen, S.-E.; Jensen, C.R.; Andersen, M.N. Ionic and photosynthetic homeostasis in quinoa challenged by salinity and drought–mechanisms of tolerance. Funct. Plant Biol. 2014, 42, 136–148. [Google Scholar] [CrossRef]
  55. Riccardi, M.; Pulvento, C.; Lavini, A.; d’Andria, R.; Jacobsen, S.E. Growth and ionic content of quinoa under saline irrigation. J. Agron. Crop Sci. 2014, 200, 246–260. [Google Scholar] [CrossRef]
  56. Geerts, S.; Mamani, R.S.; Garcia, M.; Raes, D. Response of quinoa (Chenopodium quinoa Willd.) to differential drought stress in the Bolivian Altiplano: Towards a deficit irrigation strategy within a water scarce region. In Proceedings of the 1st International Symposium on Land and Water Management for Sustainable Irrigated Agriculture, Adana, Turkey, 4–8 April 2006; pp. 4–8. [Google Scholar]
  57. Roy, R.; Núñez-Delgado, A.; Wang, J.; Kader, M.A.; Sarker, T.; Hasan, A.K.; Dindaroglu, T. Cattle manure compost and biochar supplementation improve growth of Onobrychis viciifolia in coal-mined spoils under water stress conditions. Environ. Res. 2022, 205, 112440. [Google Scholar] [CrossRef] [PubMed]
  58. Zhang, J.; Amonette, J.E.; Flury, M. Effect of biochar and biochar particle size on plant-available water of sand, silt loam, and clay soil. Soil Tillage Res. 2021, 212, 104992. [Google Scholar] [CrossRef]
  59. Italian Official Gazette Ministerial Decree. Approval of “Official Methods of Chemical Soil Analysis”. Ordinary Supplement 185 to the Official Journal of the Italian Republic 248, 21 October 1999, Roma, Italy. 1999. Available online: https://www.gazzettaufficiale.it/atto/serie_generale/caricaDettaglioAtto/originario?atto.dataPubblicazioneGazzetta=1992-05-25&atto.codiceRedazionale=092A2322&elenco30giorni=false (accessed on 22 April 2023).
  60. European Biochar Certificate (EBC). Comparison of European Biochar Certificate Version 4. 8 and IBI Biochar Standards Version 2.0 European Biochar Certificate First Publication March 2012b. Available online: https://www.european-biochar.org/en/home (accessed on 22 April 2023).
  61. The International Biochar Initiative. Standardized Product Definition and Product Testing Guidelines for Biochar That Is Used in Soil. Int. Biochar Initiat. 2015. Available online: https://biochar-international.org/standard-certification-training/biochar-standards/ (accessed on 22 April 2023).
  62. Jacobsen, S.-E.; Stølen, O. Quinoa-morphology, phenology and prospects for its production as a new crop in Europe. Eur. J. Agron. 1993, 2, 19–29. [Google Scholar] [CrossRef]
  63. Talebnejad, R.; Sepaskhah, A. Effect of different saline groundwater depths and irrigation water salinities on yield and water use of quinoa in lysimeter. Agric. Water Manag. 2015, 148, 177–188. [Google Scholar] [CrossRef]
  64. Smith, J.; Lüttge, U. Day-night changes in leaf water relations associated with the rhythm of crassulacean acid metabolism in Kalanchoë daigremontiana. Planta 1985, 163, 272–282. [Google Scholar] [CrossRef]
  65. Ghorbani, M.; Neugschwandtner, R.W.; Konvalina, P.; Asadi, H.; Kopecký, M.; Amirahmadi, E. Comparative effects of biochar and compost applications on water holding capacity and crop yield of rice under evaporation stress: A two-years field study. Paddy Water Environ. 2023, 21, 47–58. [Google Scholar] [CrossRef]
  66. Busch, D.; Kammann, C.; Grünhage, L.; Müller, C. Simple biotoxicity tests for evaluation of carbonaceous soil additives: Establishment and reproducibility of four test procedures. J. Environ. Qual. 2012, 41, 1023–1032. [Google Scholar] [CrossRef]
  67. Koger, C.H.; Reddy, K.N.; Poston, D.H. Factors affecting seed germination, seedling emergence, and survival of texasweed (Caperonia palustris). Weed Sci. 2004, 52, 989–995. [Google Scholar] [CrossRef]
  68. Videgain-Marco, M.; Marco-Montori, P.; Martí-Dalmau, C.; Jaizme-Vega, M.d.C.; Manyà-Cervelló, J.J.; García-Ramos, F.J. Effects of biochar application in a sorghum crop under greenhouse conditions: Growth parameters and physicochemical fertility. Agronomy 2020, 10, 104. [Google Scholar] [CrossRef]
  69. Bu, X.; Xue, J.; Wu, Y.; Ma, W. Effect of biochar on seed germination and seedling growth of Robinia pseudoacacia L. in karst calcareous soils. Commun. Soil Sci. Plant Anal. 2020, 51, 352–363. [Google Scholar] [CrossRef]
  70. Azuara, M.; Sáiz, E.; Manso, J.A.; García-Ramos, F.J.; Manyà, J.J. Study on the effects of using a carbon dioxide atmosphere on the properties of vine shoots-derived biochar. J. Anal. Appl. Pyrolysis 2017, 124, 719–725. [Google Scholar] [CrossRef]
  71. Pituello, C.; Francioso, O.; Simonetti, G.; Pisi, A.; Torreggiani, A.; Berti, A.; Morari, F. Characterization of chemical–physical, structural and morphological properties of biochars from biowastes produced at different temperatures. J. Soils Sediments 2015, 15, 792–804. [Google Scholar] [CrossRef]
  72. Demiraj, E.; Libutti, A.; Malltezi, J.; Rroço, E.; Brahushi, F.; Monteleone, M.; Sulçe, S. Effect of organic amendments on nitrate leaching mitigation in a sandy loam soil of Shkodra district, Albania. Ital. J. Agron. 2018, 13, 93–102. [Google Scholar] [CrossRef]
  73. Libutti, A.; Mucci, M.; Francavilla, M.; Monteleone, M. Effect of biochar amendment on nitrate retention in a silty clay loam soil. Ital. J. Agron. 2016, 11, 273–276. [Google Scholar] [CrossRef]
  74. Ventura, M.; Sorrenti, G.; Panzacchi, P.; George, E.; Tonon, G. Biochar reduces short-term nitrate leaching from a horizon in an apple orchard. J. Environ. Qual. 2013, 42, 76–82. [Google Scholar] [CrossRef]
  75. Wang, Y.; Pan, F.; Wang, G.; Zhang, G.; Wang, Y.; Chen, X.; Mao, Z. Effects of biochar on photosynthesis and antioxidative system of Malus hupehensis Rehd. seedlings under replant conditions. Sci. Hortic. 2014, 175, 9–15. [Google Scholar] [CrossRef]
  76. Akhtar, S.S.; Li, G.; Andersen, M.N.; Liu, F. Biochar enhances yield and quality of tomato under reduced irrigation. Agric. Water Manag. 2014, 138, 37–44. [Google Scholar] [CrossRef]
  77. Haider, I.; Raza, M.A.S.; Iqbal, R.; Aslam, M.U.; Habib-ur-Rahman, M.; Raja, S.; Khan, M.T.; Aslam, M.M.; Waqas, M.; Ahmad, S. Potential effects of biochar application on mitigating the drought stress implications on wheat (Triticum aestivum L.) under various growth stages. J. Saudi Chem. Soc. 2020, 24, 974–981. [Google Scholar] [CrossRef]
  78. Sun, Y.; Liu, F.; Bendevis, M.; Shabala, S.; Jacobsen, S.E. Sensitivity of two quinoa (Chenopodium quinoa Willd.) varieties to progressive drought stress. J. Agron. Crop Sci. 2014, 200, 12–23. [Google Scholar] [CrossRef]
  79. Andersen, S.; Rasmussen, L.; Jensen, C.; Mogensen, V.; Andersen, M.; Jacobsen, S. Leaf water relations and gas exchange of field grown Chenopodium quinoa Willd. during drought. In Proceedings of the Small Grain Cereals and Pseudocereals; Workshop at KVL: Copenhagen, Denmark, 1996. [Google Scholar]
  80. Kammann, C.I.; Schmidt, H.-P.; Messerschmidt, N.; Linsel, S.; Steffens, D.; Müller, C.; Koyro, H.-W.; Conte, P.; Joseph, S. Plant growth improvement mediated by nitrate capture in co-composted biochar. Sci. Rep. 2015, 5, 11080. [Google Scholar]
  81. Khan, Z.; Khan, M.N.; Zhang, K.; Luo, T.; Zhu, K.; Hu, L. The application of biochar alleviated the adverse effects of drought on the growth, physiology, yield and quality of rapeseed through regulation of soil status and nutrients availability. Ind. Crops Prod. 2021, 171, 113878. [Google Scholar] [CrossRef]
  82. Zhang, A.; Bian, R.; Pan, G.; Cui, L.; Hussain, Q.; Li, L.; Zheng, J.; Zheng, J.; Zhang, X.; Han, X. Effects of biochar amendment on soil quality, crop yield and greenhouse gas emission in a Chinese rice paddy: A field study of 2 consecutive rice growing cycles. Field Crops Res. 2012, 127, 153–160. [Google Scholar] [CrossRef]
  83. Foster, E.J.; Hansen, N.; Wallenstein, M.; Cotrufo, M.F. Biochar and manure amendments impact soil nutrients and microbial enzymatic activities in a semi-arid irrigated maize cropping system. Agric. Ecosyst. Environ. 2016, 233, 404–414. [Google Scholar] [CrossRef]
  84. Mannan, M.; Halder, E.; Karim, M.; Ahmed, J. Alleviation of adverse effect of drought stress on soybean (Glycine max. L.) by using poultry litter biochar. Bangladesh Agron. J. 2016, 19, 61–69. [Google Scholar] [CrossRef]
  85. Agbna, G.H.; Dongli, S.; Zhipeng, L.; Elshaikh, N.A.; Guangcheng, S.; Timm, L.C. Effects of deficit irrigation and biochar addition on the growth, yield, and quality of tomato. Sci. Hortic. 2017, 222, 90–101. [Google Scholar] [CrossRef]
  86. Telahigue, D.C.; Yahia, L.B.; Aljane, F.; Belhouchett, K.; Toumi, L. Grain yield, biomass productivity and water use efficiency in quinoa (Chenopodium quinoa Willd.) under drought stress. J. Sci. Agric. 2017, 1, 222–232. [Google Scholar] [CrossRef]
  87. Aslam, M.U.; Raza, M.A.S.; Saleem, M.F.; Waqas, M.; Iqbal, R.; Ahmad, S.; Haider, I. Improving strategic growth stage-based drought tolerance in quinoa by rhizobacterial inoculation. Commun. Soil Sci. Plant Anal. 2020, 51, 853–868. [Google Scholar] [CrossRef]
  88. Tayyab, M.; Islam, W.; Khalil, F.; Ziqin, P.; Caifang, Z.; Arafat, Y.; Hui, L.; Rizwan, M.; Ahmad, K.; Waheed, S. Biochar: An efficient way to manage low water availability in plants. Appl. Ecol. Environ. Res. 2018, 16, 2565–2583. [Google Scholar] [CrossRef]
  89. de Melo Carvalho, M.; de Holanda Nunes Maia, A.; Madari, B.; Bastiaans, L.; Van Oort, P.; Heinemann, A.; Soler da Silva, M.; Petter, F.; Marimon, B., Jr.; Meinke, H. Biochar increases plant-available water in a sandy loam soil under an aerobic rice crop system. Solid Earth 2014, 5, 939–952. [Google Scholar] [CrossRef]
  90. Nawaz, M.F.; Bourrie, G.; Trolard, F. Soil compaction impact and modelling. A review. Agron. Sustain. Dev. 2013, 33, 291–309. [Google Scholar] [CrossRef]
Figure 1. Relationship between leaf area measured and leaf area calculated by the model per plant. Fitted linear regression was derived from the following equation: y = 0.974x + 8.233 (r2 = 0.986; p ≤ 0.0001). Cw and Cs—well-watered and water-stressed control, respectively; B1—woodchip biochar; B2—vineyard pruning biochar; V—vermicompost.
Agronomy 13 01412 g001
Figure 2. Time-trends during the experiment of plant height (a), stem diameter (b), number of branches (c), number of and leaves (d) of quinoa treated with different organic amendments. In each graph, dashed vertical lines indicate the water-stress period (from twelve-leaf stage, i.e., 26 DAS to bud stage, i.e., 35 DAS). Values are means (n = 3) ± s.e. The asterisks above the symbols indicate significant differences among treatments (p ≤ 0.05; Tukey’s test). *, **, ***—F test significant at p ≤ 0.05, 0.01, and 0.001, respectively; ns—not significant. Cw and Cs—well-watered and water-stressed control, respectively; B1—woodchip biochar; B2—vineyard pruning biochar; V—vermicompost.
Agronomy 13 01412 g002
Figure 3. Time-trends during the experiment of leaf area (a) and SPAD index (b) of quinoa treated with different organic amendments. In each graph, dashed vertical lines indicate the period of water stress (from twelve-leaf stage, i.e., 26 DAS to bud stage, i.e., 35 DAS). Values are means (n = 3) ± s.e. The asterisks above the symbols indicate significant differences among treatments (p ≤ 0.05, Tukey’s test). **, ***—F test significant at p ≤ 0.01 and 0.001, respectively; ns—not significant. Cw and Cs—well-watered and water-stressed control, respectively; B1—woodchip biochar; B2—vineyard pruning biochar; V—vermicompost.
Agronomy 13 01412 g003
Figure 4. Plant height (a), number of leaves (b), leaf area (c), and SPAD index (d) of quinoa treated with different organic amendments, at the end of the experiment. Values are means (n = 3) ± s.e. In each graph, different letters above the bars indicate significant differences among treatments (p ≤ 0.05, Tukey’s test). F test significant at p ≤ 0.001. Cw and Cs—well-watered and water-stressed control, respectively; B1—woodchip biochar; B2—vineyard pruning biochar; V—vermicompost.
Agronomy 13 01412 g004
Figure 5. Stem fresh weight (a) and dry matter content (b) and leaf fresh weight (c) and dry matter content (d) of quinoa treated with different organic amendments, at the end of the experiment. Values are means (n = 3) ± s.e. In each graph, different letters above the bars indicate significant differences among treatments (p ≤ 0.05, Tukey’s test). F test significant at p ≤ 0.001. Cw and Cs—well-watered and water-stressed control, respectively; B1—woodchip biochar; B2—vineyard pruning biochar; V—vermicompost.
Agronomy 13 01412 g005
Figure 6. Panicle length (a), number of sub-panicles (b), panicle and sub-panicle fresh weight (c), and dry matter content (d) of quinoa treated with different organic amendments, at the end of the experiment. Values are means (n = 3) ± s.e. In each graph, different letters above the bars indicate significant differences among treatments (p ≤ 0.05, Tukey’s test). Lowercase and uppercase letters refer to F test significant at p ≤ 0.01 and 0.001, respectively. In graphs c and d, the black bars are panicle and the gray bars are sub-panicles. Cw and Cs—well- and water-stressed control, respectively; B1—woodchip biochar; B2—vineyard pruning biochar; V—vermicompost.
Agronomy 13 01412 g006
Figure 7. Total fresh weight per plant (a), total water consumption per plant (b), and wateruse efficiency (c) of quinoa treated with different organic amendments, at the end of the experiment. Values are means (n = 3) ± s.e. In each graph, different letters above the bars indicate significant differences among treatments (p ≤ 0.05, Tukey’s test). Lowercase and uppercase letters refer to F test significant at p ≤ 0.05 and 0.001, respectively. Cw and Cs—well-watered and water-stressed control, respectively; B1—woodchip biochar; B2—vineyard pruning biochar; V—vermicompost.
Agronomy 13 01412 g007
Table 1. Main physico-used in the experiment.
PropertyUnitValue
Sand(%)66.1
Silt(%)11.5
Clay(%)22.4
Field Capacity (FC) at −0.03 MPa(% dw)22.8
Permanent Wilting Point (PWP) at −1.5 MPa(% dw)11.4
pH(-)7.6
EC(dS m−1)0.6
Corg(g kg−1)5.9
Organic Matter(%)1.0
Ntotal(‰)1.5
C/N(-)3.9
Table 2. Main chemical properties of the organic amendments used in the experiment.
PropertyUnitBiocharVermicompost
WoodchipsVineyard Prunings
pH(-)8.9 ± 0.110.6 ± 0.17.6 ± 0.1
EC(mS m−1)52.0 ± 0.0249.0 ± 0.0265.0 ± 0.0
Moisture(% dw)5.6 ± 0.115.3 ± 0.34.0 ± 0.2
Volatile solids(% dw)42.3 ± 0.415.3 ± 0.327.5 ± 0.6
Ash(% dw)4.4 ± 0.29.9 ± 0.072.2 ± 0.6
Fixed carbon(% dw)53.3 ± 0.274.8 ± 0.30.2 ± 0.0
C(% dw)68.3 ± 0.167.7 ± 0.911.3 ± 0.0
H(% dw)4.0 ± 0.02.1 ± 0.01.5 ± 0.1
N(% dw)1.0 ± 0.01.0 ± 0.01.5 ± 0.0
S(% dw)0.03 ± 0.00.2 ± 0.00.3 ± 0.0
Corg(% dw)66.3 ± 0.167.0 ± 0.97.8 ± 0.1
O(% dw)22.3 ± 0.317.9 ± 1.55.2 ± 0.2
H/Corg(-)0.7 ± 0.00.4 ± 0.0-
O/Corg(-)0.4 ± 0.00.2 ± 0.0-
C/N(-)67.2 ± 2.066.2 ± 0.15.0 ± 0.2
Values are means (n = 3) ± s.e.
Table 3. Phenological stages during the vegetative growing cycle of quinoa treated with different organic amendments.
TreatmentPhenological Stage (Days)
Seedling
Emergence
Leaf
Development Stages
Bud
Initiation
Flowering
Initiation
Two-LeafFrom Six-LeafTo Twelve-Leaf
Cw4.3 C8.7 C19.726.328.741.3
Cs4.3 C10.7 A21.025.328.642.7
B14.7 BC11.0 A19.725.028.340.7
B25.7 B9.3 BC21.326.329.043.0
V4.7 BC8.3 C21.325.328.342.3
B1+V3.7 C9.3 BC22.326.329.344.3
B2+V7.0 A10.0 AB21.026.028.041.0
Significance*****nsnsnsns
Values are means (n = 3). In each column, means followed by different letters are significantly different (p ≤ 0.05; Tukey’s test). ***—F test significant at p ≤ 0.001; **—F test significant at p ≤ 0.01; ns—not significant. Cw and Cs—well-watered and water-stressed control, respectively; B1—woodchip biochar; B2—vineyard pruning biochar; V—vermicompost.
Table 4. Absolute Growth Rate (cm d−1) of quinoa treated with different organic amendments in three periods of the growing cycle (AGR1, from the six-leaf to twelve-leaf stage; AGR2, from twelve-leaf stage to bud stage; AGR3, from bud to flowering initiation stage).
TreatmentAbsolute Growth Rate
AGR1AGR2AGR3
Cw1.33 a2.04 A2.62 B
Cs1.38 a1.19 C2.40 B
B11.41 a1.80 AB2.65 B
B21.24 a0.89 C2.03 C
V1.14 a1.63 B2.45 B
B1+V1.29 a1.78 AB2.53 B
B2+V0.72 b1.17 C2.98 A
Significance*******
Values are means (n = 3). In each column, means followed by different letters are significantly different (p ≤ 0.05; Tukey’s test). *, ***—F test significant at p ≤ 0.05 and p ≤ 0.001, respectively. Cw and Cs—well-watered and water-stressed control, respectively; B1—woodchip biochar; B2—vineyard pruning biochar; V—vermicompost.
Table 5. Relative water content (RWC, %), leaf water potential (Ψ, MPa), osmotic potential (Ψπ, MPa), turgor (Ψp, MPa), and turgid weight to dry weight ratio (TW/DW) of quinoa treated with different organic amendments, at the end of the water-stress period and after soil re-watering.
TreatmentEnd of Water-Stress PeriodAfter Soil Re-Watering
RWCΨΨπTW/DWRWCΨΨπΨpTW/DW
Cw75.4 A−1.70 A−1.81 A11.377.5 A−1.37 A−1.53 A0.1710.5 C
Cs56.1 D−2.50 B−2.49 BC11.669.1 BC−1.68 BC−1.94 BC0.2611.2 BC
B158.5 CD−2.58 B−2.51 BC10.270.7 AC−1.71 BC−1.88 BC0.1710.8 C
B264.7 BC−2.07 AB−2.05 AB11.173.2 AB−1.50 AB−1.72 AB0.2212.9 AB
V59.5 CD−2.53 B−2.54 C10.170.0 BC−1.82 C−1.91 BC0.0911.1 BC
B1+V55.5 D−2.56 B−2.58 C8.166.5 C−1.77 BC−2.01 C0.2510.2 C
B2+V69.6 AB−1.73 A−1.76 A10.372.2 AB−1.52 AB−1.68 AB0.1713.1 A
Significance******ns***ns*
Values are means (n = 3). In each column, means followed by different letters are significantly different (p ≤ 0.05; Tukey’s test). *, **—F test significant at p ≤ 0.05 and p ≤ 0.01, respectively; ns—not significant. Cw and Cs—well-watered and water-stressed control, respectively; B1—woodchip biochar; B2—vineyard pruning biochar; V—vermicompost.
Disclaimer/Publisher’s Note: The statements, opinions and data contained in all publications are solely those of the individual author(s) and contributor(s) and not of MDPI and/or the editor(s). MDPI and/or the editor(s) disclaim responsibility for any injury to people or property resulting from any ideas, methods, instructions or products referred to in the content.

