Article

Multi-Environment Genome-Wide Association Studies of Yield Traits in Common Bean (Phaseolus vulgaris L.) × Tepary Bean (P. acutifolius A. Gray) Interspecific Advanced Lines in Humid and Dry Colombian Caribbean Subregions

by
Felipe López-Hernández
1,2,*,
Esteban Burbano-Erazo
3,†,
Rommel Igor León-Pacheco
4,
Carina Cecilia Cordero-Cordero
3,
Diego F. Villanueva-Mejía
2,
Adriana Patricia Tofiño-Rivera
3 and
Andrés J. Cortés
1,*,‡
1
Corporación Colombiana de Investigación Agropecuaria (AGROSAVIA)—C.I. La Selva, Rionegro 054048, Colombia
2
Applied Sciences and Engineering School, EAFIT University, Medellín 050022, Colombia
3
Corporación Colombiana de Investigación Agropecuaria (AGROSAVIA)—CI Motilonia, Codazzi 202058, Colombia
4
Corporación Colombiana de Investigación Agropecuaria (AGROSAVIA)—CI Caribia, Sevilla 478029, Colombia
*
Authors to whom correspondence should be addressed.
Current Address: Institute for Plant Molecular and Cell Biology—IBMCP, Campus Universitat Politècnica de València, 46022 Valencia, Spain.
Secondary Address: Facultad de Ciencias Agrarias—Departamento de Ciencias Forestales, Universidad Nacional de Colombia—Sede Medellín, Medellín 050034, Colombia.
Agronomy 2023, 13(5), 1396; https://doi.org/10.3390/agronomy13051396
Submission received: 20 April 2023 / Revised: 16 May 2023 / Accepted: 16 May 2023 / Published: 18 May 2023
(This article belongs to the Special Issue Crop Tolerance under Biotic and Abiotic Stresses)

Abstract

:
Assessing interspecific adaptive genetic variation across environmental gradients offers insight into the scale of habitat-dependent heritable heterotic effects, which may ultimately enable pre-breeding for abiotic stress tolerance and novel climates. However, environmentally dependent allelic effects are often bypassed by intra-specific single-locality genome-wide associations studies (GWAS). Therefore, in order to bridge this gap, this study aimed at coupling an advanced panel of drought/heat susceptible common bean (Phaseolus vulgaris L.) × tolerant tepary bean (P. acutifolius A. Gray) interspecific lines with last-generation multi-environment GWAS algorithms to identify novel sources of heat and drought tolerance to the humid and dry subregions of the Caribbean coast of Colombia, where the common bean typically exhibits maladaptation to extreme weather. A total of 87 advanced lines with interspecific ancestries were genotyped by sequencing (GBS), leading to the discovery of 15,645 single-nucleotide polymorphism (SNP) markers. Five yield traits were recorded for each genotype and inputted in modern GWAS algorithms (i.e., FarmCPU and BLINK) to identify the putative associated loci across four localities in coastal Colombia. Best-fit models revealed 47 significant quantitative trait nucleotides (QTNs) distributed in all 11 common bean chromosomes. A total of 90 flanking candidate genes were identified using 1-kb genomic windows centered in each associated SNP marker. Pathway-enriched analyses were done using the mapped output of the GWAS for each yield trait. Some genes were directly linked to the drought tolerance response; morphological, physiological, and metabolic regulation; signal transduction; and fatty acid and phospholipid metabolism. We conclude that habitat-dependent interspecific polygenic effects are likely sufficient to boost common bean adaptation to the severe climate in coastal Colombia via introgression breeding. Environmental-dependent polygenic adaptation may be due to contrasting levels of selection and the deleterious load across localities. This work offers putative associated loci for marker-assisted and genomic selection targeting the common bean’s neo-tropical lowland adaptation to drought and heat.

1. Introduction

The means by which crop populations may adapt to abiotic pressures and novel climates is now a major research question in the fields of plant biology and genetics [1,2]. The pace at which adaptive reactions may occur is conditioned by the genomic architecture of adaptation (i.e., the frequency and effect sizes of underlying loci), as well as by its context-dependent interactions (e.g., intra- vs. interspecific heterosis, environmentally dependent allelic effects, and second-order genomic dependency, known as epistasis) [3]. However, despite recent efforts to harness interspecific variation as part of hybrid and introgression breeding approaches [4], habitat-dependent allelic effects are not sufficiently assessed when reconstructing the genomic bases of adaptation across multi-locality setups. Hence, we examine advanced interspecific pre-breeding lines across contrasting localities, and explore environmentally dependent allelic novelty for adaptation via last-generation multi-environment genome-wide association studies (GWAS).
Meanwhile, food security is being jeopardized by climate change worldwide [5]. Vulnerable localities in Latin America and the Caribbean exhibited levels of undernourishment of 47.7 million people in 2020, which are projected to reach 67 million by 2030; the repercussions of the COVID-19 pandemic are not factored into these data [6]. Given this scenario, legumes have offered a nature-based solution to source nutrients for rural communities in Latin America, Africa, and Asia, thanks to their high content of protein, folic acid, iron, dietary fiber, and complex carbohydrates [7]. Among the diverse legume species, the common bean (Phaseolus vulgaris L.) is one of the most widely cropped, with ∼27 million tons worldwide, with China and America being the main producers (FAO, 2018). However, the common bean remains heat and drought susceptible [8].
In the Caribbean coast of northwest South America, where beans are a key food security component and part of the cultural heritage of some indigenous communities [9], the global average temperature may increase close to the 1.5 °C threshold established in the Paris agreement [10], with a projected decrease of 3.75% in the average precipitation from 2020 to 2050, compared to the reference period of 1981–2010 [11,12]. Consequently, low levels of precipitation coupled with increased temperature may limit bean productivity in the Caribbean region. This is why common bean breeding efforts should target adaptability to adverse abiotic conditions in the region [13]. Optimizing the adaptive trajectories would then require (1) diversifying novel adaptation sources and (2) harnessing the genomic architecture of adaptation and environmental dependency.
Genetic resources from closely related Phaseolus species may leverage natural variation for adaptation to abiotic stresses, such as heat and drought [14]. Specifically, the tepary bean (P. acutifolius A. Gray), an annual autogamous bean native to northwest Mexico [15,16], was domesticated near the arid border with the USA. Geography has shaped the tepary bean’s adaptation to hot [17] and dry environments [18,19], making it the most heat-tolerant species of the Phaseolus genus. However, the tepary bean is limited as a modern crop compared to the more susceptible but commercially accepted common bean. An alternative is to use the tepary bean as an exotic donor of adapted alleles [20] to boost drought and heat tolerance in the common bean [21]. Previous studies have already explored the likelihood of hybrid and introgression breeding from the tepary bean genepool into the common bean background. For instance, the common bean has been backcrossed with tepary donors with a relatively good rate of viability [22,23]. Yet, these efforts have been unsuccessful to pyramid the target alleles for drought tolerance, possibly due to its complex, environmentally dependent, quantitative genetic inheritance [19].
Marker-based infinitesimal additive models have already contributed to improving our understanding of complex polygenic architectures underlying some quantitative adaptive traits [24]. For instance, last-generation genotyping of the common bean, inputted into GWAS-types models [25,26], has unveiled the polygenic bases of tolerance to drought [24], heat [27], and aluminum toxicity [28], as well as the complex genetic regulation of key agronomic traits [29] and mineral concentration [30]. Despite these major successes, it still remains to be assessed whether the same genomic architectures are concordant (in terms of the frequency, effect size, and co-location of quantitative trait nucleotides–QTNs), across habitat types at the multi-parental [31] interspecific boundary of hybrid and introgression breeding schemes [32]. After all, Fisherian polygenic architectures often limit the identification of single loci associations and their corresponding context-dependent (i.e., environmental) effects [33], especially when reconstructed with traditional mixed models. In other words, as the number of regulatory loci increases and their effect sizes decrease (as expected from a negative exponential distribution), it becomes harder to retain non-spurious genotype–phenotype associations while co-estimating their environmentally dependent effects [34].
Overall, it is yet unknown whether habitat-dependent interspecific heterotic adaptive effects might be recovered and leveraged in beans. Therefore, we wondered how multi-environment GWAS would reconstruct the genomic bases of adaptation in an advanced panel of drought/heat susceptible common bean (P. vulgaris L.) × tolerant tepary bean (P. acutifolius A. Gray) interspecific lines across the humid and dry Colombian Caribbean subregions. With this question in mind, the objectives of this study were to (1) identify well-adapted common bean × tepary bean interspecific lines at four localities in coastal Colombia by using seed yield as an agronomical fitness proxy; (2) reconstruct the genomic architecture of interspecific adaptive responses utilizing modern GWAS algorithms (i.e., FarmCPU and BLINK); and (3) compare the resultant genetic bases across localities to pinpoint putative habitat-dependent effects.
Because polygenic adaptation is regarded as a null working hypothesis strongly shaped by the environment [35], we predict habitat-dependent polygenic adaptive variation dragged from the exotic tepary ancestry into the more elite common bean background. The ultimate outcome of this research is to explore the potential of discovering and introgressing novel variants from the tepary bean into the common bean using seed yield traits as an indirect indicator of tolerance to naturally prevalent heat/drought conditions in coastal northwestern South America. Identifying the putatively associated loci (QTNs) with the adaptive response (fitness defined as the reproductive output) in a bean panel with interspecific common bean × tepary ancestries would aid in indirect selection (e.g., genomic-enabled prediction) and speed breeding of common bean varieties targeting the extreme weather conditions in coastal Colombia.

2. Materials and Methods

2.1. Plant Material

We carried out a pilot phenotyping in 2020 [21], which enabled the pre-selection of more suitable interspecific genotypes for the current genetic mapping effort, and will constitute an initial dataset to explore genome-enabled selection. The panel of 87 genotypes used in this study was composed of 67 interspecific lines between the common bean (P. vulgaris) and the tepary bean (P. acutifolius), and 19 advanced genotypes bred to high temperature and drought conditions by the bean program of the Alliance Bioversity–CIAT (International Center for Tropical Agriculture) [36]. These lines were transferred to AGROSAVIA after ATM subscription. In addition, the genotype G40001 (P. acutifolius) was used as a control. The interspecific lines corresponded to the third generation (and beyond [36]; a detailed pedigree is presented in Table S1) evaluated for the first time at four localities in the humid and dry Colombian Caribbean subregions [21].

2.2. Multi-Locality Field Trials

During the crop cycle of July–October 2020, the panel described above was evaluated at four localities in the humid and dry Colombian Caribbean subregions corresponding to the following AGROSAVIA’s research stations: Motilonia ([10°00′01.2″ N, 73°15′22.4″ W] Codazzi village in the province of Cesar); Caribia ([10°47′35.4″ N, 74°10′49.9″ W] Sevilla village in the province of Magdalena); Carmen de Bolívar ([9°42′50.8″ N, 75°06′26.9″ W] Carmen de Bolívar village in the province of Bolívar); and Turipaná ([8°50′27.47″ N, 75°48′27.56″ W] Cereté village in the province of Córdoba). The research stations in Motilonia and Carmen de Bolivar (foothill and mountainous, both at more than 100 m a.s.l.) belong to the dry Caribbean subregion, while the research stations in Caribia and Turipaná (tropical plains, both at less than 20 m a.s.l.) are representative of the humid Caribbean subregion.
With the aim to corroborate these environmental subregions, climate variables were recorded in situ during the months from cultivation to harvest. The precipitation patterns suggested that the research stations in Motilonia and Carmen de Bolivar had less precipitation (153.25 mm ± 34.94 and 81.95 mm ± 40.30, respectively) than the research stations in Caribia and Turipaná (207.73 mm ± 106.80 and 214.85 mm ± 92.62, respectively). The locality with the highest relative humidity was Motilonia, and the research station with the lowest relative humidity was in Carmen de Bolivar (Table S2). Additionally, the global daily (30 arcsec, ≈1 km) land surface precipitation, based on cloud cover-informed downscaling [37], was used to extract the time series of daily precipitation ( k g m 2 d a y ) for the same months from cultivation to harvest from the historical data from 2003 to 2016. The data reinforced that the two localities with more precipitation were Caribia and Turipaná (11.08 k g m 2 d a y ± 7.64 and 5.15 k g m 2 d a y ± 3.24, respectively), and the research stations with less precipitation were in Motilonia and Carmen de Bolivar (4.63 k g m 2 d a y ± 5.31 and 4.69 k g m 2 d a y ± 4.02, respectively; Figure S1). The soil properties suggested that Carmen de Bolivar had the highest level of pH, P, Ca, and K compared to the other stations (Table S2).

2.3. Experimental Design and Phenotyping

The genotypes were planted following a completely randomized block design (CRBD) with three repetitions at each locality. The experimental unit per treatment was a plot of four m2 with a spatial arrangement of one row spaced at 0.8 m and 0.25 m between the plants (13 plants per genotype). The missing genotypes were indicative of maladaptation at each locality. The standard yield traits [21,38] in the common bean were measured at the end of the cycle at each locality, specifically, NP: number of pods per plant, NS: average number of seeds per pod, YLP: yield per plant (g/plant), SB: seed biomass as 100-seed weight (g), and VB: vegetative biomass (g).
The vegetative biomass was reported as the pod biomass since no destructive sampling was performed. A previous pilot study considered the flowering time at the same localities [21] because the phenological traits may help convey a better understating of the adaptive responses. However, that study failed to provide any additional utility of weekly inspection of the flowering phenology beyond the one that was retrieved by the more traditional yield components. Therefore, with the intention to optimize manpower, the current trials focused on yield components. Meanwhile, the vegetative biomass and seed biomass were not reported for the Turipaná research station because of missing data. A ‘La Niña’ late event led to pod decomposition, which did not allow for an accurate measure of the vegetative biomass. Similarly, reliable seed biomass estimates were unfeasible in that locality, partly because most genotypes did not yield enough as to perform three repetitions for the 100-seed weight estimation. This was a manifestation of the naturally variable yield-defined adaptation at each locality.
An inherent consequence of the conditions described above was that the number of genotypes differed across the research stations for each parameter because the genotypes were not adapted in all the localities so as to concordantly reach the harvest phase, during which the yield traits were measured. We realize that this line of argumentation embraces an expanded, yet utilitarian concept of adaptation in the light of plant productivity, as compared to a more classical ecological definition of in situ local adaptation that would interpret fitness as the survivorship rate rather than reproductive output [8].
Detailed ANOVAs and correlations summary statistics were reported in extenso in [21]. On the other hand, the heritability estimates, although desirable, were precluded by the interspecific nature of the genotypes, as compared to more controlled within species multi-parental schemes.

2.4. Compilation of Indices for Yield Traits and Statistical Analysis

With the aim to weigh intra-genotype variability across repetitions for each yield trait, we utilized a mean–variance index that ponders the variability in each trait as the ratio of the mean of each genotype and its variance. Thus, high values of the index indicate genotypes with high performance and uniformity. Furthermore, we carried out the normalization of each trait by means of the automatic transformation Tukey’s Ladder of Powers [39] using the R-package rcompanion [40]. This algorithm iteratively uses Shapiro–Wilk tests to optimize the lambda at which transformation of the data is closest to normality. The normalization step was included because GWAS approaches based on mixed lineal models (MLM), as is the case for the algorithms implemented in GAPIT3 [41], are known to improve the statistical power when utilizing normalized quantitative traits [42]. Gaussian distribution was corroborated using the Shapiro–Wilk test carried out in the R-package nortest [43].
Normalized mean–variance indices for all the traits were then subjected to an analysis of variance between localities using Welch’s one-way ANOVA, as implemented by the ggbetweenstats function in the R-Package ggstatsplot [44]. The Games–Howell post hoc test was another non-parametric approach that we utilized to compare pairwise combinations of groups without having to assume the balance in the number of individuals and homogeneity of their variances. Because this study had different sample sizes per location, a Games–Howell test was implemented using Holm’s p-value adjustment method by the ggbetweenstats function in the R-Package ggstatsplot [44].
We also computed the best linear unbiased predictors (BLUPs) in all the traits across all the environments using the function lmer in the R-package lmerTest. Then, we carried out a parametric regression by the Pearson’s approach, adjusted by the Bonferroni method, between the BLUPs and the mean–variance index of all the traits across the environments using the function grouped_ggcorrmat in the R-package ggstatsplot. Finally, we ranked 25% of all the genotypes according to their BLUPs for all the traits per environment. This ranking was input to perform a set analysis in the R-package venn to identify common elite lines across localities.

2.5. DNA Extraction and Genotyping-by-Sequencing

The genomic data were obtained by means of genotyping by sequencing (GBS), following Elshire et al. [45]. The genomic DNA was extracted from 20 mg of leaf tissue sampled 40 days after germination and kept in silica gel after collection (Sigma-Aldrich, Hamburg, Germany). The DNA extraction was carried out using AGROSAVIA’s in-house protocol with maceration under liquid nitrogen, and precipitation from alcohol-based organic compounds (phenol and chloroform). The quantification of the extracted DNA was carried out by means of spectrophotometry using Nanodrop® 2000 equipment (Thermo Fischer Scientific, Waltham, MA, USA), and by fluorimetry using a Qubit® dsDNA HS fluorometer (Life Technologies, Angelholm, Sweden).
The enzymatic digestion was carried out using the cutting enzyme Apek1, which was standardized for the common bean as part of previous studies [24,27]. DNA libraries were prepared using the NEBNext® Ultra™ II DNA Library Prep Kit for Illumina®. The DNA libraries were quantified using the Qubit® dsDNA HS fluorometer. The concentration and fragment sizes of the DNA libraries were evaluated using the TapeStation 4200 (Agilent Technologies, Santa Clara, CA, USA) and the High Sensitivity D1000 kits.

2.6. Sequence Processing, Alignment and SNP Calling

The DNA sequences were obtained using the Illumina 2500 Hiseq sequencer (Macrogen, Seoul, Republic of Korea) in a single direction (single-end) and were preliminarily analyzed by the FastQC program [46] using the Illumina 1.9 coding. In order to clean the DNA sequencing data, the algorithm Trimmomatic [47] was run with the main parameters ILLUMINACLIP:TruSeq3-SE:2:30:10, SLIDINGWINDOW:4:20 and MINLEN:20. A quality analysis of the fastq files was also performed using the FastQC program [46] with Illumina 1.9 coding.
With the aim to identify allelic polymorphism, an automatized SNP calling script was constructed using the function HaplotypeCaller of the protocol GATK4 [48] and the alignment algorithm BWA [49]. The genome reference used was the second annotated version of the P. vulgaris assembly, as downloaded from the Phytozome platform, with an overall extension of ~600 Mb and read depth of ~83.2× (P. vulgaris v2.1, DOE-JGI and USDA-NIFA, http://phytozome.jgi.doe.gov/, accessed on 15 May 2023). This sequence data was produced by the US Department of Energy Joint Genome Institute. The mapping statistics were computed by means of the function flagstat from the Samtools 1.9 software [50] in the platform of the Galaxy project 2.0.3 [51].
The resultant SNP matrix was then filtered for allelic variant in the software Tassel 5.2.78 [52] using a minimum depth of 3X, a maximum percentage of missing data of 20% by loci and by sample, and a minimum allele frequency (maf) of 5%, which are the standard parameters for GWAS-type analyses. The pipeline is available in GitHub (https://github.com/FelipeLopez2019/SNP-calling-of-KOLFACI-project/blob/main/Kolfaci_Colombia_v4.sh, accessed on 15 May 2023).

2.7. Analysis of Kinship and Population Structure

Using the filtered SNP markers, the random and fixed effects were estimated in order to reduce the rate of false positives of each GWAS model. Random effects considered kinship relationships, while fixed effects account for population stratification. A kinship matrix was built by means of the VanRaden algorithm available in the GAPIT [41] package of R v.4.1.2 (R Core Team). Unsupervised population stratification was explored using the molecular principal component analysis (hereinafter referred to as PC) carried out in the GAPIT and optCluster R-packages [53], and the non-negative matrix factorization algorithm (snmf function) as implemented in the LEA R-package with 10,000 repetitions. The latter is an improvement to traditional admixture analysis [54] optimized by cross-entropy. In addition, we computed overall pairwise linkage disequilibrium (LD) in Tassel [52] to verify the association mapping power from natural and breed-driven recombination, and mapping resolution in terms of marker coverage.

2.8. Identification of Loci Associated with Yield Traits

GWAS algorithms FarmCPU and BLINK were implemented in a multi-locality manner for all five yield traits. These models are reported to increase the statistical power while better controlling the false-positive rate [55,56]. The population stratification and kinship were respectively considered as fixed and random effects, for a total of 40 models (ten per locality, spanning four localities; within each locality, five FarmCPU and five BLINK models were created, one for each trait).
Highly significant associations were determined using a strict Bonferroni correction of the p-value at an α = 0.05, which led to a significance threshold of −log10 (3.196 × 10⁻⁶) = 5.495 for all the GWAS models. Therefore, we used the Bonferroni threshold in order to evaluate the rate of false positives by visual interpretation of the Q–Q plots. In addition, since it is documented that the Bonferroni may be restrictive [57], we also considered a more relaxed threshold of −log10 (3.196 × 10⁻⁴) = 3.495, as previously suggested for common bean [27,58,59]. Circular manhattan plots and their respective Q–Q plots were generated in the R-package RIdeogram [60].

2.9. Identification of Candidate Genes and Pathways Enriched Analysis

Putative candidate genes were identified by inspecting the conservative flanking sections of 1-kb around each associated locus, following [61]. The flanking sections were captured using the common bean reference genome v2.1 [62] and the PhytoMine tool from the Phytozome v.13 platform (https://phytozome-next.jgi.doe.gov/, accessed on 15 May 2023). The identified genes were further annotated with the databases GO (http://geneontology.org/, accessed on 15 May 2023), PFAM (https://pfam.xfam.org/, accessed on 15 May 2023), PANTHER (http://www.pantherdb.org/, accessed on 15 May 2023), KEGG (https://www.genome.jp/kegg/, accessed on 15 May 2023), and Uniprot (https://www.uniprot.org/, accessed on 15 May 2023).
A pathway enrichment analysis identifies biological pathways that are enriched in a gene list more than would be expected by chance [63]. This analysis was carried out using the mapped output of the GWAS step for each yield trait index, which was inputted into the PhytoMine tool from the Phytozome v.13 platform employing the MetaCyc database (https://metacyc.org/, accessed on 15 May 2023) of metabolic pathways and enzymes [64]. The p-values to test the significance of the enrichment were computed using the hypergeometric distribution from the number of genes retrieved by the GWAS analyses, the number of genes in the reference population (Arabidopsis thaliana), the number of genes annotated with the specific item, and the number of genes annotated with alternative items in the reference population (A. thaliana). The use of alternative well-annotated reference genomes in terms of pathway ontology is mandatory for alignments where this tagging is still preliminary, as happens to be the case of common bean’s genome sequence.

3. Results

The genomic architecture of adaptation as inferred by modern GWAS algorithms suggested pervasive environmental-dependent genetic bases across localities. Several analyses redounded in this main result. First, in order to weigh multi-environment intra-genotype variability, we implemented an index that ponders the variability in each of the five yield traits, expressed as the ratio between the trait mean of each genotype and its variance (i.e., mean–variance analysis). All traits indices were normalized using automatic transformations as in Tukey’s Ladder of Powers [39], obtaining Gaussian distributions for each variable, which were contrasted with BLUP estimates enabling genotype ranking and line pre-selection. Meanwhile, GBS raw data was aligned against the reference genome of P. vulgaris v2.1 (Phaseolus vulgaris v2.1, DOE-JGI and USDA-NIFA, http://phytozome.jgi.doe.gov/, accessed on 15 May 2023) with the standard GATK protocol, retrieving a filtered matrix of allelic variants with a total 15,645 SNP markers.
Genetic clustering and kinship indicated five demographic clusters, with further subpopulations recovering family strata. A total of 47 unique loci were associated with any of the five yield trait indices across individual localities. Of these, 43 QTNs flanked a total of 90 genes across all 11 chromosomes. Associated genes with the number of pods per plant (NP), average number of seeds per pod (NS), 100-seed weight (SB), and vegetative biomass (VB) indices enriched pathways for Palmitate Biosynthesis II, Stearate Biosynthesis II, and Superpathway of Fatty Acid Biosynthesis II.

3.1. Phenotypic Segregation across Localities

The phenotypic descriptive analyses suggested among-locality trait segregation for the majority of the studied interspecific genotypes (Figures S2–S6) for the yield traits used as agronomical fitness proxies. In order to summarize the intra-genotype variability, the phenotypic mean-variance index was computed as described above. All the traits indices were then normalized using the automatic transformations of Tukey’s Ladder of Powers [39] to obtain Gaussian distributions for each indexed variable as follows: number of pods per plant–NP (Figure 1A), average number of seeds per pod–NS (Figure 1B), yield per plant–YLP (g/plant, Figure 1C), 100-seed weight index–SB (g, Figure 1D), and vegetative biomass index–VB (g, Figure 1E). A Shapiro–Wilk test corroborated the normality (Table S3), fulfilling the GWAS assumption.
The ranking of the BLUP values for each trait per environment is depicted in Table S7. The Bonferroni-adjusted Pearson test showed high (>0.7) to moderate correlation (>0.40) between the BLUPs and mean-variance of all the traits (Table S8). The set analysis suggested that in the Carmen de Bolivar station, four materials (G21, G84, G67, and G7) were found in the top 25% of the best genotypes for each trait. In the Caribia station, 12 materials (G87, G2, G85, G5, G84, G22, G28, G42, G18, G49, G82, and G11) were found in the top 25% of the best genotypes for each trait. Likewise, in the Motilonia station, 11 genotypes (G87, G82, G17, G3, G27, G85, G23, G13, G42, G8, and G44) were found in the top 25% of the best materials for each trait. However, in the Turipaná station, there was not any genotype found to be the best across the five traits. Overall, there were only five elite genotypes for all the traits for the Caribia and Motilonia stations (G87, G82, G85, and G42), and only one for Caribia and Carmen de Bolivar localities (G84).

3.2. A Total of 15,645 SNP Markers Were Recovered from the Interspecific Panel Using GBS

DNA extraction from all 87 accessions (Table S4) reported a mean DNA concentration (ug/uL) of 3968.80 (IC: 388.02) using Nanodrop®, a Qubit® mean concentration (ug/uL) of 95, 20 (CI: 8.14), a mean A260/280 ratio of 2.13 (CI: 0.01), and a mean A260/230 ratio of 2.15 (CI: 0.01). Subsequently, the 87 genetic libraries built for sequencing presented a mean Qubit® concentration (ug/uL) of 16.70 (CI: 2.70), a mean fragment size (bp) of 323.00 (CI: 2.59), and a mean TapeStation® quantification of 78.74 nM (CI: 13.00) (Table S5). The electropherograms for each genotype suggested a distribution of the fragments with defined peaks, and without the presence of contaminants. Only genotype 85 did not have sufficient quality parameters to integrate it within the alignment and SNP calling pipeline. Following the GATK4 protocol [65] and using the second version of the reference genome of P. vulgaris [62], a raw matrix of allelic variants was obtained with 1,919,875 sites. Retaining loci with a minimum depth of 3X, less than 20% of missing data, and a minimum allelic frequency (maf) of 5%, and keeping genotypes with less than 20% of missing data led to 15,645 SNPs and 84 genotypes, including the tepary bean reference (G87).
Figure 1. Analysis of variance between locations using Welch’s one-way ANOVA, as implemented in the ggbetweenstats function of the R-Package ggstatsplot. A Games–Howell test was also carried out using Holm’s p-value fitting method via the ggbetweenstats function of the R-Package ggstatsplot (Patil, 2021). Normal distributions of the studied variables are summarized using violin plots in the Turipaná, Motilonia, Carmen de Bolivar, and Caribia research stations. Traits are depicted as follows: (A) NP: number of pods per plant; (B) NS: average number of seeds per pods; (C) YLP: yield per plant (g/plant); (D) SB: 100-seed weight (g); (E) VB: vegetative biomass (g).
Agronomy 13 01396 g001

3.3. Genetic Structure and Kinship Relationships Suggested Five Demographic Clusters

The population stratification, carried out with clustering methodologies and an ancestry-model approach, suggested that all 84 accessions comprised five demographic groups (Figure 2B,C). A kinship reconstruction using the VanRaden algorithm also suggested 5 groups (Figure S7). Within the population substructure, it was revealed that closely related genotypes grouped in clusters that matched interspecific families’ genealogies (Figure S8), as expected from the deep divergence among the parental linages (i.e., two well-differentiated species and a profound genepool division within the common bean). Because of this, the genetic structure used in the GWAS analysis as a covariate comprised a total of 12 groups, so that all the genetic clusters had at least one genotype with a purity threshold greater than 90 percent (Figure 2A).
Utilizing detailed population substructure embracing genepools, family, and more subtle clusters enables an efficient control of the false positive rate by lowering the p-values of associated SNPs that covariate with both the demographic and the genealogical stratification. An overall linkage disequilibrium (LD) decay revealed that the studied panel harbors sufficient inter- and intraspecific recombination events for association mapping, while the GBS-based SNP genotyping conveys enough marker coverage of the resulting haplotype blocks (Figure S10).
Figure 2. Unsupervised population stratification inference. (A) Non-negative matrix factorization algorithm (snmf function) in the LEA R-package, an improvement from the classical admixture inference (Frichot and François, 2015). (B) Cross-entropy optimization with 10,000 repetitions of snmf function. (C) Molecular principal component analysis (PC) carried out by optCluster R-package (Sekula et al. 2017).
Agronomy 13 01396 g002

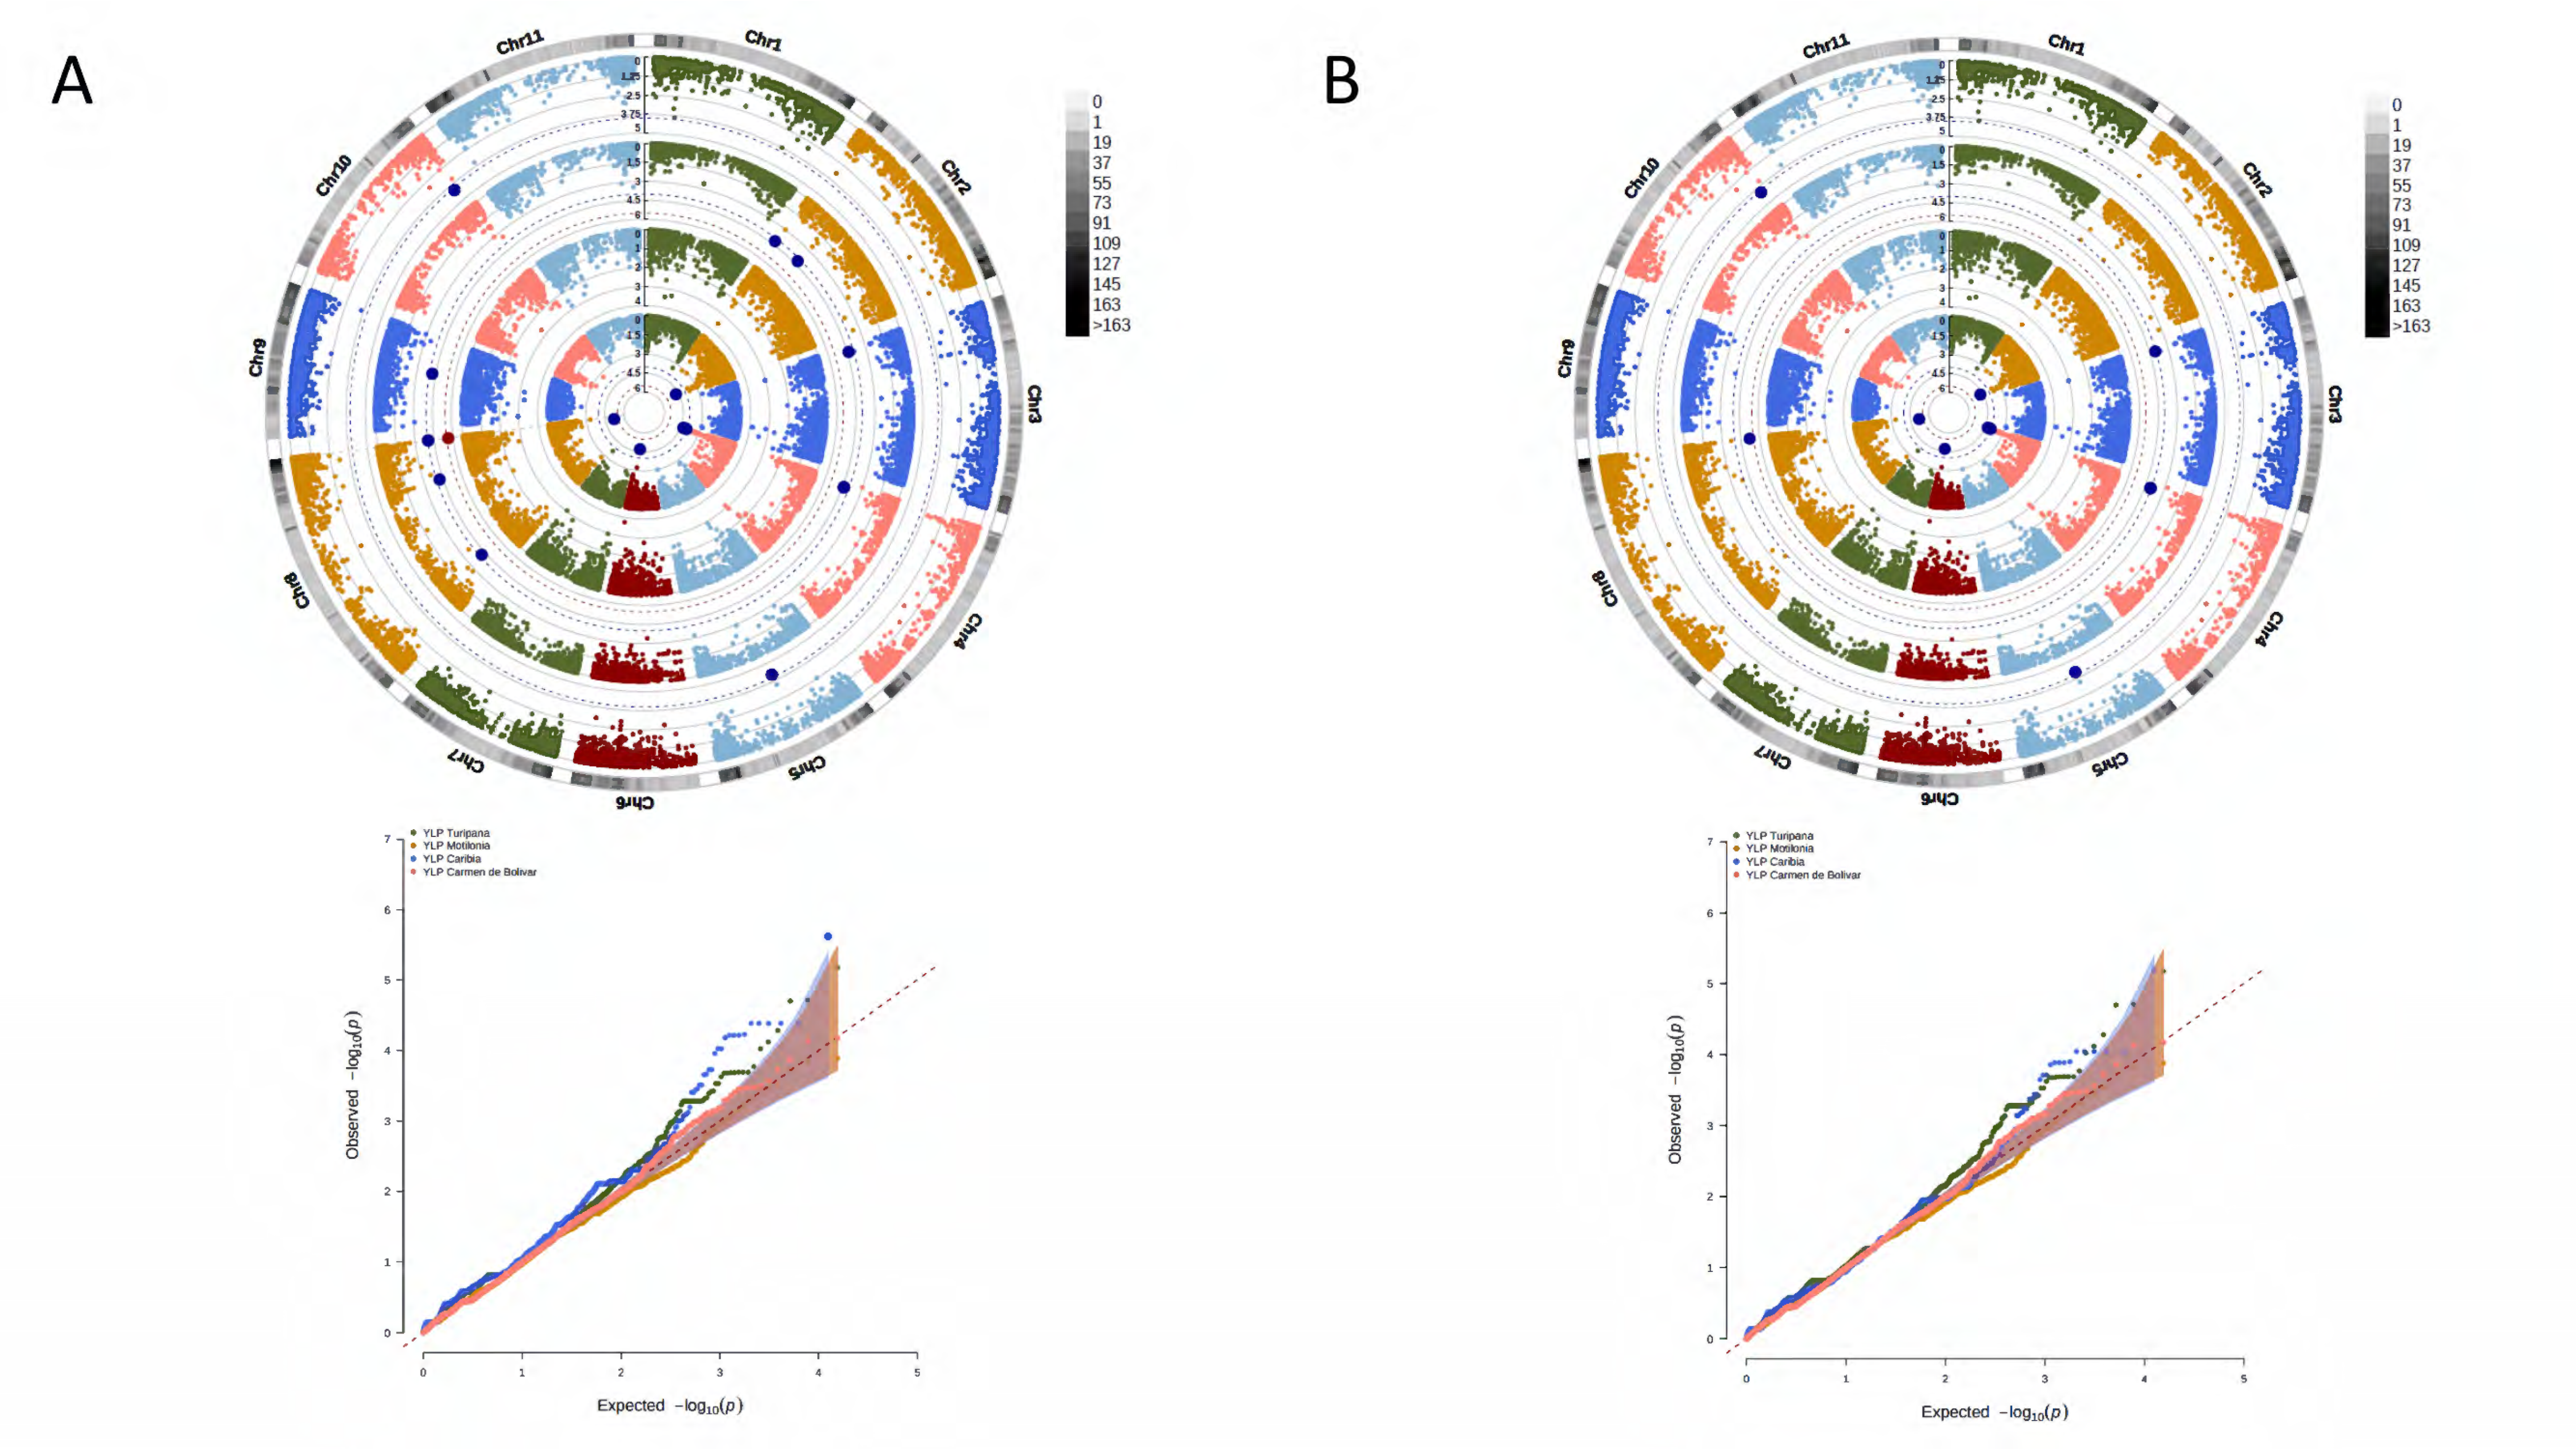
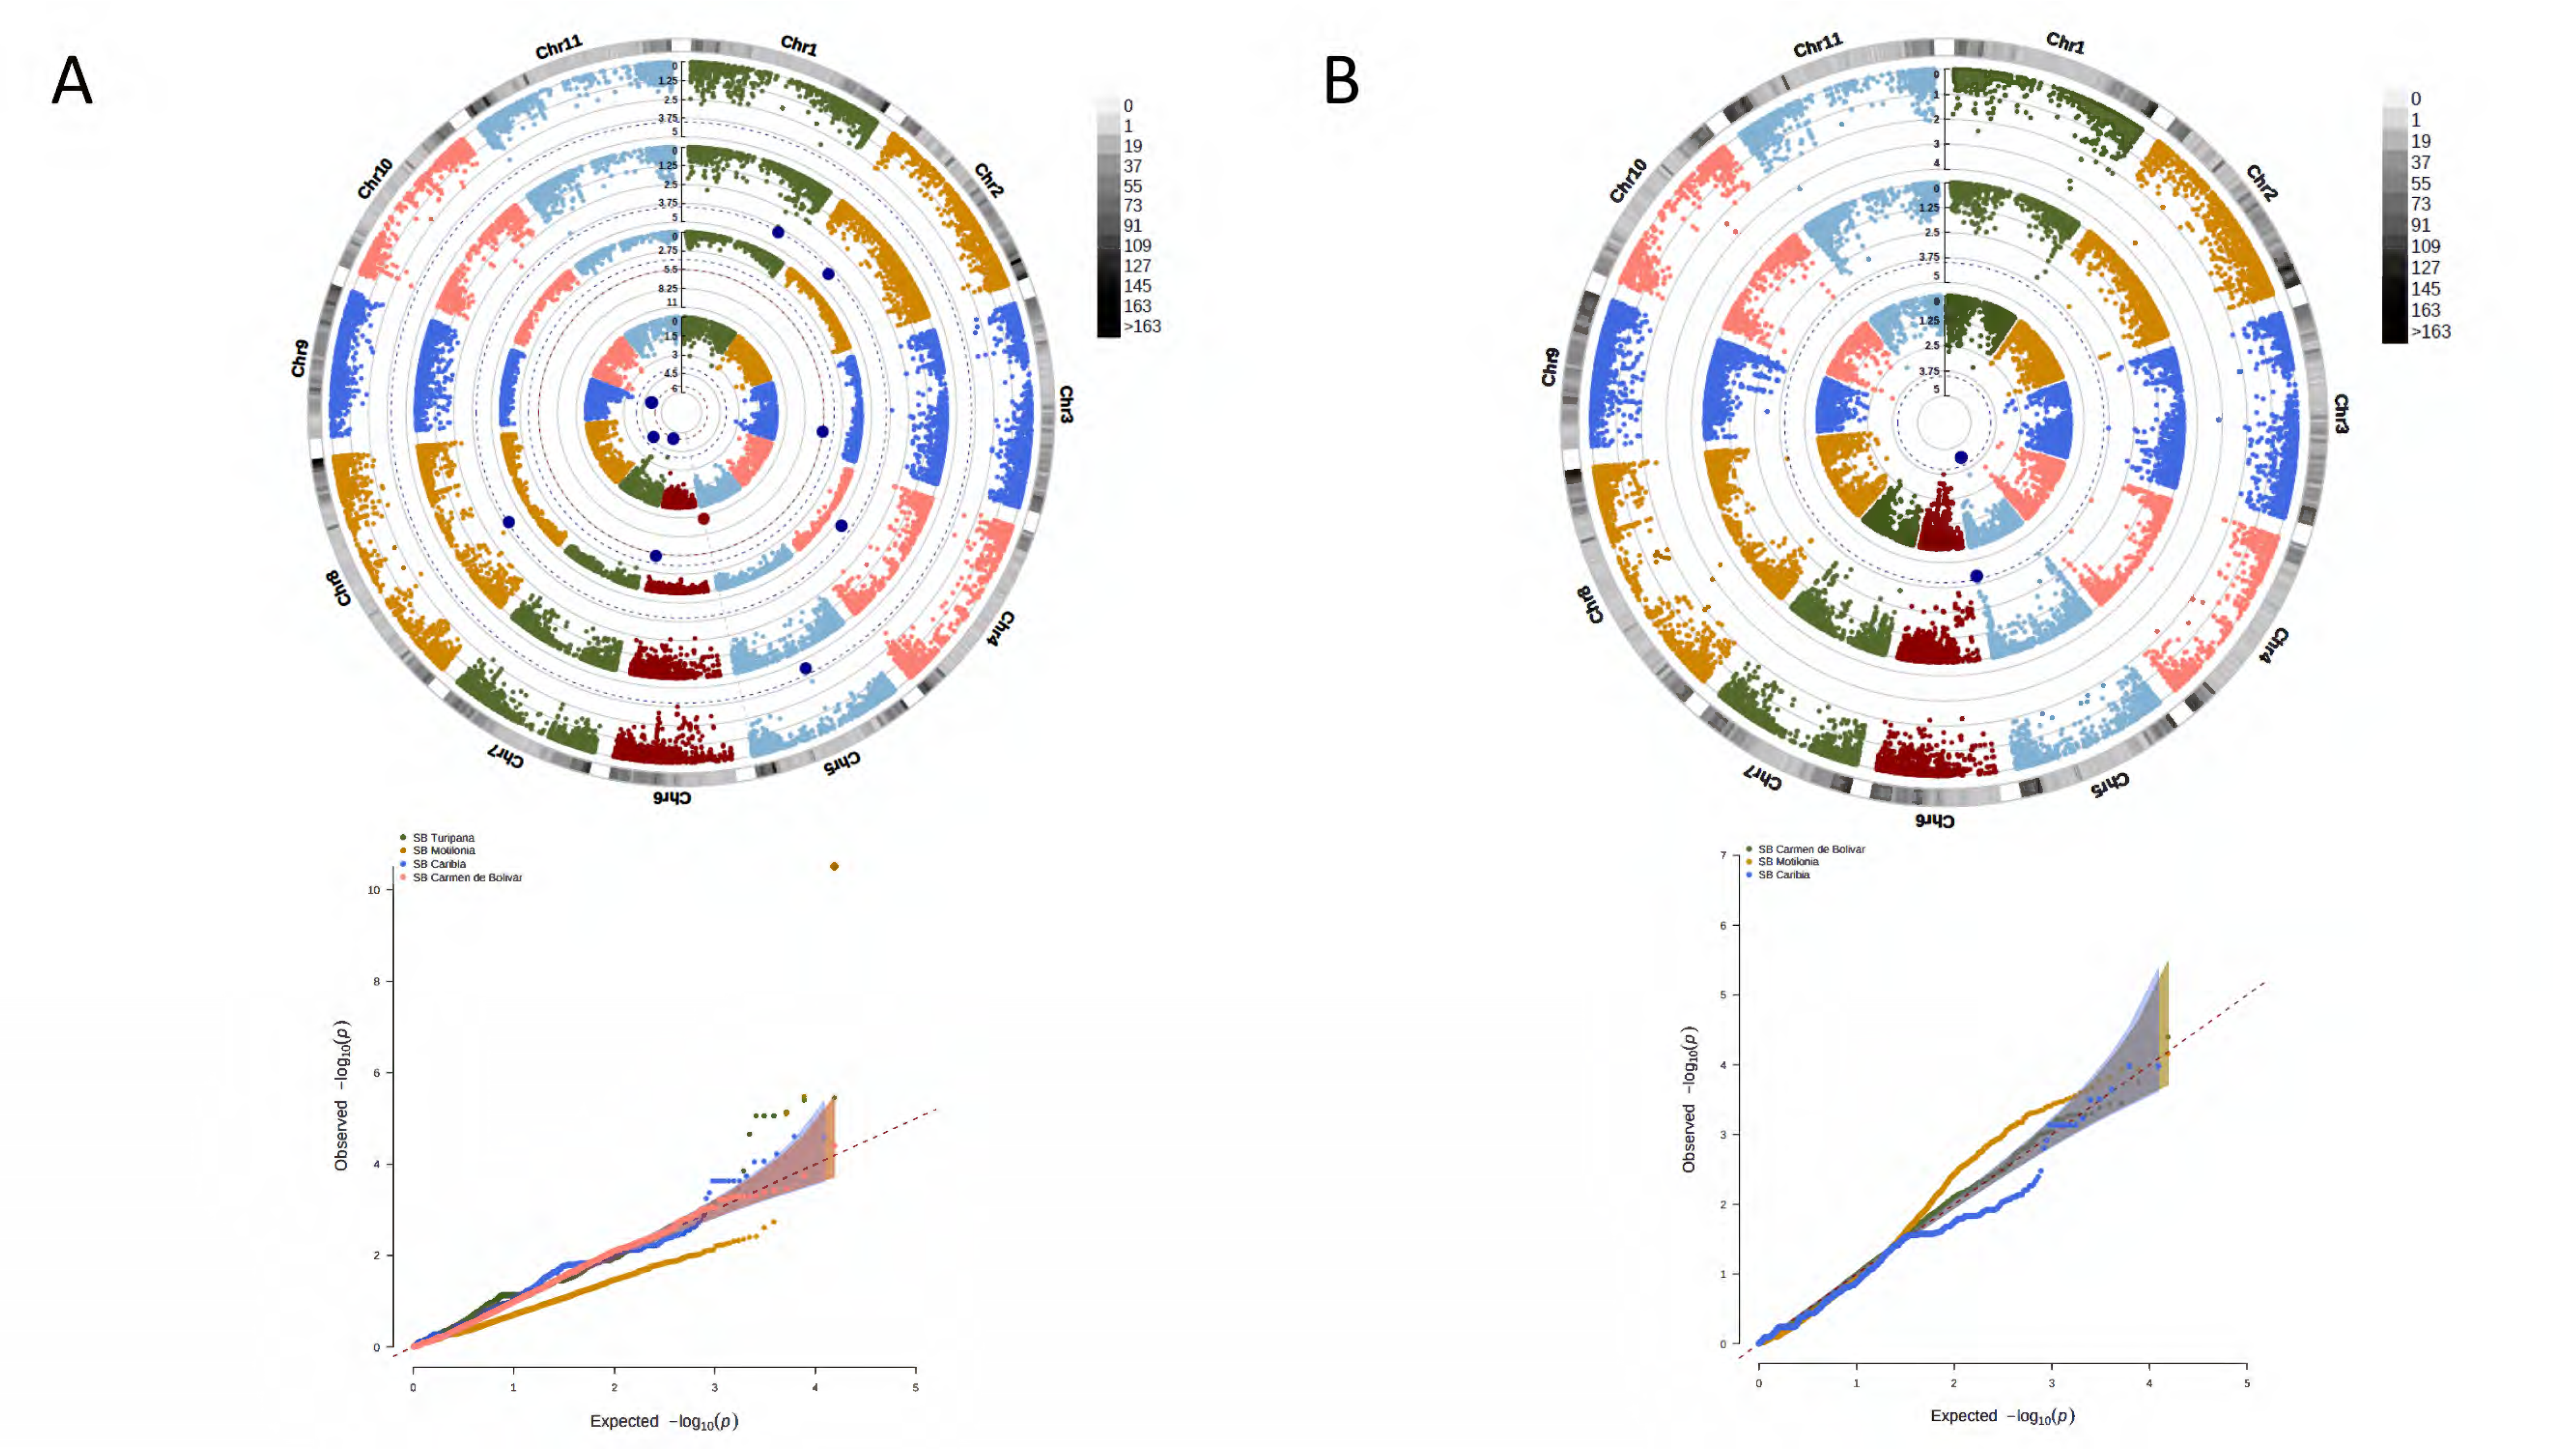
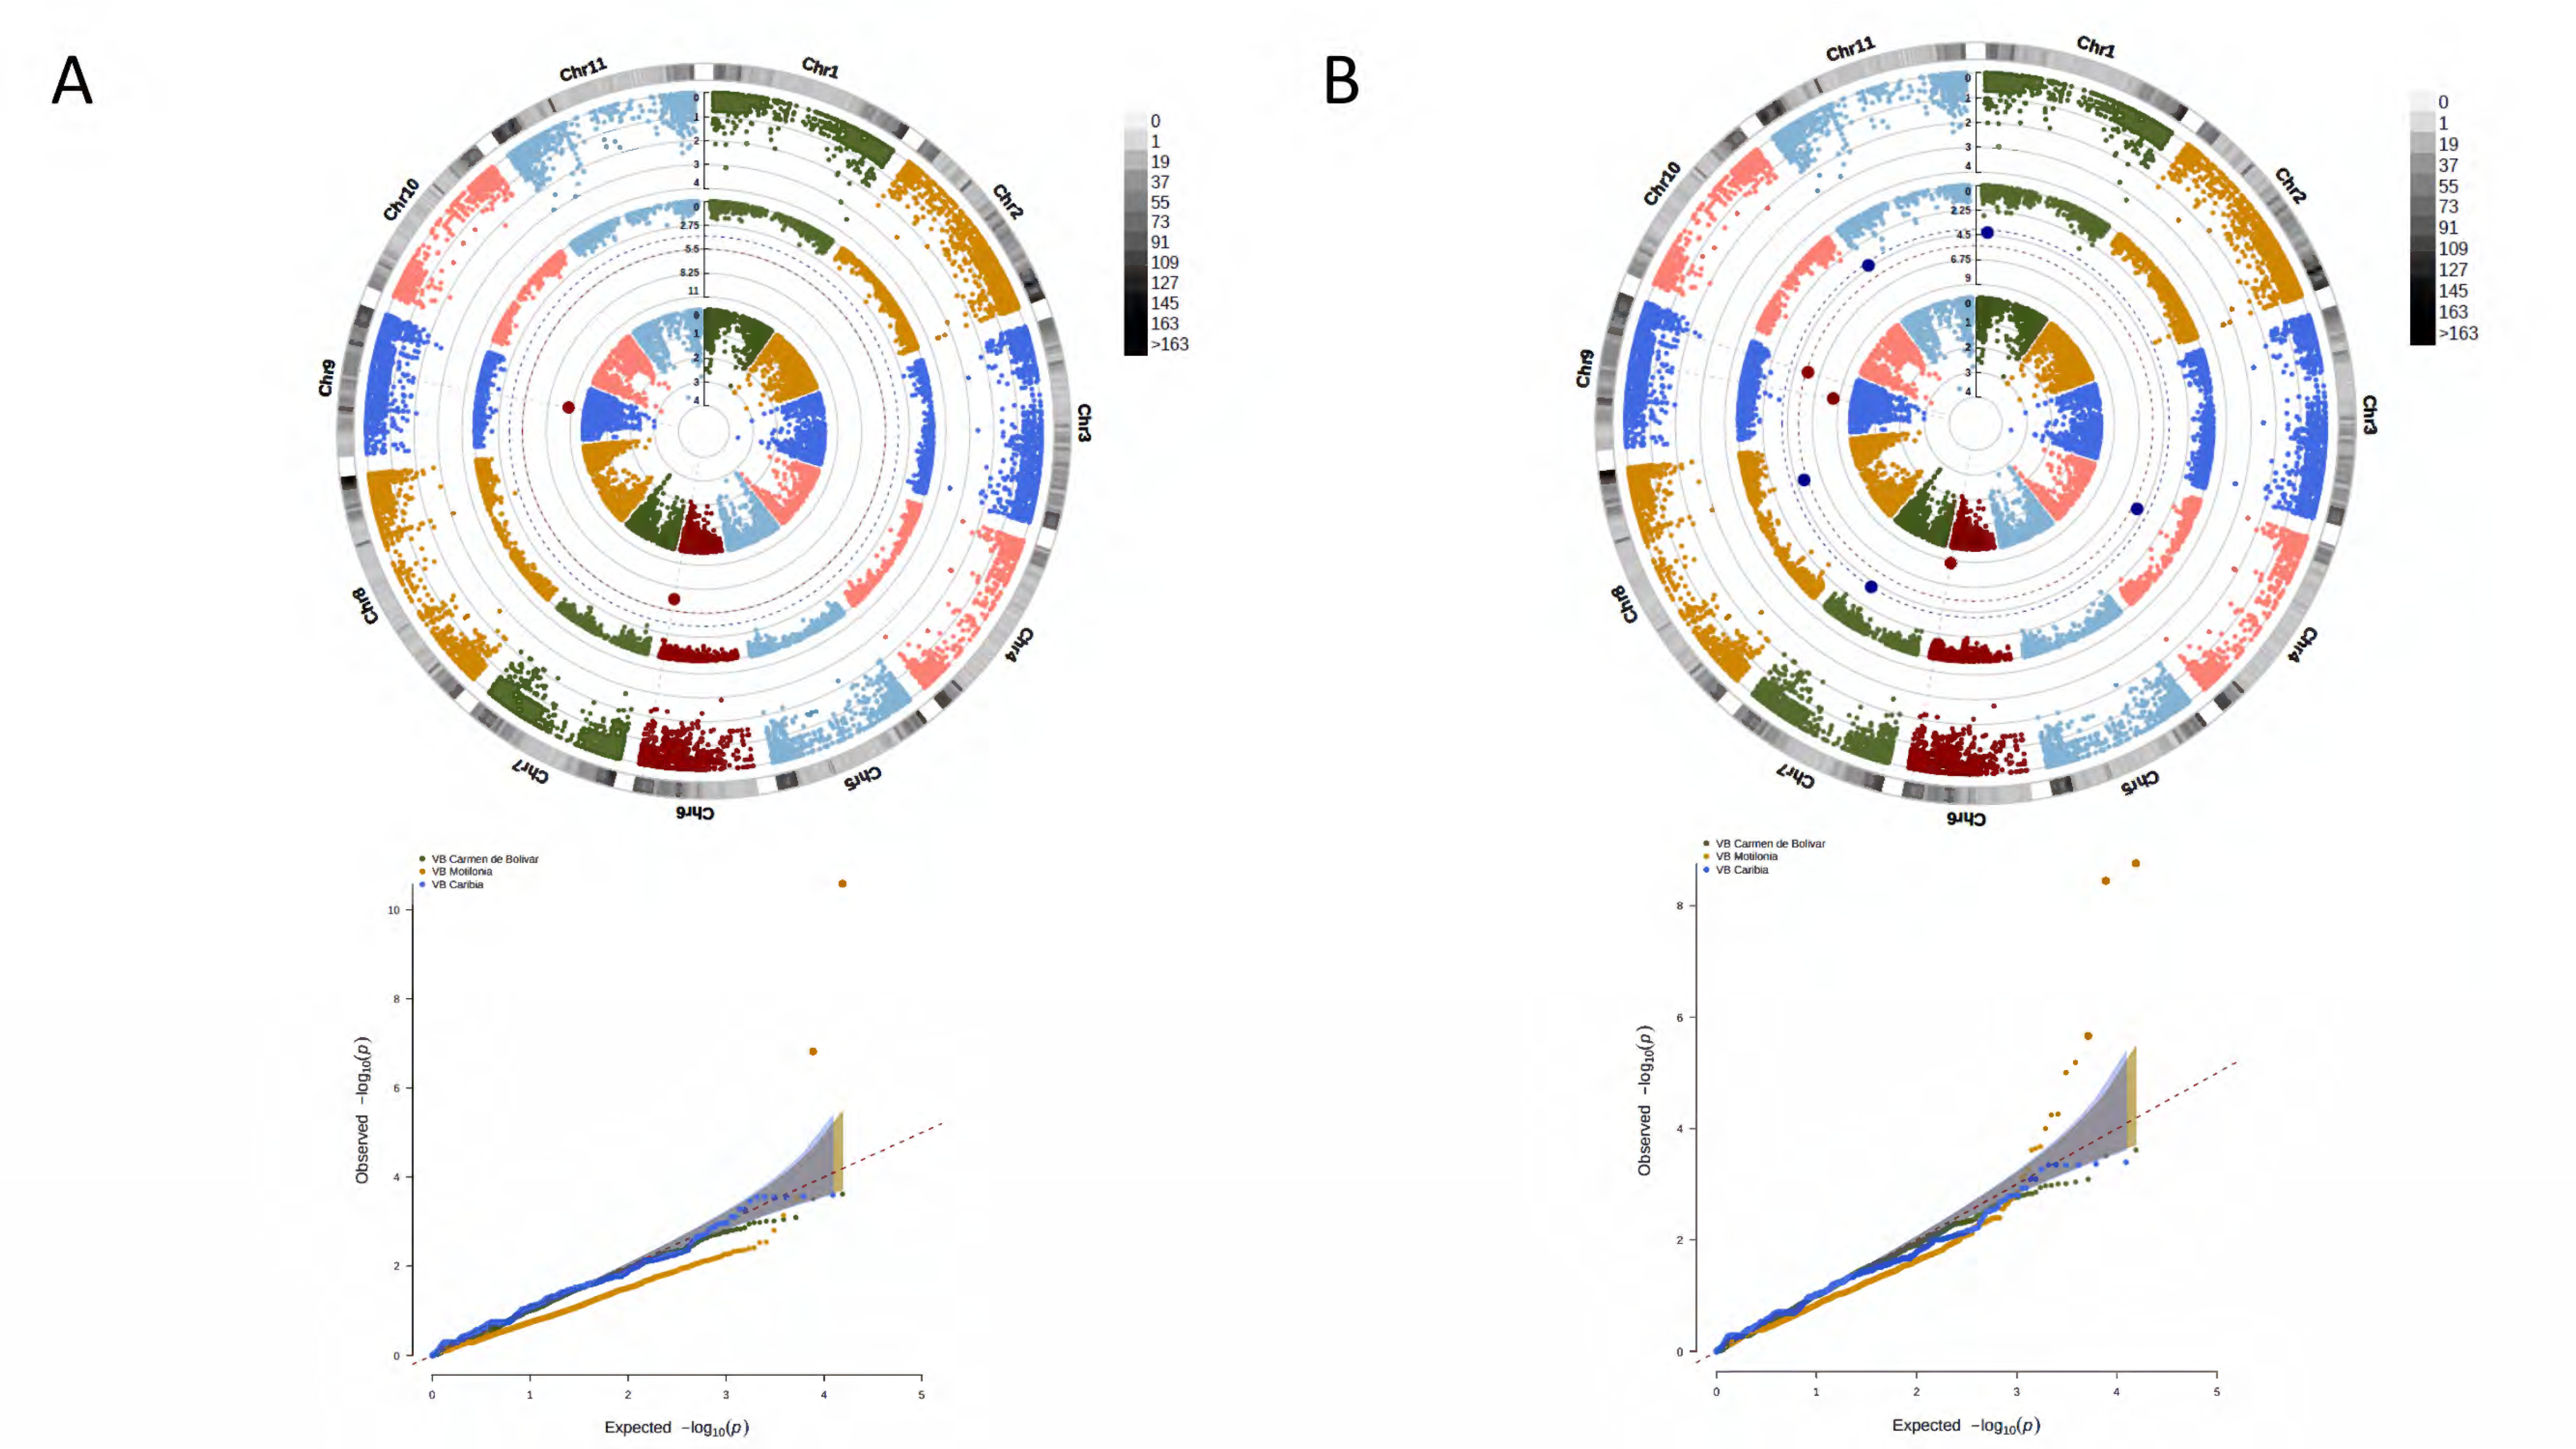
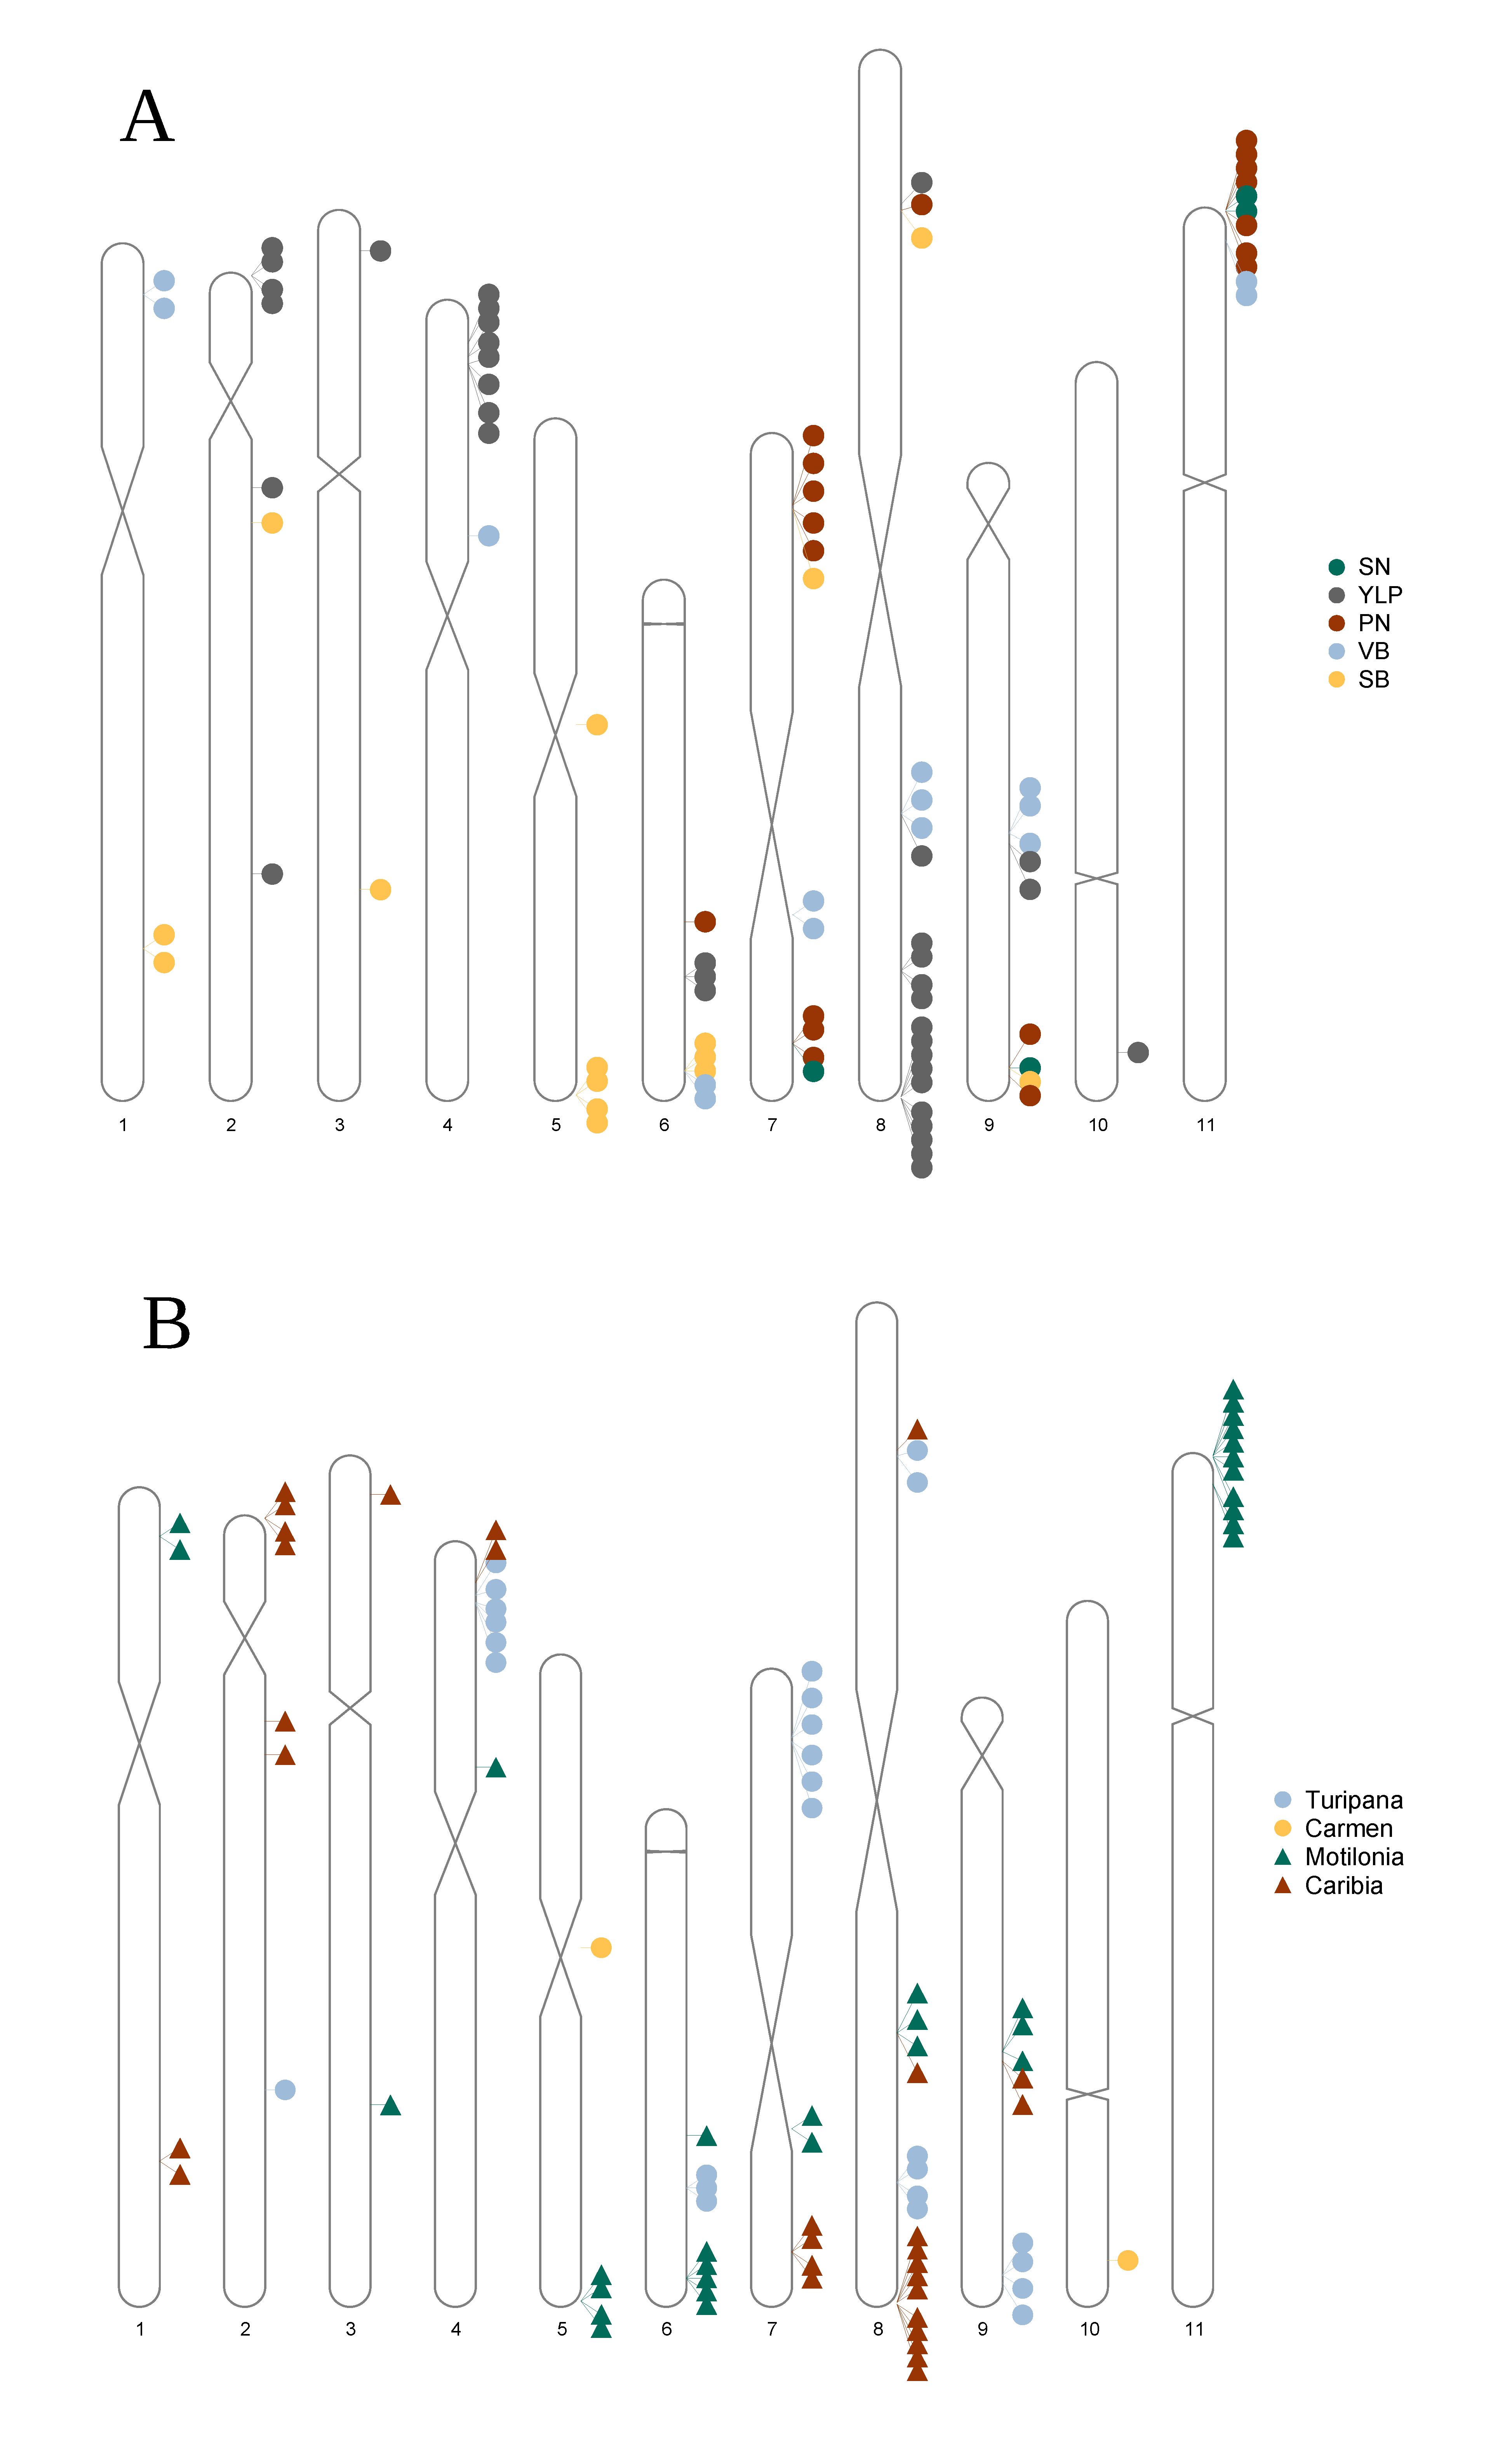
3.4. A Total of 47 Loci and 90 Genes Led to Environmentally Dependent Polygenic Adaptation

The GWAS methods BLINK and FarmCPU recovered similar counts of the associated molecular markers, 128 SNPs with BLINK and 122 SNPs with FarmCPU, conveying an overlap of 60.05% (Table S6, arranged graphically in the circular Manhattan plots of Figure 3, Figure 4, Figure 5, Figure 6 and Figure 7 with the associated QQ-plots, summarized for all traits and localities in Figure 8, and synthetized for their genetic functionality in Table 1). These trends suggest that the genomic architecture of tepary × common bean adaptation to the Caribbean coast of Colombia was polygenic, involving a total of 47 QTNs for the five recorded yield traits across all the chromosomes. This polygenic genomic basis applies to all the traits. Specifically, 11 QTNs were found number of pods–NP (Figure 3), 11 QTNs for average number of seeds per pod–NS (Figure 4), 21 QTNs for overall yield per plant–YLP (Figure 5), 13 QTNs for 100-seed weight–SB (Figure 6), and 14 QTNs for pod vegetative biomass–VB (Figure 7). Reinforcing the complex genomic architectures, chromosomes 11, 9, 8, 7, and 4 contained the majority of the associated molecular markers with 28, 51, 39, 52, and 35 SNPs, respectively. Chromosomes 6, 5, and 2 displayed 16, 12, and 8 QTNs, respectively. Finally, chromosomes 10, 3, and 1 had the simplest genomic architectures with 2, 3, and 4 QTNs, respectively (Table S6).
Interestingly, the polygenic architecture of adaptation was environmentally dependent. Specifically, the Caribia locality, which is located in the wet Caribbean subregion, was the one with the most associated markers (16 QTNs, Figure 3, Figure 4, Figure 5, Figure 6 and Figure 7, Table S6), followed by the humid Turipaná locality and the drier Motilonia locality (13 and 12 QTNs, respectively, Figure 3, Figure 4, Figure 5, Figure 6 and Figure 7, Table S6). Carmen de Bolivar, also located in the dry Caribbean subregion, had fewer associated molecular markers (2 QTNs, Figure 3, Figure 4, Figure 5, Figure 6, Figure 7 and Figure 8, Table S6). Neither algorithm detected overlap of the associated markers across the localities (Figure S9A).
Concerning gene hitchhiking, from the 47 associated QTNs, 43 were flanked by 90 annotated genes given a 1-kb window in the common bean reference genome. From the 90 flanking genes, 19 were associated with NP, 20 with NS, 38 with YLP, 22 with SB, and 27 with VB. Also congruent with the environmental dependency trend, 33 and 29 flanking genes were recovered in the localities of Motilonia and Caribia, respectively, and 26 and 2 genes were captured in the localities of Turipaná and Carmen de Bolivar, respectively (Figure 8). An overlap of the associated genes across localities was rare, involving no genes (Figure S9B).

3.5. Associated Genes Enriched Drought Tolerance Response Pathways

The 90 genes that flanked all 43 associated loci (QTNs) suggested multiple response mechanisms as part of the drought tolerance pathways, making water scarcity a likely target of selection for beans planted in the northern coast of Colombia. In the dry Caribbean subregions, the preponderant response mechanisms to drought stress were signal transduction (i.e., ethylene response factor—ERF), photosynthesis (i.e., LHCA3, chloroplast stem–loop binding protein, and chloroplastic mate efflux family protein 3), and drought-induced proteins (i.e., late embryogenesis abundant). On the other hand, in the humid Caribbean subregions, the genetic basis of adaptation recalled drought tolerance pathways via regulators of the morphological, physiological (i.e., wax inducer1/shine1), and photosynthetic functions (i.e., plastocyanin-like domain), as well as drought-induced proteins (i.e., MYB), reactive oxygen metabolism (i.e., peroxidase proteins), and fatty acid and phospholipid metabolism (Table S6). An overall pathway enrichment analysis suggested a total of 28 key metabolic pathways enriched for the linked genes (Table 1), as detailed below.
Figure 3. Concentric circular Manhattan plots of multi-environment genome-wide association studies and QQ-plot for number of pods per plant using an integrated advanced panel comprising common bean (P. vulgaris L.) × tepary bean (P. acutifolius A. Gray) interspecific lines in the humid and dry subregions of the Colombian Caribbean. Each ring represents the GWAS results per locality, from the outer to the inner ring, respectively: Turipaná, Motilonia, Carmen de Bolívar, and Caribia research stations. The density of genetic markers is depicted in gray. Also within the Manhattan circular plots, red dots indicate SNPs that exceeded the Bonferroni threshold (red dotted line, p-value = 3.196 × 10⁻⁶), while blue dots indicate SNPs that exceeded the less stringent threshold (blue dotted line, p-value = 3.196 × 10⁻⁴). Implemented GWAS algorithms were (A) BLINK and (B) FarmCPU.
Agronomy 13 01396 g003
Figure 4. Concentric circular Manhattan plots of multi-environment genome-wide association studies and QQ-plot for average number of seeds per pod using an integrated advanced panel comprising common bean (P. vulgaris L.) × tepary bean (P. acutifolius A. Gray) interspecific lines in the humid and dry subregions of the Colombian Caribbean. Each ring represents the GWAS results per locality, from the outer to the inner ring, respectively: Turipaná, Motilonia, Carmen de Bolívar, and Caribia research stations. The density of genetic markers is depicted in gray. Also within the Manhattan circular plots, red dots indicate SNPs that exceeded the Bonferroni threshold (red dotted line, p-value = 3.196 × 10⁻⁶), while blue dots indicate SNPs that exceeded the less stringent threshold (blue dotted line, p-value = 3.196 × 10⁻⁴). Implemented GWAS algorithms were (A) BLINK and (B) FarmCPU.
Agronomy 13 01396 g004
Figure 5. Concentric circular Manhattan plots of multi-environment genome-wide association studies and QQ-plot for yield per plant (g/plant) using an integrated advanced panel comprising common bean (P. vulgaris L.) × tepary bean (P. acutifolius A. Gray) interspecific lines in the humid and dry subregions of the Colombian Caribbean. Each ring represents the GWAS results per locality, from the outer to the inner ring, respectively: Turipaná, Motilonia, Carmen de Bolívar, and Caribia research stations. The density of genetic markers is depicted in gray. Also within the Manhattan circular plots, red dots indicate SNPs that exceeded the Bonferroni threshold (red dotted line, p-value = 3.196 × 10⁻⁶), while blue dots indicate SNPs that exceeded the less stringent threshold (blue dotted line, p-value = 3.196 × 10⁻⁴). Implemented GWAS algorithms were (A) BLINK and (B) FarmCPU.
Agronomy 13 01396 g005
Figure 6. Concentric circular Manhattan plots of multi-environment genome-wide association studies and QQ-plot for 100-seed weight (g) using an integrated advanced panel comprising common bean (P. vulgaris L.) × tepary bean (P. acutifolius A. Gray) interspecific lines in the humid and dry subregions of the Colombian Caribbean. Each ring represents the GWAS results per locality, from the outer to the inner ring, respectively: Turipaná, Motilonia, Carmen de Bolívar, and Caribia research stations. The density of genetic markers is depicted in gray. Also within the Manhattan circular plots, red dots indicate SNPs that exceeded the Bonferroni threshold (red dotted line, p-value = 3.196 × 10⁻⁶), while blue dots indicate SNPs that exceeded the less stringent threshold (blue dotted line, p-value = 3.196 × 10⁻⁴). Implemented GWAS algorithms were (A) BLINK and (B) FarmCPU.
Agronomy 13 01396 g006
Figure 7. Concentric circular Manhattan plots of multi-environment genome-wide association studies and QQ-plot for pod vegetative biomass (g) using an integrated advanced panel comprising common bean (P. vulgaris L.) × tepary bean (P. acutifolius A. Gray) interspecific lines in the humid and dry subregions of the Colombian Caribbean. Each ring represents the GWAS results per locality, from the outer to the inner ring, respectively: Turipaná, Motilonia, Carmen de Bolívar, and Caribia research stations. The density of genetic markers is depicted in gray. Also within the Manhattan circular plots, red dots indicate SNPs that exceeded the Bonferroni threshold (red dotted line, p-value = 3.196 × 10⁻⁶), while blue dots indicate SNPs that exceeded the less stringent threshold (blue dotted line, p-value = 3.196 × 10⁻⁴). Implemented GWAS algorithms were (A) BLINK and (B) FarmCPU.
Agronomy 13 01396 g007
Figure 8. Summarized genomic architecture of adaptation via multi-environment GWAS of yield traits as agronomic fitness proxy in advanced genotypes of common bean (P. vulgaris L.) × tepary bean (P. acutifolius A. Gray) interspecific lines at four localities in the Caribbean. (A) Idiogram across the five yield traits (NP: number of pods per plant, NS: average number of seeds per pods, YLP: yield per plant, SB: 100-seed weight as seed biomass, VB: vegetative biomass). (B) Idiogram across all four localities (Turipaná, Motilonia, Carmen de Bolívar, and Caribia).
Agronomy 13 01396 g008
Table 1. Pathways-enriched analysis for each yield trait index across four localities in the Caribbean coast of Colombia. The software used was the PhytoMine tool in the Phytozome v.13 plat- form. The p-value was calculated using the hypergeometric distribution. Abbreviations under the “variable” column are as follows: NP: number of pods per plant, NS: average number of seeds per pods, YLP: yield per plant (g/plant), SB: 100-seed weight (g) as measure of seed biomass, and VB: vegetative biomass.
VariableGene IDp-ValuePathway IDPathway Name
NPPAC:371653991.6578 × e−5 FASYN-ELONG-PWYfatty acid elongation—saturated
NPPAC:371653992.3272 × e−4PWY-5156superpathway of fatty acid biosynthesis II (plant)
NPPAC:371653991.1329 × e−4PWY-5971palmitate biosynthesis II (bacteria and plants)
NPPAC:371653992.7244 × e−5PWY-5973cis-vaccenate biosynthesis
NPPAC:371653991.1324× e−4 PWY-5989stearate biosynthesis II (bacteria and plants)
NPPAC:371653993.1750 × e−5PWY-6282palmitoleate biosynthesis I (from (5Z)-dodec-5-enoate)
NPPAC:371653993.2671 × e−5PWY-7388octanoyl-[acyl-carrier protein] synthesis (mitochondria)
NPPAC:371653991.5583 × e−5PWY-7663gondoate biosynthesis (anaerobic)
NPPAC:371674441.6578 × e−5FASYN-ELONG-PWYfatty acid elongation—saturated
NPPAC:371674442.3272 × e−4PWY-5156superpathway of fatty acid biosynthesis II (plant)
NPPAC:371674441.1329 × e−4PWY-5971palmitate biosynthesis II (bacteria and plants)
NPPAC:371674442.7244 × e−5PWY-5973cis-vaccenate biosynthesis
NPPAC:371674441.1324 × e−4PWY-5989stearate biosynthesis II (bacteria and plants)
NPPAC:371674443.1750 × e−5PWY-6282palmitoleate biosynthesis I (from (5Z)-dodec-5-enoate)
NPPAC:371674443.2671 × e−5PWY-7388octanoyl-[acyl-carrier protein] synthesis (mitochondria,)
NPPAC:371674441.5583 × e−5PWY-7663gondoate biosynthesis (anaerobic)
NSPAC:371567160.0297 PWY-7219adenosine ribonucleotides de novo biosynthesis
NSPAC:371567160.0297 PWY-7229adenosine nucleotides de novo biosynthesis I
NSPAC:371653994.9600 × e−5FASYN-ELONG-PWYfatty acid elongation—saturated
NSPAC:371653996.9107 × e−4PWY-5156superpathway of fatty acid biosynthesis II (plant)
NSPAC:371653993.3746 × e−4PWY-5971palmitate biosynthesis II (bacteria and plants)
NSPAC:371653998.1448 × e−5PWY-5973cis-vaccenate biosynthesis
NSPAC:371653993.3732 × e−4PWY-5989stearate biosynthesis II (bacteria and plants)
NSPAC:371653999.4892 × e−5PWY-6282palmitoleate biosynthesis I (from (5Z)-dodec-5-enoate)
NSPAC:371653999.7640 × e−5PWY-7388octanoyl-[acyl-carrier protein] synthesis (mitochondria)
NSPAC:371653994.6627 × e−5PWY-7663gondoate biosynthesis (anaerobic)
NSPAC:371674444.9600 × e−5FASYN-ELONG-PWYfatty acid elongation—saturated
NSPAC:371674446.9107 × e−4PWY-5156superpathway of fatty acid biosynthesis II (plant)
NSPAC:371674443.3746 × e−4PWY-5971palmitate biosynthesis II (bacteria and plants)
NSPAC:371674448.1448 × e−5PWY-5973cis-vaccenate biosynthesis
NSPAC:371674443.3731 × e−4PWY-5989stearate biosynthesis II (bacteria and plants)
NSPAC:371674449.4892 × e−5PWY-6282palmitoleate biosynthesis I (from (5Z)-dodec-5-enoate)
NSPAC:371674449.7640 × e−5PWY-7388octanoyl-[acyl-carrier protein] synthesis (mitochondria)
NSPAC:371674444.6627 × e−5PWY-7663gondoate biosynthesis (anaerobic)
YLPPAC:371602700.0132 PWY1F-467phenylpropanoid biosynthesis, initial reactions
YLPPAC:371602700.0288 PWY-7186superpathway of scopolin and esculin biosynthesis
YLPPAC:371606850.0434PWY-5690TCA cycle II (plants and fungi)
YLPPAC:371606850.0432PWY-6549L-glutamine biosynthesis III
YLPPAC:371722390.0167 PWY-5466matairesinol biosynthesis
YLPPAC:371722390.0045 PWY-6824justicidin B biosynthesis
YLPPAC:371722390.0103PWY-7214baicalein degradation (hydrogen peroxide detoxification)
YLPPAC:371722390.0097 PWY-7445luteolin triglucuronide degradation
YLPPAC:371733720.0167 PWY-5466matairesinol biosynthesis
YLPPAC:371733720.0045 PWY-6824justicidin B biosynthesis
YLPPAC:371733720.0103PWY-7214baicalein degradation (hydrogen peroxide detoxification)
YLPPAC:371733720.0097 PWY-7445luteolin triglucuronide degradation
SBPAC:371651060.0151PWY-1121suberin monomers biosynthesis
SBPAC:371651060.0098 PWY-321cutin biosynthesis
SBPAC:371651060.0095PWY-5136fatty acid and beta oxidation II (peroxisome)
SBPAC:371651060.0049PWY-5143long-chain fatty acid activation
SBPAC:371651060.0086 PWY-5147oleate biosynthesis I (plants)
SBPAC:371651060.0153 PWY-5156superpathway of fatty acid biosynthesis II (plant)
SBPAC:371651060.0180PWY-561glyoxylate cycle and fatty acid degradation
SBPAC:371651060.0083 PWY-5885wax esters biosynthesis II
SBPAC:371651060.0106 PWY-5971palmitate biosynthesis II (bacteria and plants)
SBPAC:371651060.0106PWY-5989stearate biosynthesis II (bacteria and plants)
SBPAC:371651060.0111PWY66-389phytol degradation
SBPAC:371651060.0095PWY-6733sporopollenin precursors biosynthesis
SBPAC:371651060.0126 PWY-6803phosphatidylcholine acyl editing
VBPAC:371651060.0447 PWY-1121suberin monomers biosynthesis
VBPAC:371651060.0292 PWY-321cutin biosynthesis
VBPAC:371651060.0281PWY-5136fatty acid and beta oxidation II (peroxisome)
VBPAC:371651060.0145PWY-5143long-chain fatty acid activation
VBPAC:371651060.0255PWY-5147oleate biosynthesis I (plants)
VBPAC:371651060.0451 PWY-5156superpathway of fatty acid biosynthesis II (plant)
VBPAC:371651060.0247PWY-5885wax esters biosynthesis II
VBPAC:371651060.0316 PWY-5971palmitate biosynthesis II (bacteria and plants)
VBPAC:371651060.0316PWY-5989stearate biosynthesis II (bacteria and plants)
VBPAC:371651060.0330PWY66-389phytol degradation
VBPAC:371651060.0283 PWY-6733sporopollenin precursors biosynthesis
VBPAC:371651060.0374PWY-6803phosphatidylcholine acyl editing
Three enriched pathways were linked to the fatty acid and phospholipid metabolism for all the traits: palmitate biosynthesis II, stearate biosynthesis II, and superpathway of fatty acid biosynthesis II. The NP index captured the same eight metabolic pathways, which were cis-vaccenate biosynthesis, fatty acid elongation, gondoate biosynthesis (anaerobic), octanoyl-[acyl-carrier protein] biosynthesis, palmitate biosynthesis II, palmitoleate biosynthesis I, stearate biosynthesis II, and the fatty acid biosynthesis II. Interestingly, the NS index captured two additional pathways compared to the NP index: adenosine ribonucleotides de novo biosynthesis and adenosine nucleotides de novo biosynthesis I.
Meanwhile, the SB and VB indices captured the same twelve metabolic pathways: cutin biosynthesis, fatty acid & beta-oxidation II (peroxisome), long-chain fatty acid activation, oleate biosynthesis I, palmitate biosynthesis II, phosphatidylcholine acyl editing, phytol degradation, sporopollenin precursors biosynthesis, stearate biosynthesis II, suberin monomers biosynthesis, the superpathway of fatty acid biosynthesis II, and the wax esters biosynthesis II. The only metabolic pathway that the SB index captured over the VB index was the superpathway of glyoxylate cycle and fatty acid degradation. These high levels of overlap between NP and NS, and SB and VB, are indicative of moderate pleiotropy, at least at the pathway scale. Finally, the overall YLP index captured a total of eight pathways: baicalein degradation (hydrogen peroxide detoxification), justicidin B biosynthesis, L-glutamine biosynthesis III, luteolin triglucuronide degradation, matairesinol biosynthesis, phenylpropanoid biosynthesis, initial reactions, the superpathway of scopolin and esculin biosynthesis, and the TCA cycle II.

4. Discussion

The understanding of adaptive genetic variation to drought and high temperatures in the arid and semi-arid ecosystems of the Caribbean coast of northwest South America conveys great interest in the development of promising breeding lines to power food security in the region. However, multi-locality field trials of advanced interspecific panels have seldom been coupled with modern GWAS approaches to pinpoint target SNP markers for indirect selection schemes. This study tested for the first time the common × tepary bean inter-crosses for five yield components (NP, NS, YLP, SB, and VB) across four localities in the dry and wet Colombian Caribbean region. Furthermore, it utilized last-generation GWAS models (i.e., BLINK and FarmCPU) to capture complementary components of the genetic architecture of adaptation.
We found a total of 43 QTNs flanked by 90 genes related to the biological processes of the drought tolerance response in plants under humid and dry regions of the Caribbean region. Additionally, from the 90 genes, we captured several enrichment pathways for genes centered in the fatty acid biosynthesis, a relationship that has been associated with the abiotic stress response, such as drought and heat stress [66]. The loci captured in this work could be potential candidates to power downstream breeding pipelines using molecular marker-guided, genomic-enabled selection, and, eventually, gene editing.
The studied genotype panel comprises advanced interspecific multi-parental and backcrossed populations from a diverse founding population (common and tepary bean). Therefore, within-species natural recombination and the one induced after interspecific crossing both have diminished linkage disequilibrium (LD) and broken-down haplotype blocks without jeopardizing marker coverage [67], as shown by the overall LD profiles. Under this scenario, association mapping offers a more desirable framework than traditional QTL mapping. After all, the latter heavily relies on advancing bi-parental populations for sufficient generations as for recombination to narrow the LOD scores [68], which is not a guarantee of optimum mapping resolution, especially for autogamous species, such as the common and tepary beans.

4.1. Pervasive Environmentally Dependent Polygenic Adaptation Boosted by Hybrid Breeding

One of the main accomplishments of our study was to find that the genetic associations for yield in advanced interspecific lines of tepary × common beans simultaneously vary at many loci across localities in coastal Colombia. This trend speaks for environmentally dependent polygenic adaptation [69]. A heterotic component coupled with the polygenic nature is not unfeasible, despite the autogamous nature of the species, because adapted variants are expected to segregate at higher frequencies in the exotic tepary donor species than in the elite common bean genomic background [14]. Adapted alleles decoupled in their intra-specific fixation are likely to convey hybrid dominance, and over-dominance without implying a rescue from inbreeding depression [70]. Hybrid dominance corresponds to the sudden masking of maladapted alleles in the elite common bean genomic background due to the hybrids’ increased heterozygosity [71]. Instead, over-dominance refers to the additive heterosis as the result of novel allelic combinations that have thus far been maintained and separated by between-species balancing selection—i.e., tepary and common beans adapted to different agro-ecologies [72].
Polygenic, or even omnigenic [73], adaptation is also not rare because many standing genetic variants with modest effect sizes are expected to underlie early stages of selection favoring complex abiotic tolerance [35] in interspecific genomic backgrounds. Numerous examples have reported polygenic architectures as part of hybrid breeding schemes, as follows: phytochemical, morphological, and growth traits in hybrid Populus genotypes [74], biotic resistance in hybrid grapes [75], morphological and yield-related traits in hybrid oil palm [76], agronomic traits in hybrid cotton [77], the flowering time in Amaranthus [78], phenology-related traits in blueberries [79], and the grain yield and other yield-related traits in hybrid wheat under drought stress [80].
However, in legumes such as beans, there has been insufficient progress in terms of hybrid and introgression breeding approaches, partly due to the novelty of interspecific panels and the difficulty in isolating individual marker effects within a polygenic context, in which many loci with low effects overrule. Hence, we recommend modern GWAS algorithms [41] as a robust alternative to unlock historically elusive, adapted variations in advanced common bean × tepary bean targeting hot and dry regions in the Caribbean.
What is indeed striking is that beans’ genomic architecture of interspecific polygenic adaption is context-dependent as a function of the environments found in coastal Colombia. An environmentally dependent genetic basis implies that the populations tested across the localities exhibit contrasting realizations of polygenic adaptation [81] despite selection pressures that may otherwise be similar (i.e., concerted drought and heat events across most part of the Caribbean coast of northwest South America). This may indicate that narrow habitat-based adaptation is conferred by species-specific genetic variants, boosting habitat-dependent architectures in interspecific lines.
The fact that discordant, as opposed to conflicting genomic architectures were recovered across localities when using yield as an agronomical fitness proxy could also speak for a predominant role of adaptive conditional neutrality, as opposed to antagonistic pleiotropy [82]. In other words, the associated loci in some localities were absent in others (i.e., near-zero effects) instead of reappearing with a different directionality (i.e., opposing allelic effect). While the absence of allelic effects in some localities conveys evidence for conditional neutrality in a wide spectrum of plant species, antagonistic pleiotropy seldom appears in the literature of plant field trials [83]. After all, natural settings preclude uniform selective forces and erode statistical power [84]. Several eco-physiological mechanisms could account for the conditional neutrality trend. For example, tropical lowland beans may suffer higher mortality before harvest due to drought [8] and heat waves [27], natural intermediate variation may occur between the dry and wet Caribbean subregions, and microhabitat effects could be preponderant, like in terms of soil water retention ability. Therefore, phenotypic targets of selection may vary across localities [84], thereby neutralizing the effect sizes for adaptation in certain environments, as expected under a conditional neutrality paradigm (vs. antagonist pleiotropy scenarios that would penalize selection targets in one of the conditions).
The underlying causes of environmentally dependent genomic architectures are not necessarily limited to contrasting selection targets across the localities in coastal Colombia. Alternatively, a deleterious load in sub-optimal climates may also account for the habitat-dependent trend [85]. Such potential deleterious loads may as well be due to alleles exhibiting opposing negative effects in extreme conditions or to conditionally deleterious variants [86]. Future studies exploring the interspecific tepary × common bean lines in novel climates should aim at disentangling the basal mechanisms, mostly because the outcome of hybrid and introgression [32] breeding would depend on the ultimate causes of the environmentally dependent genomic basis of adaptation [87]. For instance, conditionally deleterious variants may limit introgression breeding in localities where negative selection is rampant, which would make it difficult to consistently select against those alleles in recurrent or congruity backcross schemes.
More advanced hybrid generations with narrower haplotype blocks from each species could favor purging genomic regions with deleterious effects [88], while retaining those that only contain positive-effect alleles derived from the exotic donor species, the tepary bean. In this way, backcrossing could disfavor regions with negative-effect variants [89] likely derived from the maladapted common bean elite genomic background [90]. Standing genetic variation with environmentally dependent effects may thus act as a bottleneck for introgression breeding unless intraspecific linkage disequilibrium is sufficiently broken in advanced generation backcrosses [91]. An expanded repertoire of bridge genotypes beyond the VAP lines [36] could assist in this endeavor.
Finally, the correlated traits did not exhibit shared genetic architecture in terms of QTNs, although partially for commonly enriched pathways. A reason for this may be that the drivers of pleiotropy comprise other genes within the responsible metabolic pathways, which were not necessarily captured by our genetic mapping effort due to a lack of polymorphism within and nearby the candidate genes for pleiotropy, as well as to weak hitchhiking marker–gene linkage disequilibrium in those regions. Alternatively, trait variance similarity may be environmentally reinforced, as compared to having a common ubiquitous underlying genetic basis.

4.2. Morphological, Physiological, and Metabolic Mechanisms of Adaptation to Drought & Heat

The response mechanisms of plants to drought stress has been extensively studied on morphological and physiological targets of selection [92]. Under drought stress, plants’ internal structures and physical properties continuously change and adapt. This is consistent with the fact that we detected an enrichment of the suberin monomers biosynthesis pathway for vegetative traits (SB and VB). Specifically, the lipid cuticle membrane, which can reduce the loss of water to the atmosphere, acts as a barrier for plant water evaporation. The cuticle is composed of several biomolecules, such as cutin and soluble waxes. Altered cutin and suberin confers increased sensitivity to abiotic stresses, regulates development and growth, and alters morphology, permeability and seed dormancy [93]. We also captured an enrichment of the wax esters biosynthesis II pathway, not unexpected because leaves improve drought resistance through increasing wax coverage, cuticle thickness, and osmiophilicity [94,95]. Additionally, we found that the SNP markers S04_3848215, S04_3848227, and S04_3848215 were associated with the gene Phvul.004G031900, a transcription factor (wax inducer1/shine1) of the ethylene response factor (ERF) family, which has recently been shown to induce the production of epidermal waxes when overexpressed in Arabidopsis [96] and Brassica napus [97], as well as drought tolerance in common bean via Dreb2 genes [98]. The observation that chitinase genes are involved in both leaf development and senescence [99] may point to a specific gene in this cluster as a strong candidate for the whole plant response under heat stress.
We were also able to acknowledge other key metabolic pathways associated with drought and high temperature adaptation in the Caribbean coast of Colombia. The drought and high temperature stress is known to affect a wide spectrum of physiological and biochemical characteristics, as well, such as the photosynthetic capacity, drought-induced proteins, and reactive oxygen metabolism [92].
Photosynthesis is one of the main processes affected by water stress. In this regard, we found, across all the research stations, associated genes related to the photosynthesis metabolism, such as the plastocyanin-like domain (Phvul.007G055000) in Turipaná; and the LHCA3 gene (Phvul.008G289700), chloroplast stem–loop binding protein (Phvul.007G172100), and chloroplastic mate efflux family protein 3 (Phvul.008G291400) in the drier Motilonia and Carmen de Bolivar localities. Additionally, we observed pathway enrichment for phytol degradation genes. These drought-induced proteins play a protective role in plant adaptation to stress and can improve plant drought tolerance. They are divided into functional and regulatory proteins. We found a relevant functional protective protein named late embryogenesis abundant (LEA) [100] (Phvul.011G001700) only in the Motilonia station, hitchhiking with the SNP marker S11_140976. Up-regulation of some LEA have been reported in other legume species, such as Vigna spp. [101]. Similarly, we detected the regulatory protein MYB in the field trials at the humid localities of Turipaná (Phvul.008G205000) and Caribia (Phvul.002G088900), particularly a transcription factor in the enriched biosynthesis of phenylpropanoids pathway [92,102]. Concerning the reactive oxygen metabolism, we found at Turipaná a peroxidase protein (Phvul.006G130000) related to the removal of H2O2 [103] within the enriched baicalein degradation (hydrogen peroxide detoxification) pathway.
Facing drought and high temperature adaptation, plants also implement a wide spectrum of signal transduction mechanisms [66]. Specifically, we found the ERF regulatory gene (Phvul.005G180700) in the Motilonia trial. ERFs play an important role in plant stress resistance, as reported in previous studies [96,104], even for the common bean [98]. They regulate the biosynthesis of plant hormones, such as jasmonic acid and ethylene [92]. These hormones also participate in the signaling processes to other types of stresses considered to be of major importance under climate change, such as biotic stresses [105].
Last but not least, fatty acid and phospholipid metabolism are other well-known response mechanisms to drought and high temperature stresses. For decades, the alteration in fatty acid and phospholipid metabolism have reappeared under drought stress trials in legumes [106]. A recent report validated the regulation of fatty acid and phospholipid metabolism in tomato fruit under drought stress using transcriptomic and metabolomic analyses [66]. These authors reported that fatty acid and phospholipid metabolism are key components in several metabolic pathways of drought tolerance, such as the biosynthesis of cell walls, ethylene, and jasmonate [107]. We found several enriched pathways at the humid Turipaná and Caribia localities that matched those obtained by Asakura et al. [66], specifically the superpathway of fatty acid biosynthesis II, palmitate biosynthesis II, and stearate biosynthesis II (captured simultaneously by the yield traits indices NP, NS, YLP, SB, and VB). These pathway networks could be useful bioindicators across advanced recombinant tepary × common beans interspecific lines.
Our results confirm the utility of some of the associated markers and genes to further investigate and select for the genetic factors controlling important agronomic traits under the conditions of the Colombian Caribbean coast. These QTNs datasets will also allow researchers to determine whether yield traits are controlled by genetic factors shared by both species genepools—i.e., convergent adaptation [108], or whether species- and genepool-specific factors are regulating those traits [59].

4.3. Perspectives and Recommendations for Future Studies

Although the number of genotypes may seem low at first glance, they correspond to advanced interspecific hybrids between common and tepary beans, two species that do not easily recombine in nature. Therefore, having 87 interspecific genotypes is already a major achievement because they managed to overcome a traditionally difficult interspecific barrier to break. Future studies should aim at gathering additional interspecific genotypes via modern techniques, such as embryo rescue and the identification of additional bridge genotypes (beyond VAP lines [36]). To compensate for the moderate sample size, we did not utilize conventional MLM-based GWAS modeling, but better calibrated approaches, such as FarmCPU and BLINK [53].
Nonetheless, the trait variation shows substantial variance across the modest panel, partly due to the interspecific nature of the genotypes and the fact that the parental populations are widely contrasting. That is, the founder population could be understood as a bulk segregant design more than a homogeneous panel, boosting the power of the current sampling. In order to make sense of this variation, the BLUP scores confirmed that mean–variance index works well as a first proxy to rank genotypes across traits at each locality. We are planning to extend these inferences into a predictive framework to assist the computation of alternative indirect selection indices, that is genomic-estimated breeding values (GEBVs) as an alternative to mean–variance and BLUP scores.
At a more detailed resolution, the number of pods (NP) and average number of seeds per pod (NS) in the Carmen de Bolivar locality did not exhibit a much-expected correlation, as was the case in the other three locations. This trend is likely a consequence of incomplete pod filling, leading to many pods with few seeds. Such a pattern could be expected under very particular abiotic stressors, perhaps only limited to the Carmen de Bolivar locality during the evaluation period. We will examine this tradeoff as part of future trials in order to be more conclusive in that regard.
Another latent caveat of modern genetic mapping is inflation of the false positive rate due to complex demography. The common bean is not the exception because it is characterized by a complex dual genepool and racial substructure [83], which extends to the interspecific hybrids with the tepary bean. This is why we have incorporated 12 demographic clusters as covariates. In this way, we can guarantee, judging by the QQ-plot diagrams (Figure 3, Figure 4, Figure 5, Figure 6 and Figure 7), sufficient contention of spurious demographic associations (i.e., type I error). This may convey a reduction in the statistical power of the overall analysis (i.e., type II error), yet our pipeline still manages to find significantly associated QTNs.
Finally, the associated loci require further validation for QTNs to be considered within marker-assisted and genomic selection applications, which could effectively unlock and utilize the bean’s neo-tropical lowland adaptation. Therefore, future studies should aim at filling this gap by embracing the ad hoc hypotheses of marker-enabled prediction. Furthermore, we recommend testing genomic-enabled selection in irrigated vs. non-irrigated controlled field treatments. In doing so, we may buffer introduced variability from running phenotypic screenings across different locations with contrasting weather patterns and levels of precipitation. Therefore, we envision extending the field trials throughout treatments and time, while broadening traits, recalibrating genetic mapping, and recruiting local expertise from plant breeders and physiologists.

5. Conclusions

We detected that the genetic basis of adaptation differs across the studied Caribbean localities. For example, in dry subregions, the preponderant response mechanisms to drought stress were signal transduction, photosynthesis, and drought-induced proteins. On the other hand, in the humid subregion, morphological and physiological responses, photosynthetic capacity, drought-induced proteins, reactive oxygen metabolism, and fatty acid and phospholipid metabolism mostly shaped the genetic basis of adaptation. The only common response across all the studied locations was linked with the photosynthetic pathway, yet it involved different associated genes. These trends allowed us to conclude environmentally dependent polygenic adaptation.
Continuing to leverage common bean introgression breeding in the Caribbean coast of Colombia requires coupling advanced panels of recombinant interspecific ancestries with modern GWAS approaches in order to unlock and harness the habitat-dependent polygenic adaptive genetic variation to drought and high temperatures. The use of enrichment pathway analysis will further help scrutinizing wide interspecific panels for associated QTNs, and thereby indirectly select for positive effects or against deleterious load, both from the tepary exotic genepool and the elite common bean background. Anyhow, this study demonstrates that coupling advanced panels of interspecific genotypes with modern GWAS models under multi-locality setups enables retrieving the polygenic genetic basis of adaptation to complex abiotic stresses, despite environmental dependency. Further studies across new interspecific ancestries subjected to different climates will benefit by using GWAS models within a well-thought multi-environment design in order to capture novel sources of genetic adaptation. We are looking forward to seeing more studies that follow these recommendations within the oncoming years.
Meanwhile, the genes identified in this study as candidates for drought tolerance have the potential to be used in plant breeding programs after validation by means of strategies such as gene expression studies and whole genome re-sequencing (WGS) [109]. With these methods, the validated candidate genes could be integrated into molecular editing strategies, such as CRISPR/Cas9 [110,111,112] and genomic selection [113].
As part of a larger project, the promissory accessions identified in this work will be integrated in the oncoming stages of the KoLFACI (Korea–Latin America Food & Agriculture Cooperation Initiative) breeding initiative for food security on the Colombian Caribbean coast. Specifically, the associated SNPs will source genomic hybrid prediction modeling via machine learning approaches to better merge genomic-informed pre-breeding genotype selection with seed uniformity testing in downstream steps [114].

Supplementary Materials

The following supporting information can be downloaded at: https://www.mdpi.com/article/10.3390/agronomy13051396/s1, Figure S1: Global daily (30 arcsec, ≈1 km) land surface precipitation based on cloud cover-informed downscaling (Karger et al. 2021), and time series of daily precipitation (kg/(m2 day)) extracted for the months from cultivation to harvest in the historical data from 2003 to 2016. Localities are sorted as follows: (A) Motilonia, (B) Caribia, (C) Carmen de Bolivar, and (D) Turipaná; Figure S2: Phenotypic variation for number of pods per plant, as depicted with boxplots through genotypes across the four locations of the Colombian Caribbean coast: (A) Turipaná, (B) Motilonia, (C) Carmen de Bolívar, and (D) Caribia; Figure S3: Phenotypic variation for number of seeds per pod, as depicted with boxplots through genotypes across the four locations of the Colombian Caribbean coast: (A) Turipaná, (B) Motilonia, (C) Carmen de Bolívar, and (D) Caribia; Figure S4: Phenotypic variation for yield per plant (g/plant), as depicted with boxplots through genotypes across the four locations of the Colombian Caribbean coast: (A) Turipaná, (B) Motilonia, (C) Carmen de Bolívar, and (D) Caribia; Figure S5: Phenotypic variation for 100-seed weight (g), as depicted with boxplots through the four genotypes across locations of the Colombian Caribbean coast: (A) Turipaná, (B) Motilonia, (C) Carmen de Bolívar, and (D) Caribia; Figure S6: Phenotypic variation for vegetative biomass (g), as depicted with boxplots through the genotypes across four locations of the Colombian Caribbean coast: (A) Turipaná, (B) Motilonia, (C) Carmen de Bolívar, and (D) Caribia; Figure S7: Heat map of kinship matrix estimated with the VanRaden algorithm [41] across the 15,645 SNP markers; Figure S8: Unsupervised population stratification inference (K3) with genotypes grouped in clusters matching families’ genealogies pulled in Table S1; Figure S9: Venn diagram of associated SNPs between localities (A); Venn diagram of genes between localities (B); Figure S10: Linkage disequilibrium (LD) decay in each chromosome by means of the Tassel software using a window size of 10, the black line is the mean LD in each chromosome; Table S1: Genealogy of 87 genotypes composed of 67 interspecific lines between the common bean (P. vulgaris) and tepary bean (P. acutifolius), and 19 advanced genotypes bred to high temperature and drought conditions by the bean program of the Alliance Bioversity–CIAT. The genotype G40001 (P. acutifolius) was used as a control. The panel of genotypes was evaluated for the first time at four localities in the humid and dry Colombian Caribbean subregions (Burbano-Erazo et al. 2021); Table S2: Research stations’ environmental and soil fertility scores in coastal Colombia; Table S3: Shapiro–Wilk test to corroborate the normality of the five trait indices across all four localities using the R-package nortest (Gross & Ligges, 2015); Table S4: DNA quality extraction for all 87 lines reported in Table S1; Table S5: Genetic library indices and statistics built for the 87 lines reported in Table S1; Table S6: Summary results of the multi-environment GWAS of yield trait indices in advanced common bean (Phaseolus vulgaris l.) × tepary bean (P. acutifolius A. Gray) interspecific lines in the humid and dry Colombian Caribbean subregions; Table S7: Best linear unbiased predictors (BLUPs) in all traits across the all environments using the function lmer in the R-package lmerTest; Table S8: Parametric regression by Pearson approach adjusted by Bonferroni method between the best linear unbiased predictors and mean-variance index for all traits across all environments using the function grouped_ggcorrmat in the R-package ggstatsplot.

Author Contributions

Conceptualization: F.L.-H., E.B.-E., R.I.L.-P., C.C.C.-C., D.F.V.-M., A.P.T.-R. and A.J.C. Methodology: F.L.-H., E.B.-E., R.I.L.-P., C.C.C.-C., A.P.T.-R. and A.J.C. designed sampling and experiments. Data Collection: R.I.L.-P. and C.C.C.-C. Data Curation: F.L.-H. Bioinformatic and Statistic Scripts: F.L.-H. Visualization: F.L.-H. Supervision: A.P.T.-R., D.F.V.-M. and A.J.C. Writing: F.L.-H. and A.J.C. wrote the manuscript with contributions from D.F.V.-M. and editions made by E.B.-E., R.I.L.-P., C.C.C.-C. and A.P.T.-R. All authors have read and agreed to the published version of the manuscript.

Funding

The Korea–Latin America Food and Agriculture Cooperation Initiative (KoLFACI) funded this research in alliance with the Colombian Agricultural Research Corporation (AGROSAVIA) through project number 1001513, entitled “Obtaining commercial and peasant market varieties of drought tolerant beans under sustainable production systems in the Colombian Caribbean”, awarded to A.P.T.-R. as national principal investigator (PI). A.J.C. further recognizes support from the British Council’s Newton Fund (527023146) and Vetenskapsraådet (2022-04411). The EAFIT editorial fund, throughout the arrangement made by D.F.V.-M., is deeply thanked for financing the corresponding article processing charge (APC).

Data Availability Statement

SNP calling pipeline is available in GitHub (https://github.com/FelipeLopez2019/SNP-calling-of-KOLFACI-project/blob/main/Kolfaci_Colombia_v4.sh, accessed on 15 May 2023). Please direct any further enquiry concerning genetic data processing to the corresponding authors.

Acknowledgments

The authors express their gratitude to the Korea–Latin America Food and Agriculture Cooperation Initiative (KoLFACI) for funding; the Alliance Bioversity–CIAT (International Center for Tropical Agriculture) for providing advanced interspecific backcross lines between common (P. vulgaris) and tepary (P. acutifolius) beans; the Colombian Agricultural Research Corporation (AGROSAVIA) for technical assistance; and Ministerio de Agricultura y Desarrollo Rural de Colombia (MADR) for administrative support. The authors also wish to thank S. Beebe and V. Mayor for providing seed material and its genealogies. F.L.-H. appreciates discussions on abiotic stress tolerance and pioneer work with interspecific crossing schemes in the common bean with M.W. Blair, which took place during the summer of 2019 in Rionegro (Antioquia, Colombia), thanks to the funding provided by the Fulbright’s U.S. Specialist Program. F.L.-H. also thanks the Department for Research Capacity Building in AGROSAVIA for financing his internship in 2018, which enabled exploring G × E models for heat stress in the common bean. The authors also benefited from discussions on the physiology of abiotic stress tolerance in the common bean with M.O. Urban, J.S. Aparicio, S. Cruz, S. Diaz, J. Ricaurte, J. Soto, M. Guzmán, T.M. Rondón, and D. Peláez during 19–21 April 2022 in Palmira (Valle del Cauca, Colombia), thanks in part to funds from the British Council throughout the 2019 Newton Fund Institutional Links binational Bioeconomy grant ID 527023146 awarded to A.J.C. and J.J. De Vega. The same fund also enabled F.L.-H. to train in bioinformatics and networking during the late summer of 2022 at the Earlham Institute in Norwich, UK. We additionally thank S. Barrera for enlightening us on the crossing schemes, and providing knowledge of the interspecific genotypes’ ancestry. F.L.-H. and AJ.C. further acknowledge J. Berdugo, J.J. de Vega, K. Denning-James, and the 2021 CABANA (capacity building for bioinformatics in Latin America) workshop for providing and discussing innovative bioinformatic and statistical pipelines. Finally, F.L.-H. and AJ.C. appreciate C. Galeano, C. Chavarro, and J. Correa for their substantial feedback and insightful perspectives during a review of these results in early 2023 at Universidad EAFIT (Medellín, Colombia), as part of F.L.-H.’s MSc thesis defense (co-advised by A.J.C. and D.F.V.-M.).

Conflicts of Interest

The authors declare no conflict of interest. The funders had no role in the design of the study, in the collection, analyses, or interpretation of data, in the writing of the manuscript, or in the decision to publish the results.

References

  1. Davis, K.F.; Gephart, J.A.; Emery, K.A.; Leach, A.M.; Galloway, J.N.; D’Odorico, P. Meeting Future Food Demand with Current Agricultural Resources. Glob. Environ. Chang. 2016, 39, 125–132. [Google Scholar] [CrossRef]
  2. Cortés, A.J.; López-Hernández, F. Harnessing Crop Wild Diversity for Climate Change Adaptation. Genes 2021, 12, 783. [Google Scholar] [CrossRef] [PubMed]
  3. Lascoux, M.; Glémin, S.; Savolainen, O. Local Adaptation in Plants. eLS 2016, 0025270, 1–7. [Google Scholar] [CrossRef]
  4. Burgarella, C.; Barnaud, A.; Kane, N.A.; Jankowski, F.; Scarcelli, N.; Billot, C.; Vigouroux, Y.; Berthouly-Salazar, C. Adaptive Introgression: An Untapped Evolutionary Mechanism for Crop Adaptation. Front. Plant Sci. 2019, 10, 4. [Google Scholar] [CrossRef]
  5. Tai, A.P.K.; Martin, M.V.; Heald, C.L. Threat to Future Global Food Security from Climate Change and Ozone Air Pollution. Nat. Clim. Chang. 2014, 4, 817–821. [Google Scholar] [CrossRef]
  6. FAO. Panorama de La Seguridad Alimentaria y Nutricional; FAO: Rome, Italy, 2020. [Google Scholar]
  7. Sgarbieri, V.C.; Whitaker, J.R. Physical, Chemical, and Nutritional Properties of Common Bean (Phaseolus) Proteins. Adv. Food Res. 1982, 28, 93–166. [Google Scholar] [CrossRef]
  8. Cortés, A.J.; Monserrate, F.A.; Ramírez-Villegas, J.; Madriñán, S.; Blair, M.W. Drought Tolerance in Wild Plant Populations: The Case of Common Beans (Phaseolus vulgaris L.). PLoS ONE 2013, 8, e62898. [Google Scholar] [CrossRef]
  9. Tofiño Rivera, A.; Ospina Cortés, D.A.; Rozo Leguizamón, Y. Compatibility of Ancestral and Innovative Agricultural Practices in the Kankuamo People of Colombia. Ambient. Soc. 2021, 24, 1–24. [Google Scholar] [CrossRef]
  10. Shukla, P.R.; Skea, J.; Buendia, E.C.; Masson-Delmotte, V.; Pörtner, H.-O.; Roberts, D.C.; Zhai, P.; Slade, R.; Connors, S.; van Diemen, R.; et al. Climate Change and Land: An IPCC Special Report; IPPC: Geneva, Switzerland, 2019; pp. 1–864. [Google Scholar]
  11. Teichmann, C.; Eggert, B.; Elizalde, A.; Haensler, A.; Jacob, D.; Kumar, P.; Moseley, C.; Pfeifer, S.; Rechid, D.; Remedio, A.R.; et al. How Does a Regional Climate Model Modify the Projected Climate Change Signal of the Driving GCM: A Study over Different CORDEX Regions Using REMO. Atmosphere 2013, 4, 214–236. [Google Scholar] [CrossRef]
  12. Molina, O.D.; Bernhofer, C. Projected Climate Changes in Four Different Regions in Colombia. Environ. Syst. Res. 2019, 8, 33. [Google Scholar] [CrossRef]
  13. Beebe, S.E.; Rao, I.M.; Blair, M.W.; Acosta-Gallegos, J.A. Phenotyping Common Beans for Adaptation to Drought. Front. Physiol. 2013, 4, 35. [Google Scholar] [CrossRef] [PubMed]
  14. Buitrago-Bitar, M.A.; Cortés, A.J.; López-Hernández, F.; Londoño-Caicedo, J.M.; Muñoz-Florez, J.E.; Carmenza Muñoz, L.; Blair, M.W. Allelic Diversity at Abiotic Stress Responsive Genes in Relationship to Ecological Drought Indices for Cultivated Tepary Bean, Phaseolus Acutifolius a. Gray, and Its Wild Relatives. Genes 2021, 12, 556. [Google Scholar] [CrossRef] [PubMed]
  15. Mhlaba, Z.B.; Mashilo, J.; Shimelis, H.; Assefa, A.B.; Modi, A.T. Progress in Genetic Analysis and Breeding of Tepary Bean (Phaseolus acutifolius A. Gray): A Review. Sci. Hortic. 2018, 237, 112–119. [Google Scholar] [CrossRef]
  16. Jiri, O.; Mafongoya, P.L.; Chivenge, P. Climate Smart Crops for Food and Nutritional Security for Semi-Arid Zones of Zimbabwe. Afr. J. Food Agric. Nutr. Dev. 2017, 17, 12280–12294. [Google Scholar] [CrossRef]
  17. Moghaddam, S.M.; Oladzad, A.; Koh, C.; Ramsay, L.; Hart, J.P.; Mamidi, S.; Hoopes, G.; Sreedasyam, A.; Wiersma, A.; Zhao, D.; et al. The Tepary Bean Genome Provides Insight into Evolution and Domestication under Heat Stress. Nat. Commun. 2021, 12, 2638. [Google Scholar] [CrossRef]
  18. Mwale, S.E.; Shimelis, H.; Mafongoya, P.; Mashilo, J. Breeding Tepary Bean (Phaseolus acutifolius) for Drought Adaptation: A Review. Plant Breed. 2020, 139, 821–833. [Google Scholar] [CrossRef]
  19. Muñoz, L.C.; Duque, M.C.; Debouck, D.G.; Blair, M.W. Taxonomy of Tepary Bean and Wild Relatives as Determined by Amplified Fragment Length Polymorphism (AFLP) Markers. Crop Sci. 2006, 46, 1744–1754. [Google Scholar] [CrossRef]
  20. Migicovsky, Z.; Myles, S. Exploiting Wild Relatives for Genomics-Assisted Breeding of Perennial Crops. Front. Plant Sci. 2017, 8, 460. [Google Scholar] [CrossRef]
  21. Burbano-Erazo, E.; León-Pacheco, R.I.; Cordero-Cordero, C.C.; López-Hernández, F.; Cortés, A.J.; Tofiño-Rivera, A.P. Multi-Environment Yield Components in Advanced Common Bean (Phaseolus vulgaris L.) × Tepary Bean (p. Acutifolius A. Gray) Interspecific Lines for Heat and Drought Tolerance. Agronomy 2021, 11, 1978. [Google Scholar] [CrossRef]
  22. Souter, J.R.; Gurusamy, V.; Porch, T.G.; Bett, K.E. Successful Introgression of Abiotic Stress Tolerance from Wild Tepary Bean to Common Bean. Crop Sci. 2017, 57, 1160–1171. [Google Scholar] [CrossRef]
  23. Belivanis, T.; Doré, C. Doré Lnterspecific Hybridization of Phaseolus vulgaris L. and Phaseolus angustissimus A. Gray Using in Vitro Embryo Culture. Plant Cell Rep. 1986, 5, 329–331. [Google Scholar] [CrossRef] [PubMed]
  24. Cortés, A.J.; Blair, M.W. Genotyping by Sequencing and Genome–Environment Associations in Wild Common Bean Predict Widespread Divergent Adaptation to Drought. Front. Plant Sci. 2018, 9, 128. [Google Scholar] [CrossRef] [PubMed]
  25. Frank, A.; Oddou-Muratorio, S.; Lalagüe, H.; Pluess, A.R.; Heiri, C.; Vendramin, G.G. Genome-Environment Association Study Suggests Local Adaptation to Climate at the Regional Scale in Fagus Sylvatica. New Phytol. 2016, 210, 589–601. [Google Scholar] [CrossRef]
  26. Cortés, A.J.; López-Hernández, F.; Blair, M.W. Genome–Environment Associations, an Innovative Tool for Studying Heritable Evolutionary Adaptation in Orphan Crops and Wild Relatives. Front. Genet. 2022, 13, 1562. [Google Scholar] [CrossRef] [PubMed]
  27. López-Hernández, F.; Cortés, A.J. Last-Generation Genome–Environment Associations Reveal the Genetic Basis of Heat Tolerance in Common Bean (Phaseolus vulgaris L.). Front. Genet. 2019, 10, 954. [Google Scholar] [CrossRef]
  28. Ambachew, D.; Blair, M.W. Genome Wide Association Mapping of Root Traits in the Andean Genepool of Common Bean (Phaseolus vulgaris L.) Grown With and Without Aluminum Toxicity. Front. Plant Sci. 2021, 12, 628687. [Google Scholar] [CrossRef]
  29. Diaz, S.; Ariza-Suarez, D.; Izquierdo, P.; Lobaton, J.D.; de la Hoz, J.F.; Acevedo, F.; Duitama, J.; Guerrero, A.F.; Cajiao, C.; Mayor, V.; et al. Genetic Mapping for Agronomic Traits in a MAGIC Population of Common Bean (Phaseolus vulgaris L.). BMC Genom. 2020, 21, 799. [Google Scholar] [CrossRef]
  30. Wu, X.; Islam, A.S.M.F.; Limpot, N.; Mackasmiel, L.; Mierzwa, J.; Cortés, A.J.; Blair, M.W. Genome-Wide SNP Identification and Association Mapping for Seed Mineral Concentration in Mung Bean (Vigna radiata L.). Front. Genet. 2020, 11, 656. [Google Scholar] [CrossRef]
  31. Scott, M.F.; Ladejobi, O.; Amer, S.; Bentley, A.R.; Biernaskie, J.; Boden, S.A.; Clark, M.; Dell’Acqua, M.; Dixon, L.E.; Filippi, C.V.; et al. Multi-Parent Populations in Crops: A Toolbox Integrating Genomics and Genetic Mapping with Breeding. Heredity 2020, 125, 396–416. [Google Scholar] [CrossRef]
  32. McCouch, S. Diversifying Selection in Plant Breeding. PLoS Biol. 2004, 2, e347. [Google Scholar] [CrossRef]
  33. Manolio, T.A.; Collins, F.S.; Cox, N.J.; Goldstein, D.B.; Hindorff, L.A.; Hunter, D.J.; McCarthy, M.I.; Ramos, E.M.; Cardon, L.R.; Chakravarti, A.; et al. Finding the Missing Heritability of Complex Diseases. Nature 2009, 461, 747–753. [Google Scholar] [CrossRef] [PubMed]
  34. Maher, B. The Case of the Missing Heritability. Nature 2022, 456, 18. [Google Scholar] [CrossRef] [PubMed]
  35. Barghi, N.; Hermisson, J.; Schlötterer, C. Polygenic Adaptation: A Unifying Framework to Understand Positive Selection. Nat. Rev. Genet. 2020, 21, 769–781. [Google Scholar] [CrossRef]
  36. Cruz, S.; Lobatón, J.; Milan, U.O.; Ariza-Suárez, D.; Raatz, B.; Aparicio, J.; Gloria, M.; Beebe, S. Interspecific Common Bean Population Derived from Phaseolus acutifolius Using a Bridging Genotype Demonstrate Useful Adaptation to Heat Tolerance. Front. Plant Sci. 2023, 14, 1145858. [Google Scholar] [CrossRef]
  37. Karger, D.N.; Wilson, A.M.; Mahony, C.; Zimmermann, N.E.; Jetz, W. Global Daily 1 Km Land Surface Precipitation Based on Cloud Cover-Informed Downscaling. Sci. Data 2021, 8, 307. [Google Scholar] [CrossRef]
  38. Blair, M.W.; Soler, A.; Cortés, A.J. Diversification and Population Structure in Common Beans (Phaseolus vulgaris L.). PLoS ONE 2012, 7, e49488. [Google Scholar] [CrossRef] [PubMed]
  39. Tukey, J.W. Exploratory Data Analysis; Mosteller, F., Ed.; Addison-Wesley Publishing Company: Boston, MA, USA, 1977; Volume 33, ISBN 0-201-07616-0. [Google Scholar]
  40. Mangiafico, S.S.; Package ‘Rcompanion’: Functions to Support Extension Education Program Evaluation. Rutgers Cooperative Extension, New Brunswick, New Jersey. Version 2.4.30. Available online: https://CRAN.R-project.org/package=rcompanion/ (accessed on 15 May 2023).
  41. Wang, J.; Zhang, Z. GAPIT Version 3: Boosting Power and Accuracy for Genomic Association and Prediction. Genom. Proteom. Bioinform. 2021, 19, 629–640. [Google Scholar] [CrossRef]
  42. Goh, L.; Yap, V.B. Effects of Normalization on Quantitative Traits in Association Test. BMC Bioinform. 2009, 10, 415. [Google Scholar] [CrossRef]
  43. Gross, J.; Ligges, U. Package ‘Nortest’. Available online: https://cran.r-project.org/web/packages/nortest/index.html (accessed on 15 May 2023).
  44. Patil, I. Visualizations with Statistical Details: The “ggstatsplot” Approach. J. Open Source Softw. 2021, 6, 3167. [Google Scholar] [CrossRef]
  45. Elshire, R.J.; Glaubitz, J.C.; Sun, Q.; Poland, J.A.; Kawamoto, K.; Buckler, E.S.; Mitchell, S.E. A Robust, Simple Genotyping-by-Sequencing (GBS) Approach for High Diversity Species. PLoS ONE 2011, 6, e19379. [Google Scholar] [CrossRef]
  46. Andrews, S. FastQC: A Quality Control Tool for High Throughput Sequence Data. Available online: http://www.bioinformatics.babraham.ac.uk/projects/fastqc (accessed on 15 May 2023).
  47. Bolger, A.M.; Lohse, M.; Usadel, B. Trimmomatic: A Flexible Trimmer for Illumina Sequence Data. Bioinformatics 2014, 30, 2114–2120. [Google Scholar] [CrossRef]
  48. McKenna, A.; Hanna, M.; Banks, E.; Sivachenko, A.; Cibulskis, K.; Kernytsky, A.; Garimella, K.; Altshuler, D.; Gabriel, S.; Daly, M.; et al. The Genome Analysis Toolkit: A MapReduce Framework for Analyzing next-Generation DNA Sequencing Data. Genome Res. 2010, 20, 1297–1303. [Google Scholar] [CrossRef]
  49. Li, H. Aligning Sequence Reads, Clone Sequences and Assembly Contigs with BWA-MEM. arXiv 2013, arXiv:1303.3997. [Google Scholar]
  50. Li, H.; Handsaker, B.; Wysoker, A.; Fennell, T.; Ruan, J.; Homer, N.; Marth, G.; Abecasis, G.; Durbin, R. The Sequence Alignment/Map Format and SAMtools. Bioinformatics 2009, 25, 2078–2079. [Google Scholar] [CrossRef]
  51. Afgan, E.; Baker, D.; Batut, B.; Van Den Beek, M.; Bouvier, D.; Ech, M.; Chilton, J.; Clements, D.; Coraor, N.; Grüning, B.A.; et al. The Galaxy Platform for Accessible, Reproducible and Collaborative Biomedical Analyses: 2018 Update. Nucleic Acids Res. 2018, 46, W537–W544. [Google Scholar] [CrossRef]
  52. Bradbury, P.J.; Zhang, Z.; Kroon, D.E.; Casstevens, T.M.; Ramdoss, Y.; Buckler, E.S. TASSEL: Software for Association Mapping of Complex Traits in Diverse Samples. Bioinformatics 2007, 23, 2633–2635. [Google Scholar] [CrossRef]
  53. Sekula, M.; Datta, S.; Datta, S. OptCluster: An R Package for Determining the Optimal Clustering Algorithm. Bioinformation 2017, 13, 101–103. [Google Scholar] [CrossRef]
  54. Frichot, E.; François, O. LEA: An R Package for Landscape and Ecological Association Studies. Methods Ecol. Evol. 2015, 6, 925–929. [Google Scholar] [CrossRef]
  55. Zhang, Z.; Liu, X.; Zhou, Y.; Summers, R.M. BLINK: A Package for the next Level of Genome-Wide Association Studies with Both Individuals and Markers Meng Huang. Gigascience 2018, 8, giy154. [Google Scholar] [CrossRef]
  56. Liu, X.; Huang, M.; Fan, B.; Buckler, E.S.; Zhang, Z. Iterative Usage of Fixed and Random Effect Models for Powerful and Efficient Genome-Wide Association Studies. PLoS Genet. 2016, 12, e1005767. [Google Scholar] [CrossRef]
  57. Joo, J.W.J.; Hormozdiari, F.; Han, B.; Eskin, E. Multiple Testing Correction in Linear Mixed Models. Genome Biol. 2016, 17, 29–33. [Google Scholar] [CrossRef]
  58. Pasam, R.K.; Sharma, R.; Malosetti, M.; van Eeuwijk, F.A.; Haseneyer, G.; Kilian, B.; Graner, A. Genome-Wide Association Studies for Agronomical Traits in a World Wide Spring Barley Collection. BMC Plant Biol. 2012, 12, 16. [Google Scholar] [CrossRef]
  59. Oladzad, A.; Porch, T.; Rosas, J.C.; Ma, S.; Beaver, J.; Beebe, S.E.; Burridge, J.; Jochua, C.N.; Miguel, M.A.; Miklas, P.N.; et al. Single and Multi-Trait GWAS Identify Genetic Factors Associated with Production Traits in Common Bean Under Abiotic Stress Environments. G3 Genes Genomes Genet. 2019, 9, 1881–1892. [Google Scholar]
  60. Hao, Z.; Lv, D.; Ge, Y.; Shi, J.; Weijers, D.; Yu, G.; Chen, J. RIdeogram: Drawing SVG Graphics to Visualize and Map Genome-Wide Data on the Idiograms. PeerJ. Comput. Sci. 2020, 6, e251. [Google Scholar] [CrossRef]
  61. Slate, J.; Gratten, J.; Beraldi, D.; Stapley, J.; Hale, M.; Pemberton, J.M. Gene Mapping in the Wild with SNPs: Guidelines and Future Directions. Genetica 2009, 136, 97–107. [Google Scholar] [CrossRef]
  62. Schmutz, J.; McClean, P.E.; Mamidi, S.; Wu, G.A.; Cannon, S.B.; Grimwood, J.; Jenkins, J.; Shu, S.; Song, Q.; Chavarro, C.; et al. A Reference Genome for Common Bean and Genome-Wide Analysis of Dual Domestications. Nat. Genet. 2014, 46, 707–713. [Google Scholar] [CrossRef]
  63. Reimand, J.; Isser, R.; Voisin, V.; Kucera, M.; Tannus-lopes, C.; Rostamianfar, A.; Wadi, L.; Meyer, M.; Wong, J.; Xu, C. Pathway Enrichment Analysis and Visualization of Omics Data Using g:Profiler, GSEA, Cytoscape and EnrichmentMap-ZLO FAJN ČLANEK, TUDI RAZLAGE POSAMEZNIH TERMINOV. Nat. Protoc. 2019, 14, 482–517. [Google Scholar] [CrossRef]
  64. Caspi, R.; Billington, R.; Fulcher, C.A.; Keseler, I.M.; Kothari, A.; Krummenacker, M.; Latendresse, M.; Midford, P.E.; Ong, Q.; Ong, W.K.; et al. The MetaCyc Database of Metabolic Pathways and Enzymes. Nucleic Acids Res. 2018, 46, D633–D639. [Google Scholar] [CrossRef]
  65. Van der Auwera, G.A.; Carneiro, M.; Hartl, C.; Poplin, R.; del Angel, G.; Levy-Moonshine, A.; Jordan, T.; Shakir, K.; Roazen, D.; Thibault, J.; et al. From FastQ Data to High-Confidence Variant Calls: The Genome Analysis Toolkit Best Practices Pipeline. Curr. Protoc. Bioinformatics. 2013, 43, 11.10.1–11.10.33. [Google Scholar] [CrossRef]
  66. Asakura, H.; Yamakawa, T.; Tamura, T.; Ueda, R.; Taira, S.; Saito, Y.; Abe, K.; Asakura, T. Transcriptomic and Metabolomic Analyses Provide Insights into the Upregulation of Fatty Acid and Phospholipid Metabolism in Tomato Fruit under Drought Stress. J. Agric. Food Chem. 2021, 69, 2894–2905. [Google Scholar] [CrossRef]
  67. Blair, M.W.; Cortés, A.J.; Farmer, A.D.; Huang, W.; Ambachew, D.; Varma Penmetsa, R.; Carrasquilla-Garcia, N.; Assefa, T.; Cannon, S.B. Uneven Recombination Rate and Linkage Disequilibrium across a Reference SNP Map for Common Bean (Phaseolus vulgaris L.). PLoS ONE 2018, 13, e0189597. [Google Scholar] [CrossRef] [PubMed]
  68. Galeano, C.H.; Cortés, A.J.; Fernández, A.C.; Soler, Á.; Franco-Herrera, N.; Makunde, G.; Vanderleyden, J.; Blair, M.W. Gene-Based Single Nucleotide Polymorphism Markers for Genetic and Association Mapping in Common Bean. BMC Genet. 2012, 13, 48. [Google Scholar] [CrossRef]
  69. Seehausen, O. Hybridization and Adaptive Radiation. Trends Ecol. Evol. 2004, 19, 198–207. [Google Scholar] [CrossRef] [PubMed]
  70. Cortés, A.J.; Restrepo-Montoya, M.; Bedoya-Canas, L.E. Modern Strategies to Assess and Breed Forest Tree Adaptation to Changing Climate. Front. Plant Sci. 2020, 11, 583323. [Google Scholar] [CrossRef] [PubMed]
  71. Mejía-Jiménez, A.; Muñoz, C.; Jacobsen, H.J.; Roca, W.M.; Singh, S.P. Interspecific Hybridization between Common and Tepary Beans: Increased Hybrid Embryo Growth, Fertility, and Efficiency of Hybridization through Recurrent and Congruity Backcrossing. Theor. Appl. Genet. 1994, 88, 324–331. [Google Scholar] [CrossRef] [PubMed]
  72. Munoz, L.C.; Blair; Duque, W.; Tohme, M.C.; Roca, J. Introgression in Common Bean—Tepary Bean Interspecific Congruity-Backcross Lines as Measured by AFLP Markers. Crop Sci. 2004, 44, 637–645. [Google Scholar] [CrossRef]
  73. Boyle, E.A.; Li, Y.I.; Pritchard, J.K. An Expanded View of Complex Traits: From Polygenic to Omnigenic. Cell 2017, 169, 1177–1186. [Google Scholar] [CrossRef]
  74. Bresadola, L.; Caseys, C.; Castiglione, S.; Buerkle, C.A.; Wegmann, D.; Lexer, C. Admixture Mapping in Interspecific Populus Hybrids Identifies Classes of Genomic Architectures for Phytochemical, Morphological and Growth Traits. New Phytol. 2019, 223, 2076–2089. [Google Scholar] [CrossRef]
  75. Vasylyk, I.; Gorislavets, S.; Matveikina, E.; Lushchay, E.; Lytkin, K.; Grigoreva, E.; Karzhaev, D.; Volkov, V.; Volodin, V.; Spotar, G.; et al. SNPs Associated with Foliar Phylloxera Tolerance in Hybrid Grape Populations Carrying Introgression from Muscadinia. Horticulturae 2022, 8, 16. [Google Scholar] [CrossRef]
  76. Osorio-Guarín, J.A.; Garzón-Martínez, G.A.; Delgadillo-Duran, P.; Bastidas, S.; Moreno, L.P.; Enciso-Rodríguez, F.E.; Cornejo, O.E.; Barrero, L.S. Genome-Wide Association Study (GWAS) for Morphological and Yield-Related Traits in an Oil Palm Hybrid (Elaeis oleifera x Elaeis guineensis) Population. BMC Plant Biol. 2019, 19, 533. [Google Scholar] [CrossRef]
  77. Sarfraz, Z.; Iqbal, M.S.; Geng, X.; Iqbal, M.S.; Nazir, M.F.; Ahmed, H.; He, S.; Jia, Y.; Pan, Z.; Sun, G.; et al. GWAS Mediated Elucidation of Heterosis for Metric Traits in Cotton (Gossypium hirsutum L.) Across Multiple Environments. Front. Plant Sci. 2021, 12, 565552. [Google Scholar] [CrossRef] [PubMed]
  78. Lin, Y.P.; Wu, T.H.; Chan, Y.K.; van Zonneveld, M.; Schafleitner, R. De Novo SNP Calling Reveals the Genetic Differentiation and Morphological Divergence in Genus Amaranthus. Plant Genome 2022, 15, e20206. [Google Scholar] [CrossRef]
  79. Nagasaka, K.; Nishiyama, S.; Fujikawa, M.; Yamane, H.; Shirasawa, K.; Babiker, E.; Tao, R. Genome-Wide Identification of Loci Associated With Phenology-Related Traits and Their Adaptive Variations in a Highbush Blueberry Collection. Front. Plant Sci. 2022, 12, 3147. [Google Scholar] [CrossRef] [PubMed]
  80. Bhatta, M.; Morgounov, A.; Belamkar, V.; Baenziger, P.S. Genome-Wide Association Study Reveals Novel Genomic Regions for Grain Yield and Yield-Related Traits in Drought-Stressed Synthetic Hexaploid Wheat. Int. J. Mol. Sci. 2018, 19, 3011. [Google Scholar] [CrossRef]
  81. Anderson, J.T.; Lee, C.R.; Mitchell-Olds, T. Strong Selection Genome-Wide Enhances Fitness Trade-Offs across Environments and Episodes of Selection. Evolution 2014, 68, 16–31. [Google Scholar] [CrossRef] [PubMed]
  82. Savolainen, O.; Lascoux, M.; Merilä, J. Ecological Genomics of Local Adaptation. Nat. Rev. Genet. 2013, 14, 807–820. [Google Scholar] [CrossRef]
  83. Anderson, J.T.; Willis, J.H.; Mitchell-Olds, T. Evolutionary Genetics of Plant Adaptation. Trends Genet. 2011, 27, 258–266. [Google Scholar] [CrossRef]
  84. Wadgymar, S.M.; Lowry, D.B.; Gould, B.A.; Byron, C.N.; Mactavish, R.M.; Anderson, J.T. Identifying Targets and Agents of Selection: Innovative Methods to Evaluate the Processes That Contribute to Local Adaptation. Methods Ecol. Evol. 2017, 8, 738–749. [Google Scholar] [CrossRef]
  85. Mee, J.A.; Yeaman, S. Unpacking Conditional Neutrality: Genomic Signatures of Selection on Conditionally Beneficial and Conditionally Deleterious Mutations. Am. Nat. 2019, 194, 529–540. [Google Scholar] [CrossRef]
  86. Orr, H.A. The Genetic Theory of Adaptation: A Brief History. Nat. Rev. Genet. 2005, 6, 119–127. [Google Scholar] [CrossRef]
  87. Payseur, B.A.; Rieseberg, L.H. A Genomic Perspective on Hybridization and Speciation. Mol. Ecol. 2016, 25, 2337–2360. [Google Scholar] [CrossRef] [PubMed]
  88. Todesco, M.; Owens, G.L.; Bercovich, N.; Légaré, J.S.; Soudi, S.; Burge, D.O.; Huang, K.; Ostevik, K.L.; Drummond, E.B.M.; Imerovski, I.; et al. Massive Haplotypes Underlie Ecotypic Differentiation in Sunflowers. Nature 2020, 584, 602–607. [Google Scholar] [CrossRef] [PubMed]
  89. Herzog, E.; Frisch, M. Selection Strategies for Marker-Assisted Backcrossing with High-Throughput Marker Systems. Theor. Appl. Genet. 2011, 123, 251–260. [Google Scholar] [CrossRef]
  90. Oliveira, L.K.; Melo, L.C.; Brondani, C.; Peloso, M.J.D.; Brondani, R.P.V. Backcross Assisted by Microsatellite Markers in Common Bean. Genet. Mol. Res. 2008, 7, 1000–1010. [Google Scholar] [CrossRef]
  91. Blair, M.W.; Iriarte, G.; Beebe, S. QTL Analysis of Yield Traits in an Advanced Backcross Population Derived from a Cultivated Andean × Wild Common Bean (Phaseolus vulgaris L.) Cross. Theor. Appl. Genet. 2006, 112, 1149–1163. [Google Scholar] [CrossRef]
  92. Yang, X.; Lu, M.; Wang, Y.; Wang, Y.; Liu, Z.; Chen, S. Response Mechanism of Plants to Drought Stress. Horticulturae 2021, 7, 50. [Google Scholar] [CrossRef]
  93. Pollard, M.; Beisson, F.; Li, Y.; Ohlrogge, J.B. Building Lipid Barriers: Biosynthesis of Cutin and Suberin. Trends Plant Sci. 2008, 13, 236–246. [Google Scholar] [CrossRef] [PubMed]
  94. Chen, M.; Zhu, X.; Zhang, Y.; Du, Z.; Chen, X.; Kong, X.; Sun, W.; Chen, C. Drought Stress Modify Cuticle of Tender Tea Leaf and Mature Leaf for Transpiration Barrier Enhancement through Common and Distinct Modes. Sci. Rep. 2020, 10, 6696. [Google Scholar] [CrossRef]
  95. Patwari, P.; Salewski, V.; Gutbrod, K.; Kreszies, T.; Dresen-Scholz, B.; Peisker, H.; Steiner, U.; Meyer, A.J.; Schreiber, L.; Dörmann, P. Surface Wax Esters Contribute to Drought Tolerance in Arabidopsis. Plant J. 2019, 98, 727–744. [Google Scholar] [CrossRef]
  96. Kannangara, R.; Branigan, C.; Liu, Y.; Penfield, T.; Rao, V.; Mouille, G.; Höfte, H.; Pauly, M.; Riechmann, J.L.; Broun, P. The Transcription Factor WIN1/SHN1 Regulates Cutin Biosynthesis in Arabidopsis Thaliana. Plant Cell 2007, 19, 1278–1294. [Google Scholar] [CrossRef]
  97. Liu, N.; Chen, J.; Wang, T.; Li, Q.; Cui, P.; Jia, C.; Hong, Y. Overexpression of WAX INDUCER1/SHINE1 Gene Enhances Wax Accumulation under Osmotic Stress and Oil Synthesis in Brassica Napus. Int. J. Mol. Sci. 2019, 20, 4435. [Google Scholar] [CrossRef]
  98. Cortés, A.J.; This, D.; Chavarro, C.; Madriñán, S.; Blair, M.W. Nucleotide Diversity Patterns at the Drought-Related DREB2 Encoding Genes in Wild and Cultivated Common Bean (Phaseolus vulgaris L.). Theor. Appl. Genet. 2012, 125, 1069–1085. [Google Scholar] [CrossRef]
  99. Quirino, B.F.; Noh, Y.; Himelblau, E.; Amasino, R.M. Molecular Aspects of Leaf Senescence. Trends Plant Sci. 2000, 5, 278–282. [Google Scholar] [CrossRef] [PubMed]
  100. Chen, J.; Li, N.; Wang, X.; Meng, X.; Cui, X.; Chen, Z.; Ren, H.; Ma, J.; Liu, H. Late Embryogenesis Abundant (LEA) Gene Family in Salvia miltiorrhiza: Identification, Expression Analysis, and Response to Drought Stress. Plant Signal. Behav. 2021, 16, 1891769. [Google Scholar] [CrossRef] [PubMed]
  101. Singh, C.M.; Kumar, M.; Pratap, A.; Tripathi, A. Genome-Wide Analysis of Late Embryogenesis Abundant Protein Gene Family in Vigna Species and Expression of VrLEA Encoding Genes in Vigna Glabrescens Reveal Its Role in Heat Tolerance. Front. Plant Sci. 2022, 13, 843107. [Google Scholar] [CrossRef] [PubMed]
  102. Deng, Y.; Lu, S. Biosynthesis and Regulation of Phenylpropanoids in Plants. CRC Crit. Rev. Plant Sci. 2017, 36, 257–290. [Google Scholar] [CrossRef]
  103. Gill, S.S.; Tuteja, N. Reactive Oxygen Species and Antioxidant Machinery in Abiotic Stress Tolerance in Crop Plants. Plant Physiol. Biochem. 2010, 48, 909–930. [Google Scholar] [CrossRef]
  104. Cheng, M.C.; Liao, P.M.; Kuo, W.W.; Lin, T.P. The Arabidopsis Ethylene Response FACTOR1 Regulates Abiotic Stress-Responsive Gene Expression by Binding to Different Cis-Acting Elements in Response to Different Stress Signals. Plant Physiol. 2013, 162, 1566–1582. [Google Scholar] [CrossRef]
  105. Yang, J.; Duan, G.; Li, C.; Liu, L.; Han, G.; Zhang, Y.; Wang, C. The Crosstalks Between Jasmonic Acid and Other Plant Hormone Signaling Highlight the Involvement of Jasmonic Acid as a Core Component in Plant Response to Biotic and Abiotic Stresses. Front. Plant Sci. 2019, 10, 1349. [Google Scholar] [CrossRef]
  106. Dornbos, D.L.; Mullen, R.E. Soybean Seed Protein and Oil Contents and Fatty Acid Composition Adjustments by Drought and Temperature. J. Am. Oil Chem. Soc. 1992, 69, 228–231. [Google Scholar] [CrossRef]
  107. Kazan, K. Diverse Roles of Jasmonates and Ethylene in Abiotic Stress Tolerance. Trends Plant Sci. 2015, 20, 219–229. [Google Scholar] [CrossRef] [PubMed]
  108. Cortés, A.J.; Skeen, P.; Blair, M.W.; Chacón-Sánchez, M.I. Does the Genomic Landscape of Species Divergence in Phaseolus Beans Coerce Parallel Signatures of Adaptation and Domestication? Front. Plant Sci. 2018, 871, 1816. [Google Scholar] [CrossRef] [PubMed]
  109. Barbulescu, D.M.; Fikere, M.; Malmberg, M.M. Imputation to Whole-Genome Sequence Increases the Power of Genome Wide Association Studies for Blackleg Resistance in Canola. In AusCanola 2018 20th Australian Research Assembly on Brassicas Perth; GIWA: Perth, Australia, 2018; p. 29. [Google Scholar]
  110. Lang-Mladek, C.; Popova, O.; Kiok, K.; Berlinger, M.; Rakic, B.; Aufsatz, W.; Jonak, C.; Hauser, M.-T.; Luschnig, C. Transgenerational Inheritance and Resetting of Stress-Induced Loss of Epigenetic Gene Silencing in Arabidopsis. Mol. Plant 2010, 3, 594–602. [Google Scholar] [CrossRef] [PubMed]
  111. Pecinka, A.; Dinh, H.Q.; Baubec, T.; Rosa, M.; Lettner, N.; Mittelsten Scheid, O. Epigenetic Regulation of Repetitive Elements Is Attenuated by Prolonged Heat Stress in Arabidopsis. Plant Cell 2010, 22, 3118–3129. [Google Scholar] [CrossRef] [PubMed]
  112. LeBlanc, C.; Zhang, F.; Mendez, J.; Lozano, Y.; Chatpar, K.; Irish, V.F.; Jacob, Y. Increased Efficiency of Targeted Mutagenesis by CRISPR/Cas9 in Plants Using Heat Stress. Plant J. 2018, 93, 377–386. [Google Scholar] [CrossRef]
  113. Assefa, T.; Assibi Mahama, A.; Brown, A.V.; Cannon, E.K.S.; Rubyogo, J.C.; Rao, I.M.; Blair, M.W.; Cannon, S.B. A Review of Breeding Objectives, Genomic Resources, and Marker-Assisted Methods in Common Bean (Phaseolus vulgaris L.). Mol. Breed. 2019, 39, 20. [Google Scholar] [CrossRef]
  114. Pelaáz, D.; Aguilar, P.A.; Mercado, M.; Loápez-Hernaández, F.; Guzmaán, M.; Burbano-Erazo, E.; Denning-James, K.; Medina, C.I.; Blair, M.W.; De Vega, J.J.; et al. Genotype Selection, and Seed Uniformity and Multiplication to Ensure Common Bean (Phaseolus vulgaris L.) var. Liborino. Agronomy 2022, 12, 2285. [Google Scholar]
Disclaimer/Publisher’s Note: The statements, opinions and data contained in all publications are solely those of the individual author(s) and contributor(s) and not of MDPI and/or the editor(s). MDPI and/or the editor(s) disclaim responsibility for any injury to people or property resulting from any ideas, methods, instructions or products referred to in the content.

