Communication

Non-Invasive Single-Grain Screening of Proteins and Other Features by Combination of Near-Infrared Spectroscopy and Nuclear Magnetic Resonance

1
Leibniz Institute of Plant Genetics and Crop Plant Research (IPK), Corrensstraße 3, 06466 Seeland, Germany
2
Pancreas Cancer Research Lab, Department of Clinical Science, Intervention and Technique, (CLINTEC), Karolinska Institutet, Huddinge SE 141 57, Sweden
*
Authors to whom correspondence should be addressed.
Agronomy 2023, 13(5), 1393; https://doi.org/10.3390/agronomy13051393
Submission received: 24 April 2023 / Revised: 10 May 2023 / Accepted: 13 May 2023 / Published: 18 May 2023
(This article belongs to the Section Precision and Digital Agriculture)

Abstract

:
The non-invasive analysis of seeds is of great interest to experimental biologists and breeders. To reach a high varietal identity and purity of seed material, it is often necessary to access features of individual seeds via the screening of mutant populations. While near-infrared spectroscopy (NIRS) and time-domain nuclear-magnetic-resonance spectroscopy (TD-NMR) are well-known in seed research and industry for bulk seed measurements, their application for individual seeds is challenging. Here we demonstrate how to overcome this limitation using a practical approach to cereal grains using oat (Avena sp.) as a model. For this, we generated a representative collection of oat seeds from the ex situ German federal gene bank, which includes wide variation in grain size, shape, and coloration. Next, we established a short experimental pipeline to exemplify how to improve the procedure for individual seed measurements. In its current state, the method is ready to use for the high-accuracy estimation of nitrogen (protein) content (R2 = 0.877), water content (R2 = 0.715), and seed weight (R2 = 0.897) of individual oat grains. This work introduces the combination of NIRS and TD-NMR as an efficient, precise, and, most importantly, non-destructive analytic platform for a high throughput analysis of individual intact seeds.

1. Introduction

Oat (Avena sativa) is a robust, hardy crop domesticated over 3000 years ago [1,2]. It is widely used in modern agriculture, in particular for food and feed, due to its grain’s high nutritional value [1,3,4]. The recently published full reference genome of oat [1] could allow new breeding approaches to prevent the presumed genetic diversity loss resulting in stagnating yield [2,5]. Phenotypic traits, such as caryopsis type, lemma color, or panicle type, but also the differentiation between naked, black, or husked oats, seem insignificantly influenced by or contribute to genetic clustering patterns [2]. While robust molecular tools are established and seem applicable for future genetic variations, analyzing individual seeds non-destructively is of growing interest for many seed-related industries because it enables the selection of the best compositional traits [6,7].
In this context, to avoid time-consuming and destructive conventional techniques, high-throughput, non-invasive, and accurate methods are required.
Two of the most promising methods which fulfill both criteria, fast measurement and application as a non-destructive method, are time-domain nuclear magnetic resonance (TD-NMR) and near-infrared spectroscopy (NIRS). Near-infrared spectroscopy (NIRS), on the one hand, has been used for more than 60 years for analytical applications [7] and is well-established for analyzing multiple traits and high throughput. As an optical method, NIRS relies highly on choosing representative model seeds to develop robust calibration methods. However, when seed shape or color differs substantially from those of the calibrated sample set, precision may be compromised [8]. Thus, at present, the ability to noninvasively characterize individual seeds rapidly and robustly remains in need of significant improvement. In contrast, nuclear magnetic resonance spectroscopy (NMR) is unaffected by color, shape, or size [9], meaning it is not limited to existing cultivars and may be used for new genetic varieties. A method for simultaneous screening of fresh weight, lipid, carbohydrate, and water content, using different species with the limitation of inaccurate protein detection, was presented by Rolletschek et al., 2015 [9].
The main components in oats are starch (39–55%), dietary fiber (20–39%), proteins (9–16%), and lipids (2–18%), according to Banas et Harasym 2021 [3]. So far, previously reported results focused mainly on bulk measurement of mature grains for whole grains [4,10] and flour [11,12]. While lipids can be measured accurately with TD-NMR, Rolletschek et al., 2015 [9] did show that carbohydrates can also be determined with their method. As they reported an unsatisfactory protein detection, the need arose to develop a robust supplementary NIRS procedure.
The first promising approach to single oat grain protein measurement was reported by Gracia et al., 2017 [13]. Thus, we aimed here to establish a robust non-invasive high-throughput method enabling measurement of protein and water content as well as dry weight for single oat seeds using NIRS and TD-NMR. For this purpose, from about ~3000 available Avena accessions [9], we selected 50 oat lines, representing the vast majority of variance for seed composition and thousand-grain weight. Using such a wide range of seed shapes, colors, and sizes ensured the quality and robustness of the method.

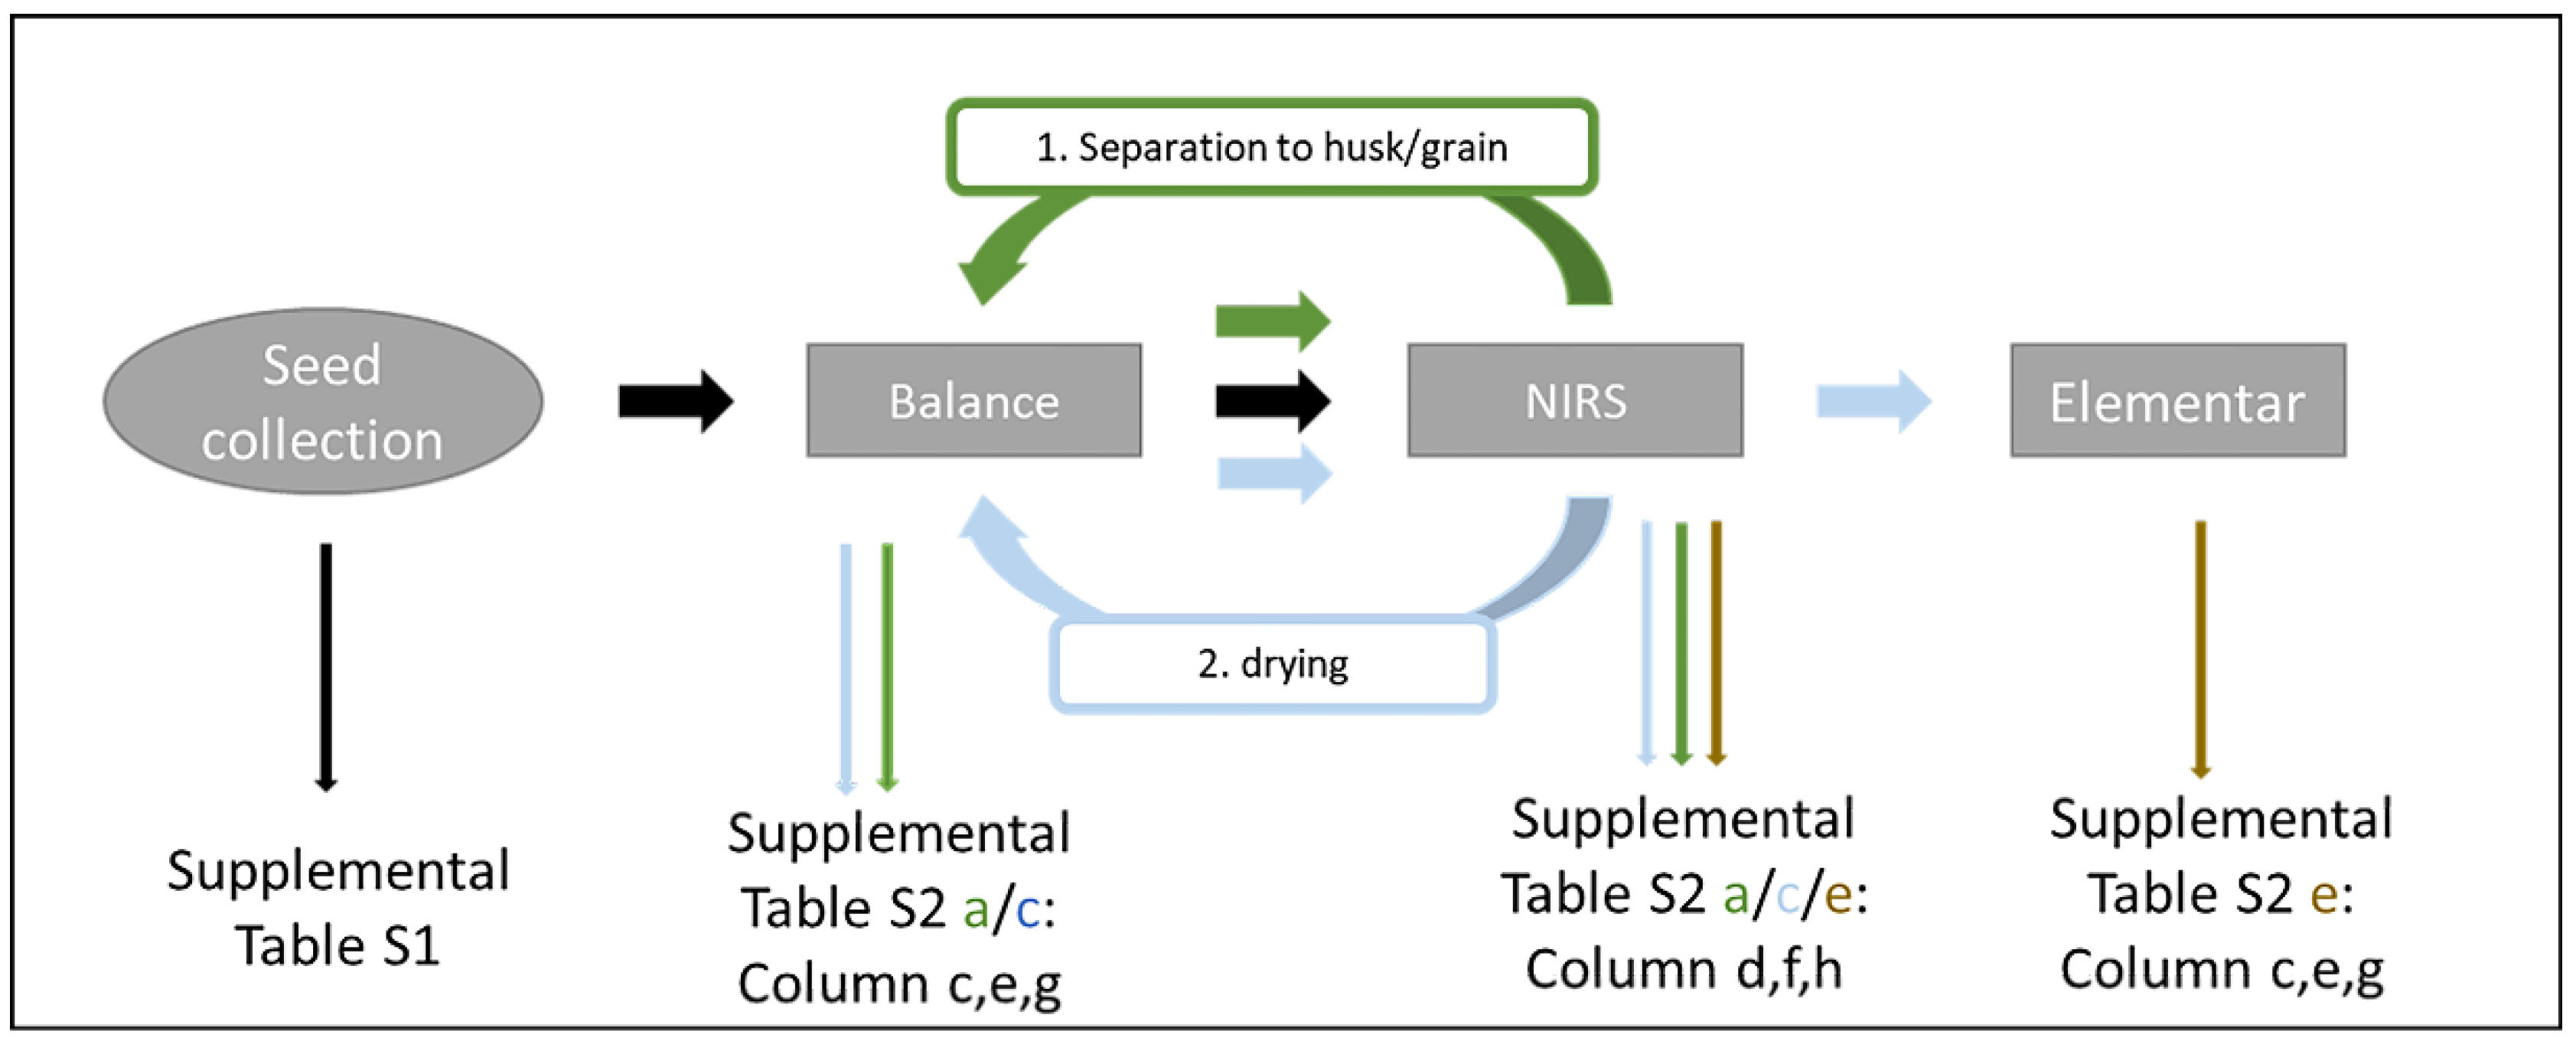
2. Materials and Methods
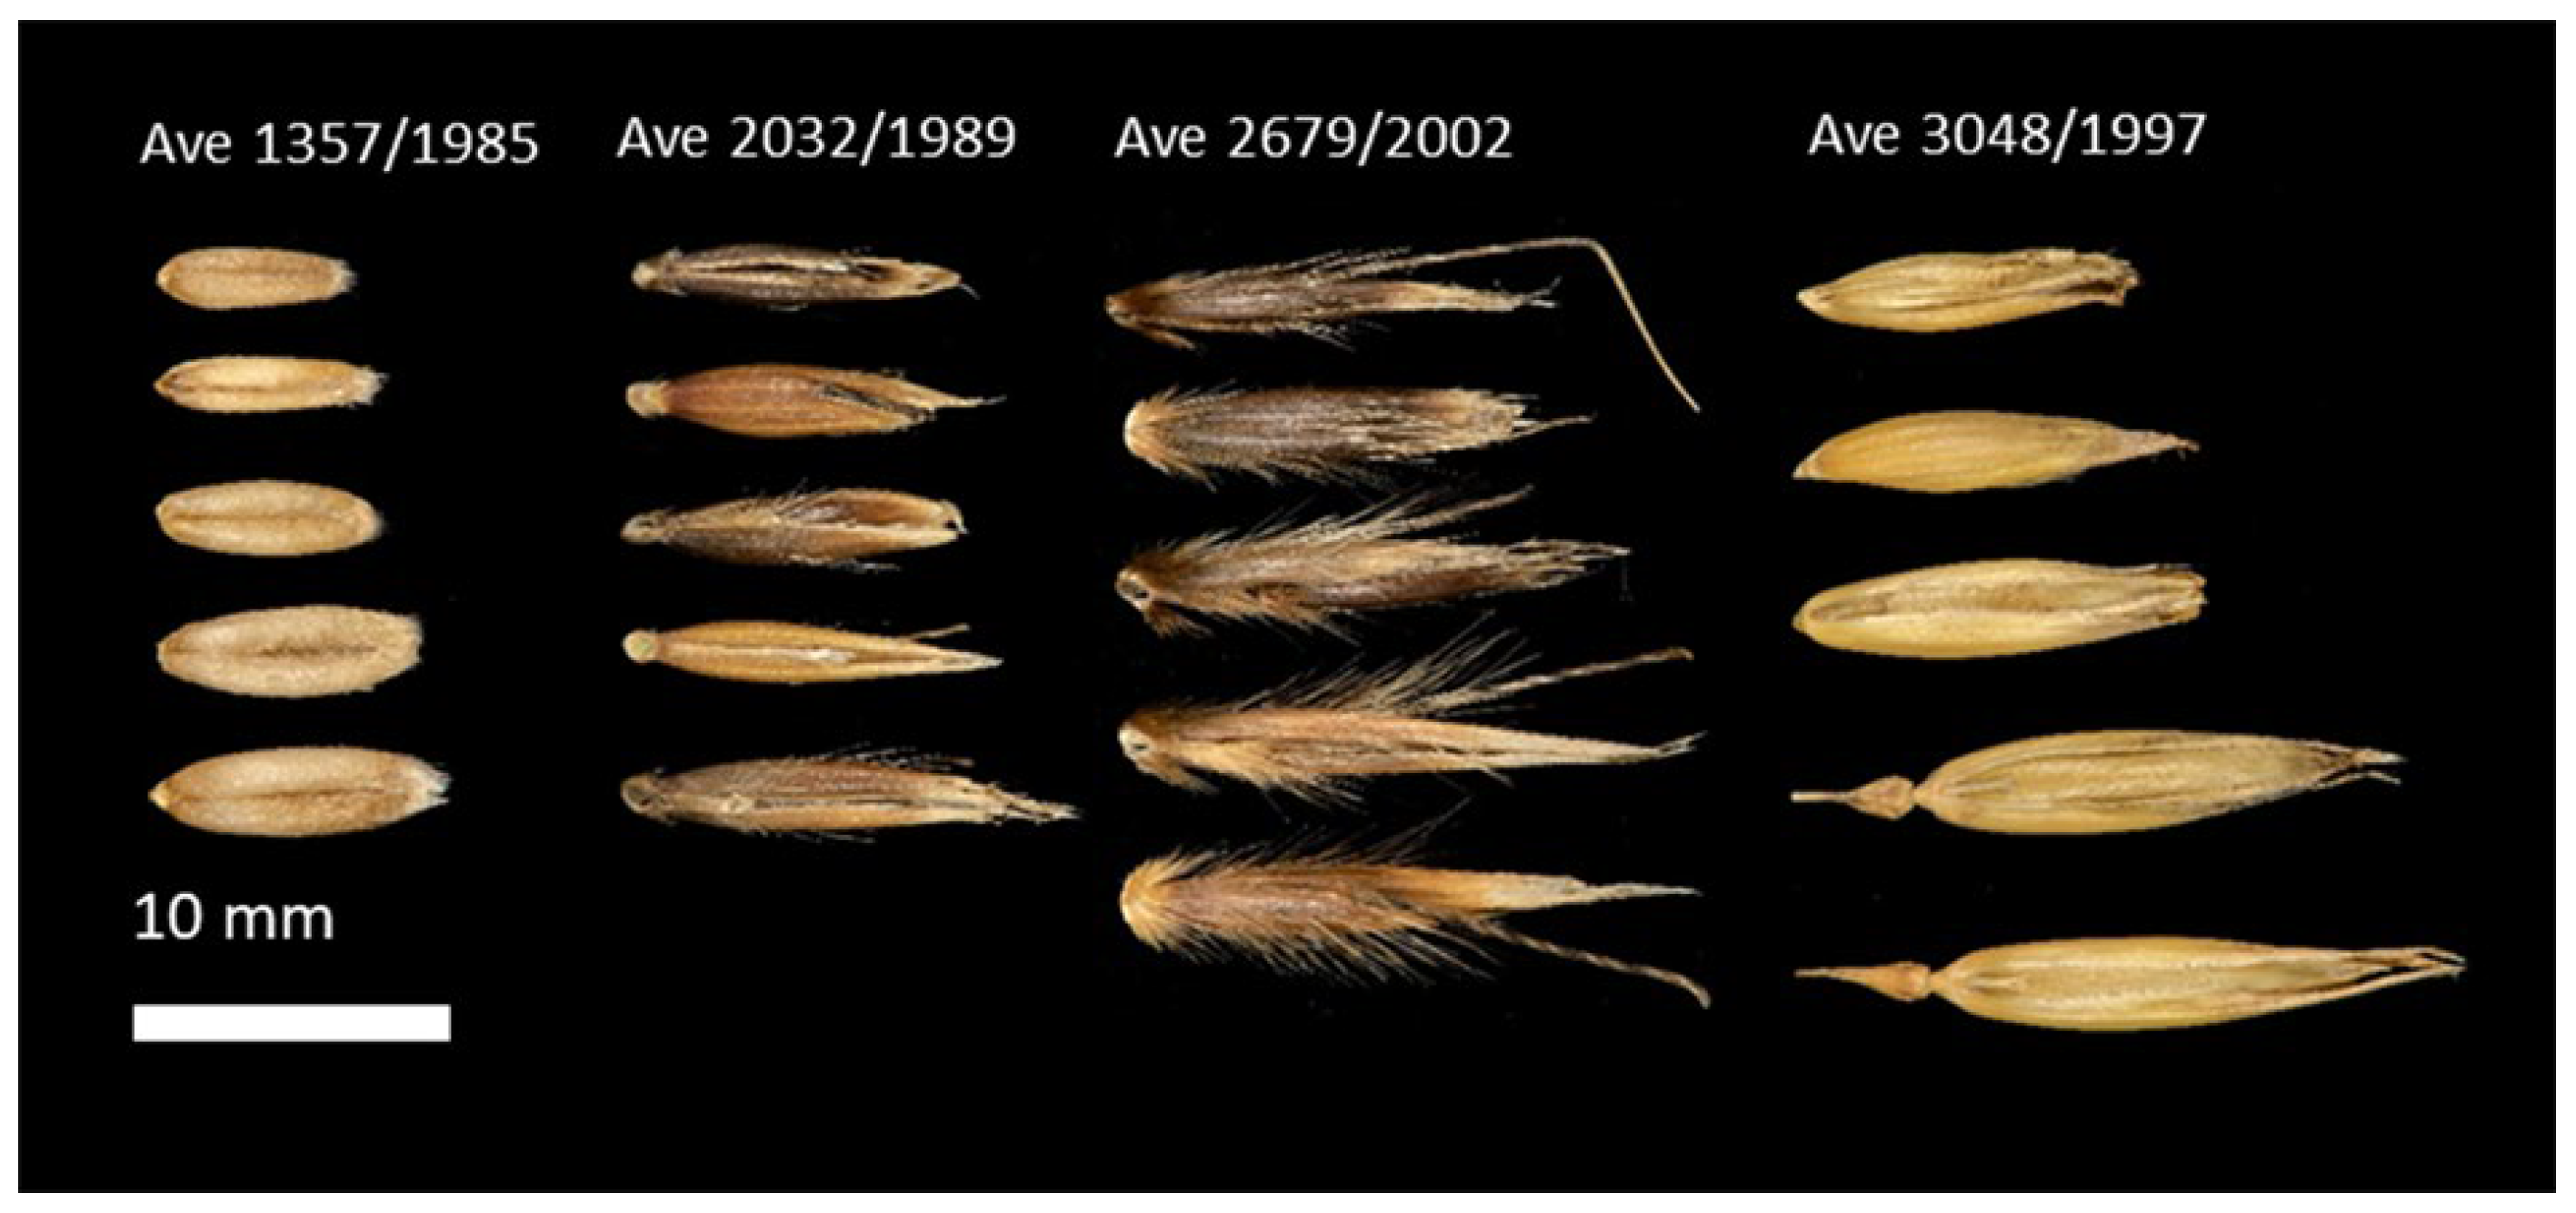
2.1. Seed Material

All seed accession were provided by the German Federal Ex situ Gene Bank at the IPK Gatersleben (https://www.ipk-gatersleben.de/en/infrastructure/gene-bank/gene-bank-gatersleben, accessed on 24 April 2023).

2.2. NIRS Measurements

Spectra of single seeds were generated using the Bruker MPA NIR spectrometer (Bruker Optics, Ettlingen, Germany). Single seeds from all selected Avena accessions were analyzed in separate glass vials (flat bottom vials: FIOLAX, clear HGB 1/ISO 719, 45 × 8/0.5 mm, MGlas AG, Münnerstadt, Germany) to fit the 50-slot sampling disc of the MPA. The sides and the top of the glass vials containing the seed were covered by standard aluminum wrap, with the dull side facing outwards to offer shade from outside light sources and reflect light from the NIR source. The system was equipped with an integration sphere detector (TE-InGaAs) used in diffuse reflectance mode. Data were recorded in the spectral range of 12,500 to 3600 cm−1 at a spectral resolution of 20 cm−1. Each spectrum is comprised of 64 co-added scans. As background, a spectra of the internal standard of the spectrometer was measured prior to sample testing and automatically subtracted from the recorded sample by the software OPUS 6 (Bruker Optics, Ettlingen, Germany).

2.3. NMR Hardware and Application

2.3.1. TD-NMR

High-throughput measurements with nuclear magnetic resonance spectroscopy were performed using a low-field minispec mq60 TD-NMR (Bruker BioSpin GmbH, Rheinstetten, Germany). This device operates at a proton frequency of 60 MHz (1.4 T), and the available probe head allows testing of samples with 6 mm diameter and 10 mm length. An automated sample delivery system, enabling the measurement of ~1400 samples per day, was provided by LAIX Technologies (Langerwehe, Germany). Detailed information about the hardware, as well as the applied pulse sequence, is described elsewhere [9].

2.3.2. MRI

Visualization of intact grains was achieved by using an Avance III HD 400 MHz NMR-spectrometer (Bruker Biospin, Rheinstetten, Germany). Imaging was performed using a 3D multi-spin multi-echo sequence with a repetition time (TR) = 1000 ms, echo time (TE) = 6.9 ms, and a field of view (FOV) = 23 × 9 × 9 mm, achieving a resolution of 70 × 70 × 70 µm. Three grains were inserted in plant oil as a magnetic field homogenizer and measured simultaneously. Data processing was conducted using Matlab (R2020b, The MathWorks Inc., Natick, MA, USA), and visualization was done using AMIRA software (Amira3D 2022.1, ThermoFisher Scientific, Inc., Schwerte, Germany).

2.4. Nitrogen Content Determination
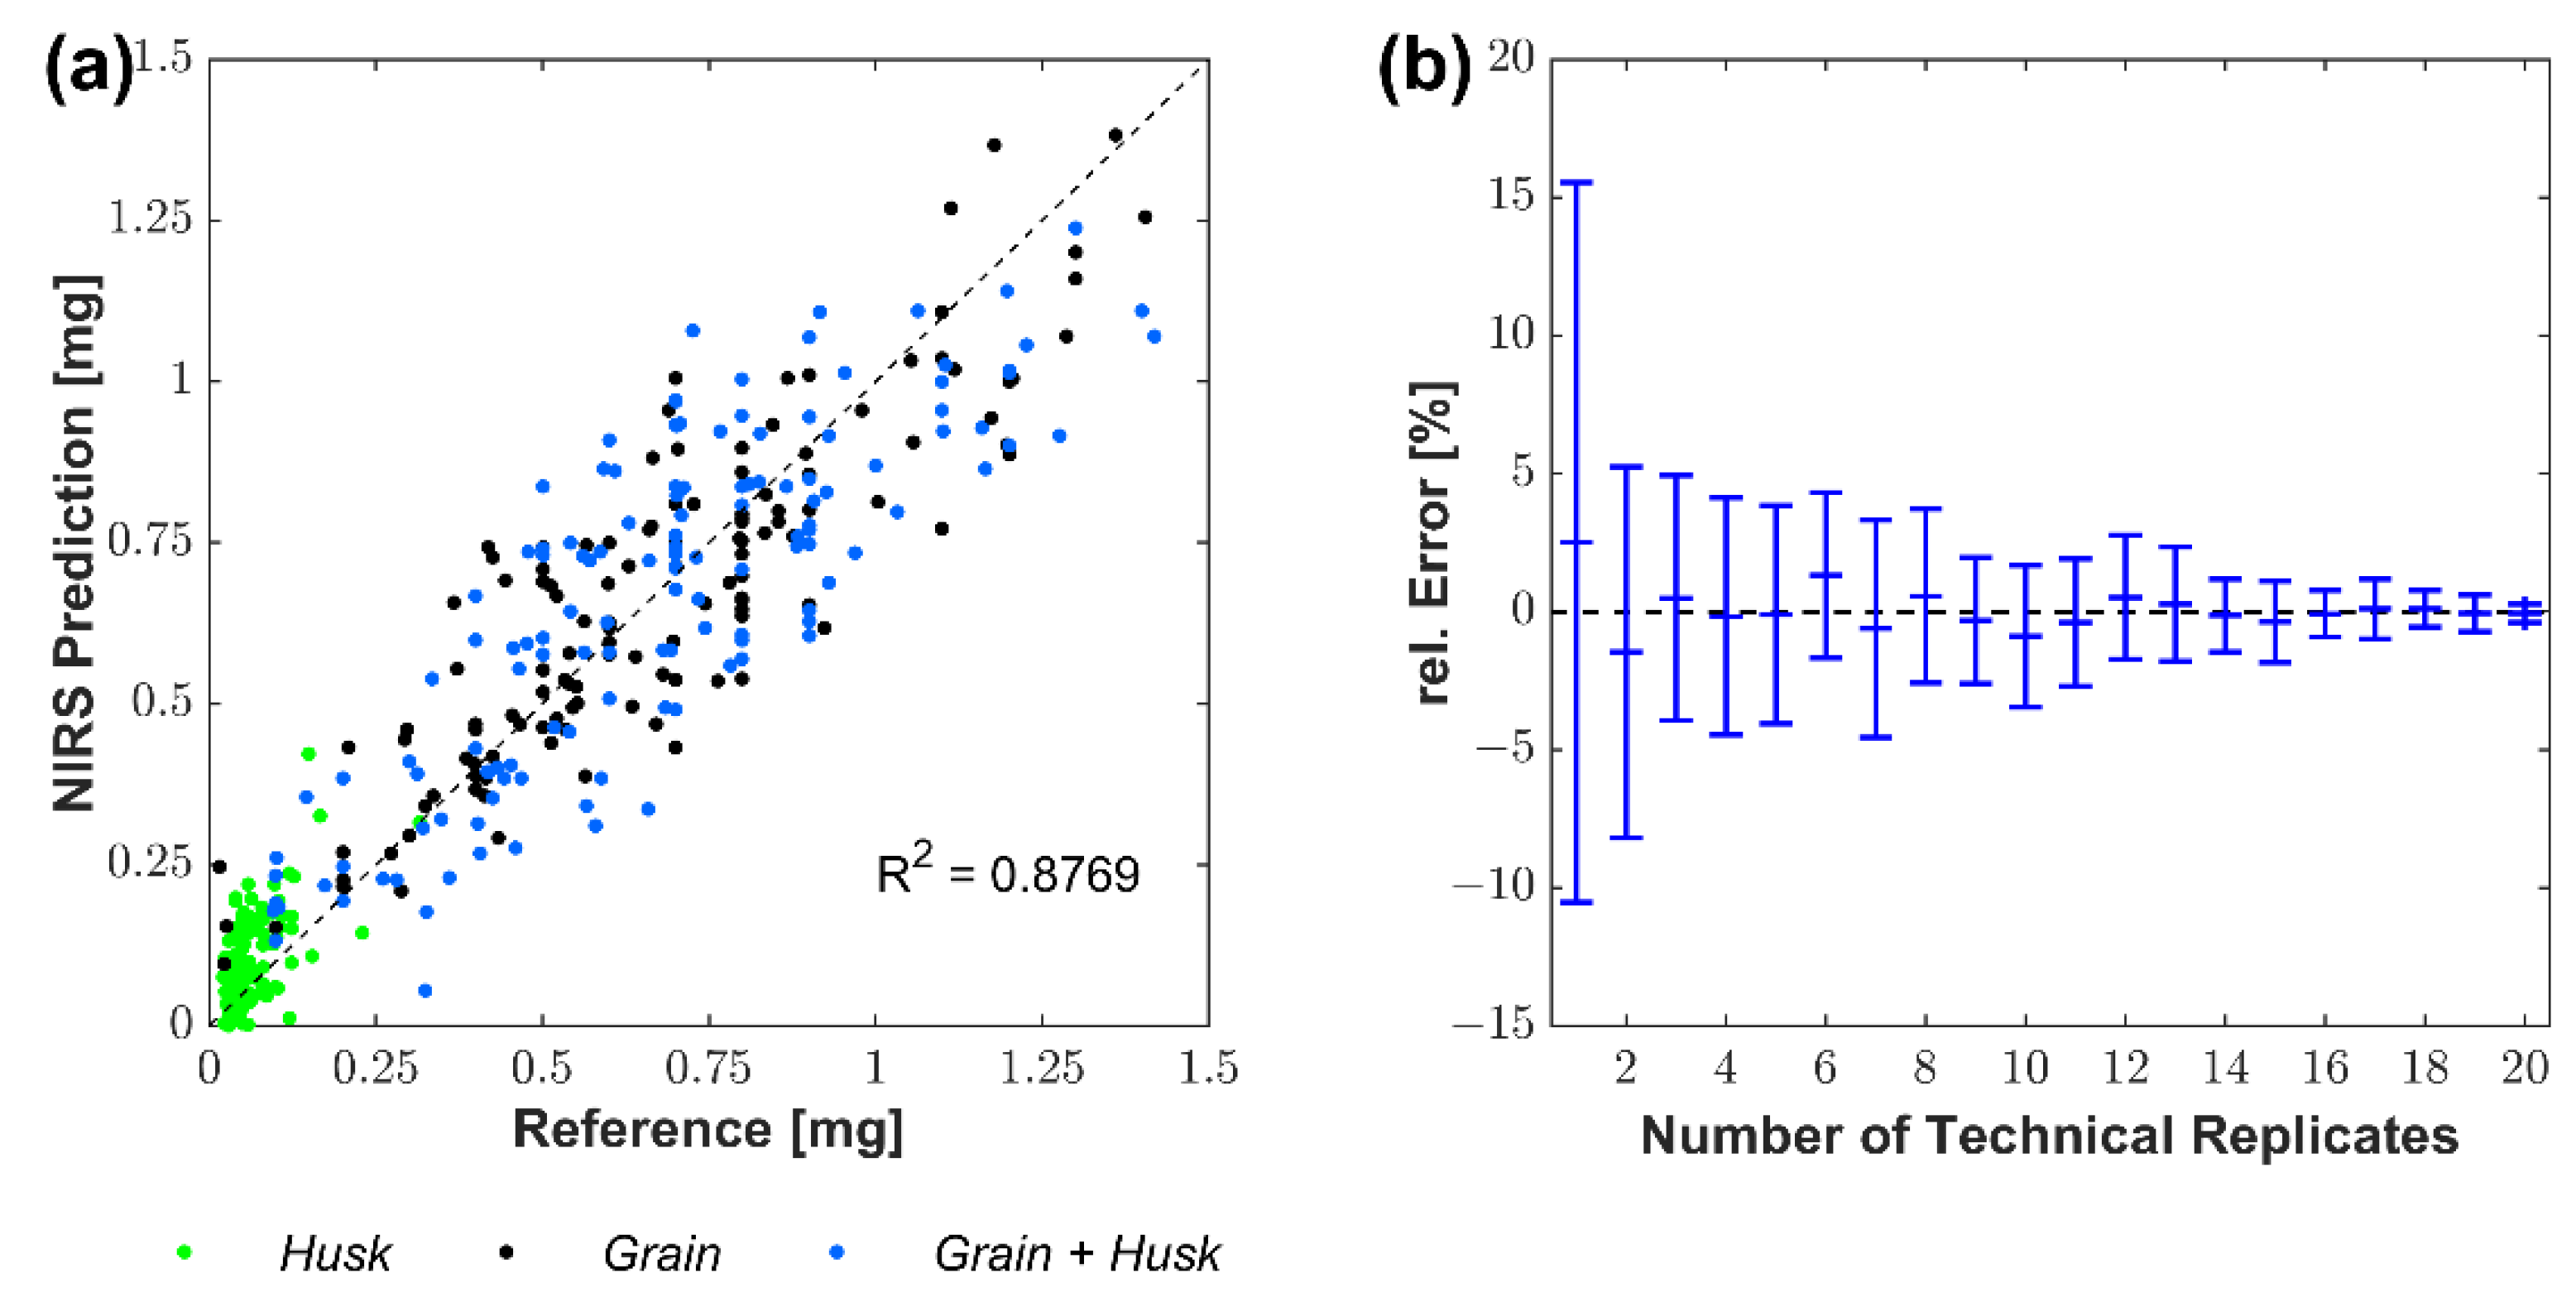
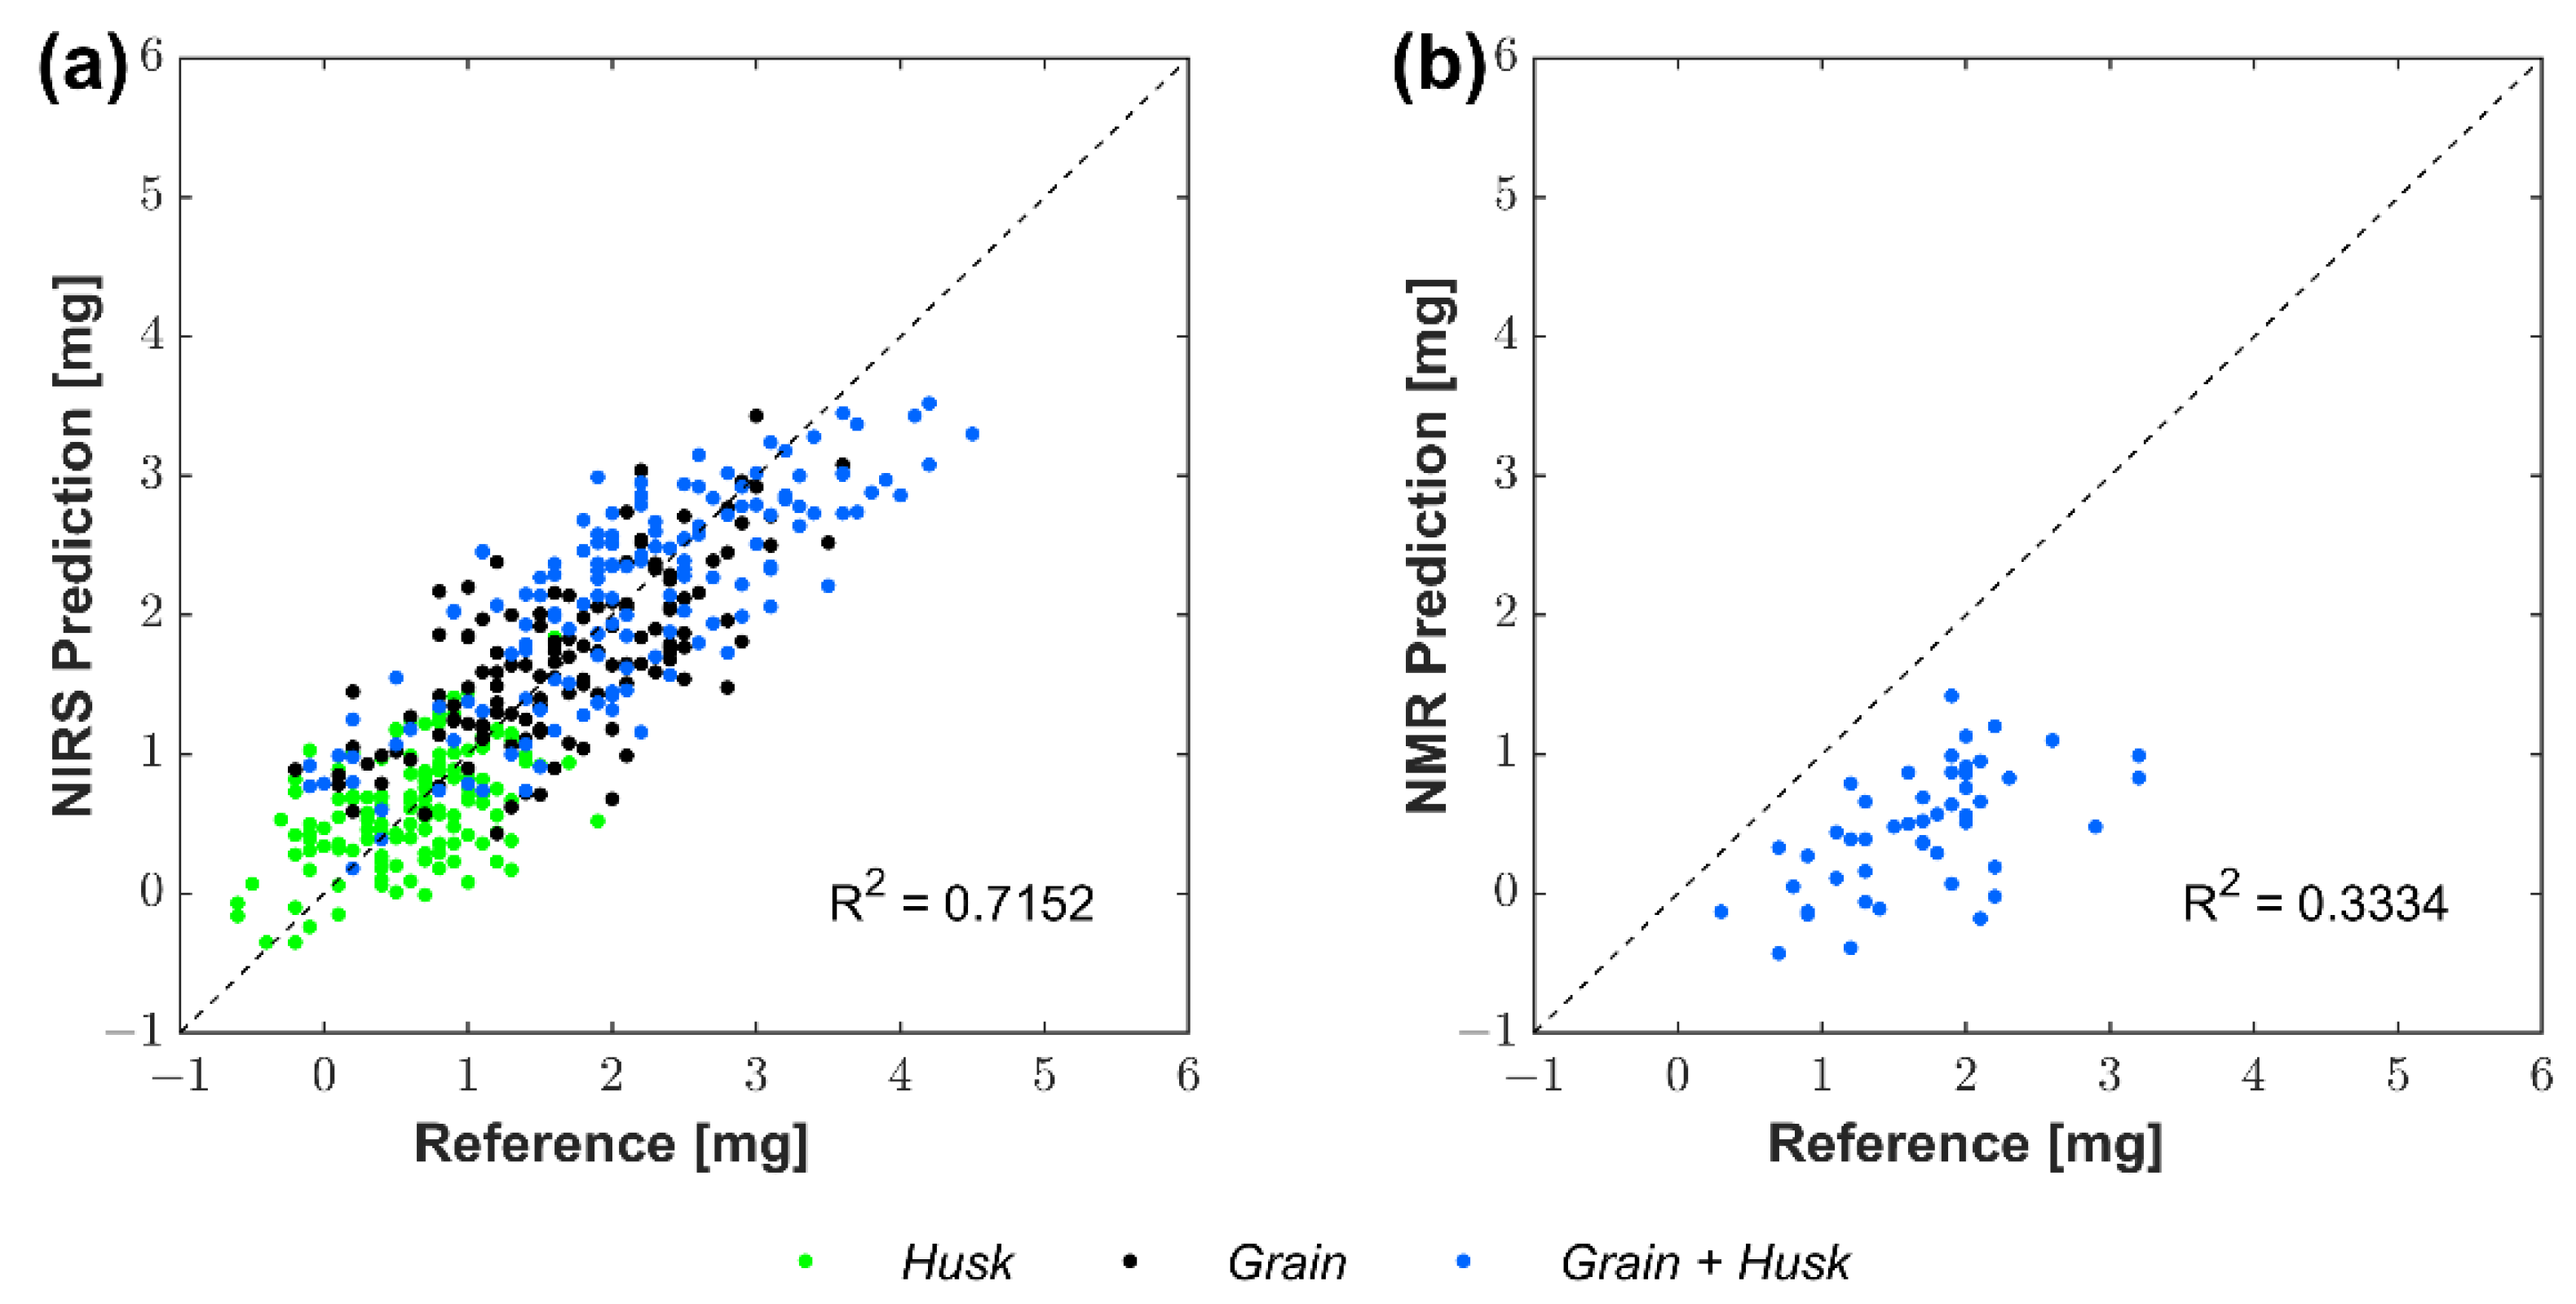
Dumas combustion method was used for nitrogen content measurement using the elementary analyzer vario MICRO Cube (Elementar Analysensysteme GmbH, Langenselbold, Germany). For this method, grains and husks were manually ground, and three biological replicates (independent individual grains) of 0.5 mg ground material were tested. Factor 5.83 [14] was used to convert nitrogen content to protein content.

3. Results

The primary goal was to establish a robust high-throughput method to measure protein (nitrogen) content (along with other traits like water content or dry weight) of individual oat seeds using NIR spectroscopy as the main analytical tool already available in many seed labs. Our analytical pipeline is depicted in Figure 1. Three replicate samples of whole kernels were measured once with a balance and NIRS, divided into grain and husk, and measured again by balance and NIRS. Water content was then determined by drying the samples at 60 °C for 24 h, balancing them, and measuring using NIRS. Afterwards, the dried samples were measured using an elemental analyzer to obtain nitrogen (protein) content. If applicable, husk and grain values were added to get the combined husk + grain value.
For compositional analysis, we selected 50 oat accessions (out of ~3000) representing 99.9% of the variance for seed composition (carbohydrate, lipid, and protein content) and thousand kernel weight. Selected seeds thus represent a wide range of shapes, colors, and sizes, which in turn shall ensure the high quality and robustness of the novel analytical scheme/method. The apparent diversity of selected cultivars is exemplarily shown in Figure 2.
Next, we measured individual seeds (husk and grain) using NIRS according to the pipeline (see Figure 1). Reference spectra of a subset of single seed spectra were further used for calibration model development in software OPUS 6. Reference data for calibration of dry weight, moisture, and nitrogen mass was provided by gravimetric, drying, and elemental analysis. The optimization tool within the method development app of OPUS 6 was used to identify spectral relevant regions and data treatment for each analyte by optimizing for RMSE value using a partial linear regression approach. The optimized settings were cross-validated.
Our newly developed NIRS method enables a very accurate nitrogen content measurement (Figure 3a) compared to the reference method (Dumas combustion method). After one technical replication, the validation resulted in a correlation factor R2 = 0.877, a root-mean-square-error of cross-validation RMSECV = 0.133 mg, and a ratio of standard deviation to root-mean-square-error of prediction RPD = 2.69. This calibration method can be considered a good prediction model for screening, according to Williams [15]. Due to the division of kernels in grains, husks, and grains + husks, as well as the selection of 99.9% of total oat variance, this method should be applicable for any existing oat population as well as newly developed mutant or breeding lines, regardless of their size, shape or kernel status. Furthermore, this calibration method may be improved by using additional technical repeats. As shown in Figure 3b, the relative error of the measurement with one technical replication is about ±15%. In contrast, after 3 technical repeats, it decreases to ±5%, whereas the measurement time triples to two minutes per sample and, therefore, still enables high-throughput measurement.
An evaluation of the water content of a seed using non-invasive measurements is presented in Figure 4. While the NIRS method can approximate quantitative prediction of water content (see Figure 4a; R2 = 0.715, RMSECV = 0.542 mg, RPD = 1.88), NMR water prediction proved to be unreliable for single oat seeds, as seen in Figure 4b, due to the fact that the water content seems to be below the quantitative threshold of this method. Still, NMR may be used for fresh material, seeds with higher moisture content, or, in general, for bulk measurements as described by Rolletschek et al. 2015 [9].
The third parameter, which we could measure using NIRS, was the dry weight of a single seed. Measurement of dry weight by NIRS is shown in Figure 5a, with accurate prediction statistics of R2 = 0.897, RMSECV = 3.94 mg, and RPD = 3.11. However, the applied NMR measurement method, which was described by Rolletschek et al. [9] (Figure 5b), showed an almost perfect prediction of dry weight (R2 = 0.990, root-mean-square-error of prediction RMSEP = 1.363 mg and RPD = 7.38).
A combination of both NIRS and TD-NMR allows the assessment of main kernel components, as shown in Figure 6. Carbohydrates and oil content were measured with TD-NMR according to Rolletschek et al., 2015 [9]. Protein and dry weight, on the other hand, were determined with our newly established NIRS method. Complete whole seeds were used (with husks or, if available, naked). The weight ranged from ~15 mg to ~45 mg per seed, with a total carbohydrate content between 81–88%. The oil range was between 0.8 and 5.2%, and protein was between 4.6 and 14.3%.
Based on our results, we conclude that the NIRS/TD-NMR approach is reliable for all oat accessions, regardless of kernel size, shape, or composition. Therefore, it can be useful for phenotyping mutant populations and/or breeding lines.

4. Discussion

Seeds start and end the plant life cycle in most crops, making it important to develop analytic tools that do not require invasive procedures. The applied single-seed screening approach allows a more differentiated and individualized analysis of plants/seeds by assessing traits for breeding experiments. Mutant lines enable the selection of the best compositional traits for various purposes [6,7]. Thereby, the sample amount required for multiple analyses by screening could be substantially reduced along with the reduction of resources (human, industrial, natural) required for their production.
We successfully developed a NIRS method for determining protein (nitrogen) content, water content, and dry weight of single oat seeds. The nitrogen calibration was satisfactory for screening in breeding programs (R2 = 0.877, RMSECV = 0.133 mg, RPD = 2.69) and even more accurate than the pioneer Gracia’s [13] work that inspired our design (R2 = 0.72, RMSECV = 0.58%, RPD = 1.9, using all data for protein measurement). Furthermore, our method uses a larger variety within the training set, with 50 different lines representing 99.9% of the variance (compared to six lines [13]). By applying all types of seed morphologies (husk, grain, grain + husk) instead of only de-hulled grains [13], we expect our method to work for new hybrids in breeding studies for single oat seeds without further processing of kernel status or differentiation of seed morphology (color, shape). Our results are also comparable to similar single seed calibrations of protein, using maize kernels (R2 = 0.87, RPD = 3.15, [16]) or barley (R2 = 0.90, RPD = 2.9, [17]). Although using nitrogen-to-protein conversion factors is deemed unsatisfactory [18], it is still an often-used approach. Usually, the same factor is used for all samples/tissues in one study (for oat: 5.83% [14], 5.36% [19], 5.32% [20], or average cereals 5.4% [18]). It is considered not to influence calibration statistics, and thus, the comparison between protein and nitrogen calibration seems appropriate.
Combined with the previously reported TD-NMR method, which accurately determines fresh weight, lipid, and total carbohydrate content [9], we can measure all main seed components. While NMR is not affected by morphological grain traits such as shape or color, resulting in excellent fresh weight prediction statistics (R2 = 0.990, root-mean-square-error of prediction RMSEP = 1.363 mg and RPD = 7.38), the presented method requires a minimum amount of ~20 mg biomass per sample [9], which could explain the less appropriate water measurement (see Figure 4b). The near-infrared spectroscopy, as an optical method, on the other hand, is affected by morphological grain traits and, therefore, a higher variance of measurement parameters can be explained. Nonetheless, the presented NIRS method can be further enhanced by adding specific sugar or protein constituent parameters to the calibration set. Our methodological approach is also suited to expand for various cereals and developmental stages in separate or even potentially in one calibration.
The TD-NMR system with an integrated sample handling robot allows for measuring ~1400 samples per day [9]. The NIRS system is limited to ~500 samples per day. For further augmentation of high throughput in the NIRS, one might add a robot for sample picking and/or apply an enlarged slot sampling disc. Other authors developed or likewise used high-throughput NIRS equipment [13,21]. Using 48 well plates, Gracia et al., 2017 [13] achieved a throughput of up to 1152 individual seeds per day. A high-speed throughput with 10 kernels per second, on the other hand, was achieved by Armstrong 2006 [21]. Their best prediction statistics for corn moisture (R2 = 0.97, RPD = 5.5, standard error of cross-validation SECV = 0.76%), soybean moisture (R2 = 0.99, RPD = 10.5, SECV = 0.32%) and soybean protein content (R2 = 0.96, RPD = 4.9, SECV = 0.99%) showed acceptable to good results while usage of limited genetic variety together with reported material handling problems limits application of this system. Compared to that, our approach had similar or better calibration statistics using more analytes while still allowing high throughput on readily available technology platforms.
Our analytical approach combining NIRS and TD-NMR enables the accurate determination of weight, lipids, protein, water, and carbohydrates in high-throughput for single kernels. Such a non-invasive platform is reliable for measurements regardless of color, shape, age, and composition. It can be used to analyze mutants and breeding lines, opening broad prospects for experimental biologists and breeders.

Supplementary Materials

The following supporting information can be downloaded at: https://www.mdpi.com/article/10.3390/agronomy13051393/s1. Figure S1: Images of Accessions 1–23; Figure S2: Images of Accessions 24–47; Figure S3: Images of Accessions 48–50; Table S1: Detailed list of accessions belonging to the genus Avena available in the IPK genebank-, Table S2: Single Seed Data

Author Contributions

Conceptualization, P.K., A.G., H.R. and L.B.; methodology, B.G. and A.G.; validation, P.K., B.G. and A.G.; formal analysis, P.K., B.G. and A.G.; investigation, P.K. and B.G.; resources, B.G.; data curation, P.K. and B.G.; writing—original draft preparation, P.K.; writing—review and editing, P.K., B.G., A.G., H.R. and L.B.; visualization, P.K.; supervision, H.R. and L.B. All authors have read and agreed to the published version of the manuscript.

Funding

The research of LB laboratory issupported by the European Regional Development Fund (ERDF) and Investment Bank of Saxony-Anhalt, grant number FKZ: ZS/2019/09/101444. Costs for open access publishing were partially funded by the Deutsche Forschungsgemeinschaft (DFG, German Research Foundation, grant 491250510).

Data Availability Statement

The data presented in this study are available in Supplementary Materials Table S1: Accessions and Table S2: Single Seed Data.

Acknowledgments

The authors thank S. Herrmann, S. Ortleb, and S. Wagner for their excellent technical assistance. We thank the Federal ex situ Genebank and especially A. Börner, IPK Gatersleben, for providing seeds and passport data.

Conflicts of Interest

The authors declare no conflict of interest.

References

  1. Kamal, N.; Tsardakas Renhuldt, N.; Bentzer, J.; Gundlach, H.; Haberer, G.; Juhász, A.; Lux, T.; Bose, U.; Tye-Din, J.A.; Lang, D.; et al. The mosaic oat genome gives insights into a uniquely healthy cereal crop. Nature 2022, 606, 113–119. [Google Scholar] [CrossRef] [PubMed]
  2. Leišová-Svobodová, L.; Michel, S.; Tamm, I.; Chourová, M.; Janovska, D.; Grausgruber, H. Diversity and Pre-Breeding Prospects for Local Adaptation in Oat Genetic Resources. Sustainability 2019, 11, 6950. [Google Scholar] [CrossRef]
  3. Banaś, K.; Harasym, J. Current Knowledge of Content and Composition of Oat Oil—Future Perspectives of Oat as Oil Source. Food Bioprocess. Technol. 2021, 14, 232–247. [Google Scholar] [CrossRef]
  4. Silva, C.F.L.; Milach, S.C.K.; Silva, S.D.A.; Montero, C.R. Near infrared reflectance spectroscopy (NIRS) to assess protein and lipid contents in Avena sativa L. Crop Breed. Appl. Biotechol 2008, 8, 127–133. [Google Scholar]
  5. Canales, F.J.; Montilla-Bascón, G.; Bekele, W.A.; Howarth, C.J.; Langdon, T.; Rispail, N.; Tinker, N.A.; Prats, E. Population genomics of Mediterranean oat (A. sativa) reveals high genetic diversity and three loci for heading date. Theor. Appl. Genet. 2021, 134, 2063–2077. [Google Scholar] [CrossRef] [PubMed]
  6. Mortensen, A.K.; Gislum, R.; Jørgensen, J.R.; Boelt, B. The Use of Multispectral Imaging and Single Seed and Bulk Near-Infrared Spectroscopy to Characterize Seed Covering Structures: Methods and Applications in Seed Testing and Research. Agriculture 2021, 11, 301. [Google Scholar] [CrossRef]
  7. Agelet, L.E.; Hurburgh, C.R. Limitations and current applications of Near Infrared Spectroscopy for single seed analysis. Talanta 2014, 121, 288–299. [Google Scholar] [CrossRef] [PubMed]
  8. Hom, N.H.; Becker, H.C.; Möllers, C. Non-destructive analysis of rapeseed quality by NIRS of small seed samples and single seeds. Euphytica 2007, 153, 27–34. [Google Scholar] [CrossRef]
  9. Rolletschek, H.; Fuchs, J.; Friedel, S.; Börner, A.; Todt, H.; Jakob, P.M.; Borisjuk, L. A novel noninvasive procedure for high-throughput screening of major seed traits. Plant. Biotechnol. J. 2015, 13, 188–199. [Google Scholar] [CrossRef] [PubMed]
  10. Paudel, D.; Caffe-Treml, M.; Krishnan, P. A single analytical platform for the rapid and simultaneous measurement of protein, oil, and beta-glucan contents of oats using near-infrared reflectance spectroscopy. Cereal Foods World 2018, 63, 17–25. [Google Scholar] [CrossRef]
  11. Bellato, S.; Frate, V.D.; Redaelli, R.; Sgrulletta, D.; Bucci, R.; Magrì, A.D.; Marini, F. Use of near infrared reflectance and transmittance coupled to robust calibration for the evaluation of nutritional value in naked oats. J. Agric. Food Chem. 2011, 59, 4349–4360. [Google Scholar] [CrossRef] [PubMed]
  12. Kays, S.E.; Barton, F.E.; Windham, W.R. Predicting Protein Content by near Infrared Reflectance Spectroscopy in Diverse Cereal Food Products. J. Near Infrared Spectrosc. 2000, 8, 35–43. [Google Scholar] [CrossRef]
  13. Gracia, M.-B.; Armstrong, P.R.; Rongkui, H.; Mark, S. Quantification of betaglucans, lipid and protein contents in whole oat groats (Avena sativa L.) using near infrared reflectance spectroscopy. J. Near Infrared Spectrosc. 2017, 25, 172–179. [Google Scholar] [CrossRef]
  14. Jones, D.B. Factors for Converting Percentages of Nitrogen in Foods and Feeds into Percentages of Proteins; No. 183; US Department of Agriculture: Washington, DC, USA, 1931.
  15. Williams, P.C.; Sobering, D.C. Comparison of Commercial Near Infrared Transmittance and Reflectance instruments for analysis of whole grains and seeds. J. Near Infrared Spectrosc. 1993, 1, 25–32. [Google Scholar] [CrossRef]
  16. Tallada, J.G.; Palacios-Rojas, N.; Armstrong, P.R. Prediction of maize seed attributes using a rapid single kernel near infrared instrument. J. Cereal Sci. 2009, 50, 381–387. [Google Scholar] [CrossRef]
  17. Fox, G.P.; Kelly, A.; Sweeney, N.; Hocroft, D.M. Development of a Single Kernel NIR Barley Protein Calibration and Assessment of Variation in Protein on Grain Quality. J. Inst. Brew. 2011, 117, 582–586. [Google Scholar] [CrossRef]
  18. Mariotti, F.; Tomé, D.; Mirand, P.P. Converting nitrogen into protein—Beyond 6.25 and Jones’ factors. Crit. Rev. Food Sci. Nutr. 2008, 48, 177–184. [Google Scholar] [CrossRef] [PubMed]
  19. Mosse, J. Nitrogen-to-protein conversion factor for ten cereals and six legumes or oilseeds. A reappraisal of its definition and determination. Variation according to species and to seed protein content. J. Agr. Food Chem. 1990, 38, 18–24. [Google Scholar] [CrossRef]
  20. Tkachuk, R. Nitrogen-to-protein conversion factors for cereals and oilseed meals. Cereal Chem. 1969, 46, 419–423. [Google Scholar]
  21. Armstrong, P.R. Rapid single-kernel NIR measurement of grain and oil-seed attributes. Appl. Eng. Agric. 2006, 22, 767–772. [Google Scholar] [CrossRef]
Figure 1. Black arrows indicate processing (data storage and measurement), green indicates process for weight determination (including separation), blue arrows indicate process for dry weight determination, and yellow indicates data for N-content measurement with an elemental analyzer (EA-Analyzer). Data were stored in Table S2a: Single seed dry weight measured with NIRS, Table S2c: Single seed dry weight measured with NIRS, Table S2e: Single seed nitrogen content measured with NIRS, and Supplementary Table S1: A detailed list of accessions belonging to the genus Avena available in the IPK genebank.
Agronomy 13 01393 g001
Figure 2. Four selected accessions from a total of 50. These four accessions were selected to highlight the great variety in shape, color, and size of the dataset. For images of the complete collection, see Figures S1–S3.
Agronomy 13 01393 g002
Figure 3. (a) Validation of NIRS model for protein content by reference measurement with Dumas combustion method. Included are in total ~450 measurements (three biological replicates for each, Husk, Grain, and Grain + Husk). (b) Impact of technical repeats on NIRS protein prediction calibration. Measuring the same samples 3 times reduces the relative error to ±5%.
Agronomy 13 01393 g003
Figure 4. (a) Validation of NIRS model for water content by gravimetric weight determination before and after drying. Included are in total ~450 measurements (three biological replicates for each, Husk, Grain, and Grain + Husk). (b) NMR prediction of the water content of single kernels representing all 50 selected oat accessions, all containing grains + husks. As a reference, seeds were gravimetrically measured before and after drying.
Agronomy 13 01393 g004
Figure 5. (a) Validation of NIRS model for seed weight by gravimetric determination Included are ~450 measurements (three biological replicates for each, Husk, Grain, and Grain + Husk). (b) NMR prediction of weight for single kernels representing all 50 selected oat accessions, all containing grains + husks. As a reference, seeds were gravimetrically measured.
Agronomy 13 01393 g005
Figure 6. Single grain images and composition. (a) Images of representative kernels recorded with (i) camera and (ii) MRI method. MRI images show caryopsis (C) and, if available, husks (H). Morphology of caryopsis (C) is highlighted, while husk (H) is presented in transparent gray. (b) All cultivars for grain composition were ordered by weight. Shown are protein content (measured by new NIRS calibration) and oil and carbohydrate content (measured by TD-NMR calibration as developed by [9]). Red marked oat cultivars are shown in more detail in (a).
Agronomy 13 01393 g006
Disclaimer/Publisher’s Note: The statements, opinions and data contained in all publications are solely those of the individual author(s) and contributor(s) and not of MDPI and/or the editor(s). MDPI and/or the editor(s) disclaim responsibility for any injury to people or property resulting from any ideas, methods, instructions or products referred to in the content.

