Article

Effects of Biochar on the Cd Uptake by Rice and the Cd Fractions in Paddy Soil: A 3-Year Field Experiment

Key Laboratory of Biochar and Soil Amelioration, Ministry of Agriculture and Rural Affairs, National Biochar Institute, Shenyang Agricultural University, Shenyang 110866, China
*
Author to whom correspondence should be addressed.
Agronomy 2023, 13(5), 1335; https://doi.org/10.3390/agronomy13051335
Submission received: 10 April 2023 / Revised: 7 May 2023 / Accepted: 8 May 2023 / Published: 10 May 2023
(This article belongs to the Section Agroecology Innovation: Achieving System Resilience)

Abstract

:
Biochar is a potential amendment for the remediation of Cd-contaminated soils. Although the immobilization effect of biochar on soil Cd has been studied under indoor laboratory conditions, the effect of biochar on rice Cd uptake and soil Cd fractions under field conditions is still poorly understood. Here, the Cd content of the different organs of rice and the Cd fractions in soil were characterized for three years after the application of different amounts of biochar (0, 7.5, 15, 30 t ha−1, and 3 t ha−1 year−1). The Cd content of brown rice, husk, leaf, stem and sheath, and root under biochar treatment could be maximally reduced by up to 26.25%, 20.16%, 20.74%, 33.2%, and 26.89%, respectively. Biochar altered the Cd fractions in soil, including the decrease in exchangeable Cd content and the increase in Fe-Mn oxide bound Cd and organic bound Cd. The concentration factor of Cd uptake by rice was reduced by 32% under biochar application, while biochar had little influence on the transfer factor and distribution factor. The immobilization effect of biochar on soil Cd lasted for at least three years, but the trend of Cd immobilization efficiency over time for different amounts of biochar treatment was different. The Risk Assessment Code (RAC) of Cd in soil with biochar amendment could be reduced to a medium risk level from a high risk level. Redundancy analysis (RDA) revealed that changes in soil pH and Fe-Mn oxide bound Cd content caused by biochar application contributed most to the reduction in the Cd content of rice organs. These findings would enhance our understanding of the immobilization effect of biochar on Cd in paddy soil under field conditions.

1. Introduction

Cadmium (Cd) is one of the most toxic heavy metal pollutants in farmland soil worldwide [1]. The limited values of Cd content are different in different countries and for different types of soils with different pH. For instance, according to the Chinese risk control standard for soil contamination of agricultural land (GB 15618-2018), when 5.5 < soil pH ≤ 6.5, and total Cd content > 2 mg kg−1, the soil is considered to be a contaminated soil with risk. In the USA, the soil screening guidance (SSG) issued by the Environmental Protection Agency (EPA) indicates that the ecological soil screening value of Cd is 32 mg kg−1, which means that when the total soil Cd content is not higher than this value, the soil is considered to be risk-free. Similar to the limit value of soil, different countries or regions have different standard requirements on Cd content in food. For example, the Codex Alimentarius Commission (CAC) allows Cd in food below 0.4 mg kg−1 (CODEX STAN 193-1995), while the China national standard of food safety and China’s national food safety requires that Cd in food should not exceed 0.2 mg kg−1 (GB 2762-2017). This is because the existence fractions of Cd in soil are not single, and not all fractions of Cd can be absorbed by plants [2]. The Cd contamination of paddy soils is becoming a major concern in many rice-producing countries, including India, Thailand, China, and Japan [3]. In general, soil moisture content is a key factor in controlling the mobility and bioavailability of Cd through its effects on soil pH and the transformation of soil organic matter, and long-term flooding conditions were considered to result in the stabilization of soil Cd [4]. However, water regulation alone cannot completely avoid the toxicity of Cd contamination in paddy soil [5]. By adding appropriate soil additives, the content of bioavailable Cd in soil can be effectively controlled, thus reducing the absorption of Cd by plants [6,7]. Therefore, using suitable soil amendments in situ to make the content of Cd in the edible part of crops meet safety standards is a simple and feasible way to remediate contaminated farmland soil [8,9,10].
Many studies have mentioned the role of biochar in improving soil conditions and increasing crop yields [11,12], and biochar is also considered to be a non-toxic potential soil amendment for the remediation of Cd-contaminated farmland [13,14,15]. In laboratory conditions, it is widely reported that biochar application can reduce the Cd bioavailability in soil and the Cd content in rice plants [16,17,18]. Li et al. [19] conducted an incubation batch experiment and a pot experiment to investigate the critical impact factor of soil properties on the immobilization of Cd in soil by biochar; the results showed that the bioavailable Cd in the soil samples was reduced by 15.2~44.3% with biochar application, and the decrease rate of the bioavailable Cd concentration was significantly negatively related with soil pH and soil organic materials. Awad [20] conducted an incubation experiment and found that the application of biochar efficiently reduced the concentrations of soil TCLP and the acid-soluble fractions of Cd over the untreated one. The decrease may be due to the high pH values of the applied biochar, and the role in increasing the soil pH that reduced metal mobility in soil. Heavy metals could be adsorbed on biochar and soil surfaces resulting in a reduction in their mobilization in an alkaline environment.
In contrast to laboratory conditions (incubators or greenhouses), which are often simulated, simplified, and carefully managed, field conditions involve environmental factors that are more complex and difficult to be simulated, such as sunlight exposure, wet and dry cycles, freeze-thaw cycles, animals (i.e., earthworms), and human activities [21]. These factors could continuously influence the physical and chemical properties of soils, such as temperature, moisture, porosity, pH, etc., which may directly or indirectly alter the soil Cd fractions through geochemical mechanisms under biochar application [22,23,24]. Although, in a field trial, the study of biochar for the remediation of Cd-contaminated paddy soil is in the early stages of development, biochar has been found to reduce the Cd bioavailability in soil and Cd uptake by rice, especially in Indica rice and in subtropical climates. Bian et al. [25] reported that 40 t ha−1 wheat straw biochar reduced the Cd bioavailability in soil and the Indica rice grain Cd content significantly (subtropical climate). Chen et al. [26] found that biochar (40 t ha−1) reduced the bioavailability of the Cd content in soil from 0.24 mg kg−1 to 0.03 mg kg−1, and reduced Indica rice grain Cd content from 2.29 mg kg−1 to 0.99 mg kg−1 over the no biochar control (subtropical climate). Although different genotypes of rice (Japonica or Indica) differ in their tolerance to soil Cd contamination [21], the reduction response of Cd accumulation content to a biochar amendment is consistent [27]. Considering the above experimental results under laboratory and field conditions, it is reasonable to assume that, under a temperate climate, biochar also could improve soil pH and other physicochemical properties, reduce Cd bioavailability in soil, and eventually reduce the Cd content in Japonica rice. However, studies focusing on the effects of biochar on soil Cd fractions and Cd accumulation in japonica rice under field conditions in temperate zone are rare.
In addition, O’Connor et al. [21] reviewed published field trial studies worldwide on the utilization of biochar for the remediation of heavy metals in contaminated paddy soil, and highlighted that the sizes of the experimental plots in these studies rarely exceeded 100 m2, and small plots usually tend to be associated with fewer plant numbers, proportionally higher losses at harvest, and relatively high competition and border effects [28]. Due to the differences in environment factors, such as climate and pests, in different years and seasons, an experiment which completed post-growth sampling and maintenance for 3 or more years is more likely to lead to definitive conclusions [29]. Therefore, field experiments should be conducted within a certain large area for at least 3 years to get more accurate test results.
In order to investigate the role of biochar in the immobilization of soil Cd and reducing Cd uptake by rice in a field environment, a multi-year field experiment was carried out in the suburbs of Shenyang City, China. Shenyang is located in the northeast of China and is one of China’s most important heavy industrial cities, with Cd pollution in some cultivated soil [30,31]. In this study, different amounts of biochar were treated, and rice was cultivated under actual production conditions for three years (one growth season in each year). Cd accumulation in different organs of rice and the changes of Cd fractions in soil were measured; the Cd distribution, transfer, and concentration characteristics in different organs of rice were analyzed; and the remediation efficiency of biochar on Cd contamination in soil, and the changes in the RAC (Risk Assessment Code) of Cd in soil were also analyzed. The total area of this experiment was over 2000 m2, and the area of each plot was 130 m2. This area enjoys a semi-humid temperate monsoon climate. The main type of rice cultivated here is japonica rice. From the perspective of climate, rice type, and the scale of the experimental area, the present experimental conditions and factors are rare in similar studies. The results of this experiment can make a useful supplement for field research to verify the remediation of heavy-metal-contaminated soil by biochar.

2. Materials and Methods

2.1. Location of Field Trial Site

The contaminated paddy field for this study is located in the suburb of Shenyang City, Liaoning Province, China. This site was polluted by sewage irrigation in the early 1990s, and the paddy is a typical Cd-contaminated soil in northeast China. The average total Cd content was 3.17 mg kg−1, the average contents of available N, P, K were 123.70 mg kg−1, 35.19 mg kg−1, and 109.09 mg kg−1, respectively, and the pH and SOC were 6.12 and 19.8 mg kg−1.
Soil total Cd content was determined by microwave digestion–graphite furnace atomic absorption spectrophotometer method. HNO3 6 mL, HCl 2 mL, H2O2 (30%) 1 mL, and 1 mL HF were added to 0.2 g soil for microwave digestion, the highest temperature was 190 °C and total digestion time was 45 min. Available N was determined by alkali-diffusion method, available P was determined by molybdenum–antimony anti-spectrophotometric method (Olsen method), and available K was determined by NH4Ac extraction and flame spectrometry method. The pH of samples was measured in deionized water using a 1 to 5 wt/wt ratio, with a pH meter (HI2223, HANNA, Villafranca padovana, Italy). Soil organic carbon (SOC) was determined by potassium dichromate oxidation spectrophotometric method according to Environmental Protection Standards of the People’s Republic of China (HJ 615—2011).

2.2. Biochar Properties

Biochar used in this experiment was provided by Liaoning Golden Future Agriculture Technology Co., Ltd. (Anshan, China). As the raw materials, corn stalks were carbonized at 500 ± 50 °C for 90 min. The main properties of the biochar are presented in Table 1.
Total C, H, O, N, S were determined by dry combustion using the elemental analyzer. Total Cd, P, and K were determined by inductively coupled plasma mass spectrometry (ICP-MS) after microwave digestion, and the microwave digestion procedure was the same as soil. The measurement methods of pH and CEC of Biochar were according to Garskin [32]. pH was measured in deionized water using a 1 to 5 wt/wt ratio. Samples were thoroughly mixed and allowed to equilibrate for 1 h. The pH was measured with a digital pH meter. Potential cation exchange capacity (CEC) was determined by extraction with 1 mol L−1 NH4Ac at pH 7, flushing three times with isopropyl alcohol, followed by extraction with 2 mol L−1 KCl two times. The ammonium content of the KCl extract was determined colorimetrically using Nessler’s reagent on flow analyzer. Specific surface area, total pore volume, and average pore diameter were determined by BET method using specific surface area analyzer.

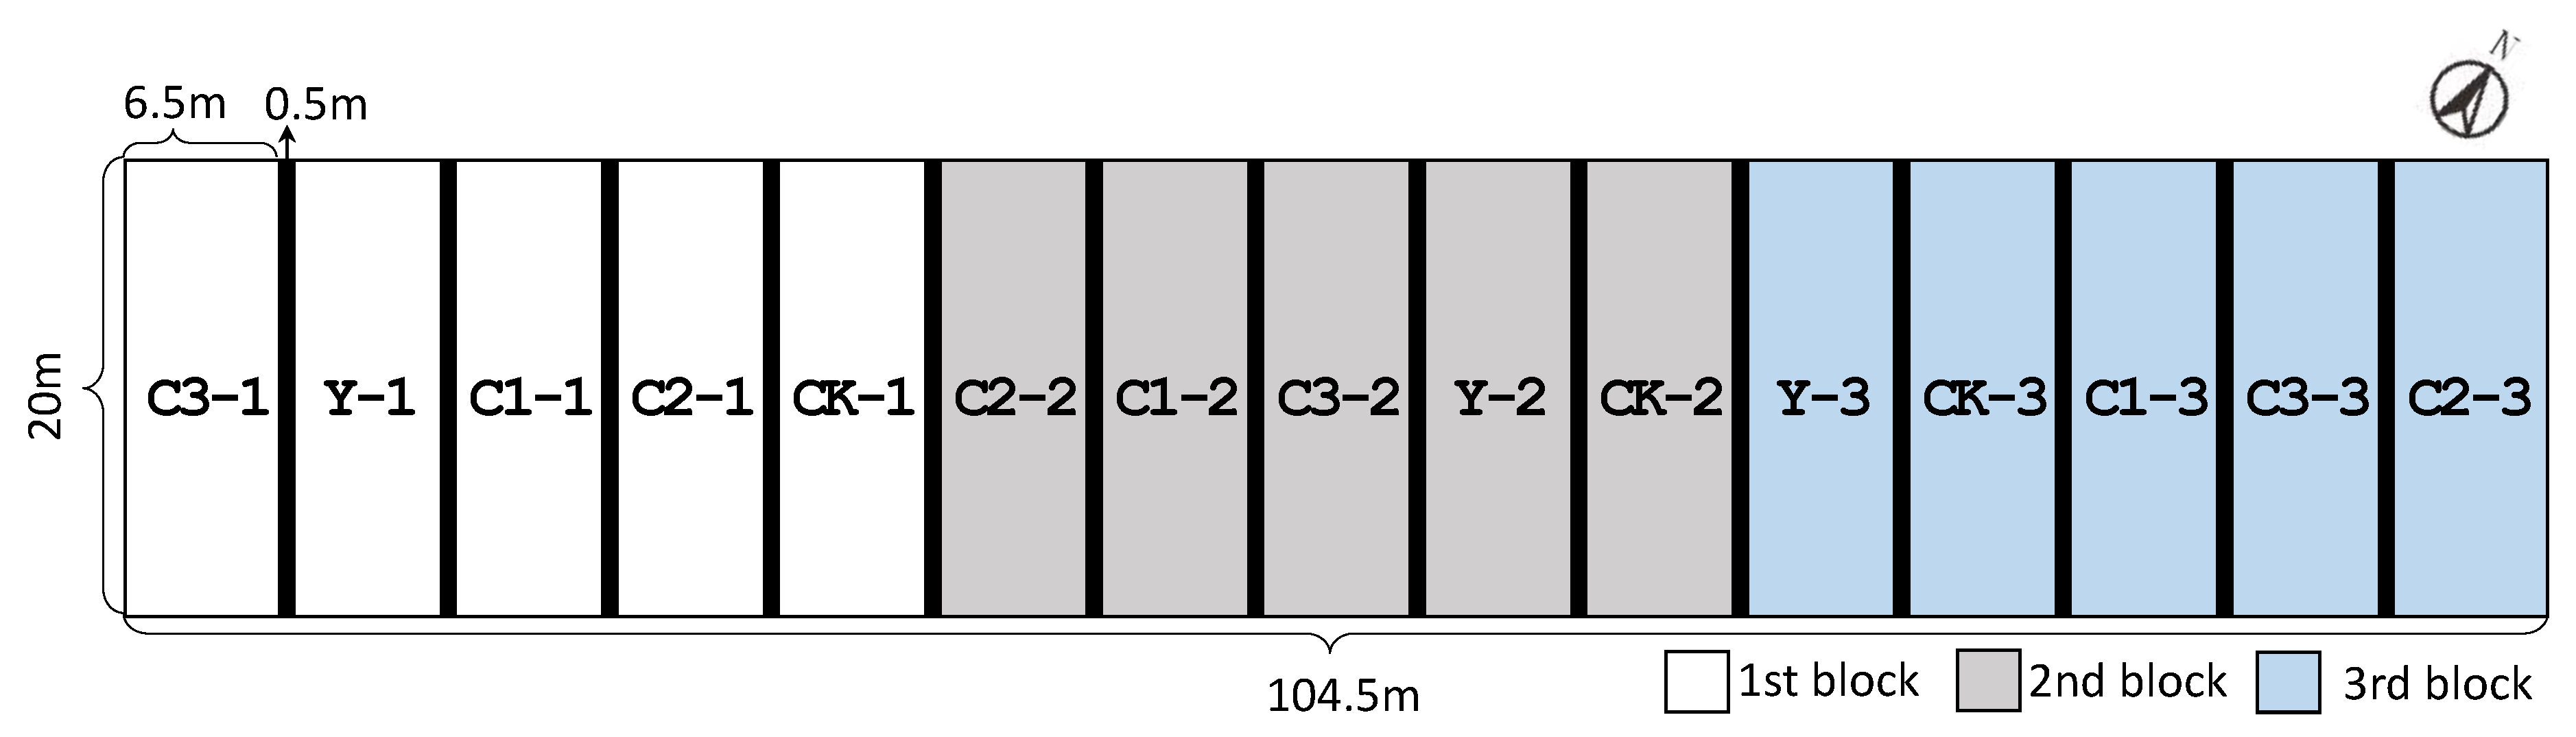
2.3. Set-Up of Field Trial

The study lasted for three years (2014–2016). Five treatments were set up according to different biochar application rates and modes, which were CK (0 t ha−1), C1 (7.5 t ha−1), C2 (15.0 t ha−1), C3 (30.0 t ha−1), and Y (3.00 t ha−1 year−1). Y was a treatment with the same amount of biochar addition year by year. For other treatments, biochar was applied at one time in the first year, and no biochar was added in the latter two years. The weighed biochar was spread evenly on the soil surface in each plot by hand using a tool, and then rototilling was carried out 2 times using the small tractor with rototiller to mix the biochar evenly with the soil.
Each treatment was repeated 3 times, randomized block design in 15 experimental plots (Figure 1). The total area of the field experiment was about 2090 m2, and each plot was 20 m long and 6.5 m wide. All plots were separated by a ridge with height of 20 cm and width of 50 cm.

2.4. Rice Variety and the Cultivation Conditions

The rice variety Yugeng65 adopted in this study is a typical japonica rice bred by conventional breeding. The cultivation and management methods were carried out according to the local production practice. The distances between each row and each plant were 30.00 cm and 16.67 cm, respectively. Each hole contained 3 rice seedlings. Chemical fertilizers used each year were N (115.38 kg ha−1), P2O5 (61.54 kg ha−1), and K2O (76,92 kg ha−1), respectively. Alternate drying and wetting irrigation regimes were adopted for all treatments.

2.5. Rice Sampling and Analysis

At physiological maturity (October in each year), the rice plant samples were collected. Specifically, in the middle of each plot, 20 consecutive rice plants were surveyed to obtain the “average number of spikes (ANS)”, which was assumed to be “n”. ANS represents the growth situation of rice in the plot. Then, three naturally growing rice plants with “n” number of spikes were sampled as representative plants of the plot. The rice samples were washed twice with running water and once with deionized water, oven-dried at 105 °C for 30 min, and then dried to constant weight at 80 °C. Thereafter, each plant was separated into 5 parts (root, stem and sheath, leaf, husk, and brown rice), and stored dry for subsequent analysis.
After being re-dried (80 °C, 24 h), dry matter weights of different rice organs (stem and sheath, leaf, husk, and brown rice) were measured (BSA4202S, Sartorius, Göttingen, Germany), and dry matter of root was not measured. The microwave digestion method for rice samples was carried out by the ETHOS A (Milestone, Sorisole, Italia) before Cd concentration determination. The dry sample to be tested was 0.2 g. HNO3 6 mL, HCl 2 mL, H2O2 (30%) 2 mL were added. Temperature program, room temperature, 5 min; 120 °C, 7 min; 160 °C 8 min; 190 °C 25 min. The solution to be tested showed light yellow color after digestion, heating to drive acid, at a constant volume. At the same time, a blank control was set up without the sample to be tested and only the reagents were added. Cd concentration in different rice organs (root, stem and sheath, leaf, husk, and brown rice) was determined by Graphite Furnace Atomic Absorption Spectrometry (AA7000, Shimadzu, Kyoto, Japan), according to the China National Food Safety Standard Determination of Cadmium in Food (GB 5009.15-2014) method for quality control by adding standard substance (1 mg L−1 CdCl2) and measuring the recovery rate; the recovery rate is controlled at 85–110%.

2.6. Soil Sampling and Analysis

The soil was sampled at harvest every year. The samples were taken from the arable layer (20 cm) using stainless-steel corer (the internal diameter is 5 cm). Each soil sample representing the plot was a mixture of 10 points within the plot taken by the corer according to “S” shape. After transfer to the laboratory, the soil samples were air dried at room temperature and ground before analysis. The ground soil was passed entirely through a 2 mm sieve, then a quarter was ground all through a 0.15 mm sieve, and small stones, roots, etc. were removed during the above process.
The Cd fractions in soil were measured using a modified Tessier sequential extraction [33,34]. Briefly, soil samples (2.0 g) were weighted into 100 mL centrifuge tubes. The sequential extraction processes involved 5 steps as follows: F1-F5 indicate exchangeable fraction, carbonate bound fraction, Fe-Mn oxide bound fraction, organic bound fraction, and residual fraction, respectively.
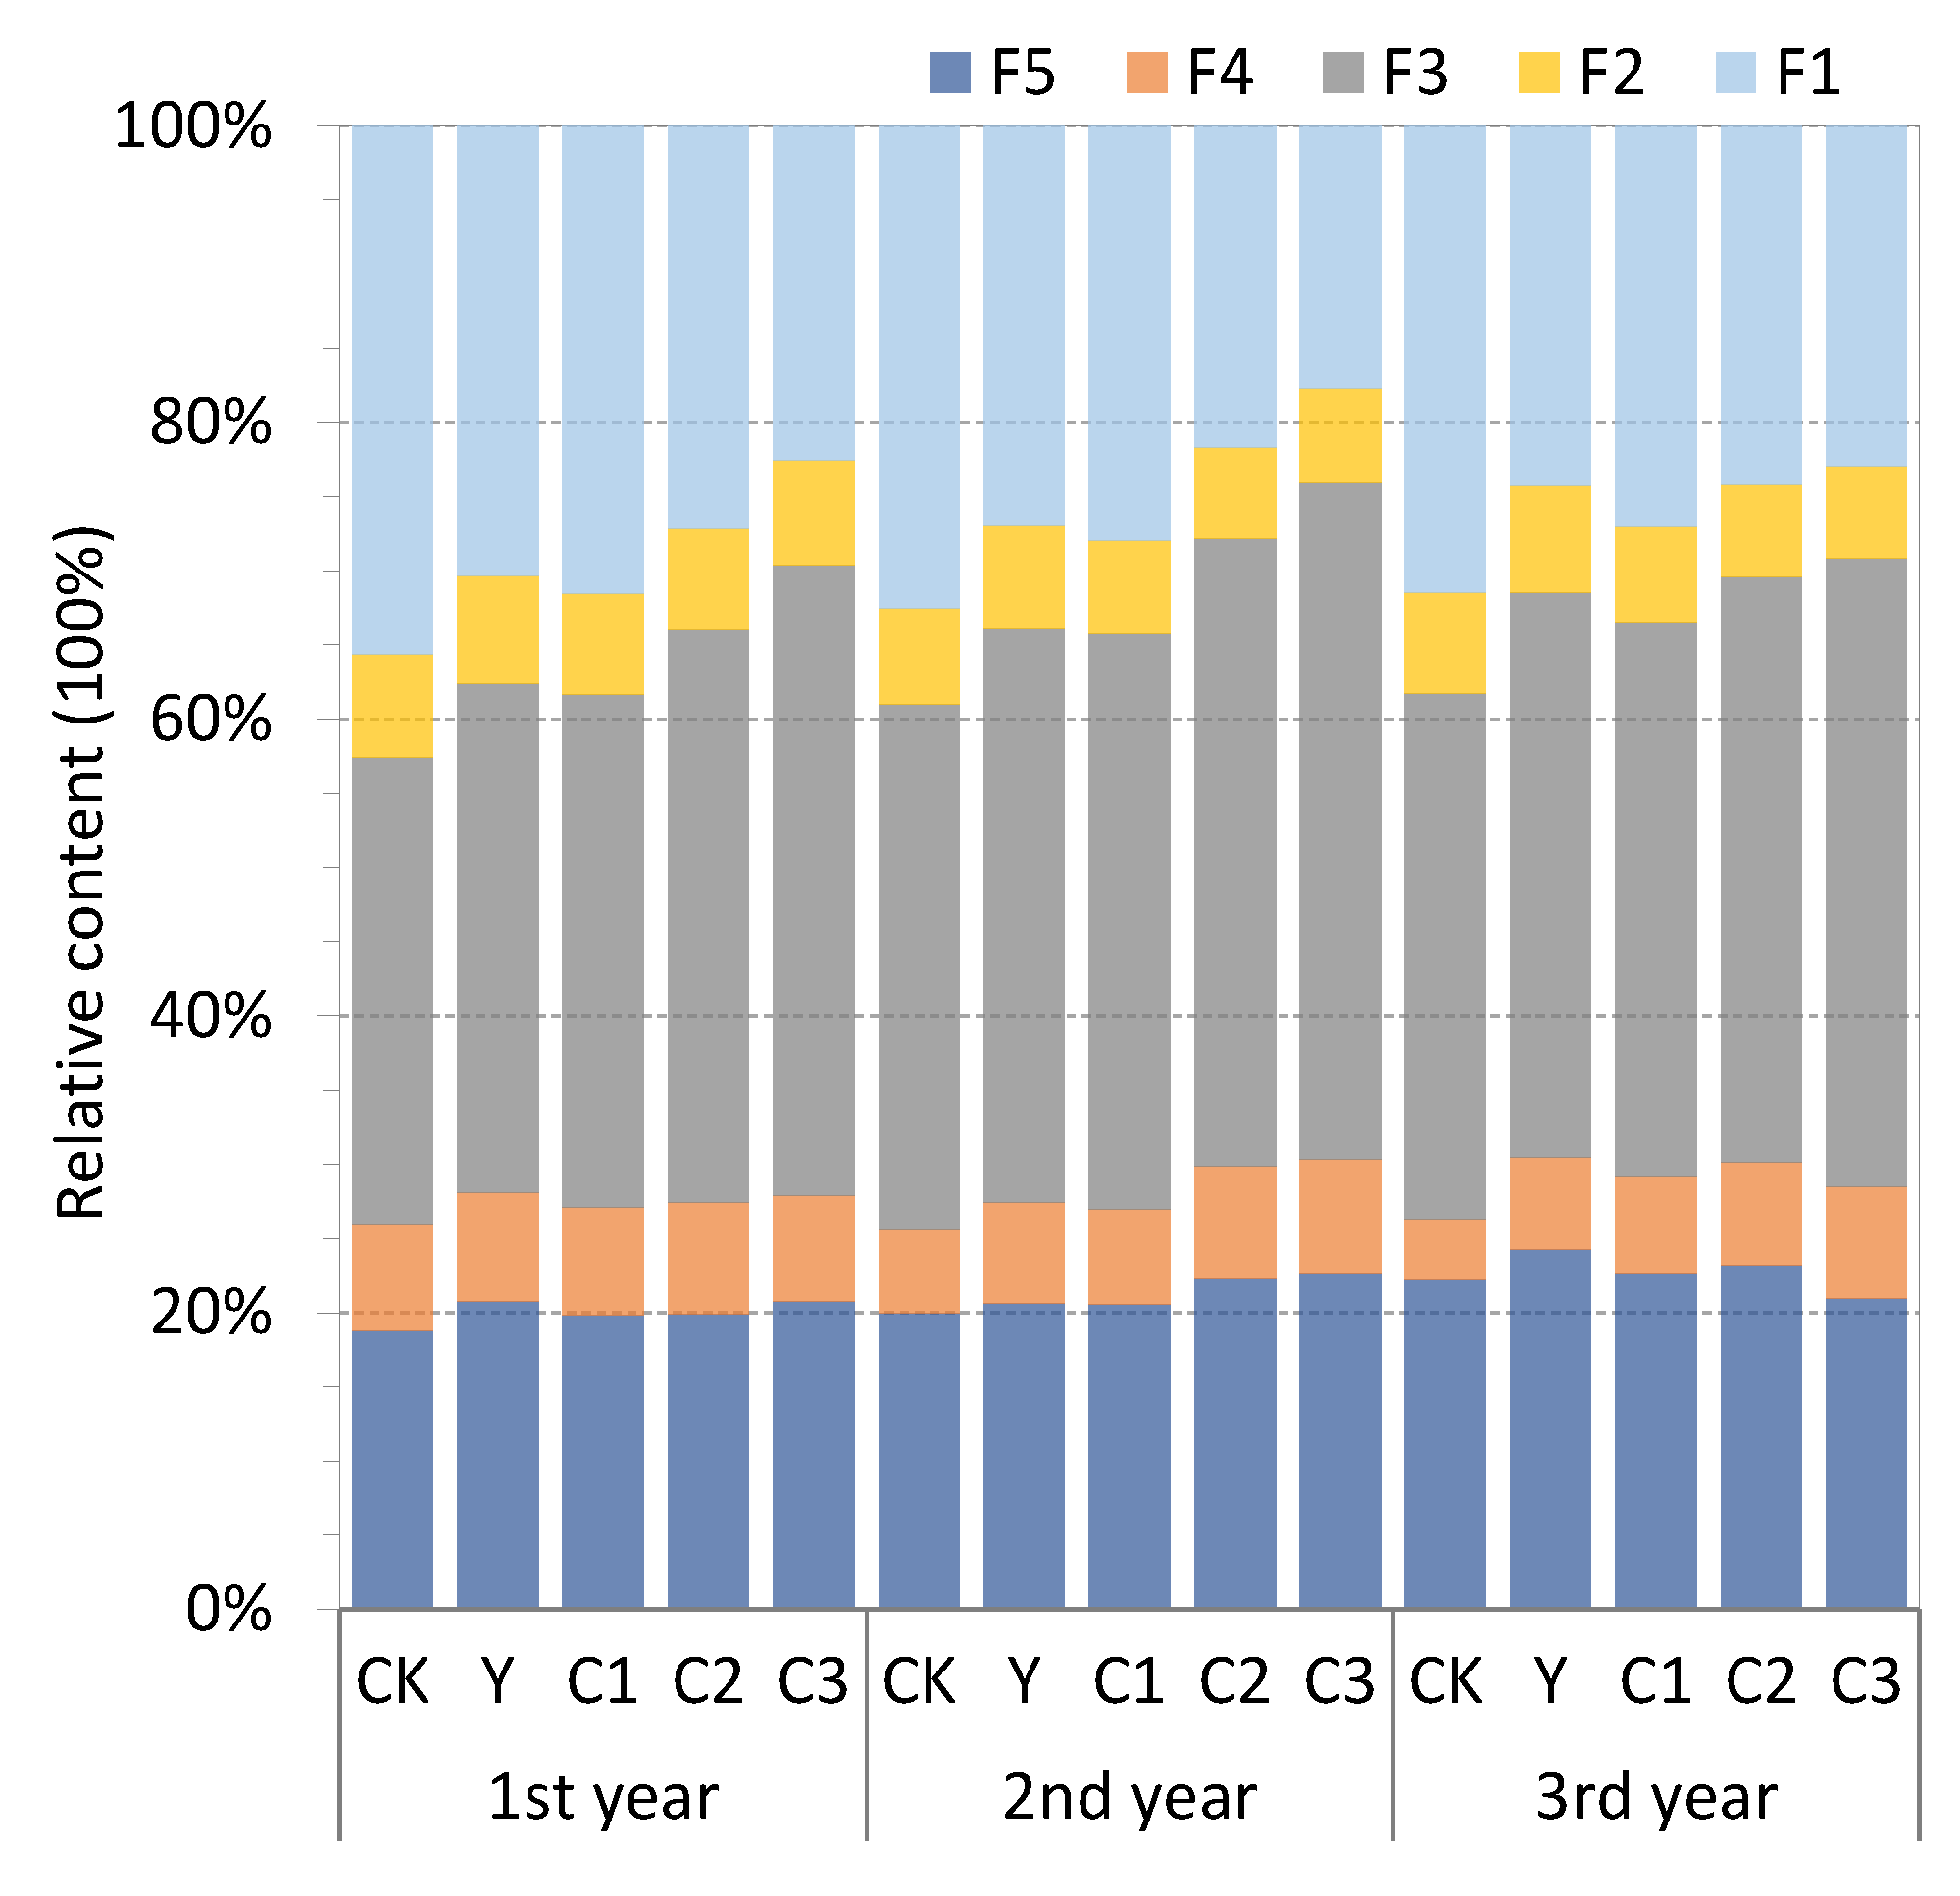
  • F1 (exchangeable fraction): 16 mL 1 mol l1 MgCl2 (pH = 7.0) at 25 °C for 2 h;
  • F2 (carbonate bound fraction): 16 mL 1 mol l1 CH3COONa (pH = 5.0) at 25 °C for 2 h;
  • F3 (Fe-Mn oxide bound fraction): 40 mL 0.04 mol l1 NH2OH·HCl and 25% CH3COOH (pH = 2.0) at 90 ± 3 °C for 5 h;
  • F4 (organic bound fraction): 6 ml 0.02 mol l1 HNO3 and 10 mL 30% H2O2 (pH = 2.0) at 85 ± 2 °C for 2 h, then 6 ml 30% H2O2 (pH = 2.0) at 85 ± 2 °C for 3 h, 10 mL 3.2 mol l1 CH3COONH4 and 20% HNO3 at 25 °C for 0.5 h;
  • F5 (residual fraction): mixture acid of HF-HNO3-HCl with digestion.
Following each extraction step, solutions were centrifuged for 20 min at 4500 rpm and the soils were washed with deionized water and centrifuged prior to the next extraction step. After pouring out the supernatant after centrifugation, it is necessary to wash the reagent residues from the previous extraction step in the centrifuge tube. These residual liquids contain the Cd extracted in the previous step, so the washing solution is also collected, together with the supernatant for the determination. Cd contents in the supernatants were measured by Graphite Furnace Atomic Absorption Spectrometry.
The determination methods of soil pH and SOC is the same as the part of soil background value.

2.7. Data Calculation

  • The translocation factor (TF) was calculated as TF (%) = (Cd concentration in the rice organs/Cd concentration in root) × 100%, the rice organs include: brown rice, husk, leaf, and stem and sheath [35].
  • The distribution factor (DF) is the percentage of Cd accumulation in different organs to the total accumulation in the acrial part of rice, and was calculated as DF(%) = (Cd accumulation in the rice organs/total Cd accumulation in acrial part) × 100%, the Cd accumulation in the rice organs was calculated as Cd concentration in the rice organs × the dry weight of the rice organs, and the total Cd accumulation in acrial part was the sum of each acrial rice organs.
  • The concentration factor (CF) was calculated as CF = Cd concentration in the rice organs ÷ Cd concentration in soils [35,36].
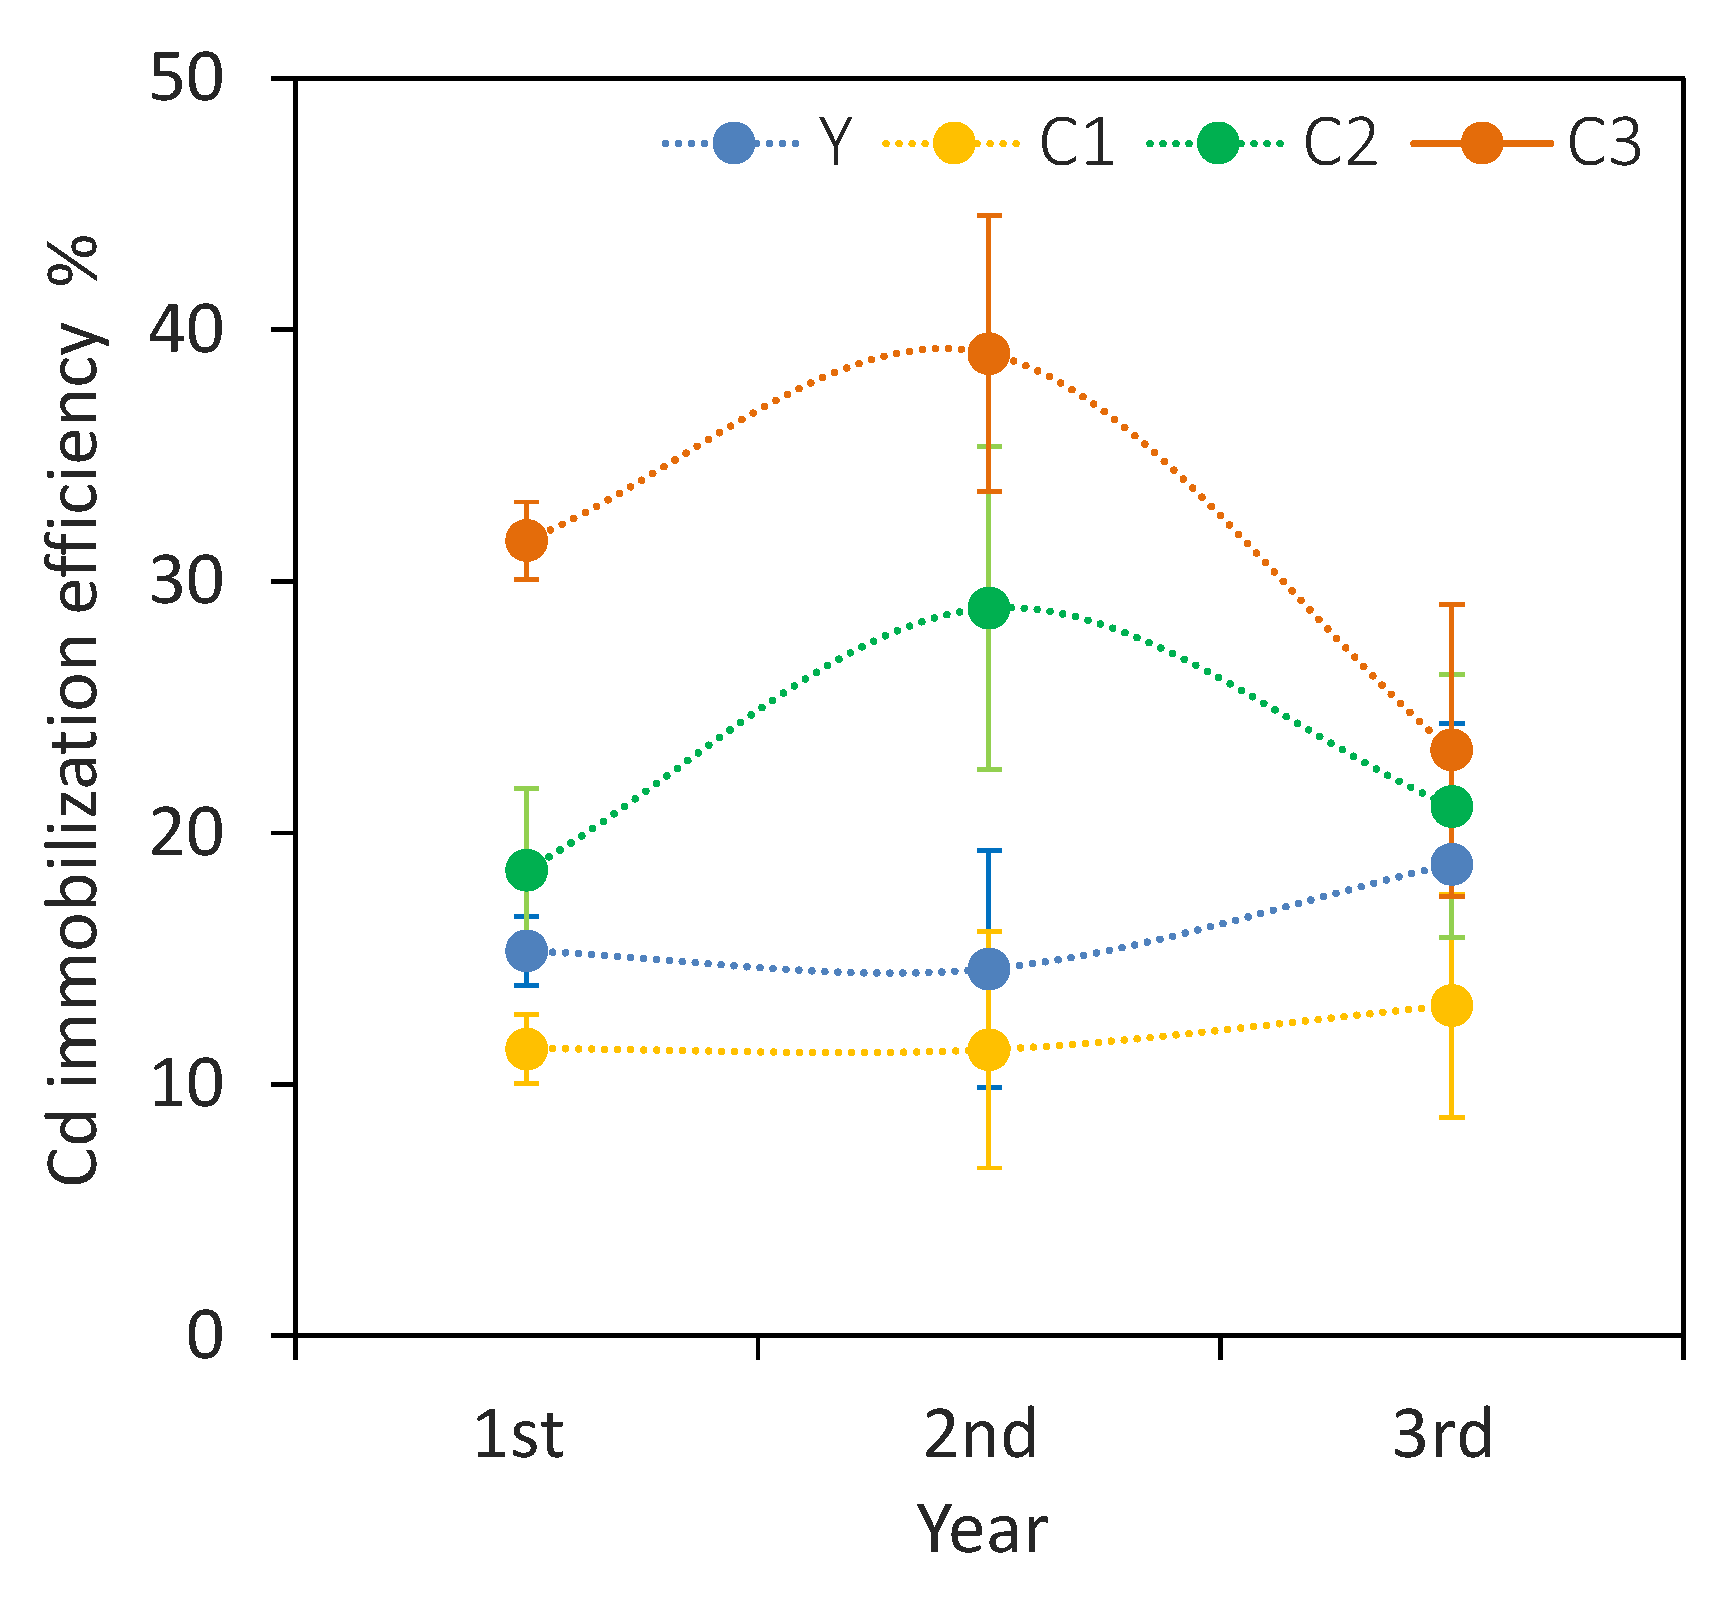
  • The soil Cd immobilization efficiency was calculated as Cd immobilization efficiency (%) = (1 − bioavailable Cd in biochar treatment ÷ bioavailable Cd in CK) × 100%, bioavailable Cd include F1 and F2, because both the exchangeable (F1) and carbonate (F2) bound fraction are available to plants [36].
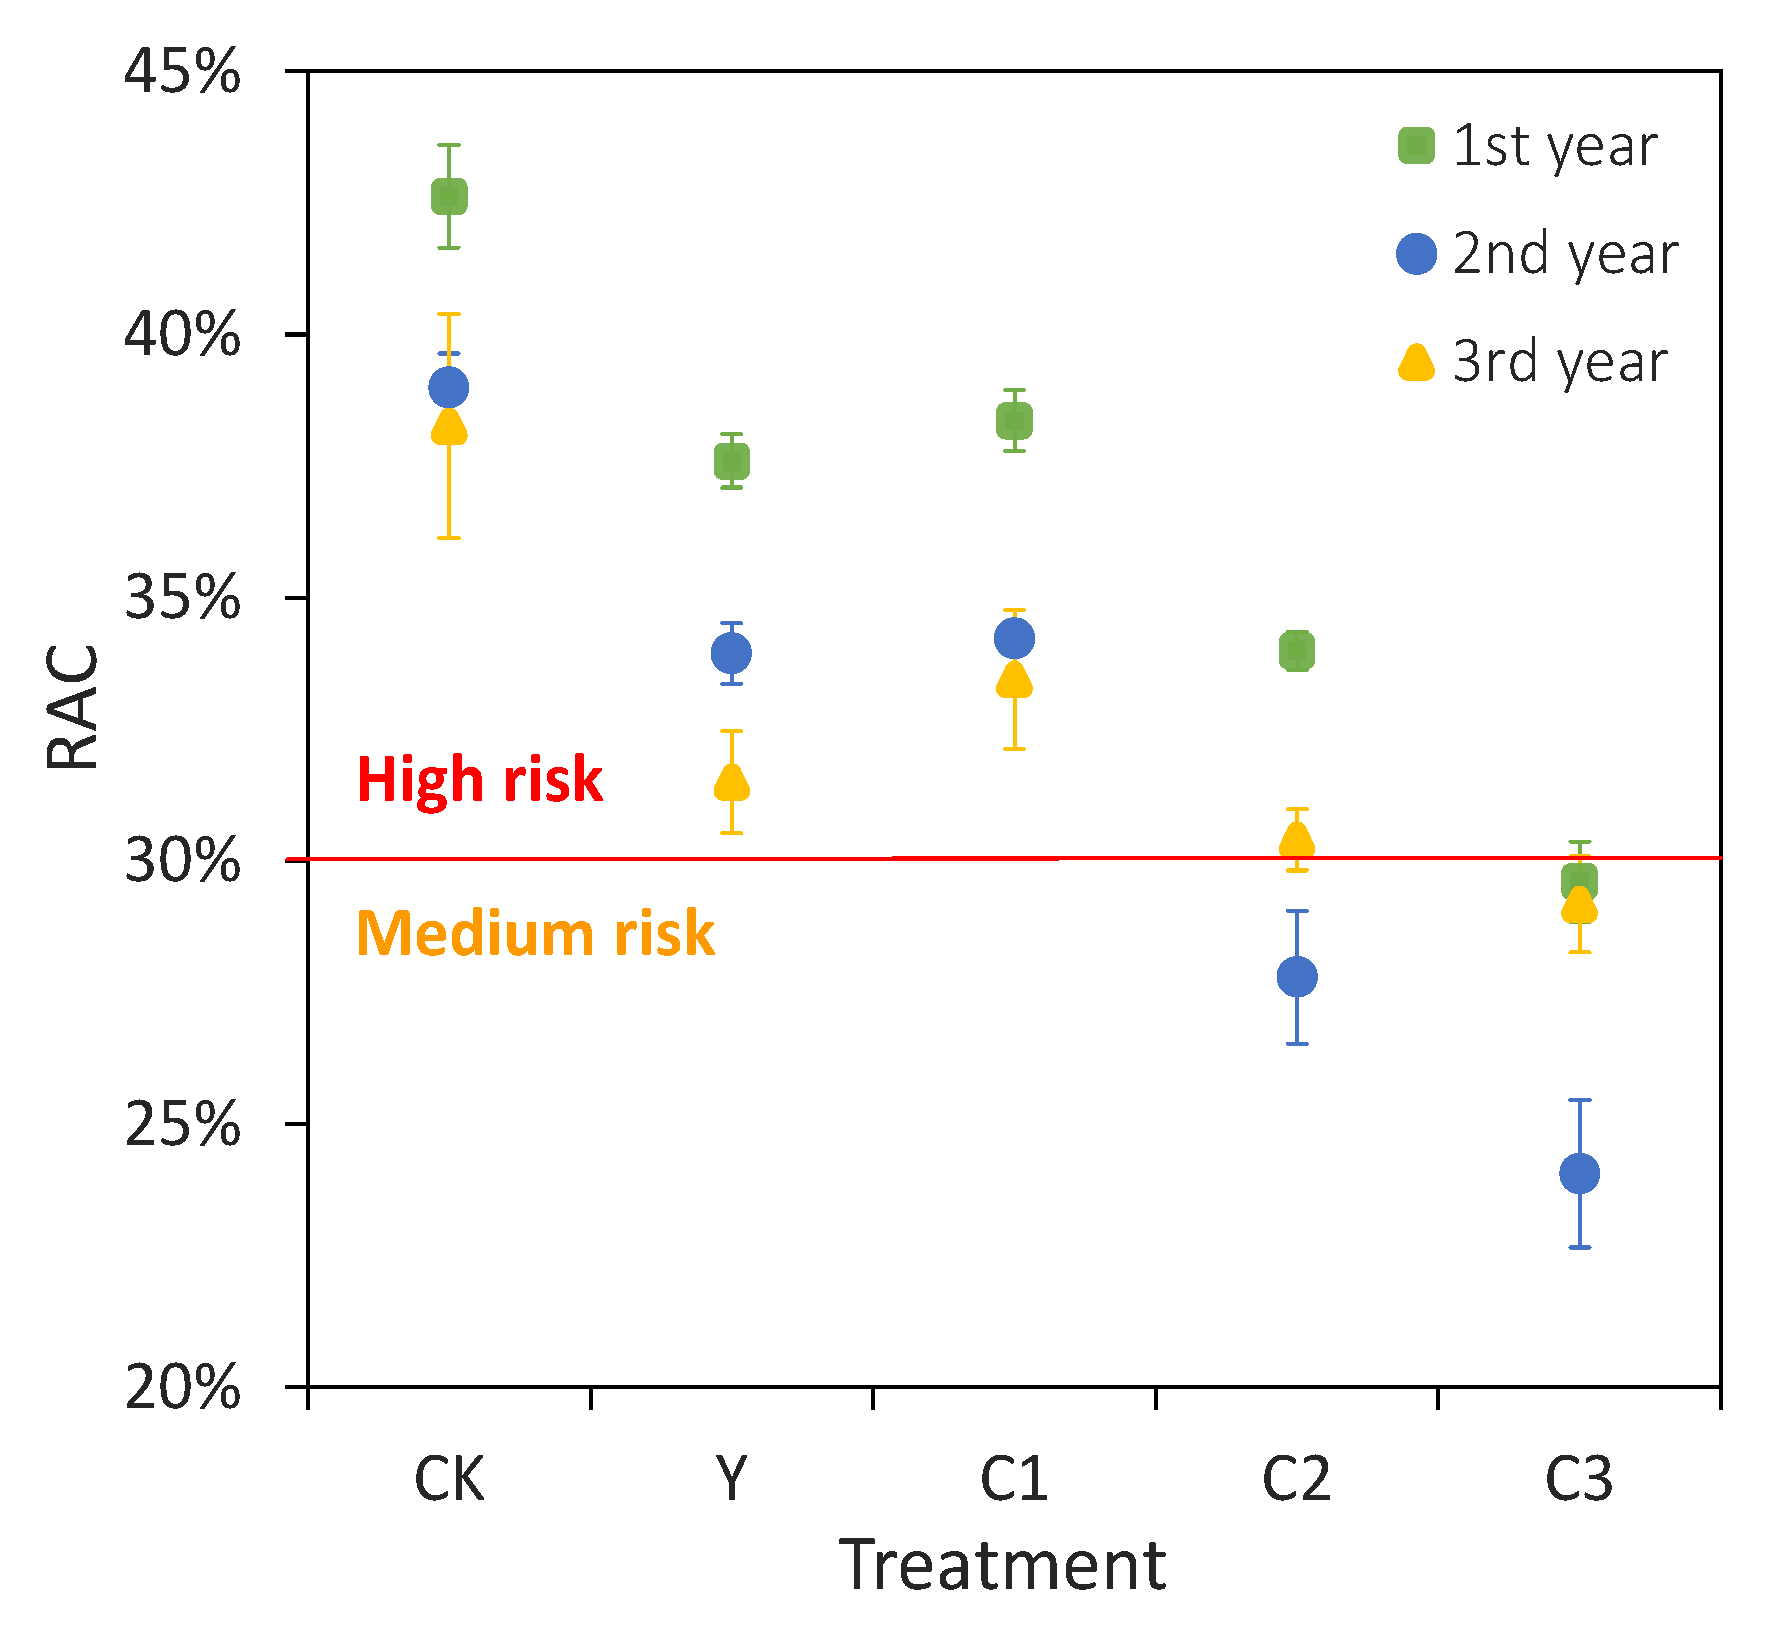
  • Risk assessment code (RAC) is a method presented by Perin et al. [37] for forecasting the environmental toxicity of sediment metal pollution. The RAC value is equivalent to the ratio of exchangeable (F1) and carbonate (F2) fractions to total content, and was calculated as RAC = (Cd content of F1 + Cd content of F2)/total Cd content in soil × 100%. RAC is generally divided into five risk levels: if RAC value < 1%, the soil is considered to be no risk to the environment, and low risk, medium risk, high risk, and very high risk are associated with RAC values of 1~10%, 11~30%, 31~50%, and >50%, respectively [38].

2.8. Statistical Analyses

Descriptive statistics were performed using Microsoft Excel 2013 and SPSS 20 software packages. One-way analysis of variance (ANOVA) was conducted to evaluate the differences among treatments; least significant difference (LSD) was applied to test significance between means. Prior to the ANOVA, the Shapiro–Wilks test for normality and Levene’s test for equality of variance were run. The correlations between Cd contents in rice organs and soil environmental factors were evaluated by redundancy analysis (RDA) in Canoco 5.1.

3. Results and Discussion

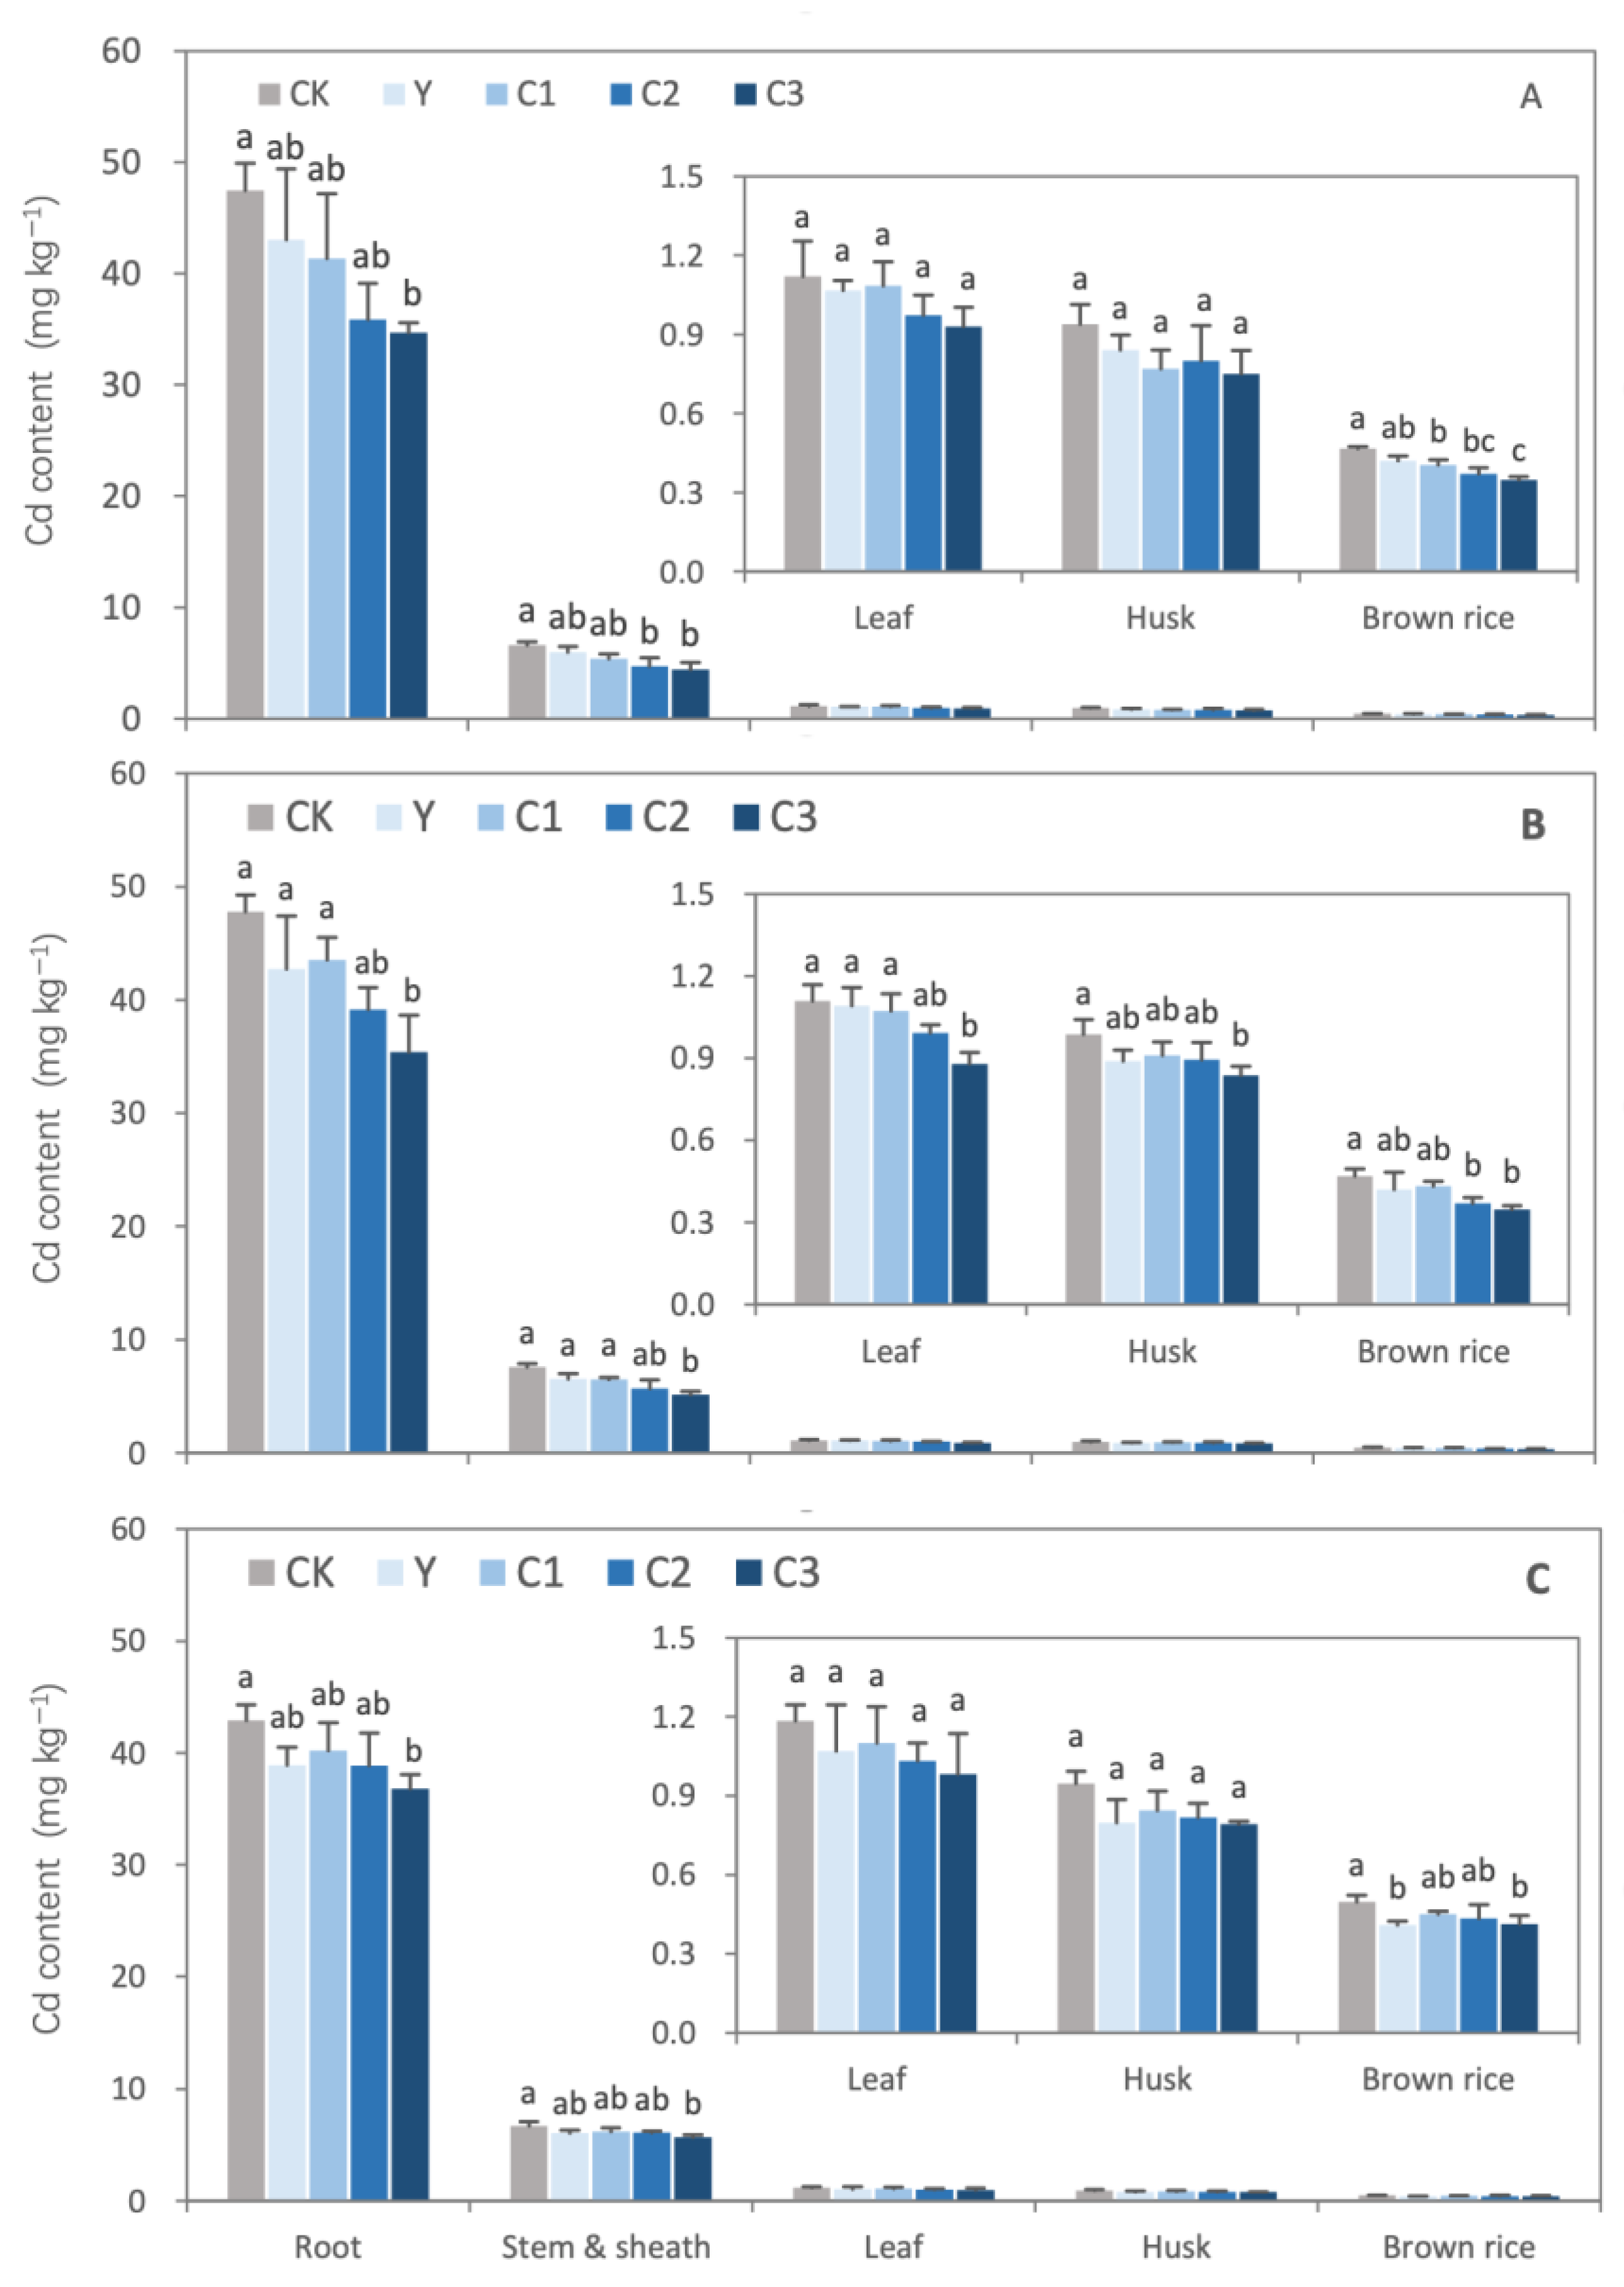
3.1. Biochar Influences on Rice Dry Matter Accumulation and Cd Content in Rice

Biochar treatments did not show significant promotion or inhibition on the dry matter accumulation of the japonica rice (Table 2). In the first year, compared with CK, the four biochar treatments all increased the dry matter accumulation of all rice organs slightly. In the second and third year, the dry matter accumulation of each rice organ was either increased or decreased, and no regular influence was found.
Although the dry matter accumulation results of each identical rice organ under biochar treatments had slightly higher or lower changes in the three years, none of the above differences reached a significant level (p < 0.05). A similar biomass effect of biochar was observed by Islam et al. [39], who found that in a pot experiment of rice cultivation on Cd and As contaminated soil amended by biochar, a 1% corncob biochar application slightly increased the biomass of root, shoot, and grain of rice, while a 2% biochar application reduced the biomass of root, shoot, and grain. However, the differences between the above two biochar treatments and the no biochar application control were also not significant. Yin et al. [40] noticed that the biochar application (20 t ha−1) had no significant effects on grain yield or yield components compared with the control in a two-year field experiment. Thus, although biochar is often considered as a soil amendment that could boost the crop yield [41], there are still some experiments that show biochar had no significant effect on crop growth [42]. The rice yield is related to the productivity of the experimental soil and the nutrients level carried by the biochar [43]. According to Jeffery et al. [44], biochar has, on average, no effect on crop yield in a temperate latitude, because arable soils in temperate regions are usually moderate in pH, higher in fertility, and generally receive higher fertilizer inputs, leaving little room for additional benefits from biochar. In this study, the paddy field selected was used to produce rice for many years and received large fertilizer inputs. As mentioned in part 2.1, the soil available nutrients and pH were suitable for rice cultivation; therefore, the soil and rice may be benefit from biochar nutrients relatively little. In summary, biochar had no negative effect on rice growth, and ensured the normal growth of japonica rice in a semi-humid temperate monsoon climate.
As shown in Figure 2, the Cd content of the root was much higher than those of other organs, the stem and sheath was the second, and the Cd contents of the other three organs (leaf, husk, brown rice) were relatively very low. The Cd content of each organ of rice under biochar treatment was lower than that of the control, and the higher the amount of biochar application, the lower the Cd content. Compared with CK, C3 significantly reduced the Cd contents in the brown rice, stem and sheath, and root in all years, and the Cd contents in the leaf and husk in the second year. C2 significantly reduced the Cd content in brown rice in the first two years. Y treatment significantly reduced the cadmium content in brown rice in the third year.
Previous field studies have shown that biochar could reduce the Cd content in the rice plant to different extents, and the factors affecting the reduction of Cd content in rice are complex, including biochar type, soil type, rice genotype, climate type, etc. Rice genotypes and climate types have received less attention in such field experiments than biochar and soil types [21]. Bian et al. [25] reported that 40 t ha−1 wheat straw biochar reduced the rice (O. sativa L. Indica) grain Cd to 0.44 mg kg−1 from 0.74 mg kg−1 in comparison with no biochar (soil total Cd 4.83 mg kg−1, southern China, subtropical monsoon climate); for every ton of biochar added to the soil per hectare, the grain Cd content reduced by 0.0075 mg kg−1. Bian et al. [27] also found that wheat straw biochar exerted a higher and sustainable reduction in rice (O. sativa L. Japonica) grain, shoot, and root content of Cd over three years, in comparison with no biochar; the Cd content in the grain, shoot, and root could be maximally reduced from 2.4 mg kg−1 to 1.25 mg kg−1, from 25 mg kg−1 to 12.5 mg kg−1, and from 52 mg kg−1 to 30 mg kg−1, respectively (soil total Cd 5 mg kg−1, southeast China, humid subtropical climate); for every ton of biochar added to the soil per hectare, the Cd content of the grain, shoot, and root reduced by 0.03 mg kg−1, 0.31 mg kg−1, and 0.55 mg kg−1,respectively. Chen et al. [26] found that wheat straw biochar (40 t ha−1) consistently reduced rice (O. sativa L. Indica) grain Cd over three rice seasons, and the Cd content in grain could be reduced to 0.46 mg kg−1 from 1.17 mg kg−1 in comparison with no biochar (soil total Cd 0.9 mg kg−1, southern China, subtropical monsoon climate); for every ton of biochar added to the soil per hectare, the grain Cd content reduced by 0.018 mg kg−1.
In the current study, during the three years, 30 t ha−1 biochar maximally reduced the Cd content of root, stem and sheath, leaf, husk, and brown rice by 12.77 mg kg−1, 2.47 mg kg−1, 0.23 mg kg−1, 0.19 mg kg−1, and 0.12 mg kg−1. This means that, for every ton of biochar added to the soil per hectare, the Cd content of root, stem and sheath, leaf, husk, and brown rice reduced by 0.43 mg kg−1, 0.08 mg kg−1, 0.008 mg kg−1, 0.006 mg kg−1, and 0.004 mg kg−1, respectively. Thus, by contrast, in the subtropical zone, the value of the Cd content in rice organs reduced by per ton biochar is relatively high. From the percentage point, in the subtropical zone, the reduction in Indica rice was generally above 50%, and the reduction in Japonica rice could also be more than 50%. In contrast, in the temperate zone, the percentage of Cd content in Japonica rice reduced by biochar was relatively low in this study, and the reduction was rarely more than 30%. This is in line with O’Connor et al. [21], who reported that the climate zone of the field trials correlates to the effectiveness of biochar on Cd enrichment in plant tissue, and the enrichment of Cd by plants is stronger in the temperate zone than in the subtropical zone, which is significantly related to both temperature and precipitation.
Although the enrichment of Cd by plants is stronger in the temperate zone than in the subtropical zone, the Cd contents of brown rice in the first year under C1, C2, and C3 treatments were 0.40, 0.37, and 0.35 mg kg−1, respectively, which all matched the CAC standard (<0.4 mg kg−1, CODEX STAN 193-1995). This confirmed the positive role of biochar on reducing Cd accumulation in Japonica rice in the present area [45]. However, in the second year, only C2 and C3 matched the CAC standard, which were 0.37 and 0.35 mg kg−1, and in the third year, no treatment met the standard. It can be seen that the effect of biochar on reducing Cd uptake and accumulation in rice was clear, but it showed a trend of decreasing with time. Meanwhile, none of the Cd contents of brown rice under biochar treatments matched the Chinese national standard for food safety which is not allowed to be higher than 0.2 mg kg−1 (GB 2762-2017). Therefore, it is necessary to further improve the consistent and significant Cd reducing effect of biochar on rice. Japonica rice is mainly cultivated in northeast China (temperate climate), and Japonica rice varieties with low Cd accumulation characteristics can be considered.

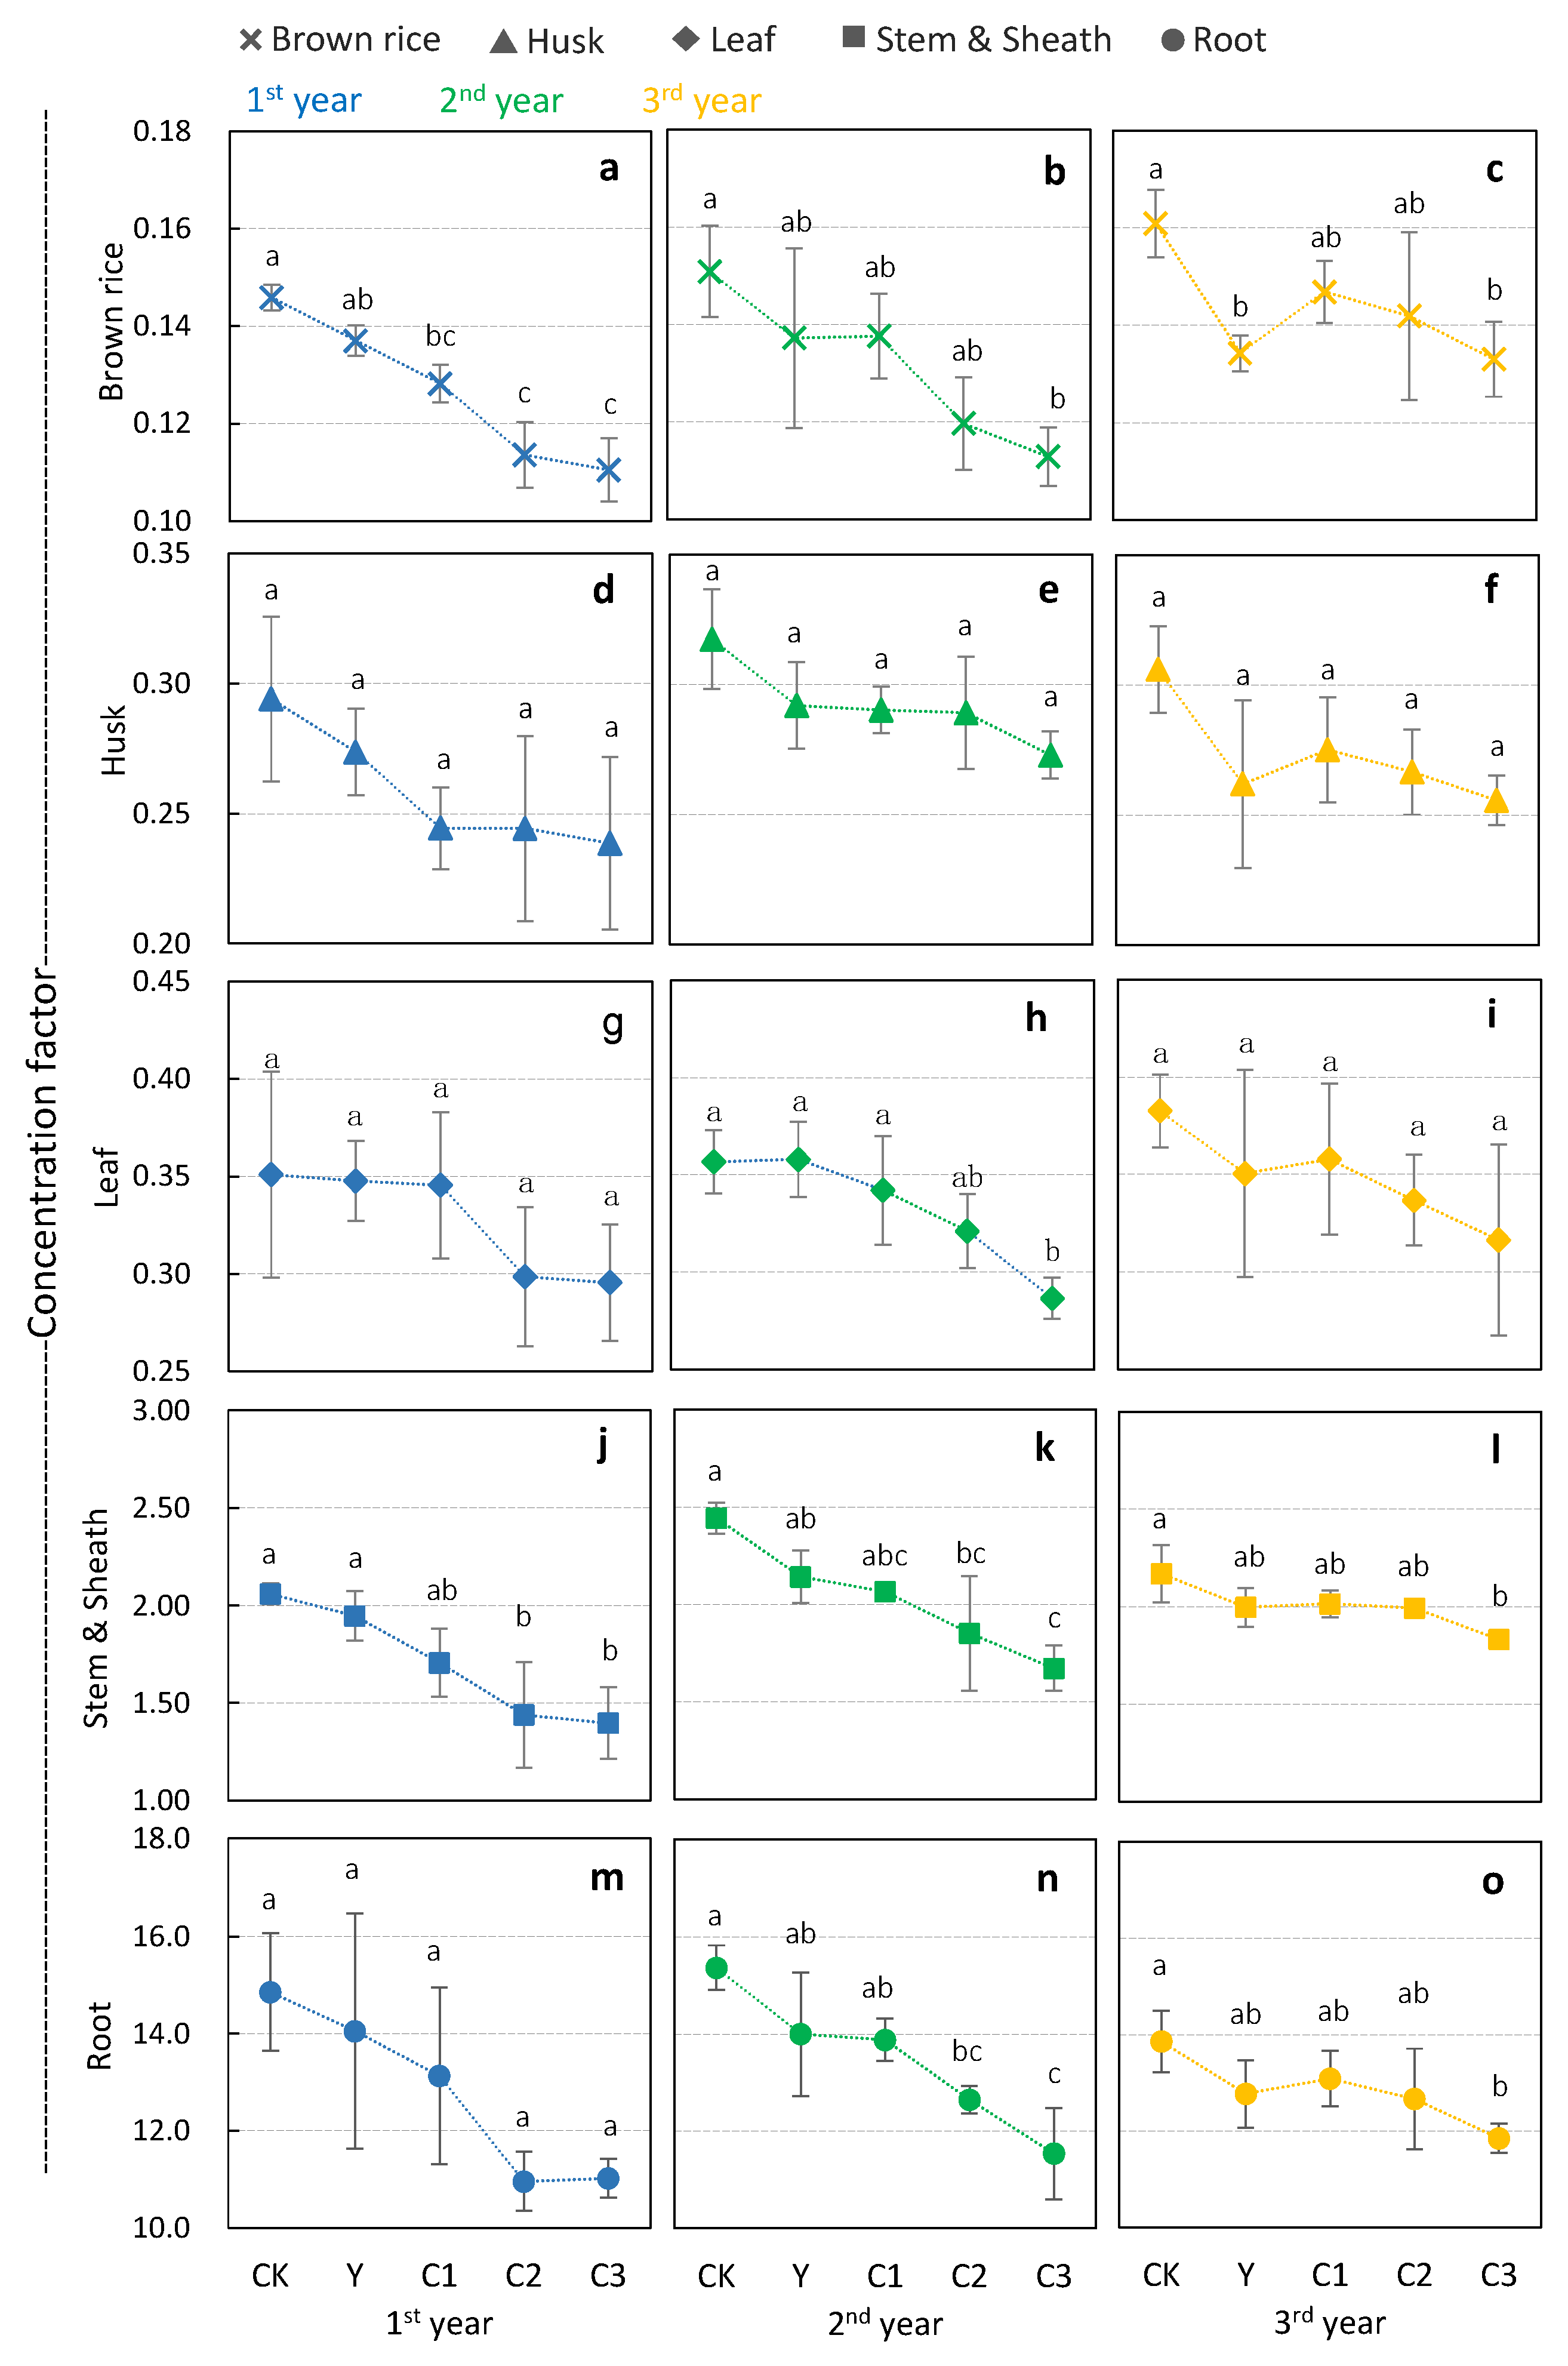
3.2. Impacts of Biochar on Cd Transportation, Distribution, and Concentration in Rice

TF, DF, and CF were used to analyze the characteristics of Cd transportation and accumulation in rice. The TF reflected the transportation of heavy metals from the root to the acrial organs. The DF reflected the distribution of the total amount of heavy metals accumulated on the acrial part in each organ. The CF reflected the concentration and enrichment of heavy metals by rice from the soil [35,36].
As shown in Table 3, in three years, the TFs of rice organs from high to low were stem and sheath, leaf, husk, and brown rice, and the TFs of stem and sheath were much higher than those of other organs. In the same year, for a specific rice organ or acrial part, biochar treatments influenced the TF slightly, and there was no significant difference with CK. Specifically, during three years under biochar treatments, the TFs of leaf ranged from 2.47% to 2.76% (CK ranged from 2.32% to 2.76%), the TFs of stem and sheath ranged from 12.73% to 15.81% (CK ranged from 13.95% to 15.89%), the TFs of brown rice ranged from 0.99% to 1.13% (CK ranged from 0.99% to 1.16%), the TFs of husk ranged from 1.89% to 2.29% (CK ranged from 1.98% to 2.21%), and the TFs of the acrial part ranged from 6.32% to 7.48% (CK ranged from 6.57% to 7.65%).
The DFs of rice organs from high to low were stem and sheath, leaf, brown rice, and husk, and about 85% of the Cd in the above ground part of the rice was distributed in the stem and sheath. In the same year, for a specific rice organ, biochar treatments influenced the DFs slightly, and there was also no significant difference in effect.
The CFs of rice organs from high to low were brown rice, rice husk, leaf, stem and sheath, and root. The CF of a certain organ decreased with the increase in biochar application basically (Figure 3). Compared with CK, in the first year, C2 and C3 significantly decreased the CFs of brown rice and stem and sheath; in the second year, C3 significantly decreased the CFs of brown rice, leaf, stem and sheath, and root; and in the third year, C3 significantly reduced the CFs of brown rice, stem and sheath, and root.
There was no significant change observed in TF and DF under the biochar treatments at different levels (Table 3), but significant reductions in the Cd CF of rice under biochar treatments were found. This indicated that, in this study, the reduction in Cd content in rice was mainly due to the decrease in the concentration process of Cd from soil to rice, and was less related to the transfer and distribution of Cd in rice. These results were similar to Li et al. [46], who found that a 2% biochar application had no significant influence on the Cd TFs (roots to grain), and the TFs (from roots to grain) under biochar treatments ranged from 3.5% to 4%, but reduced the concentration factor significantly. Jing et al. [47] also reported that TFs (from roots to shoots) of Cd, As, and Zn were all not affected significantly by the wheat straw biochar amendments (at the rates of 0, 10, 20, 30, and 40 t ha−1), and the TFs (from roots to shoots) under biochar applications ranged from 5% to 58%. These results were mainly because TF was related to rice varieties [48], and the application of biochar alone may have a limited effect on the physiological process of Cd transportation and distribution in rice [46,49], but was likely to change the Cd fractions in soil and reduce the Cd bioavailability, thus reducing the Cd concentration factor from soil to rice [21,45].

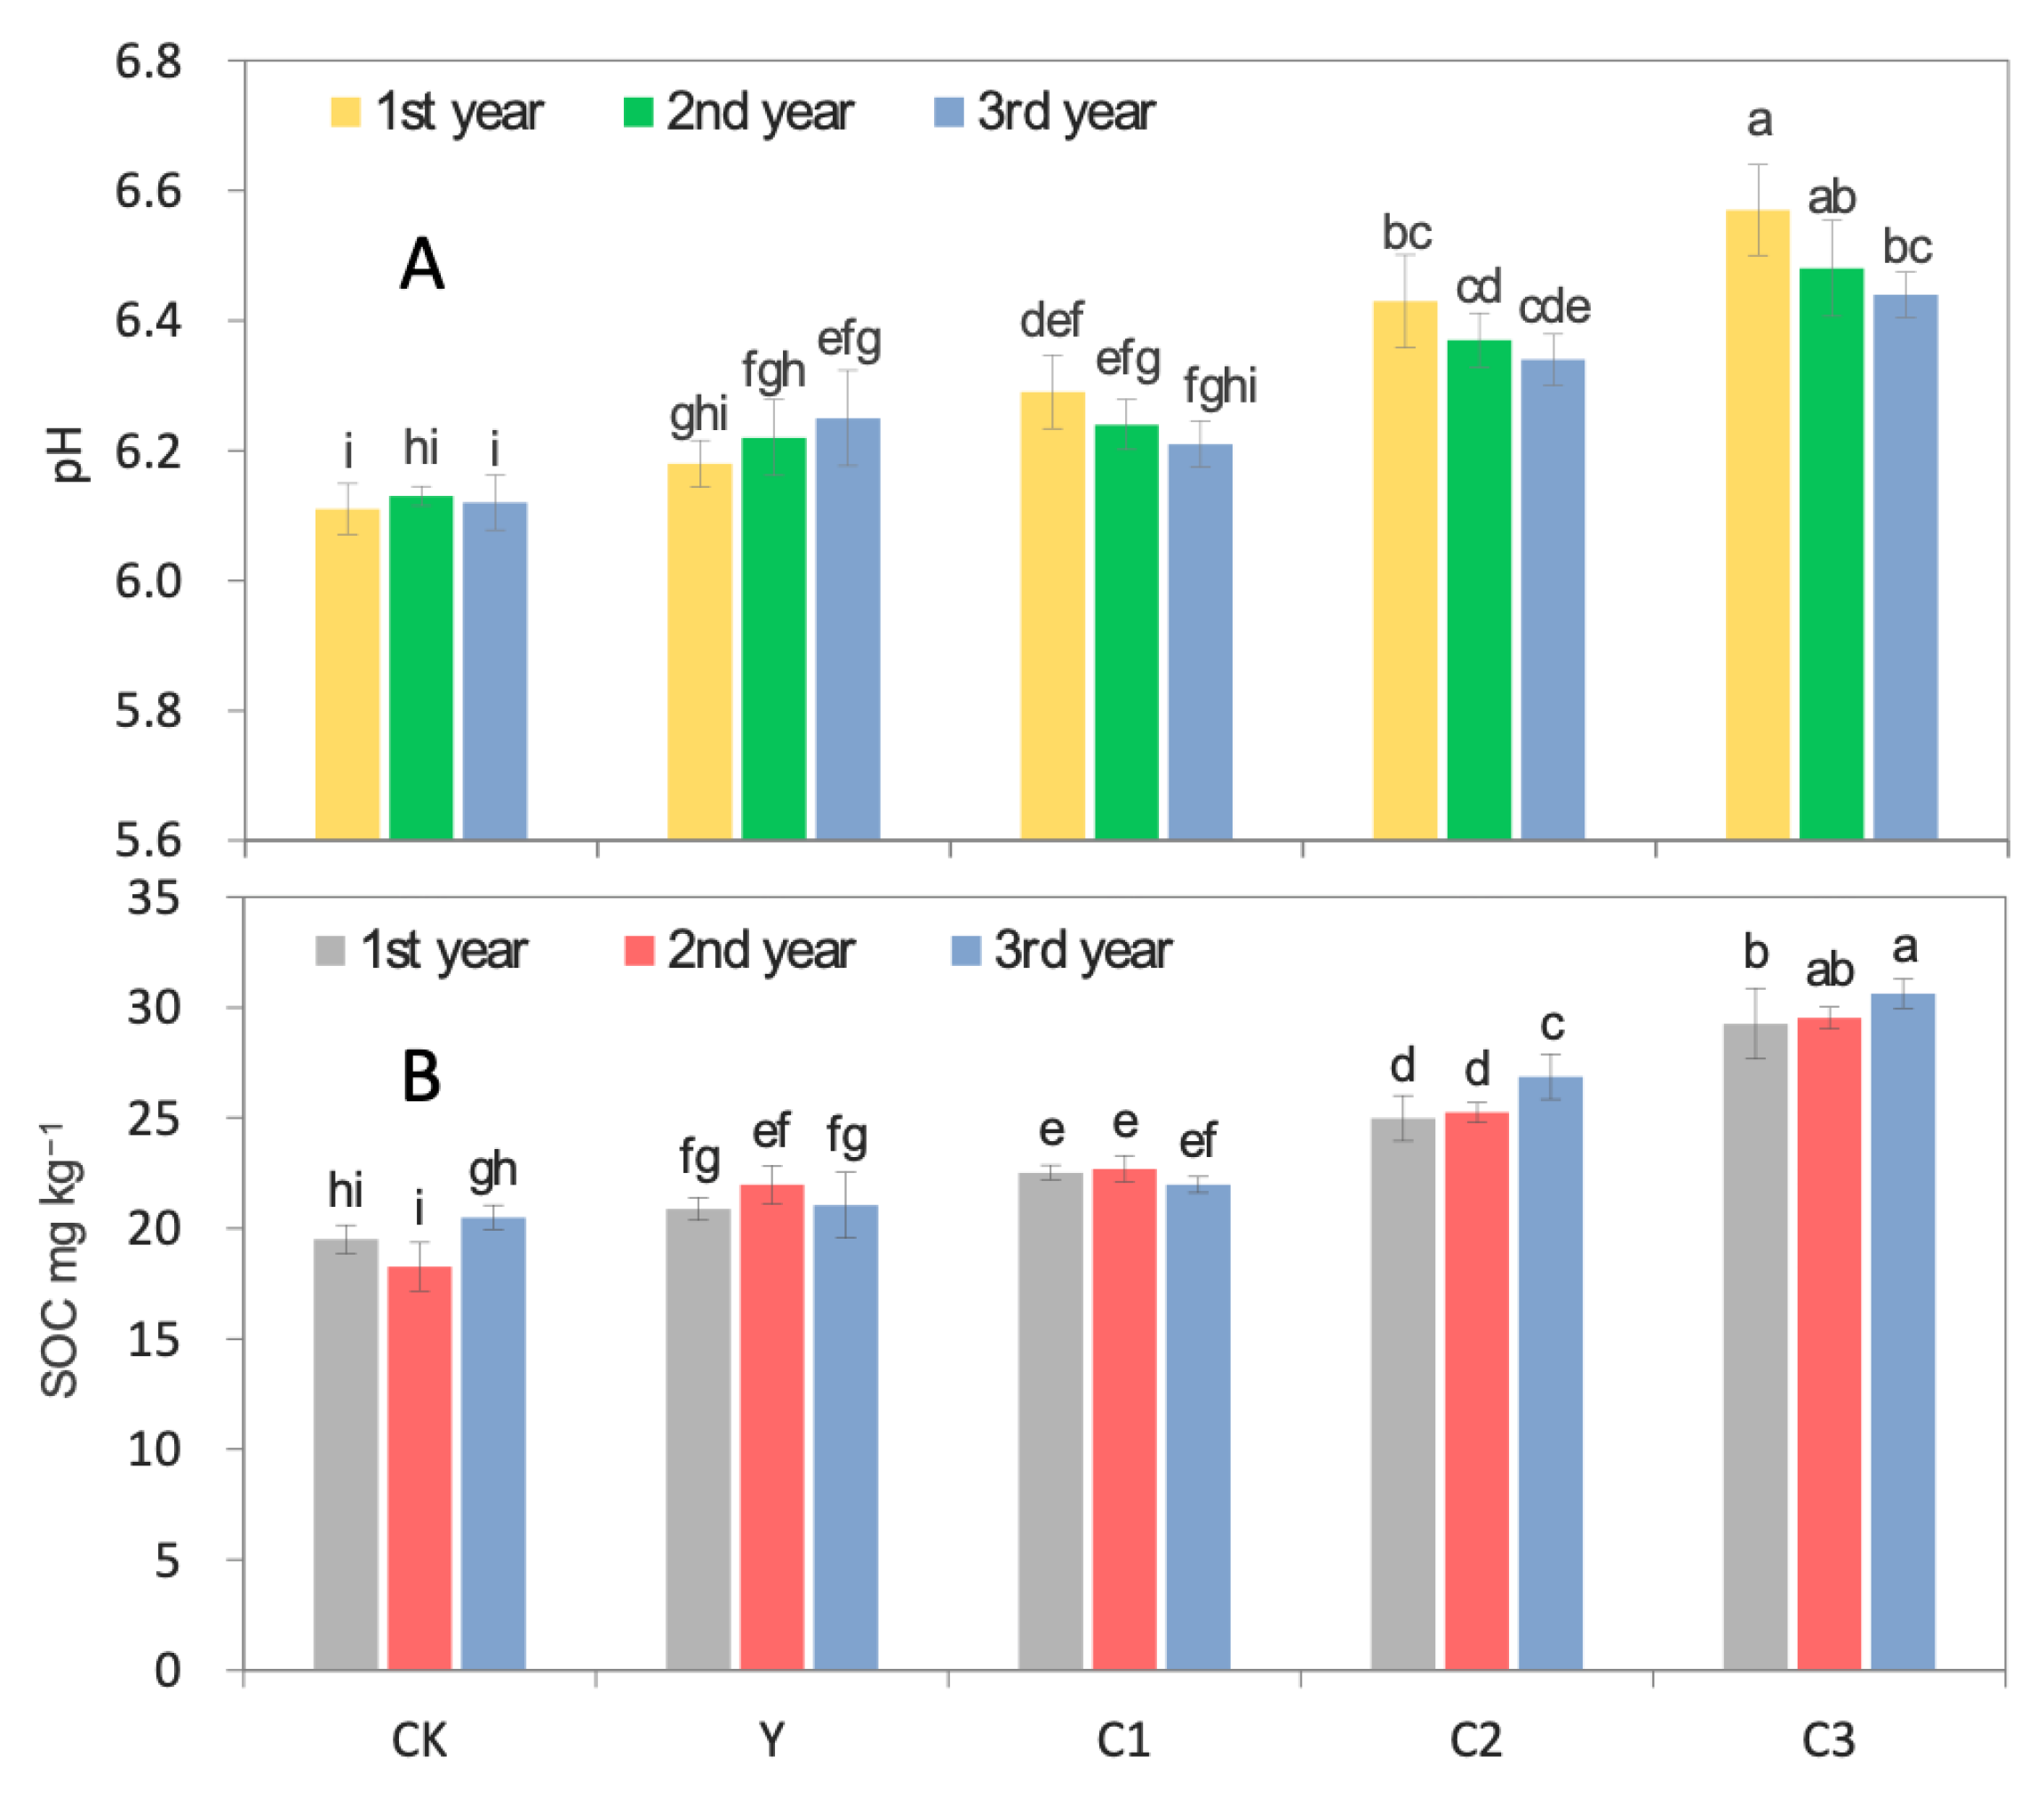
3.3. Biochar Influences on Soil pH and SOC

The influences of biochar on soil pH are given in Figure 4A. In the first year and the second year, the results of the soil pH of treatments C1, C2, and C3 were significantly higher than that of CK, and the differences between them all reached a significant level. In the third year, the soil pH of C1 was higher than that of CK, but the difference was not significant. The soil pH values of C2 and C3 were significantly higher than C1, and the soil pH of C3 was still higher than that of C2, but the difference was not significant. With the continuous addition of biochar year by year, the soil pH of the Y treatment gradually increased, which was significantly higher than that of CK in the third year. The soil pH of C1, C2, and C3 all decreased gradually over three years. Especially, the pH values of both C2 and C3 in the third year were significantly lower than those in the first year. The soil pH of C1 treatment also decreased, but there was no significant difference in three years.
The influences of biochar on SOC are given in Figure 4B. In general, similar to the previous studies, SOC increased with the increasing application of biochar. In the three years, the SOC of C1, C2, and C3 was significantly higher than that of CK, and the difference between them also reached a significant level. The SOC results of the Y treatment with increasing biochar dosage year by year did not increase all the time, but showed a slight decrease in the third year after increasing in the second year. However, there was no significant difference in the SOC results in the three years of Y treatment, and the situation of C1 treatment was similar to Y. The SOC of C2 and C3 increased gradually with the continuation of time, and the SOC of C2 in the third year was significantly higher than that of the first two years, and the SOC of C3 in the third year was also significantly higher than that of the first year.

3.4. Biochar Influences on Cd Fractions in Paddy Soil

For the relative contents of different Cd fractions (Figure 5), the percentages were higher for F1, F3, and F5, and lower for F2 and F4, in general. In three years, with the increase in biochar applications, the relative contents of F1 decreased gradually, while the proportions of F3 increased gradually.
As shown in Table 4, C1, C2, and C3 all significantly decreased F1 content in three years, and the Y treatment also decreased in the last two years. Biochar treatments had no significant effect on the Cd content of F2. C3, C2, and C1 were able to significantly increase the F3 content in different years. C3 increased F4 content significantly in three years, while the other biochar treatments only increased F4 in the third year. C2 and C3 increased F5 content in the second year.
In the previous field experiments, the application of biochar could transform the bioavailable part of Cd into more stable fractions in soil [25,27,50]. According to Cui et al. [51], for instance, who conducted a five-year field experiment and found that in both wheat and rice seasons, the readily soluble mineral form (exchangeable fraction) of Cd in biochar-amended (40 t ha1) paddy soil was primarily transformed into the carbonate, organic, and residual states, which were more difficult to be taken up by plant. Meanwhile, the redistribution of Cd fractions in soil is usually suggested to be associated to the changes in soil properties, such as pH and organic matter content [52]. In the current study, one of the most obvious changes in Cd fractions in soil was the decrease in F1 and the increase in F3. Fe-Mn oxide bound Cd is essentially a combination of Cd and Fe, Mn, Al, and other metal oxides [53], and its formation is closely related to the change in soil pH [54]. The increase in pH inhibited the reduction and dissolution of iron oxides, and increased the quantity of negative charges on the soil colloid surface, which could enhance the adsorption of Cd in soil [55]. In this study, the other positive change in Cd fractions in soil was the increase in F4 by year. Biochar exhibits an enormous potential in markedly enhancing SOC stocks over a long term, and the increase in organic matter promotes the formation of organic bound Cd and improve the stability of Cd in soil [56]. Therefore, it is reasonable to assume that the changes in soil pH and SOC may be the major indicators for the reduction of mobility and bioavailability of Cd in soil by biochar in the current study.

3.5. The RAC and Biochar Immobilization Efficiency

The risk assessment code (RAC) was adopted in this work to further assess the eco-risk of Cd in soil after biochar application (Figure 6), and RACs were obtained through the calculation of the results of Cd fractions. The RAC of CK was 38%~43% in three years, which belongs to the high-risk category (31~50%). The RAC of Y was 31%~38%, and the RAC of C1 was 33%~38%. The RACs of Y and C1 were lower than that of CK, but they were all at high risk. The RAC of Y and C1 decreased year by year. The RAC of C2 was 34% in the first year, which was 9% lower than that of CK, but it was still at high risk. In the next two years, the RAC of C2 treatment was at a medium risk (28% and 30%). The RAC of C3 was 24%~30% in three years, which belongs to the medium-risk category (11~30%) all the time. The RAC of C2 and C3 decreased in the second year and then increased in the third year, so the lowest RAC of C2 and C3 were both in the second year.
The RAC is usually used to assess the potential risk of heavy metals in soil to the environment [38]. Some studies have used this method to evaluate the risk of heavy metals in biochar [57], but there are few studies that use RAC to evaluate the risk of heavy metals in soil after biochar addition. Sarmaha et al. [58] conducted a field study and assessed the risk of Cu, Mn, and Zn in soil after the application of tea pruning litter biochar (TPLBC), and found that, although the TPLBC was enriched in Cu, Mn, and Zn, the RAC values of all three metals fell within the medium-risk region irrespective of all treatments, suggesting that the application of TPLBC does not have any adverse effect on soil. In the current study, all biochar treatments reduced the RAC value of Cd in soil. The medium- and high-dose biochar treatments demonstrated the ability to reduce the risk of Cd in soil from high risk to low risk. In particular, a high-dose biochar treatment (40 t ha−1) always kept the risk of Cd in soil at the medium-risk level for three years.
The Cd immobilization efficiency of different treatments in three years is shown in Figure 7; the Cd immobilization efficiency was generally that C3 was higher than C2 which was higher than C1 in three years, but the trend of the immobilization efficiency of different treatments was different. The immobilization efficiency of C2 and C3 increased in the second year and then decreased in the third year, the immobilization efficiency of C1 was 11.41~3.13% and basically stable in three years, and the immobilization efficiency of the Y treatment which was added year by year showed a steady increase. In the third year, the immobilization efficiency of C2, C3, and Y were all close to about 20%. The Cd immobilization efficiency of biochar was all above 10%, and C3 reached 39.05 ± 5.49% in the second year, which was the highest immobilization efficiency of all treatments.
Although some studies have verified the immobilization efficiency of biochar on Cd in soil in the past few years [27,59], long-term field studies are still necessary to evaluate the immobilization efficiency of biochar under natural farmland soil conditions [2,60]. In this 3-year field study, three points are noteworthy in the results of the changes in Cd immobilization efficiencies in soil influenced by biochar (Figure 6). First, the immobilization efficiency of the medium and high doses (C2, C3) of biochar increased gradually in the first two years, but decreased significantly in the third year, while the immobilization efficiency of the low dose biochar (C1) was always basically stable in the three years. Previous studies observed that the immobilizing effect of biochar can persist for three or more years [48], which is consistent with the results of this study. As for the fluctuation of the Cd immobilization efficiency of biochar over time, it is justified in part that the aging of biochar and long-term burial can lessen the ability of biochar to interact with Cd [61]. Second, the immobilization efficiency of biochar increased gradually with time when a small amount of biochar was added year by year (Y). Xing et al. [61] suggested that biochar amendment can lower the bioavailability of Cd in the soil, depending on the freshness and aging of the biochar. Gradually adding fresh biochar may be an effective way to resist the aging of biochar in the field. Third, although the cumulative application dose of Y in the first two years was lower than C1, the immobilization efficiency of Y was always higher than that of C1. That is, the Cd immobilization efficiency of biochar does not always increase linearly and gradually with the increase in the amount of biochar. This is similar to the finding of Wang et al. [62], which is that the Cd immobilization efficiency of 10% rice straw biochar was lower than that of 5%. Therefore, the effects of biochar on the immobilization efficiency of Cd in soil over different times and dosages are relatively complex, and the in-depth mechanisms need further research in the future, but the immobilization effect of biochar on Cd bioavailability is clear in the current field environment.

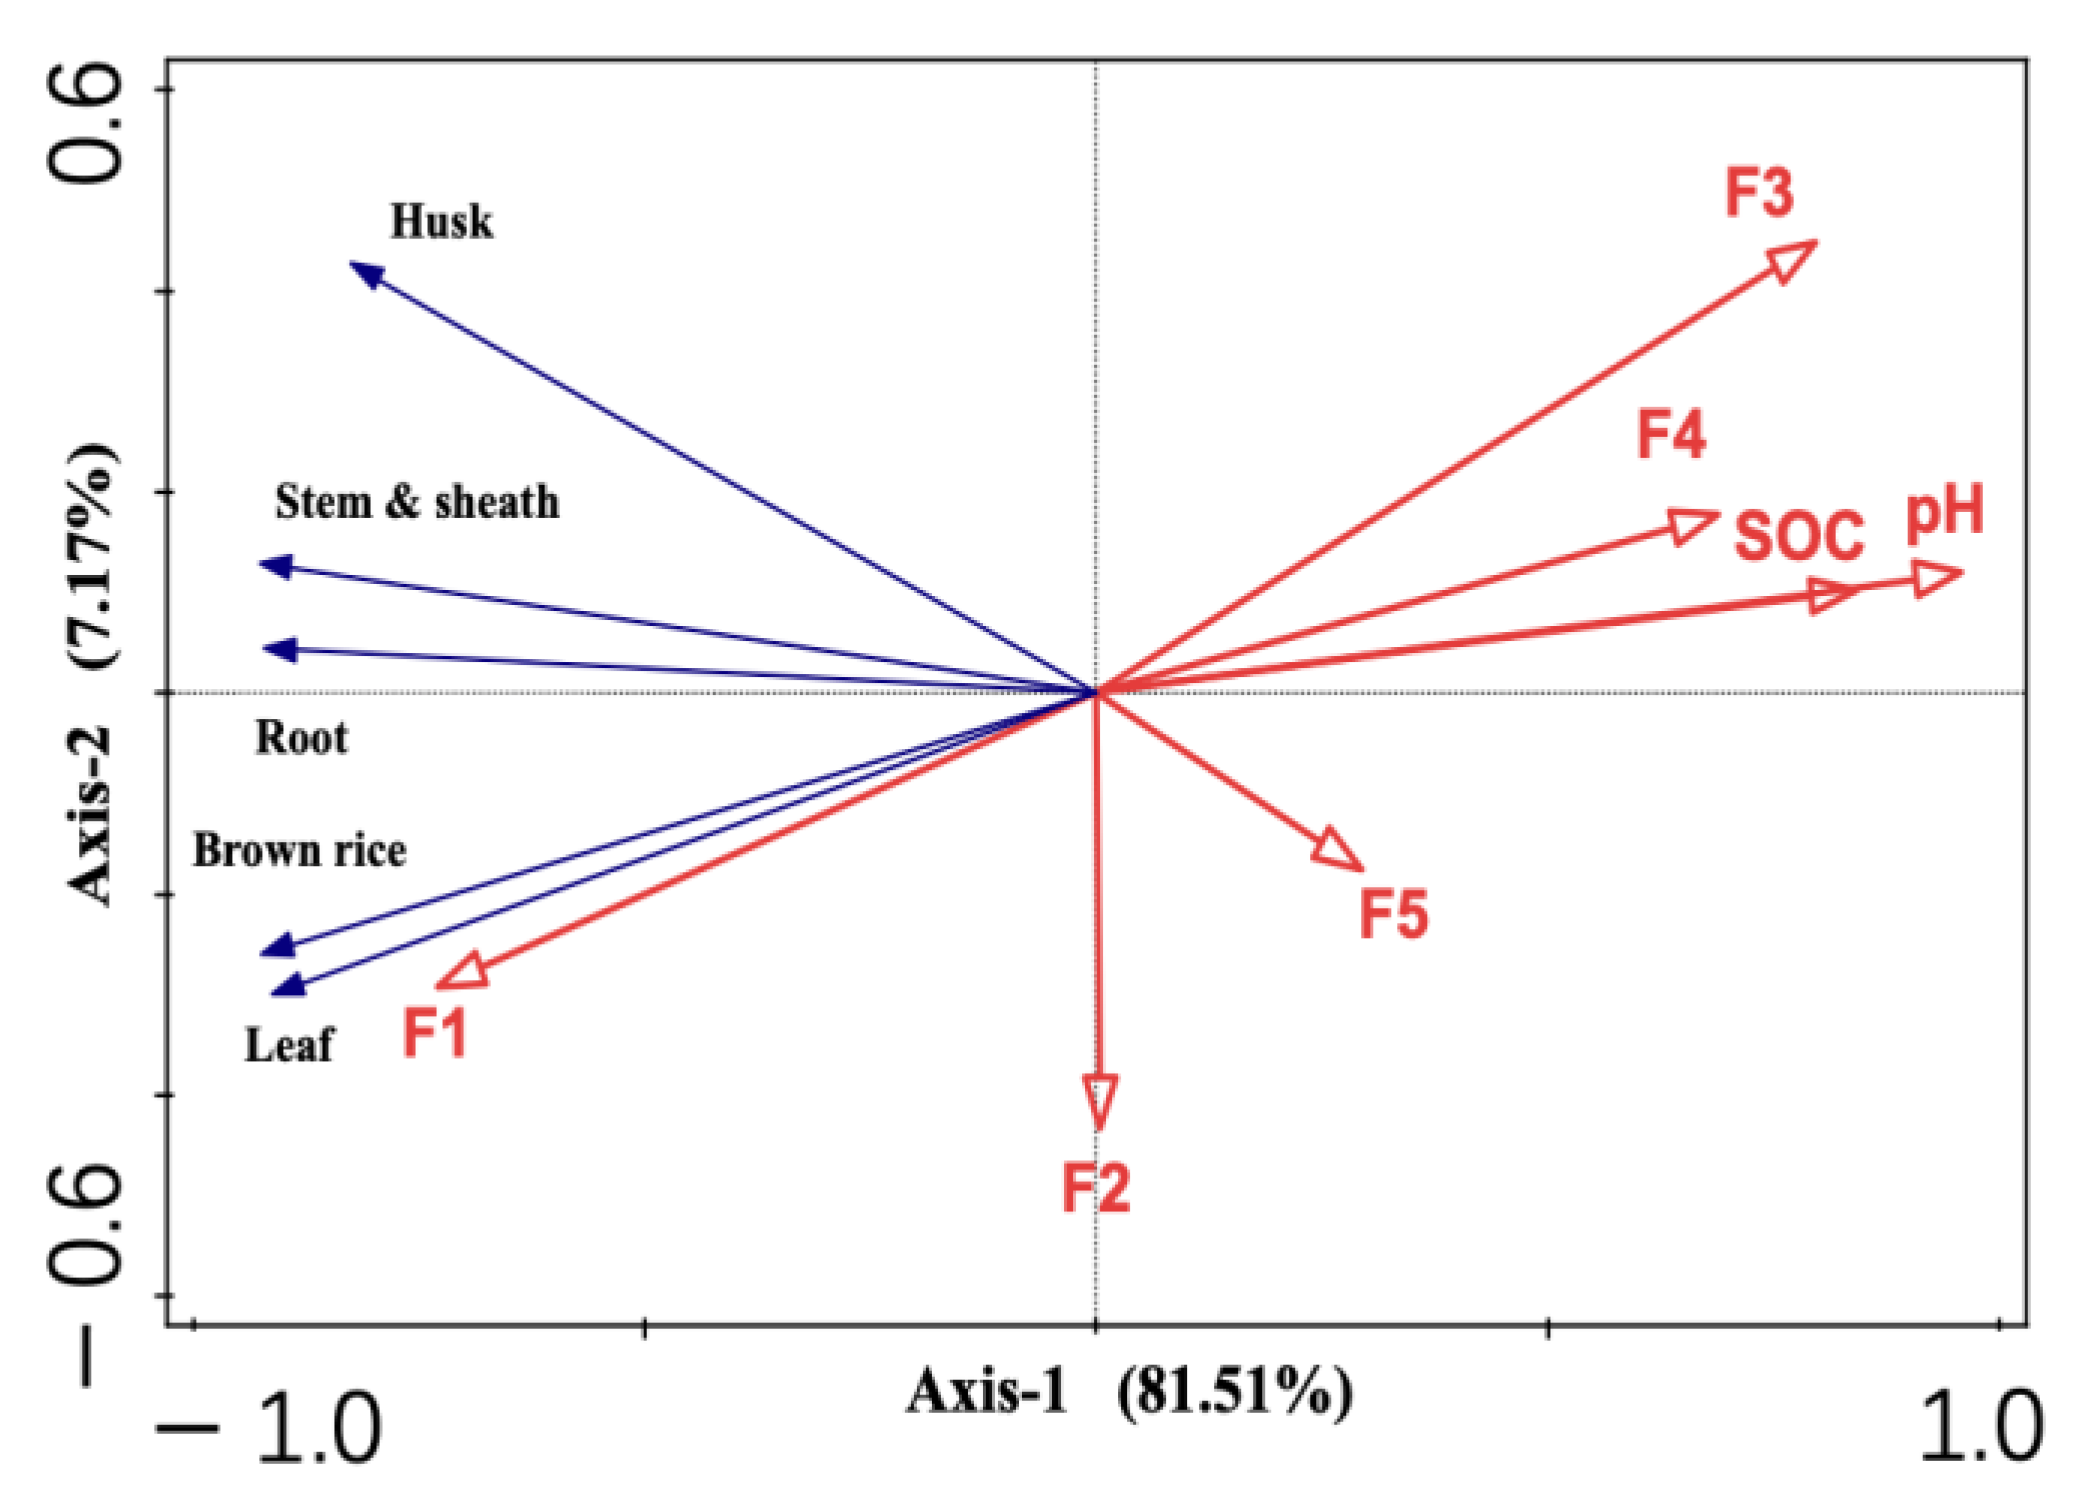
3.6. Correlations between Cd Contents in Rice and the Soil Environmental Factors

The first two axes of RDA explain the variance between the Cd contents in rice and the soil environmental factors in Figure 8, which are 81.51% and 7.1%, respectively. The length of the red arrow indicates the influence of soil factors on the Cd contents in rice, and its direction is related to the coordinate axis. As shown in Figure 8, F1 is positively correlated with all Cd contents in rice organs; F2 is positively correlated with the Cd contents in leaf and brown rice, but negatively correlated with Cd contents in other organs; and the pH, SOC, F3, F4, and F5 are negatively correlated with all Cd contents in rice organs. The selected environmental variables could account for the 93.5% variation of Cd contents in rice. The Cd contents variation explained by soil environmental factors is reduced as follows: pH > F3 > F5 > F4 > F2 > F1 > SOC. RDA confirmed that the soil pH (F = 38.9, p = 0.002) and Cd content of F3 (F = 4.6, p = 0.008) in soil were the most important contributors to the variation in Cd content in rice plants and accounted for 80.2% and 7.4% of the variation, respectively.
As noted above (Figure 5, Figure 7), the formation of Fe-Mn oxide bound Cd is closely related to the change in soil pH [54], and the increase in pH inhibited the reduction and dissolution of iron oxides, and increased the quantity of negative charges on the soil colloid surface, which could enhance the adsorption of Cd in soil [55]. The increasing of soil pH and Fe-Mn oxide bound Cd caused by biochar application is the main explanation for the redistribution of Cd in soil, which then caused a series of influences, such as reducing Cd uptake in rice and reducing the risk of Cd in soil. Based on the above results (Figure 9), some hypotheses of cost-saving and synergic biochar application can be put forward. For instance, (i) the application of small amounts of biochar per year or large amounts every other year can reduce costs while maintaining high soil pH and increasing the immobilization efficiency for soil Cd, (ii) the use of Fe-modified biochar or a mixture of Fe oxide and biochar can further improve Cd immobilization in soil, and (iii) the use of biochar together with physiological regulating substances such as Si, or the use of biochar in the cultivation of rice with Cd resistance genes, can further reduce rice Cd uptake. However, these hypotheses needed to be further explored. In addition, there is a deficiency that needs to be pointed out: the current study does not provide detailed analysis of soil properties other than pH and SOC, such as soil nutrients after 3 years, etc.

4. Conclusions

In this work, biochar was able to redistribute the Cd fractions in soil, mainly by reducing the exchangeable Cd content and increasing the Fe-Mn oxide and organic bound Cd content, which in turn reduced the enrichment of Cd by rice from the soil, and reduced the Cd content of rice organs. The increase in soil pH by biochar made a key contribution in the above process. Biochar application in the field did not significantly affect the dry matter accumulation of different rice organs and had a weak effect on the transportation and distribution of Cd in the rice plant. The immobilization effect of biochar on soil Cd in the field lasted for at least three years, and biochar was able to reduce the RAC of soil Cd. It should be noted that the immobilization efficiency of biochar for soil Cd fluctuated in the field environment, in different years and at different dosages, and that applying small amounts of biochar year by year or large amounts of biochar every other year may be a feasible way to consistently maintain a high Cd immobilization efficiency. This work adds to the limited field research on the biochar remediation of Cd-contaminated paddy soil.

Author Contributions

X.S.: data analysis, visualization, writing, J.W.: data curation, M.Z.: literature search, Z.L.: investigation, funding acquisition, Y.E.: writing—review, Y.L.: study design, T.H.: study design, investigation, writing, funding acquisition, J.M.: study design, funding acquisition. All authors have read and agreed to the published version of the manuscript.

Funding

This research was funded by the National Natural Science Foundation of China (31901449, 42007081), the Science and Technology Project of Liaoning Province (2021-MS-232), the Modern Agro-industry Technology Research System (CARS-01-51) and the S&D Program from Bijie Tobacco Company of Guizhou Province (2021520500240048, 2018520500240066).

Data Availability Statement

Not applicable.

Conflicts of Interest

The authors declare no conflict interest.

References

  1. Deng, X.; Long, C.; Chen, L.; Du, Y.; Zhang, Z.; Gan, L.; Zeng, Y. Special Microbial Communities Enhanced the Role of Aged Biochar in Reducing Cd Accumulation in Rice. Agronomy 2023, 13, 81. [Google Scholar] [CrossRef]
  2. Rahim, H.U.; Akbar, W.A.; Alatalo, J.M. A Comprehensive Literature Review on Cadmium (Cd) Status in the Soil Environment and Its Immobilization by Biochar-Based Materials. Agronomy 2022, 12, 877. [Google Scholar] [CrossRef]
  3. Peera Sheikh Kulsum, P.G.; Khanam, R.; Das, S.; Nayak, A.K.; Tack, F.M.G.; Meers, E.; Vithanage, M.; Shahid, M.; Kumar, A.; Chakraborty, S.; et al. A State-of-the-Art Review on Cadmium Uptake, Toxicity, and Tolerance in Rice: From Physiological Response to Remediation Process. Environ. Res. 2023, 220, 115098. [Google Scholar] [CrossRef] [PubMed]
  4. Liu, M.; Xu, M.; Zhang, X.; Zhou, J.; Ma, Q.; Wu, L. Poorly Crystalline Fe(II) Mineral Phases Induced by Nano Zero-Valent Iron Are Responsible for Cd Stabilization with Different Soil Moisture Conditions and Soil Types. Ecotoxicol. Environ. Saf. 2021, 223, 112616. [Google Scholar] [CrossRef]
  5. Liu, X.; Tian, G.; Jiang, D.; Zhang, C.; Kong, L. Cadmium (Cd) Distribution and Contamination in Chinese Paddy Soils on National Scale. Environ. Sci. Pollut. Res. Int. 2016, 23, 17941–17952. [Google Scholar] [CrossRef]
  6. Tu, C.; Guan, F.; Sun, Y.; Guo, P.; Liu, Y.; Li, L.; Scheckel, K.G.; Luo, Y. Stabilizing Effects on a Cd Polluted Coastal Wetland Soil Using Calcium Polysulphide. Geoderma 2018, 332, 190–197. [Google Scholar] [CrossRef]
  7. Zhang, Y.; Chen, T.; Liao, Y.; Reid, B.J.; Chi, H.; Hou, Y.; Cai, C. Modest Amendment of Sewage Sludge Biochar to Reduce the Accumulation of Cadmium into Rice (Oryza sativa L.): A Field Study. Environ. Pollut. 2016, 216, 819–825. [Google Scholar] [CrossRef] [Green Version]
  8. Gong, Y.; Zhao, D.; Wang, Q. An Overview of Field-Scale Studies on Remediation of Soil Contaminated with Heavy Metals and Metalloids: Technical Progress over the Last Decade. Water Res. 2018, 147, 440–460. [Google Scholar] [CrossRef]
  9. Qin, X.; Liu, Y.; Huang, Q.; Liu, Y.; Zhao, L.; Xu, Y. In-Situ Remediation of Cadmium and Atrazine Contaminated Acid Red Soil of South China Using Sepiolite and Biochar. Bull. Environ. Contam. Toxicol. 2019, 102, 128–133. [Google Scholar] [CrossRef]
  10. Zhou, H.; Yang, W.-T.; Zhou, X.; Liu, L.; Gu, J.-F.; Wang, W.-L.; Zou, J.-L.; Tian, T.; Peng, P.-Q.; Liao, B.-H. Accumulation of Heavy Metals in Vegetable Species Planted in Contaminated Soils and the Health Risk Assessment. Int. J. Environ. Res. Public. Health 2016, 13, 289. [Google Scholar] [CrossRef] [Green Version]
  11. Jeffery, S.; Verheijen, F.G.A.; van der Velde, M.; Bastos, A.C. A Quantitative Review of the Effects of Biochar Application to Soils on Crop Productivity Using Meta-Analysis. Agric. Ecosyst. Environ. 2011, 144, 175–187. [Google Scholar] [CrossRef]
  12. Sohi, S.P.; Krull, E.; Lopez-Capel, E.; Bol, R. Chapter 2—A Review of Biochar and Its Use and Function in Soil. In Advances in Agronomy; Academic Press: Cambridge, MA, USA, 2010; Volume 105, pp. 47–82. [Google Scholar]
  13. Wang, M.; Zhu, Y.; Cheng, L.; Andserson, B.; Zhao, X.; Wang, D.; Ding, A. Review on Utilization of Biochar for Metal-Contaminated Soil and Sediment Remediation. J. Environ. Sci. China 2018, 63, 156–173. [Google Scholar] [CrossRef] [PubMed]
  14. Zhai, X.; Li, Z.; Huang, B.; Luo, N.; Huang, M.; Zhang, Q.; Zeng, G. Remediation of Multiple Heavy Metal-Contaminated Soil through the Combination of Soil Washing and in Situ Immobilization. Sci. Total Environ. 2018, 635, 92–99. [Google Scholar] [CrossRef]
  15. García, A.C.; Tavares, O.C.H.; de Oliveira, D.F. Biochar as Agricultural Alternative to Protect the Rice Plant Growth in Fragile Sandy Soil Contaminated with Cadmium. Biocatal. Agric. Biotechnol. 2020, 29, 101829. [Google Scholar] [CrossRef]
  16. Beesley, L.; Moreno-Jiménez, E.; Gomez-Eyles, J.L.; Harris, E.; Robinson, B.; Sizmur, T. A Review of Biochars’ Potential Role in the Remediation, Revegetation and Restoration of Contaminated Soils. Environ. Pollut. 2011, 159, 3269–3282. [Google Scholar] [CrossRef]
  17. Houben, D.; Evrard, L.; Sonnet, P. Mobility, Bioavailability and pH-Dependent Leaching of Cadmium, Zinc and Lead in a Contaminated Soil Amended with Biochar. Chemosphere 2013, 92, 1450–1457. [Google Scholar] [CrossRef]
  18. Tang, J.; Zhu, W.; Kookana, R.; Katayama, A. Characteristics of Biochar and Its Application in Remediation of Contaminated Soil. J. Biosci. Bioeng. 2013, 116, 653–659. [Google Scholar] [CrossRef]
  19. Li, H.; Li, Z.; Huang, L.; Mao, X.; Dong, Y.; Fu, S.; Su, R.; Chang, Y.; Zhang, C. Environmental Factors Influence the Effects of Biochar on the Bioavailability of Cd and Pb in Soil Under Flooding Condition. Water. Air. Soil Pollut. 2023, 234, 100. [Google Scholar] [CrossRef]
  20. Awad, M.; Liu, Z.; Skalicky, M.; Dessoky, E.S.; Brestic, M.; Mbarki, S.; Rastogi, A.; EL Sabagh, A. Fractionation of Heavy Metals in Multi-Contaminated Soil Treated with Biochar Using the Sequential Extraction Procedure. Biomolecules 2021, 11, 448. [Google Scholar] [CrossRef]
  21. O’Connor, D.; Peng, T.; Zhang, J.; Tsang, D.C.W.; Alessi, D.S.; Shen, Z.; Bolan, N.S.; Hou, D. Biochar Application for the Remediation of Heavy Metal Polluted Land: A Review of in Situ Field Trials. Sci. Total Environ. 2018, 619–620, 815–826. [Google Scholar] [CrossRef]
  22. Martin, T.A.; Ruby, M.V. Review of in Situ Remediation Technologies for Lead, Zinc, and Cadmium in Soil. Remediat. J. 2004, 14, 35–53. [Google Scholar] [CrossRef]
  23. Peng, J.; Song, Y.; Yuan, P.; Cui, X.; Qiu, G. The Remediation of Heavy Metals Contaminated Sediment. J. Hazard. Mater. 2009, 161, 633–640. [Google Scholar] [CrossRef] [PubMed]
  24. Derakhshan Nejad, Z.; Jung, M.C.; Kim, K.-H. Remediation of Soils Contaminated with Heavy Metals with an Emphasis on Immobilization Technology. Environ. Geochem. Health 2018, 40, 927–953. [Google Scholar] [CrossRef] [PubMed]
  25. Bian, R.; Chen, D.; Liu, X.; Cui, L.; Li, L.; Pan, G.; Xie, D.; Zheng, J.; Zhang, X.; Zheng, J.; et al. Biochar Soil Amendment as a Solution to Prevent Cd-Tainted Rice from China: Results from a Cross-Site Field Experiment. Ecol. Eng. 2013, 58, 378–383. [Google Scholar] [CrossRef]
  26. Chen, D.; Guo, H.; Li, R.; Li, L.; Pan, G.; Chang, A.; Joseph, S. Low Uptake Affinity Cultivars with Biochar to Tackle Cd-Tainted Rice—A Field Study over Four Rice Seasons in Hunan, China. Sci. Total Environ. 2016, 541, 1489–1498. [Google Scholar] [CrossRef]
  27. Bian, R.; Joseph, S.; Cui, L.; Pan, G.; Li, L.; Liu, X.; Zhang, A.; Rutlidge, H.; Wong, S.; Chia, C.; et al. A Three-Year Experiment Confirms Continuous Immobilization of Cadmium and Lead in Contaminated Paddy Field with Biochar Amendment. J. Hazard. Mater. 2014, 272, 121–128. [Google Scholar] [CrossRef]
  28. Barmeier, G.; Schmidhalter, U. High-Throughput Phenotyping of Wheat and Barley Plants Grown in Single or Few Rows in Small Plots Using Active and Passive Spectral Proximal Sensing. Sensors 2016, 16, 1860. [Google Scholar] [CrossRef] [Green Version]
  29. Dyke, G.V. Agricultural Field Experiments: Design and Analysis. Field Crops Res. 1995, 41, 63–64. [Google Scholar] [CrossRef]
  30. Li, F.; Fan, Z.; Xiao, P.; Oh, K.; Ma, X.; Hou, W. Contamination, Chemical Speciation and Vertical Distribution of Heavy Metals in Soils of an Old and Large Industrial Zone in Northeast China. Environ. Geol. 2009, 57, 1815–1823. [Google Scholar] [CrossRef]
  31. Li, X.; Liu, L.; Wang, Y.; Luo, G.; Chen, X.; Yang, X.; Hall, M.H.P.; Guo, R.; Wang, H.; Cui, J.; et al. Heavy Metal Contamination of Urban Soil in an Old Industrial City (Shenyang) in Northeast China. Geoderma 2013, 192, 50–58. [Google Scholar] [CrossRef]
  32. Gaskin, J.; Steiner, C.; Harris, K.; Das, K.C.; Bibens, B. Effect of Low-Temperature Pyrolysis Conditions on Biochar for Agricultural Use. Trans. Asabe 2008, 51, 2061–2069. [Google Scholar] [CrossRef]
  33. Tessier, A.; Campbell, P.G.C.; Bisson, M. Sequential Extraction Procedure for the Speciation of Particulate Trace Metals. Anal. Chem. 1979, 51, 844–851. [Google Scholar] [CrossRef]
  34. He, T.; Meng, J.; Chen, W.; Liu, Z.; Cao, T.; Cheng, X.; Huang, Y.; Yang, X. Effects of Biochar on Cadmium Accumulation in Rice and Cadmium Fractions of Soil: A Three-Year Pot Experiment. BioResources 2016, 12, 622–642. [Google Scholar] [CrossRef]
  35. Liu, A.; Tian, D.; Xiang, Y.; Mo, H. Effects of Biochar on Growth of Asian Lotus (Nelumbo nucifera Gaertn.) and Cadmium Uptake in Artificially Cadmium-Polluted Water. Sci. Hortic. 2016, 198, 311–317. [Google Scholar] [CrossRef]
  36. Zhang, Z.; Solaiman, Z.M.; Meney, K.; Murphy, D.V.; Rengel, Z. Biochars Immobilize Soil Cadmium, but Do Not Improve Growth of Emergent Wetland Species Juncus subsecundus in Cadmium-Contaminated Soil. J. Soils Sediments 2013, 13, 140–151. [Google Scholar] [CrossRef]
  37. Perin, G.; Craboledda, L.; Lucchese, L.; Cirillo, R.; Dotta, L.; Orio, A. Heavy Metal Speciation in the Sediments of Northern Adriatic Sea. A New Approach for Environmental Toxicity Determination. In International Conference “Heavy Metals in the Environment”; CEP Consultants: Edinburg, UK, 1985; Volume 2, pp. 454–456. [Google Scholar]
  38. Guo, Y.; Zhang, Y.; Zhao, X.; Xu, J.; Qiu, G.; Jia, W.; Wu, J.; Guo, F. Multifaceted Evaluation of Distribution, Occurrence, and Leaching Features of Typical Heavy Metals in Different-Sized Coal Gasification Fine Slag from Ningdong Region, China: A Case Study. Sci. Total Environ. 2022, 831, 154726. [Google Scholar] [CrossRef]
  39. Islam, M.S.; Magid, A.S.I.A.; Chen, Y.; Weng, L.; Arafat, M.Y.; Khan, Z.H.; Ma, J.; Li, Y. Arsenic and Cadmium Load in Rice Tissues Cultivated in Calcium Enriched Biochar Amended Paddy Soil. Chemosphere 2021, 283, 131102. [Google Scholar] [CrossRef]
  40. Yin, X.; Chen, J.; Cao, F.; Tao, Z.; Huang, M. Short-Term Application of Biochar Improves Post-Heading Crop Growth but Reduces Pre-Heading Biomass Translocation in Rice. Plant Prod. Sci. 2020, 23, 522–528. [Google Scholar] [CrossRef]
  41. Liu, Y.; Li, H.; Hu, T.; Mahmoud, A.; Li, J.; Zhu, R.; Jiao, X.; Jing, P. A Quantitative Review of the Effects of Biochar Application on Rice Yield and Nitrogen Use Efficiency in Paddy Fields: A Meta-Analysis. Sci. Total Environ. 2022, 830, 154792. [Google Scholar] [CrossRef]
  42. Spokas, K.A.; Cantrell, K.B.; Novak, J.M.; Archer, D.W.; Ippolito, J.A.; Collins, H.P.; Boateng, A.A.; Lima, I.M.; Lamb, M.C.; McAloon, A.J.; et al. Biochar: A Synthesis of Its Agronomic Impact beyond Carbon Sequestration. J. Environ. Qual. 2012, 41, 973–989. [Google Scholar] [CrossRef] [Green Version]
  43. Ippolito, J.A.; Laird, D.A.; Busscher, W.J. Environmental Benefits of Biochar. J. Environ. Qual. 2012, 41, 967–972. [Google Scholar] [CrossRef] [PubMed] [Green Version]
  44. Jeffery, S.; Abalos, D.; Prodana, M.; Catarina Bastos, A.; van Groenigen, J.W.; Hungate, B.A.; Verheijen, F. Biochar Boosts Tropical but Not Temperate Crop Yields. Environ. Res. Lett. 2017, 12, 053001. [Google Scholar] [CrossRef]
  45. Tao, Q.; Li, M.; Xu, Q.; Kováč, J.; Yuan, S.; Li, B.; Li, Q.; Huang, R.; Gao, X.; Wang, C. Radial Transport Difference Mediated by Root Endodermal Barriers Contributes to Differential Cadmium Accumulation between Japonica and Indica Subspecies of Rice (Oryza sativa L.). J. Hazard. Mater. 2022, 425, 128008. [Google Scholar] [CrossRef]
  46. Li, H.; Xiao, J.; Zhao, Z.; Zhong, D.; Chen, J.; Xiao, B.; Xiao, W.; Wang, W.; Crittenden, J.C.; Wang, L. Reduction of Cadmium Bioavailability in Paddy Soil and Its Accumulation in Brown Rice by FeCl3 Washing Combined with Biochar: A Field Study. Sci. Total Environ. 2022, 851, 158186. [Google Scholar] [CrossRef] [PubMed]
  47. Jing, F.; Yang, Z.; Chen, X.; Liu, W.; Guo, B.; Lin, G.; Huang, R.; Liu, W. Potentially Hazardous Element Accumulation in Rice Tissues and Their Availability in Soil Systems after Biochar Amendments. J. Soils Sediments 2019, 19, 2957–2970. [Google Scholar] [CrossRef]
  48. Guo, J.-J.; Tan, X.; Fu, H.-L.; Chen, J.-X.; Lin, X.-X.; Ma, Y.; Yang, Z.-Y. Selection for Cd Pollution-Safe Cultivars of Chinese Kale (Brassica alboglabra L. H. Bailey) and Biochemical Mechanisms of the Cultivar-Dependent Cd Accumulation Involving in Cd Subcellular Distribution. J. Agric. Food Chem. 2018, 66, 1923–1934. [Google Scholar] [CrossRef]
  49. Yu, E.; Wang, W.; Yamaji, N.; Fukuoka, S.; Che, J.; Ueno, D.; Ando, T.; Deng, F.; Hori, K.; Yano, M.; et al. Duplication of a Manganese/Cadmium Transporter Gene Reduces Cadmium Accumulation in Rice Grain. Nat. Food 2022, 3, 597–607. [Google Scholar] [CrossRef]
  50. Bogusz, A.; Oleszczuk, P. Effect of Biochar Addition to Sewage Sludge on Cadmium, Copper and Lead Speciation in Sewage Sludge-Amended Soil. Chemosphere 2020, 239, 124719. [Google Scholar] [CrossRef]
  51. Cui, L.; Pan, G.; Li, L.; Bian, R.; Liu, X.; Yan, J.; Quan, G.; Ding, C.; Chen, T.; Liu, Y.; et al. Continuous Immobilization of Cadmium and Lead in Biochar Amended Contaminated Paddy Soil: A Five-Year Field Experiment. Ecol. Eng. 2016, 93, 1–8. [Google Scholar] [CrossRef]
  52. Rodríguez-Vila, A.; Asensio, V.; Forján, R.; Covelo, E.F. Chemical Fractionation of Cu, Ni, Pb and Zn in a Mine Soil Amended with Compost and Biochar and Vegetated with Brassica juncea L. J. Geochem. Explor. 2015, 158, 74–81. [Google Scholar] [CrossRef]
  53. Yin, D.; Wang, X.; Peng, B.; Tan, C.; Ma, L.Q. Effect of Biochar and Fe-Biochar on Cd and As Mobility and Transfer in Soil-Rice System. Chemosphere 2017, 186, 928–937. [Google Scholar] [CrossRef] [PubMed]
  54. Gotoh, S.; Patrick, W.H., Jr. Transformation of Iron in a Waterlogged Soil as Influenced by Redox Potential and pH. Soil Sci. Soc. Am. J. 1974, 38, 66–71. [Google Scholar] [CrossRef]
  55. Yu, H.-Y.; Wang, X.; Li, F.; Li, B.; Liu, C.; Wang, Q.; Lei, J. Arsenic Mobility and Bioavailability in Paddy Soil under Iron Compound Amendments at Different Growth Stages of Rice. Environ. Pollut. 2017, 224, 136–147. [Google Scholar] [CrossRef]
  56. Zhang, R.-H.; Li, Z.-G.; Liu, X.-D.; Wang, B.; Zhou, G.-L.; Huang, X.-X.; Lin, C.-F.; Wang, A.; Brooks, M. Immobilization and Bioavailability of Heavy Metals in Greenhouse Soils Amended with Rice Straw-Derived Biochar. Ecol. Eng. 2017, 98, 183–188. [Google Scholar] [CrossRef]
  57. Zhang, P.; Zhang, X.; Li, Y.; Han, L. Influence of Pyrolysis Temperature on Chemical Speciation, Leaching Ability, and Environmental Risk of Heavy Metals in Biochar Derived from Cow Manure. Bioresour. Technol. 2020, 302, 122850. [Google Scholar] [CrossRef] [PubMed]
  58. Sarmah, M.; Borgohain, A.; Gogoi, B.B.; Yeasin, M.; Paul, R.K.; Malakar, H.; Handique, J.G.; Saikia, J.; Deka, D.; Khare, P.; et al. Insights into the Effects of Tea Pruning Litter Biochar on Major Micronutrients (Cu, Mn, and Zn) Pathway from Soil to Tea Plant: An Environmental Armour. J. Hazard. Mater. 2023, 442, 129970. [Google Scholar] [CrossRef]
  59. Meng, L.; Huang, T.; Shi, J.; Chen, J.; Zhong, F.; Wu, L.; Xu, J. Decreasing Cadmium Uptake of Rice (Oryza sativa L.) in the Cadmium-Contaminated Paddy Field through Different Cultivars Coupling with Appropriate Soil Amendments. J. Soils Sediments 2019, 19, 1788–1798. [Google Scholar] [CrossRef]
  60. Wang, Y.; Zhang, K.; Lu, L.; Xiao, X.; Chen, B. Novel Insights into Effects of Silicon-Rich Biochar (Sichar) Amendment on Cadmium Uptake, Translocation and Accumulation in Rice Plants. Environ. Pollut. 2020, 265, 114772. [Google Scholar] [CrossRef]
  61. Xing, D.; Cheng, H.; Ning, Z.; Liu, Y.; Lin, S.; Li, Y.; Wang, X.; Hill, P.; Chadwick, D.; Jones, D.L. Field Aging Declines the Regulatory Effects of Biochar on Cadmium Uptake by Pepper in the Soil. J. Environ. Manag. 2022, 321, 115832. [Google Scholar] [CrossRef]
  62. Wang, Y.-M.; Wang, S.-W.; Wang, C.-Q.; Zhang, Z.-Y.; Zhang, J.-Q.; Meng, M.; Li, M.; Uchimiya, M.; Yuan, A.X.-Y. Simultaneous Immobilization of Soil Cd(II) and As(V) by Fe-Modified Biochar. Int. J. Environ. Res. Public. Health 2020, 17, 827. [Google Scholar] [CrossRef] [Green Version]
Figure 1. Diagram of the treatment distribution in the field.
Agronomy 13 01335 g001
Figure 2. Cd contents in different rice organs in three years with biochar treatments. (A): results of the 1st year, (B): results of the 2nd year, (C): results of the 3rd year. The error bars indicate standard deviations (n = 3). The different letters on bars indicate significant differences (p < 0.05) between the biochar treatments. Changes in Cd accumulations in Leaf, Husk, and Brown rice are detailed in the partial enlarged figures. CK: control, Y: yearly 3 t ha−1, C1: 7.5 t ha−1, C2: 15 t ha−1, and C3: 30 t ha−1.
Agronomy 13 01335 g002
Figure 3. The concentration factors of Cd in rice organs (Brown rice: (ac), Husk: (df), Leaf: (gi), Stem and sheath: (jl), Root: (mo)) with biochar treatments in three years. The error bars indicate standard deviations (n = 3). The different letters on bars indicate significant differences (p < 0.05) between the biochar treatments. CK: control, Y: yearly 3 t ha−1, C1: 7.5 t ha−1, C2: 15 t ha−1, and C3: 30 t ha−1.
Agronomy 13 01335 g003
Figure 4. The soil pH (A) and SOC (B) of different treatments in three years (mean ± S.D., n = 3). The different letters on bars indicate significant differences (p < 0.05) between the biochar treatments. CK: control, Y: yearly 3 t ha−1, C1: 7.5 t ha−1, C2: 15 t ha−1, and C3: 30 t ha−1.
Agronomy 13 01335 g004
Figure 5. Distribution of Cd fractions in soil with biochar treatments. F1–F5 indicate exchangeable fraction, carbonated bound fraction, Fe-Mn oxide bound fraction, organic bound fraction, and residual fraction, respectively. CK: control, Y: yearly 3 t ha−1, C1: 7.5 t ha−1, C2: 15 t ha−1, and C3: 30 t ha−1.
Agronomy 13 01335 g005
Figure 6. The RAC values for Cd with biochar treatments in three years (mean ± S.D., n = 3). Red dashed line in the figure is a dividing line that represents a critical value (30%) for high-risk and medium-risk. CK: control, Y: yearly 3 t ha−1, C1: 7.5 t ha−1, C2: 15 t ha−1, and C3: 30 t ha−1.
Agronomy 13 01335 g006
Figure 7. The Cd immobilization efficiency of different treatments in three years (mean ± S.D., n = 3). CK: control, Y: yearly 3 t ha−1, C1: 7.5 t ha−1, C2: 15 t ha−1, and C3: 30 t ha−1.
Agronomy 13 01335 g007
Figure 8. RDA of Cd contents in rice and the soil environmental factors.
Agronomy 13 01335 g008
Figure 9. Summarized effects of biochar on the Cd uptake in rice and the Cd fractions in paddy soil.
Agronomy 13 01335 g009
Table 1. The basic physical and chemical properties of the biochar used in this study.
PropertyValue
Cd contents (mg kg−1)Not detectable
pH8.98 ± 0.11
CEC (cmol kg−1)21.59 ± 0.63
Specific surface area (m2 g−1)28.14 ± 0.46
Total pore volume (ml g−1)0.05 ± 0.01
Average pore diameter (nm)10.88 ± 0.21
Total C (%)43.58 ± 1.09
Total H (%)6.91 ± 0.58
Total O (%)21.8 ± 0.95
Total N (%)1.38 ± 0.03
Total P (%)0.13 ± 0.008
Total K (%)0.09 ± 0.006
Total S (%)0.31 ± 0.01
Table 2. Dry matter accumulation in different organs of rice with biochar treatments (t ha−1, mean ± S.D., n = 3).
YearTreatmentDry Matter Accumulation in Different Organs of Rice (t ha−1)
HuskLeafBrown RiceStem and Sheath
1st yearCK1.38 ± 0.212.44 ± 0.164.60 ± 0.615.75 ± 0.14
Y1.46 ± 0.152.48 ± 0.094.85 ± 0.576.05 ± 0.26
C11.47 ± 0.162.62 ± 0.174.92 ± 0.426.47 ± 0.46
C21.44 ± 0.152.46 ± 0.124.91 ± 0.546.36 ± 0.16
C31.43 ± 0.112.49 ± 0.224.74 ± 0.366.28 ± 0.50
2nd yearCK1.80 ± 0.213.17 ± 0.116.02 ± 0.577.68 ± 0.00
Y1.76 ± 0.112.80 ± 0.245.91 ± 0.367.40 ± 0.09
C11.80 ± 0.132.94 ± 0.176.09 ± 0.427.67 ± 0.15
C21.83 ± 0.142.86 ± 0.276.08 ± 0.547.51 ± 0.21
C31.76 ± 0.172.82 ± 0.115.77 ± 0.617.46 ± 0.49
3rd yearCK1.37 ± 0.042.02 ± 0.344.75 ± 0.196.03 ± 0.39
Y1.45 ± 0.042.11 ± 0.275.00 ± 0.176.10 ± 0.39
C11.42 ± 0.072.10 ± 0.184.87 ± 0.146.09 ± 0.40
C21.50 ± 0.122.01 ± 0.024.97 ± 0.265.92 ± 0.04
C31.49 ± 0.062.01 ± 0.094.87 ± 0.275.96 ± 0.57
No letter indicates no significant difference (p < 0.05) between the biochar treatment results for single rice organ in a same year. CK: control, Y: yearly 3 t ha1, C1: 7.5 t ha1, C2: 15 t ha1, and C3: 30 t ha1.
Table 3. TF and DF of Cd in rice plant with biochar treatments (mean ± S.D., n = 3).
Transfer Factor %Distribution Factor %
1st Year2nd Year3rd Year1st Year2nd Year3rd Year
LeafCK2.35 ± 0.182.32 ± 0.172.76 ± 0.146.26 ± 1.405.29 ± 0.465.12 ± 0.51
Y2.51 ± 0.292.57 ± 0.242.76 ± 0.566.30 ± 0.545.51 ± 0.145.25 ± 0.43
C12.66 ± 0.402.47 ± 0.242.73 ± 0.226.99 ± 0.245.52 ± 0.535.31 ± 0.57
C22.74 ± 0.432.54 ± 0.202.67 ± 0.286.86 ± 0.855.76 ± 0.644.99 ± 0.40
C32.68 ± 0.242.49 ± 0.122.68 ± 0.487.15 ± 1.025.63 ± 0.295.10 ± 1.10
Stem and sheathCK13.95 ± 1.3815.89 ± 0.2815.64 ± 0.3485.97 ± 0.9087.81 ± 0.8186.95 ± 0.69
Y14.21 ± 3.2815.35 ± 1.2615.63 ± 0.2485.92 ± 1.4187.20 ± 0.2287.18 ± 1.41
C113.08 ± 1.3614.89 ± 0.4615.40 ± 0.3385.29 ± 1.1787.02 ± 1.0486.80 ± 0.90
C213.26 ± 3.2514.66 ± 2.5415.81 ± 1.3684.63 ± 1.4886.38 ± 0.9886.88 ± 1.16
C312.73 ± 2.0714.60 ± 2.2215.46 ± 0.2384.45 ± 2.2286.50 ± 0.7286.70 ± 1.55
Brown riceCK0.99 ± 0.070.98 ± 0.041.16 ± 0.094.86 ± 0.464.24 ± 0.225.15 ± 0.98
Y1.00 ± 0.190.98 ± 0.041.05 ± 0.084.85 ± 0.494.45 ± 0.444.83 ± 0.52
C10.99 ± 0.150.99 ± 0.081.12 ± 0.104.92 ± 0.724.60 ± 0.485.10 ± 0.77
C21.04 ± 0.120.95 ± 0.091.13 ± 0.185.20 ± 0.374.54 ± 0.125.20 ± 0.82
C31.00 ± 0.050.99 ± 0.131.12 ± 0.055.08 ± 0.604.54 ± 0.585.16 ± 0.21
HuskCK1.98 ± 0.062.07 ± 0.092.21 ± 0.062.92 ± 0.092.66 ± 0.152.79 ± 0.22
Y1.99 ± 0.362.10 ± 0.292.06 ± 0.272.93 ± 0.442.84 ± 0.312.75 ± 0.45
C11.89 ± 0.322.09 ± 0.052.11 ± 0.342.81 ± 0.472.86 ± 0.092.78 ± 0.52
C22.22 ± 0.222.29 ± 0.152.11 ± 0.233.32 ± 0.783.32 ± 0.412.93 ± 0.20
C32.16 ± 0.252.37 ± 0.182.16 ± 0.103.32 ± 0.633.33 ± 0.333.04 ± 0.34
Acrial partCK6.57 ± 0.367.45 ± 0.217.65 ± 0.27---
Y6.77 ± 1.667.28 ± 0.427.45 ± 0.25---
C16.41 ± 0.617.10 ± 0.107.46 ± 0.34---
C26.53 ± 1.246.94 ± 0.867.48 ± 0.53---
C36.32 ± 0.867.03 ± 0.647.40 ± 0.31---
CK: control, Y: yearly 3 t ha−1, C1: 7.5 t ha−1, C2: 15 t ha−1, and C3: 30 t ha−1.
Table 4. Cd contents of different fractions in soil of the different applied treatments during three years. (mg kg−1, mean ± S.D., n = 3).
F1F2F3F4F5
1st yearCK1.14 ± 0.03 a0.22 ± 0.01 a1.01 ± 0.05 b0.23 ± 0.01 a0.60 ± 0.03 a
Y0.93 ± 0.02 bc0.22 ± 0.00 a1.06 ± 0.04 b0.22 ± 0.02 a0.64 ± 0.03 a
C10.99 ± 0.01 b0.22 ± 0.01 a1.09 ± 0.04 b0.23 ± 0.00 a0.63 ± 0.03 a
C20.89 ± 0.04 c0.22 ± 0.00 a1.26 ± 0.04 a0.25 ± 0.02 a0.65 ± 0.04 a
C30.71 ± 0.01 d0.22 ± 0.01 a1.34 ± 0.04 a0.23 ± 0.02 a0.65 ± 0.04 a
2nd yearCK1.01 ± 0.02 a0.20 ± 0.01 a1.10 ± 0.02 d0.18 ± 0.01 b0.62 ± 0.03 b
Y0.82 ± 0.04 b0.21 ± 0.02 a1.18 ± 0.01 cd0.21 ± 0.03 ab0.63 ± 0.02 b
C10.88 ± 0.03 b0.20 ± 0.01 a1.22 ± 0.01 c0.20 ± 0.02 ab0.64 ± 0.01 b
C20.67 ± 0.06 c0.19 ± 0.00 a1.31 ± 0.06 b0.23 ± 0.01 ab0.69 ± 0.01 a
C30.54 ± 0.05 d0.20 ± 0.00 a1.40 ± 0.03 a0.24 ± 0.02 a0.69 ± 0.03 a
3rd yearCK0.97 ± 0.05 a0.21 ± 0.02 a1.1 ± 0.04 b0.13 ± 0.02 b0.69 ± 0.08 a
Y0.74 ± 0.01 c0.22 ± 0.01 a1.16 ± 0.06 b0.19 ± 0.02 a0.74 ± 0.03 a
C10.83 ± 0.02 b0.20 ± 0.00 a1.15 ± 0.04 b0.20 ± 0.02 a0.69 ± 0.07 a
C20.74 ± 0.01 c0.19 ± 0.00 a1.21 ± 0.04 ab0.21 ± 0.01 a0.71 ± 0.04 a
C30.71 ± 0.04 c0.19 ± 0.00 a1.31 ± 0.03 a0.23 ± 0.02 a0.65 ± 0.08 a
Different letters indicate significant differences (p < 0.05) between the biochar treatments in a single year. F1–F5 indicate exchangeable fraction, carbonated bound fraction, Fe-Mn oxide bound fraction, organic bound fraction, and residual fraction, respectively. CK: control, Y: yearly 3 t ha−1, C1: 7.5 t ha−1, C2: 15 t ha−1, and C3: 30 t ha−1.
Disclaimer/Publisher’s Note: The statements, opinions and data contained in all publications are solely those of the individual author(s) and contributor(s) and not of MDPI and/or the editor(s). MDPI and/or the editor(s) disclaim responsibility for any injury to people or property resulting from any ideas, methods, instructions or products referred to in the content.

