
Biochar Can Partially Substitute Fertilizer for Rice Production in Acid Paddy Field in Southern China
 and
and 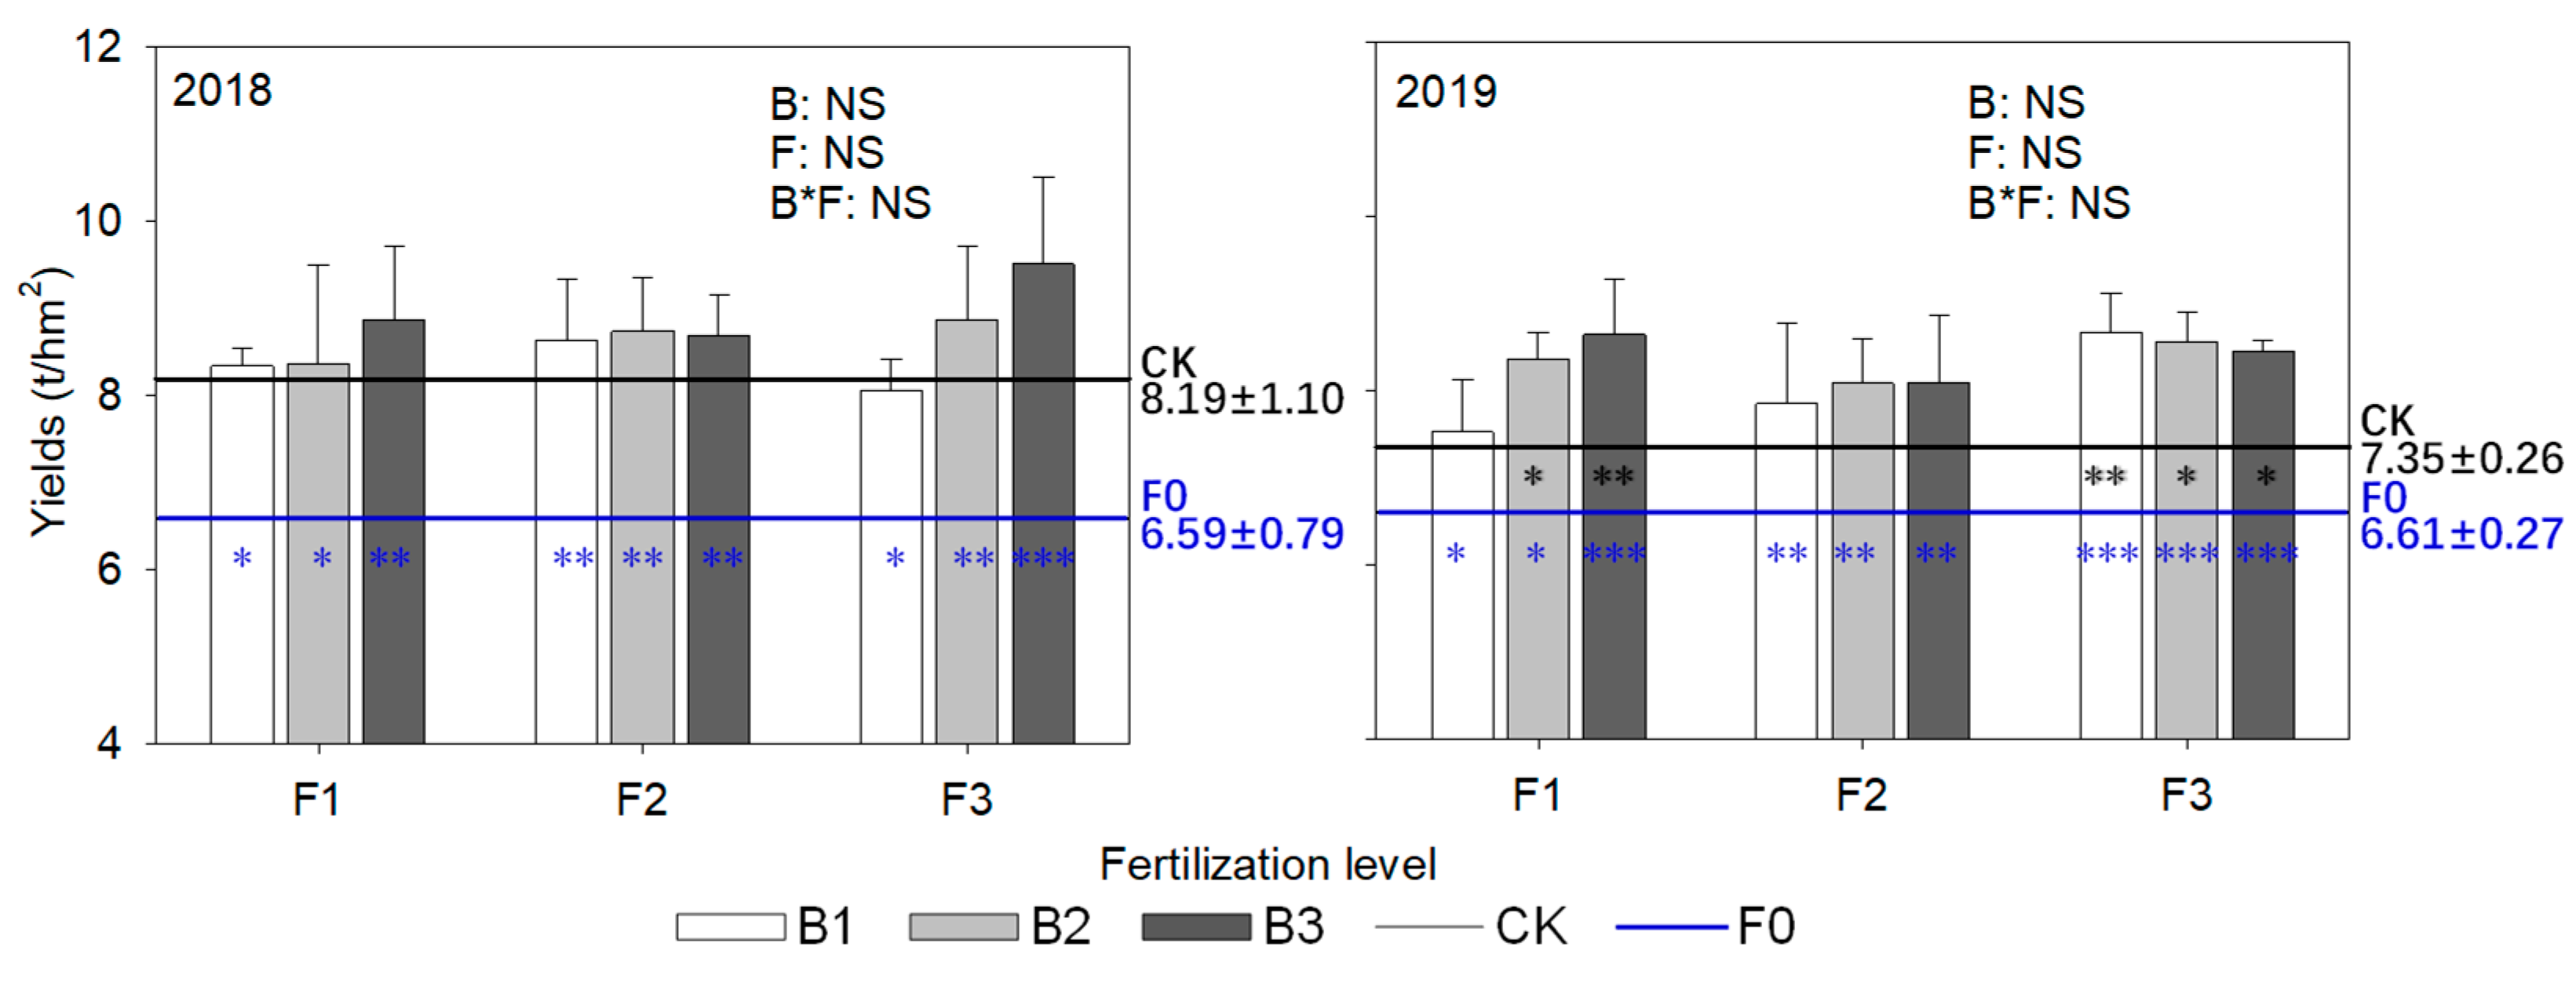
Abstract
:1. Introduction
2. Materials and Methods
2.1. Study Area
2.2. Experimental Design
2.3. Sampling and Measurements
2.4. Calculations
2.5. Statistical Analysis
3. Results
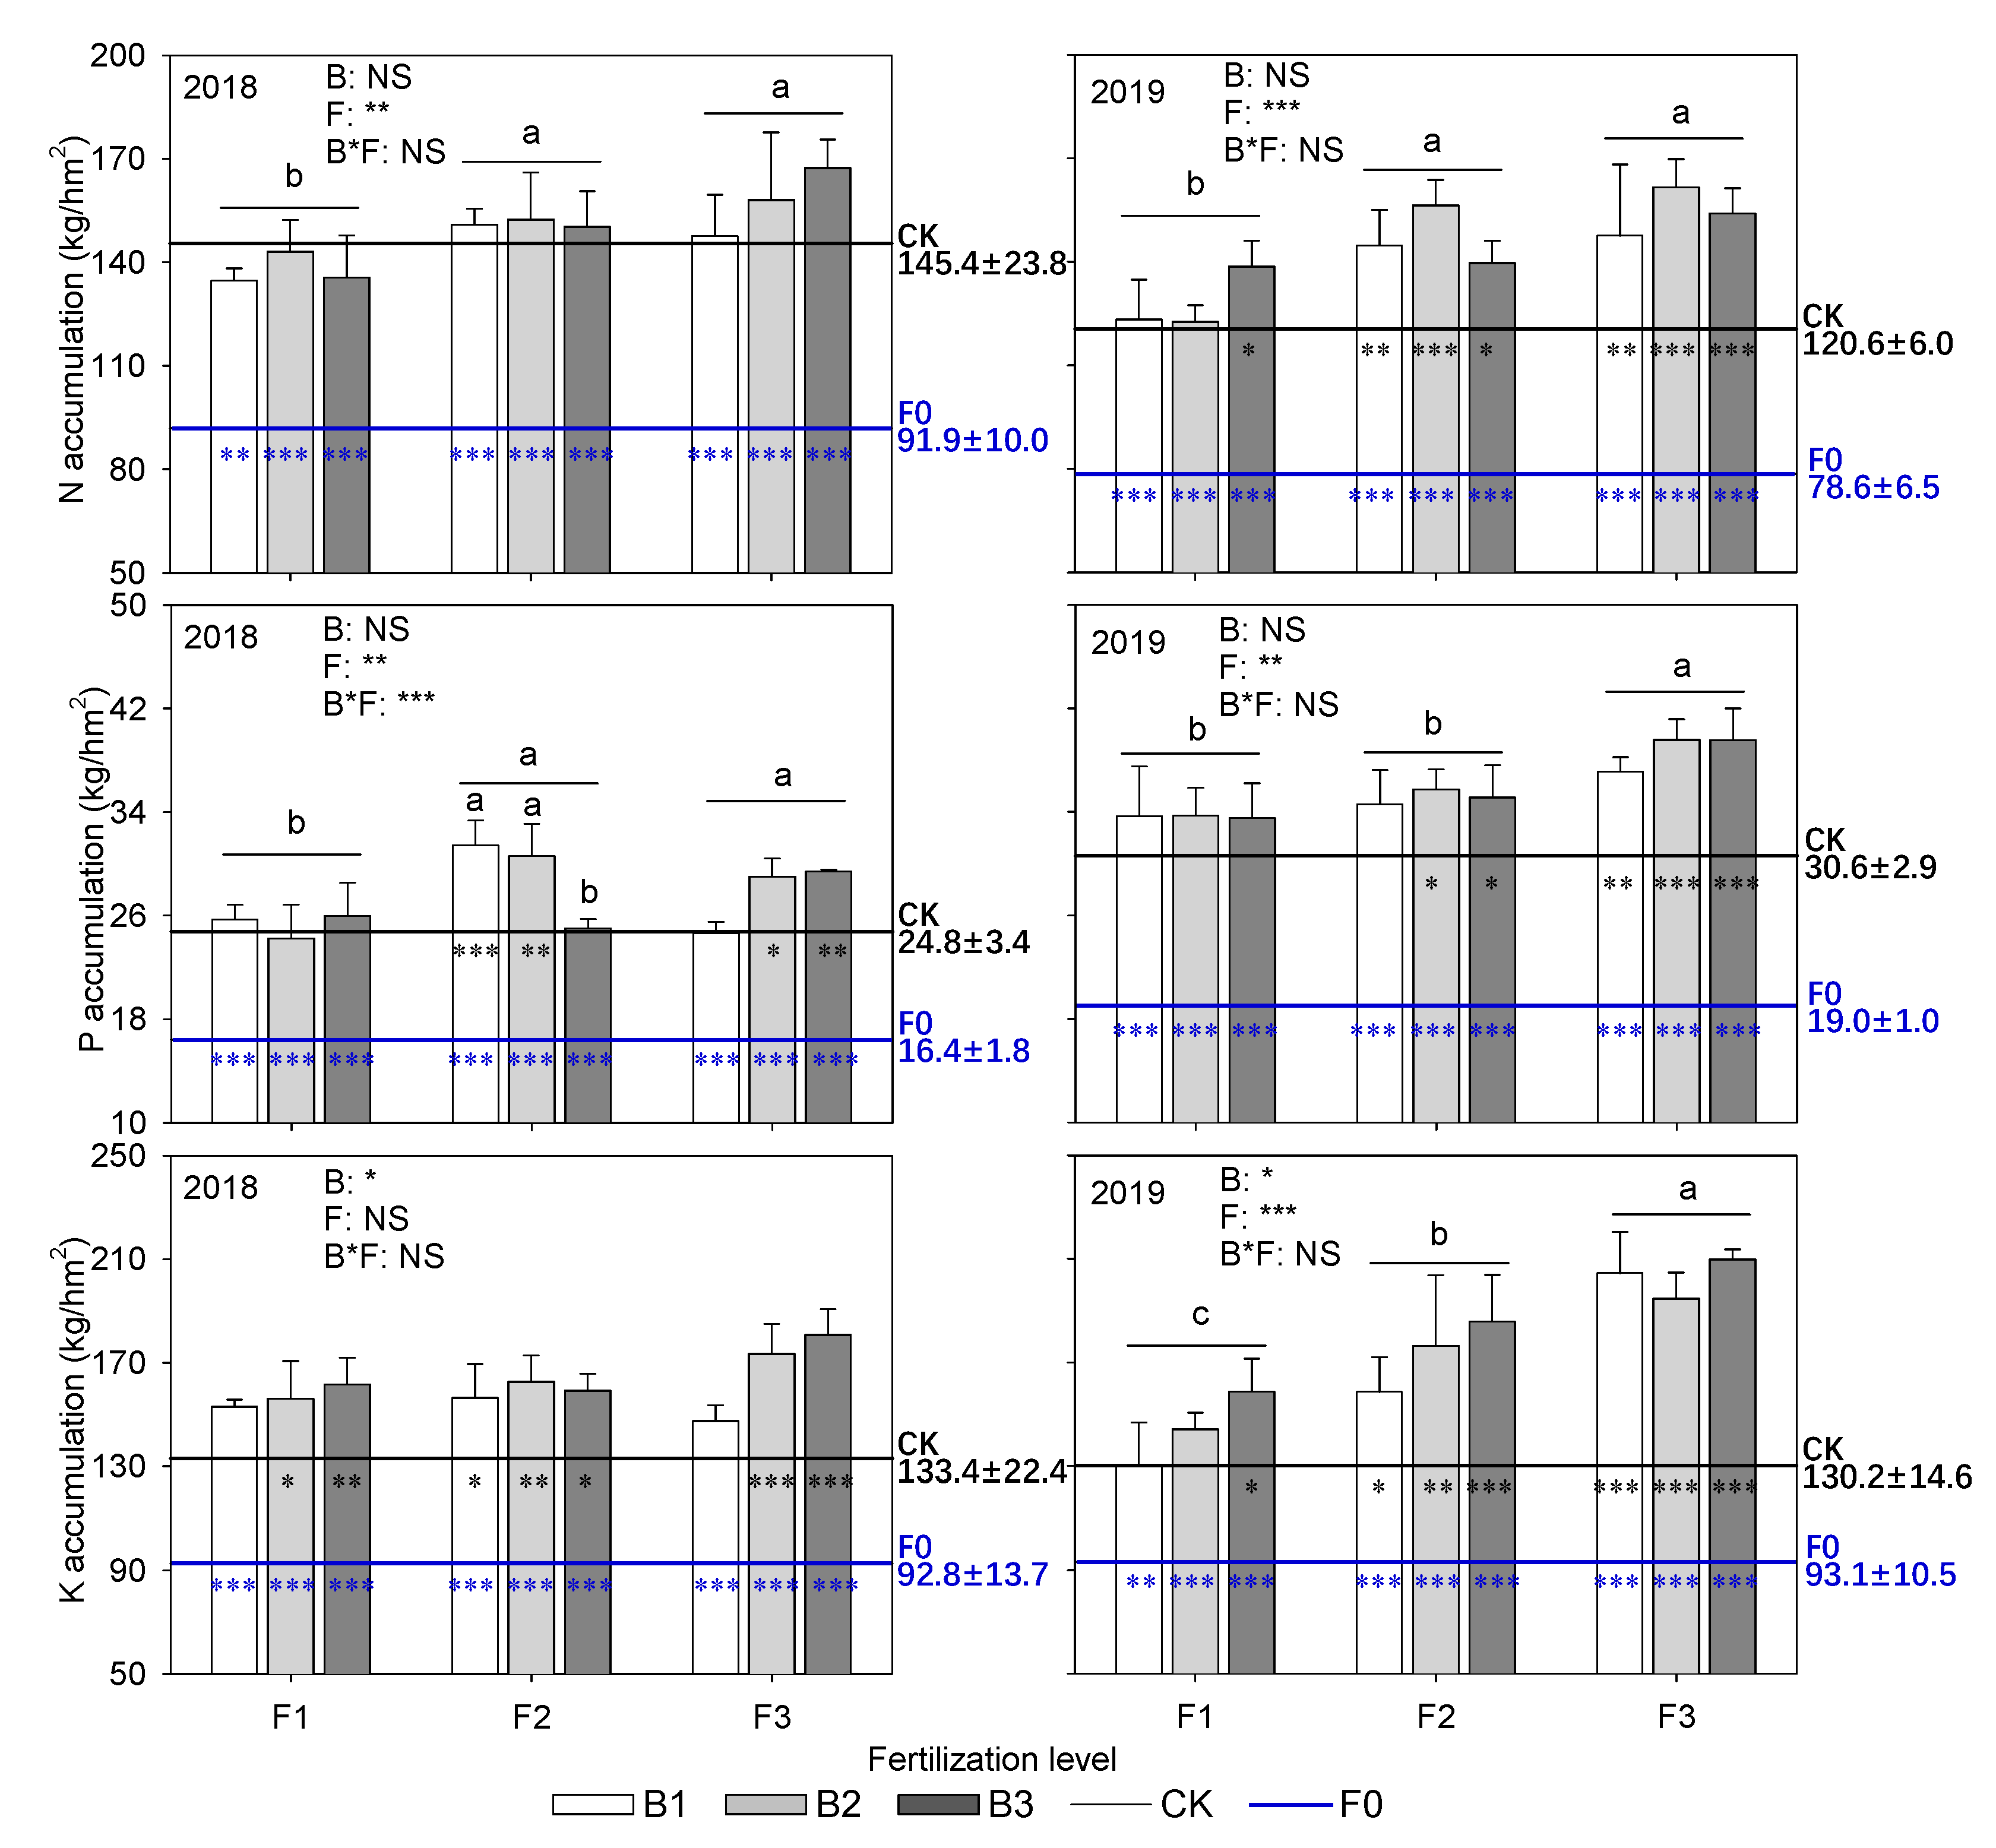
3.1. Yield and Nutrient Accumulation
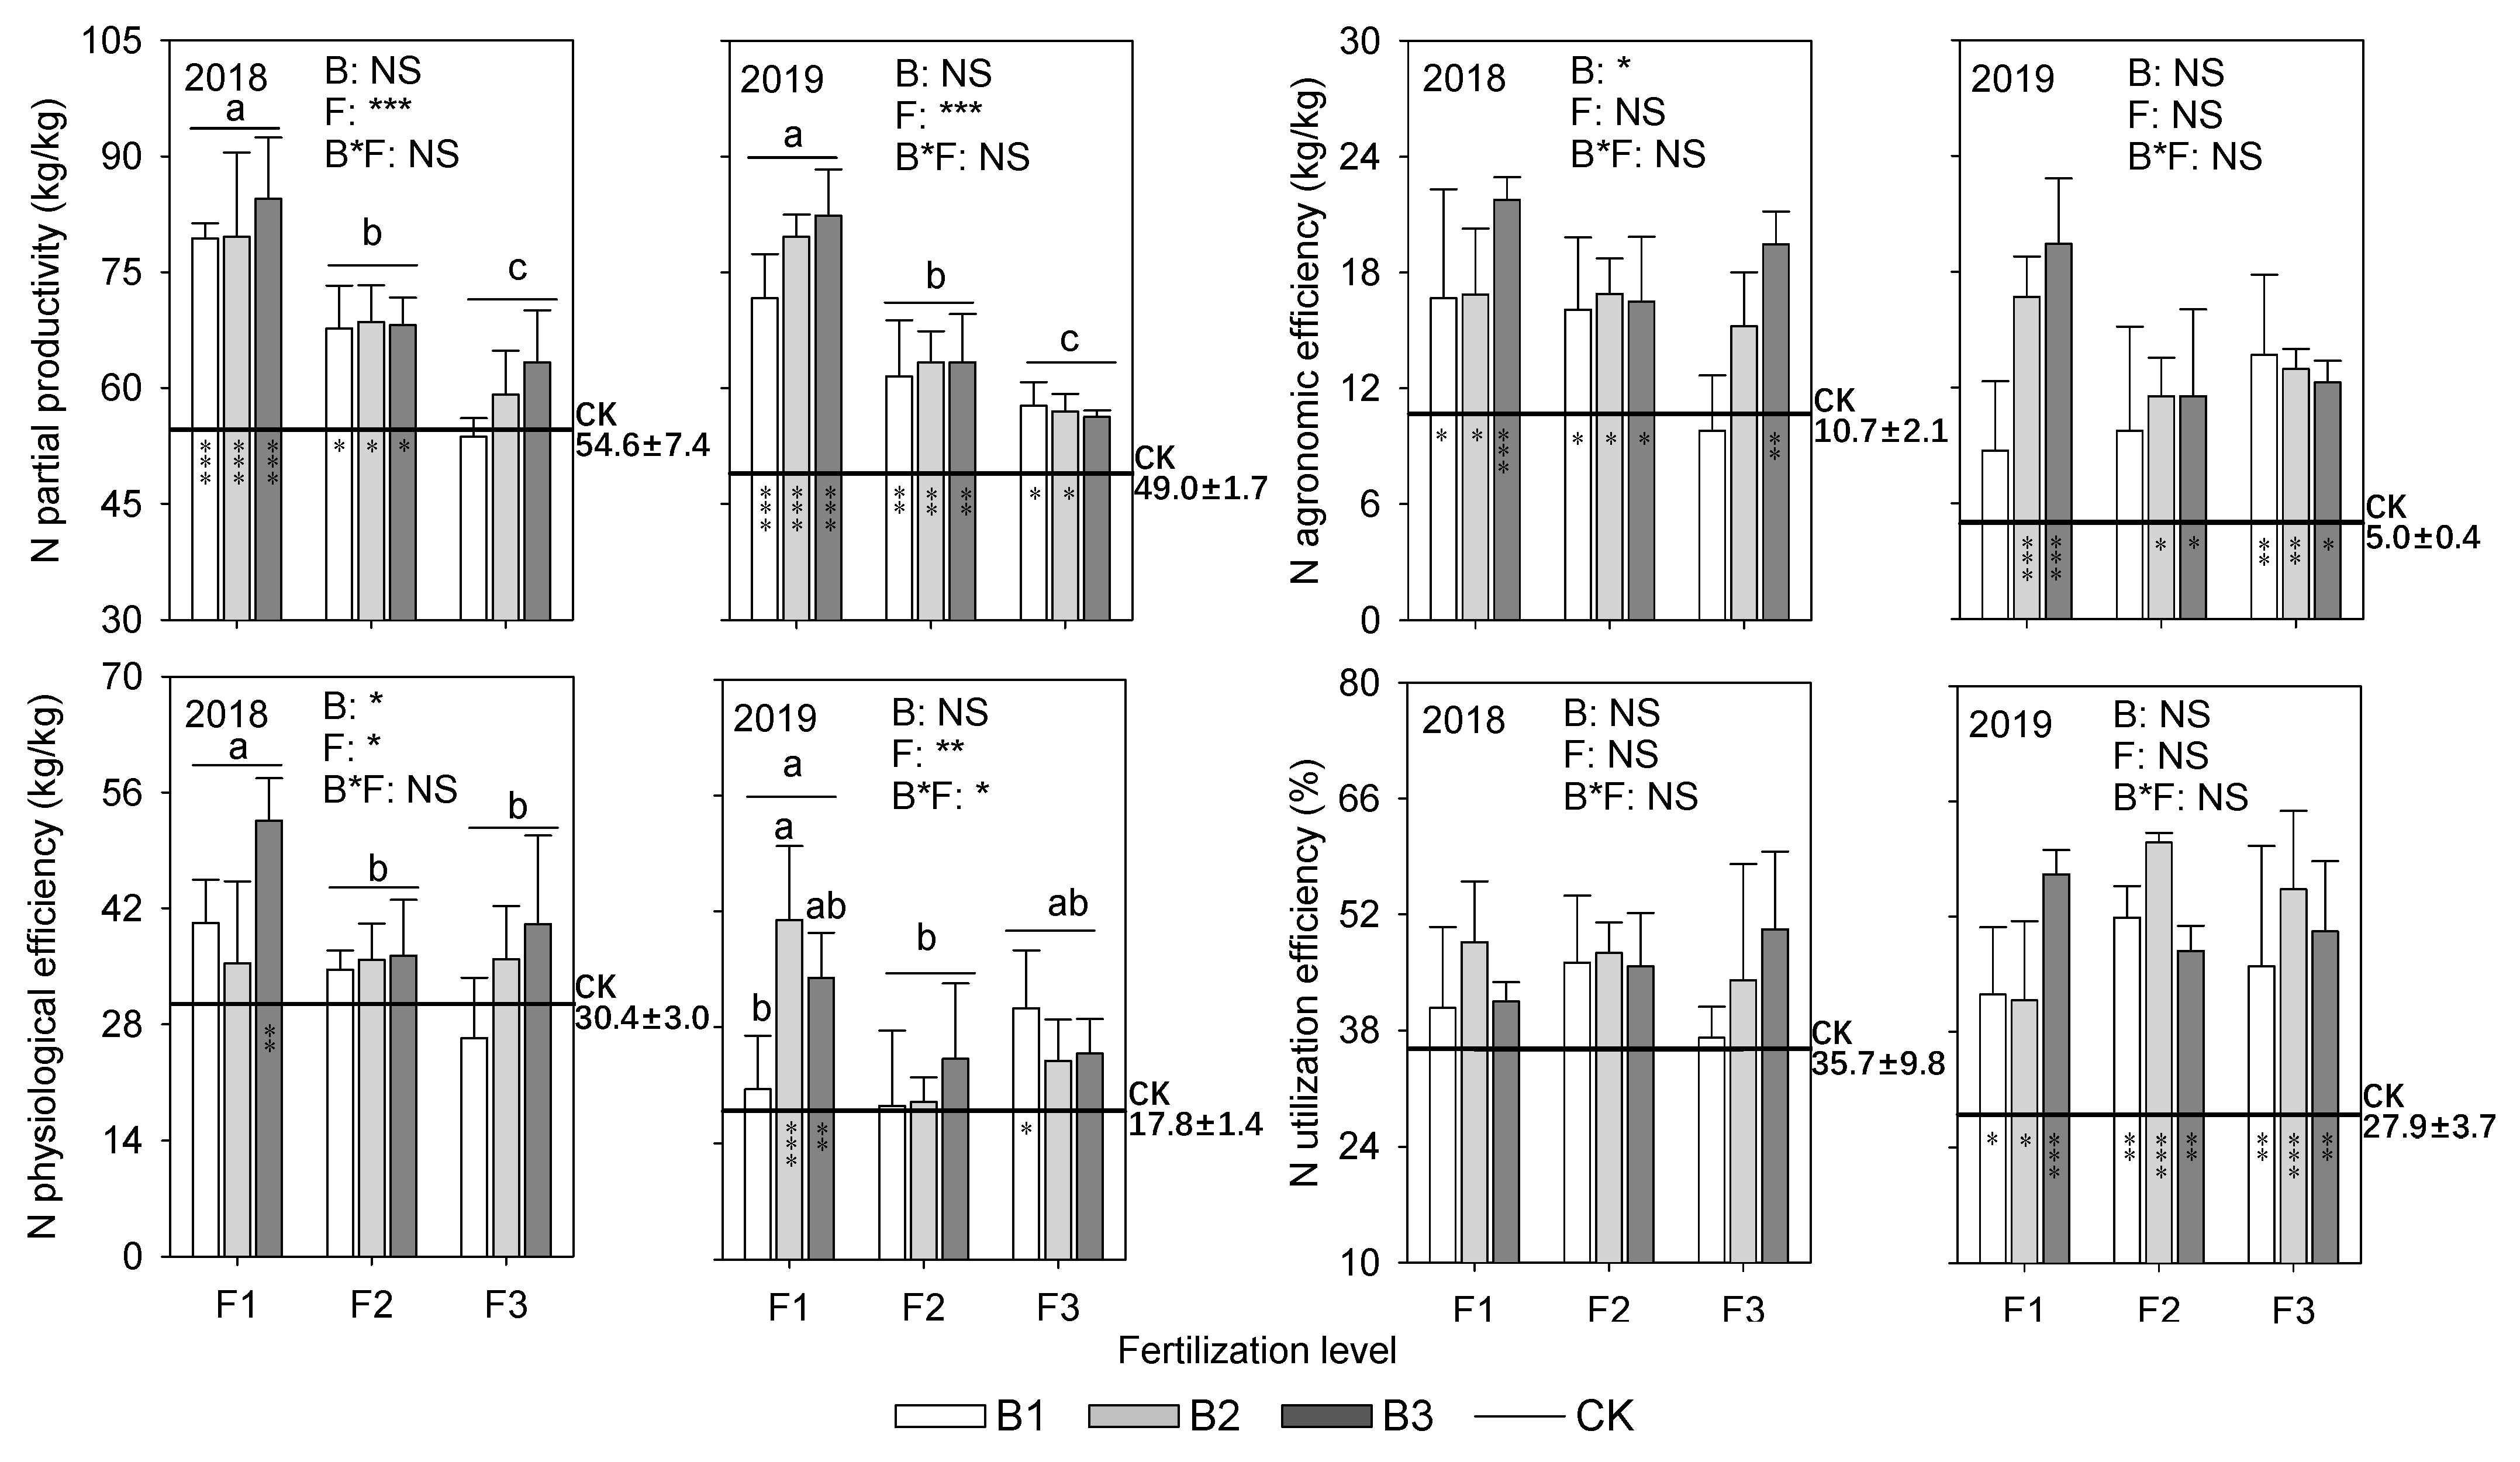
3.2. Nitrogen Utilization
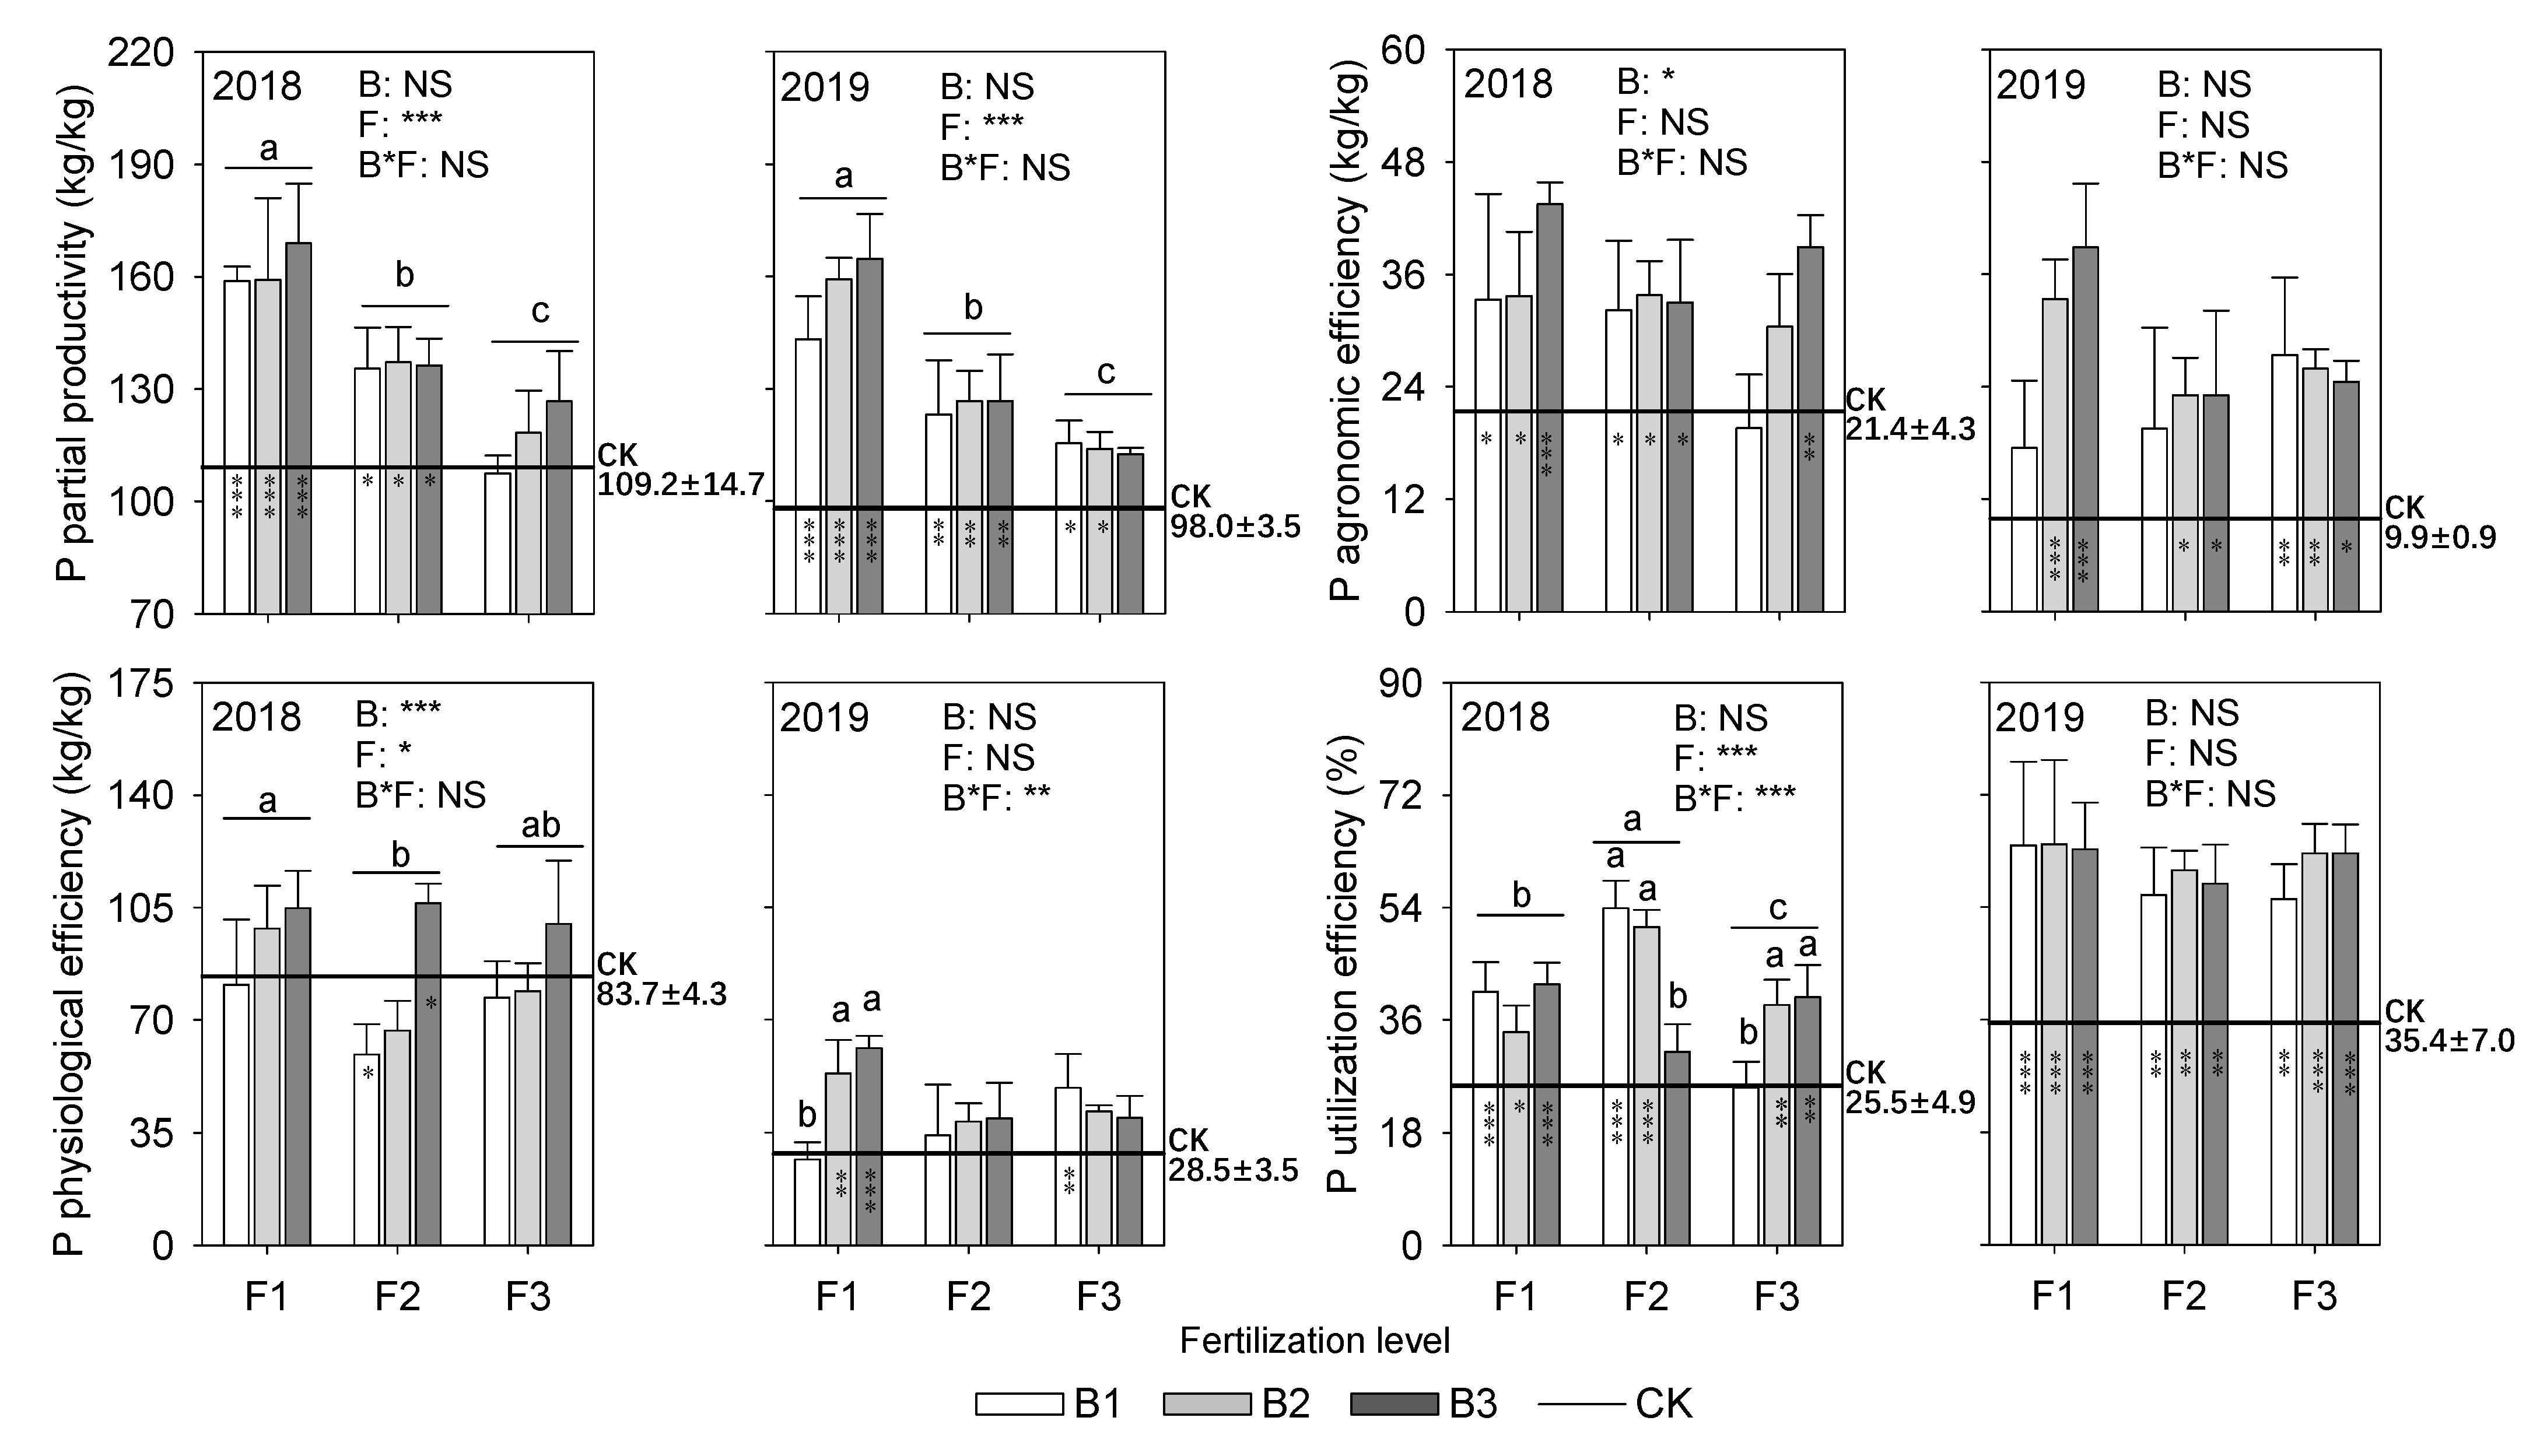
3.3. Phosphorus Utilization
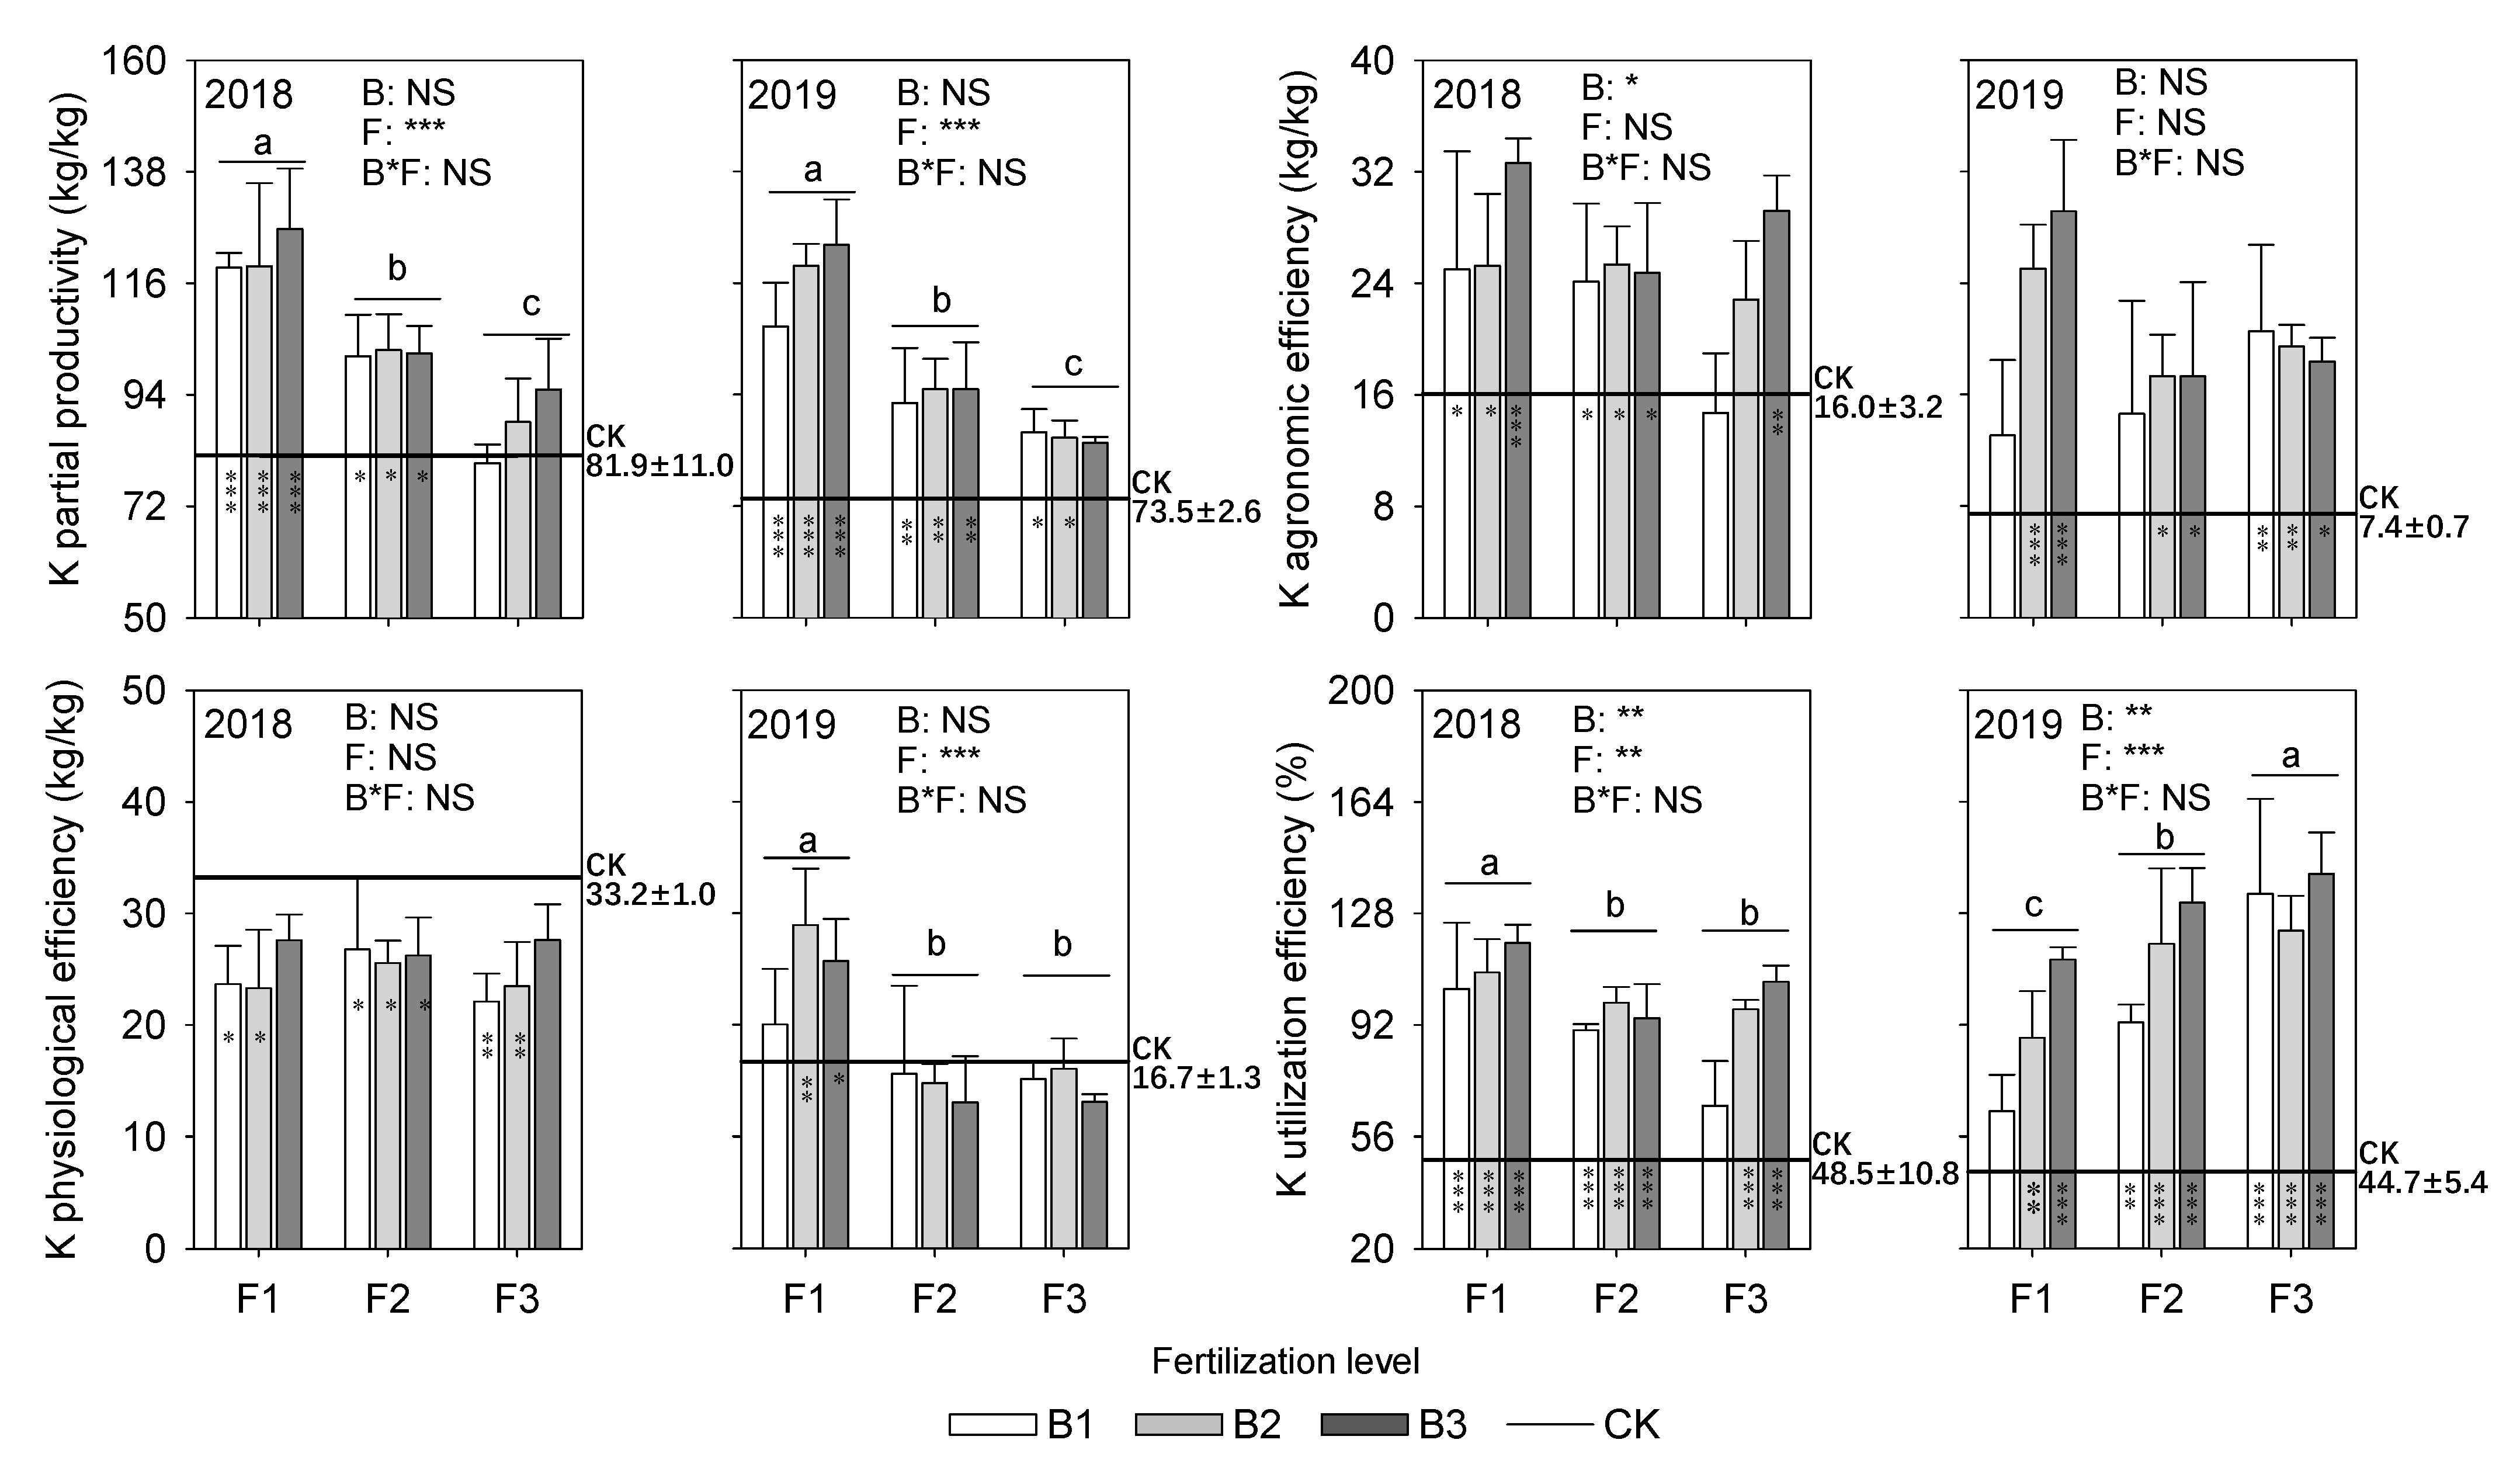
3.4. Potassium Utilization
4. Discussion
5. Conclusions
Author Contributions
Funding
Data Availability Statement
Conflicts of Interest
References
- National Bureau of Statistics of China. China Statistical Yearbook; China Statistics Press: Beijing, China, 2022.
- Wu, L.Q.; Wu, L.; Cui, Z.L.; Chen, X.; Zhang, F. Studies on recommended nitrogen, phosphorus and potassium application rates and special fertilizer formulae for different rice production regions in China. J. China Agric. Univ. 2016, 21, 1–13. [Google Scholar]
- Zhang, F.S.; Wang, J.Q.; Zhang, W.F.; Cui, Z.L.; Ma, W.Q.; Chen, X.P.; Jiang, R.F. Nutrient use efficiencies of major cereal crops in china and measures for improvement. Acta Pedol. Sin. 2008, 45, 915–924. (In Chinese) [Google Scholar]
- Zhu, J.H.; Li, X.L.; Christie, P.; Li, J.L. Environmental implications of low nitrogen use efficiency in excessively fertilized hot pepper (Capsicum frutescens L.) cropping systems. Agric. Ecosyst. Environ. 2005, 111, 70–80. [Google Scholar] [CrossRef]
- Zalidis, G.; Stamatiadis, S.; Takavakoglou, V.; Eskridge, K.; Misopolinos, N. Impacts of agricultural practices on soil and water quality in the Mediterranean region and proposed assessment methodology. Agric. Ecosyst. Environ. 2002, 88, 137–146. [Google Scholar] [CrossRef]
- Carpenter, S.R.; Caraco, N.F.; Correll, D.L.; Howarth, R.W.; Sharpley, A.N.; Smith, V.H. Nonpoint pollution of surface waters with phosphorus and nitrogen. Ecol. Appl. 1998, 8, 559–568. [Google Scholar] [CrossRef]
- Liu, X.; Shi, L.J.; Qian, H.Y.; Sun, S.K.; Wu, P.T.; Zhao, X.N.; Engel, B.A.; Wang, Y.B. New problems of food security in Northwest China: A sustainability perspective. Land Degrad. Dev. 2020, 31, 975–989. [Google Scholar] [CrossRef]
- IPCC, Climate Change 2014: Mitigation of Climate Change. Contribution of Working Group III to the Fifth Assessment Report of the Intergovernmental Panel on Climate Change; Cambridge University Press: Cambridge, UK; New York, NY, USA, 2014.
- Lehmann, J.; Joseph, S. Biochar for environmental management: An introduction. In Biochar for Environmental Management: Science and Technology; Lehmann, J., Joseph, S., Eds.; Earthscan: London, UK, 2009; pp. 1–12. [Google Scholar]
- Liu, Y.; Li, H.D.; Hu, T.S.; Mahmoud, A.; Li, J.; Zhu, R.; Jiao, X.Y.; Jing, P.R. A quantitative review of the effects of biochar application on rice yield and nitrogen use efficiency in paddy fields: A meta-analysis. Sci. Total Environ. 2022, 830, 154792. [Google Scholar] [CrossRef]
- Rong, F.L.; Cai, Z.W.; Qin, S.S.; Zhang, K.; Wu, L.Q.; Yang, S.Y.; Xiao, Z.H.; Ren, B.; Lin, Y.S.; Chen, F.L. Effects of biochar on growth and yield of rice in an acidic paddy field: Findings from a five-year field trial. Acta Ecol. Sin. 2020, 40, 4413–4424. (In Chinese) [Google Scholar]
- Liu, Y.; Li, Z.H.; Zou, B.; Sun, S.Y.; Guo, J.Z.; Sun, C.X. Research progress in effects of biochar application on crop growth and synergistic mechanism of biochar with fertilizer. J. Appl. Ecol. 2017, 28, 1030–1038. (In Chinese) [Google Scholar]
- Zhang, D.; Wang, H.Y.; Pan, J.T.; Luo, J.F.; Liu, J.; Gu, B.J.; Liu, S.; Zhai, L.M.; Lindsey, S.; Zhang, Y.T.; et al. Nitrogen application rates need to be reduced for half of the rice paddy fields in China. Agr. Ecosyst. Environ. 2018, 265, 8–14. [Google Scholar] [CrossRef]
- Doulgeris, C.; Kypritidou, Z.; Kinigopoulou, V.; Hatzigiannakis, E. Simulation of Potassium Availability in the Application of Biochar in Agricultural Soil. Agronomy 2023, 13, 784. [Google Scholar] [CrossRef]
- Zhang, Q.Q.; Song, Y.F.; Wu, Z.; Yan, X.Y.; Gunina, A.; Kuzyakov, Y.; Xiong, Z.Q. Effects of six-year biochar amendment on soil aggregation, crop growth, and nitrogen and phosphorus use efficiencies in a rice-wheat rotation. J. Clean. Prod. 2020, 242, 118435. [Google Scholar] [CrossRef]
- Wei, W.X.; Xie, X.L.; Qin, H.L.; Li, F.N.; Chen, A.L.; Zhang, W.Z.; Sheng, R.; Chen, Y.G.; Hou, H.J.; Yin, C.M.; et al. Long-term Observational Studies of Complex Agro-ecosystem Promotes Agricultural Sustainable Development in Hilly Red Soil Region of South China. Bull. Chin. Acad. Sci. 2019, 34, 231–243. (In Chinese) [Google Scholar]
- Wu, Y.F.; Zhong, J.Z.; Gao, Y.J.; Liao, Y.L.; Nie, J.; Lu, Y.H. Fertilizer Use Efficiency of Three Grain and Oil-Bearing Crops in Hunan Province. Hunan Agric. Sci. 2022, 51, 33–37. (In Chinese) [Google Scholar]
- Zhuang, Y.H.; Ruan, S.H.; Zhang, L.; Chen, J.R.; Li, S.S.; Wen, W.J.; Liu, H.B. Effects and potential of optimized fertilization practices for rice production in China. Agron. Sustain. Dev. 2022, 42, 32. [Google Scholar] [CrossRef]
- An, N.; Zhang, L.; Liu, Y.X.; Shen, S.; Li, N.; Wu, Z.C.; Yang, J.F.; Han, W.; Han, X.R. Biochar application with reduced chemical fertilizers improves soil pore structure and rice productivity. Chemosphere 2022, 298, 134304. [Google Scholar] [CrossRef]
- Ning, C.C.; Liu, R.; Kuang, X.Z.; Chen, H.L.; Tian, J.H.; Cai, K.Z. Nitrogen Fertilizer Reduction Combined with Biochar Application Maintain the Yield and Nitrogen Supply of Rice but Improve the Nitrogen Use Efficiency. Agronomy 2022, 12, 3039. [Google Scholar] [CrossRef]
- Li, D.D.; He, H.; Zhou, G.L.; He, Q.H.; Yang, S.Y. Rice Yield and Greenhouse Gas Emissions Due to Biochar and Straw Application under Optimal Reduced N Fertilizers in a Double Season Rice Cropping System. Agronomy 2023, 13, 1023. [Google Scholar] [CrossRef]
- Bai, S.H.; Omidvar, N.; Gallart, M.; Kämper, W.; Tahmasbian, I.; Farrar, M.B.; Singh, K.; Zhou, G.; Muqadass, B.; Xu, C.Y. Combined effects of biochar and fertilizer applications on yield: A review and meta-analysis. Sci. Total Environ. 2022, 808, 152073. [Google Scholar] [CrossRef]
- Liu, R.; Hafeez, A.; Li, E.L.; Meng, J.L.; Tian, J.H.; Cai, K.Z. Effects of nitrogen fertilizer reduction and biochar application on paddy soil nutrient and nitrogen uptake of rice. J. Appl. Ecol. 2022, 31, 2381–2389. (In Chinese) [Google Scholar]
- Che, S.G.; Zhao, B.Q.; Li, Y.T.; Yuan, L.; Lin, Z.A.; Hu, S.W.; Shen, B. Nutrient uptake requirements with increasing grain yield for rice in China. J. Integr. Agr. 2016, 15, 907–917. [Google Scholar] [CrossRef]
- Huang, M.; Yang, L.; Qin, H.D.; Jiang, L.G.; Zou, Y.B. Fertilizer nitrogen uptake by rice increased by biochar application. Biol. Fertil. Soils 2014, 50, 997–1000. [Google Scholar] [CrossRef]
- Dai, Z.M.; Zhang, X.J.; Tang, C.; Muhammad, N.; Wu, J.J.; Brookes, P.C.; Xu, J.M. Potential role of biochars in decreasing soil acidification—A critical review. Sci. Total Environ. 2017, 581–582, 601–611. [Google Scholar] [CrossRef] [PubMed]
- He, L.L.; Zhao, J.; Wang, M.J.; Liu, Y.X.; Wang, Y.Y.; Yang, S.M.; Wang, S.Q.; Zhao, X.; Lyu, H.H. Long-Term Successive Seasonal Application of Rice Straw-Derived Biochar Improves the Acidity and Fertility of Red Soil in Southern China. Agronomy 2023, 13, 505. [Google Scholar] [CrossRef]
- Glaser, B.; Lehr, V.I. Biochar effects on phosphorus availability in agricultural soils: A meta-analysis. Sci. Rep. 2019, 9, 9338. [Google Scholar] [CrossRef]
- Limwikran, T.; Kheoruenromne, I.; Suddhiprakarn, A.; Prakongkep, N.; Gilkes, R.J. Dissolution of K, Ca, and P from biochar grains in tropical soils. Geoderma 2018, 312, 139–150. [Google Scholar] [CrossRef]
- Liao, J.Y.; Hu, A.; Zhao, Z.W.; Liu, X.R.; Jiang, C.; Zhang, Z.H. Biochar with large specific surface area recruits N2O-reducing microbes and mitigate N2O emission. Soil Biol. Biochem. 2021, 156, 108212. [Google Scholar] [CrossRef]
- Fan, Q.Y.; Sun, J.X.; Chu, L.; Cui, L.Q.; Quan, G.X.; Yan, J.L.; Hussain, Q.; Iqbal, M. Effects of chemical oxidation on surface oxygen-containing functional groups and adsorption behavior of biochar. Chemosphere 2018, 207, 33–40. [Google Scholar] [CrossRef]
- Leng, L.J.; Xiong, Q.; Yang, L.H.; Li, H.; Zhou, Y.Y.; Zhang, W.J.; Jiang, S.J.; Li, H.L.; Huang, H.J. An overview on engineering the surface area and porosity of biochar. Sci. Total Environ. 2021, 763, 144204. [Google Scholar] [CrossRef]
- Huang, X.F.; Li, S.Q.; Li, S.Y.; Ye, G.Y.; Lu, L.J.; Zhang, L.; Yang, L.Y.; Qian, X.; Liu, J. The effects of biochar and dredged sediments on soil structure and fertility promote the growth, photosynthetic and rhizosphere microbial diversity of Phragmites communis (Cav.) Trin. ex Steud. Sci. Total Environ. 2019, 697, 134073. [Google Scholar] [CrossRef]
- Bohara, H.; Dodla, S.; Wang, J.J.; Darapuneni, M.; Acharya, B.S.; Magdi, S.; Pavuluri, K. Influence of poultry litter and biochar on soil water dynamics and nutrient leaching from a very fine sandy loam soil. Soil Till. Res. 2019, 189, 44–51. [Google Scholar] [CrossRef]
- Yao, Q.; Liu, J.J.; Yu, Z.H.; Li, Y.S.; Jin, J.; Liu, X.B.; Wang, G.H. Three years of biochar amendment alters soil physiochemical properties and fungal community composition in a black soil of northeast China. Soil Biol. Biochem. 2017, 110, 56–67. [Google Scholar] [CrossRef]
- Liu, M.L.; Lin, Z.; Ke, X.L.; Fan, X.R.; Joseph, S.; Taherymoosavi, S.; Liu, X.Y.; Bian, R.J.; Solaiman, Z.M.; Li, L.Q.; et al. Rice Seedling Growth Promotion by Biochar Varies with Genotypes and Application Dosages. Front. Plant Sci. 2021, 12, 580462. [Google Scholar] [CrossRef]
- Yue, L.; Lian, F.; Han, Y.; Bao, Q.L.; Wang, Z.Y.; Xing, B.S. The effect of biochar nanoparticles on rice plant growth and the uptake of heavy metals: Implications for agronomic benefits and potential risk. Sci. Total Environ. 2019, 656, 9–18. [Google Scholar] [CrossRef]


Disclaimer/Publisher’s Note: The statements, opinions and data contained in all publications are solely those of the individual author(s) and contributor(s) and not of MDPI and/or the editor(s). MDPI and/or the editor(s) disclaim responsibility for any injury to people or property resulting from any ideas, methods, instructions or products referred to in the content. |
© 2023 by the authors. Licensee MDPI, Basel, Switzerland. This article is an open access article distributed under the terms and conditions of the Creative Commons Attribution (CC BY) license (https://creativecommons.org/licenses/by/4.0/).
Share and Cite
Qin, S.; Rong, F.; Zhang, M.; Su, G.; Wang, W.; Wu, L.; Wu, A.; Chen, F. Biochar Can Partially Substitute Fertilizer for Rice Production in Acid Paddy Field in Southern China. Agronomy 2023, 13, 1304. https://doi.org/10.3390/agronomy13051304
Qin S, Rong F, Zhang M, Su G, Wang W, Wu L, Wu A, Chen F. Biochar Can Partially Substitute Fertilizer for Rice Production in Acid Paddy Field in Southern China. Agronomy. 2023; 13(5):1304. https://doi.org/10.3390/agronomy13051304
Chicago/Turabian StyleQin, Shasha, Feilong Rong, Manyun Zhang, Guirui Su, Wei Wang, Liqun Wu, Aiping Wu, and Falin Chen. 2023. "Biochar Can Partially Substitute Fertilizer for Rice Production in Acid Paddy Field in Southern China" Agronomy 13, no. 5: 1304. https://doi.org/10.3390/agronomy13051304