Article

Impacts of Saline Water Irrigation on Soil Respiration from Cotton Fields in the North China Plain

1
Institute of Farmland Irrigation of Chinese Academy of Agriculture Sciences, Ministry of Agriculture and Rural Affairs, Xinxiang 453002, China
2
Graduate School of Chinese Academy of Agricultural Sciences, Beijing 100081, China
3
College of Water Conservancy and Civil Engineering, Shandong Agricultural University, Taian 271018, China
4
Institute of Dryland Farming, Hebei Academy of Agriculture and Forestry Sciences, Hengshui 053000, China
*
Authors to whom correspondence should be addressed.
Agronomy 2023, 13(5), 1197; https://doi.org/10.3390/agronomy13051197
Submission received: 31 January 2023 / Revised: 25 March 2023 / Accepted: 17 April 2023 / Published: 24 April 2023
(This article belongs to the Special Issue Saline Water Irrigation in Agriculture)

Abstract

:
Saline water irrigation has been widely used for crop production where agriculture is short of freshwater. However, information about the response of soil respiration to saline water irrigation is limited. To identify the effect of saline water irrigation on soil respiration, the experiment based on long-term saline water irrigation cotton fields (since 2006) was conducted in the Heilonggang area in 2021. Five salinity levels in irrigation water were tested (3.4 [S1], 7.1 [S2], 10.6 [S3], 14.1 [S4], and 17.7 dS m−1 [S5]), and deep ground water (1.3 dS m−1) was used as the control (CK). After 15 years of saline water irrigation, we monitored soil physicochemical properties and soil respiration. In addition, we developed a structural equation model of the relationship between them. The results demonstrated that saline water irrigation significantly reduced soil water-stable aggregate content and porosity by 4.42–45.33% and 6.52–14.10%, respectively, and attenuated soil cellulase, α-glucosidase, and alkaline phosphatase activity. Soil respiration under saline water irrigation was significantly reduced by 5.28–33.08%. Moreover, saline water irrigation with salinity below 10.6 dS m−1 had no significant effect on cotton yield. Moreover, soil salinity (62%), water-stable aggregate content (46%), and soil porosity (25%) had significant effects on soil respiration, and soil porosity had a significant positive effect on soil alkaline phosphatase activity according to the structural equation model. Overall, saline irrigation with salinity below 10.6 dS m−1 can alleviate water shortages and reduce soil carbon emissions without affecting cotton yield in the study area.

1. Introduction

Agriculture is one of the major sources of greenhouse gas emissions [1]. The Fifth Assessment Report of the IPCC stated that greenhouse gas emissions from agricultural sources account for 24% of total global greenhouse gas emissions. Notably, from 1993 to 2007, the growth of greenhouse gas emissions in China was higher than that of the world’s average greenhouse gas emissions from agricultural activities [2]. Increasing global carbon dioxide (CO2) emissions results in additional climate warming [3]. Soil respiration (SR) is essential to the global carbon balance. It controls carbon emissions from the soil to the atmosphere that arise from the activities of roots and microbial populations [4]. SR is of great significance for accurately assessing the carbon budget of terrestrial ecosystems. Therefore, it is of great practical value to study SR in the agriculture field and consider mitigation strategies.
Irrigation is an important factor affecting agricultural environments and crop production [5]. However, the shortage of fresh water is getting worse. Exploiting alternative sources of fresh water has become important for alleviating irrigation water shortages [6]. Some researchers reported that saline water irrigation (SWI) could be applied for agricultural irrigation [7,8]. Abakumov et al. indicated that irrigation with water sources with mineralization rates of up to 2.8–3.5 g L−1 increased the wheat yield by 1.5 c ha−1 compared to the control [9]. The experimental results of Wang et al. showed that the salinity of irrigation water had no significant effect on cotton yield [10]. Therefore, the scientific and rational utilization of saline water is of great significance to solve the shortage of irrigation water resources [11]. The Heilonggang area is one of the principal areas in producing grains and cotton in the North China Plain. Due to the extreme shortage of surface water in this region, the deep groundwater has been overexploited for a long time, which seriously affects the sustainable use of water resources and the stable development of agriculture. As an alternative source of fresh water, shallow underground saline water resources in this area are abundant and widely distributed [12]. Therefore, it is necessary to conduct research in this area on SWI under freshwater resource shortage.
Carbon emissions are one of the important components of the soil carbon cycle. Carbon emissions due to SR are mainly influenced by the soil’s physical and chemical properties, including soil structure, soil enzyme activity, etc. The authors of [13] found a significant positive correlation between SR and soil porosity. This is because soil with large porosity has a good aeration environment, which is more conducive to SR. The research showed that soil aggregates significantly affected the microbial community, which in turn affected SR [14]. The authors of [15] proposed that increased soil enzyme activities such as soil cellulase and alkaline phosphatase promoted SR. In addition, some studies have found that soil structure can affect soil microorganisms [16]. Bhattacharyya et al. indicated that the loss of porosity in macroaggregates decreased the enzyme activity in cropped soils [17]. Xia et al. showed that soil texture ranked second after pH in shaping the soil microbial community [18]. Therefore, the study of SR should not only consider soil microorganisms, but also the soil structure for comprehensive analysis.
Currently, the SR research focuses on different fertilization, water and fertilizer integration, and irrigation methods [19,20]. Few researchers have studied SR with SWI. Previous studies have found that saline water has effects on soil physical and chemical properties [21,22]. The authors of [23] proposed that the bulk density of the soil plow layer increased with increased irrigation-water salinity, while soil porosity and the content of macroaggregates in the plow layer decreased. The authors of [24] found that increased salinity reduced the activity of soil enzymes in coastal marshes, leading to limited SR. This may be because the salt brought in during saltwater irrigation has a series of reactions with the aggregate structure, chemical elements, and organisms in the soil, resulting in changes in the physical and chemical properties of the soil. However, information on the relationship between soil structure and soil enzyme activity as well as links between carbon emissions and soil physical and chemical properties under SWI remain poorly understood.
Previous studies only considered the causes of SR changes from a single perspective. We attempt to explain the changes of SR in SWI from the perspective of soil structure and enzyme activity by measuring soil physical and chemical properties such as soil porosity, water-stable aggregate content, and soil enzyme activity. We want to propose irrigation water salinity that has little impact on cotton yield and can reduce carbon emissions in this area by measuring cotton yield and SR. The detailed objectives of this study are (1) to analyze the effect of SWI on soil physical and chemical properties; (2) to explore the responses of cotton yield and SR under SWI; and (3) to study the effect of SWI on relationships between SR and soil physical and chemical properties.

2. Materials and Methods

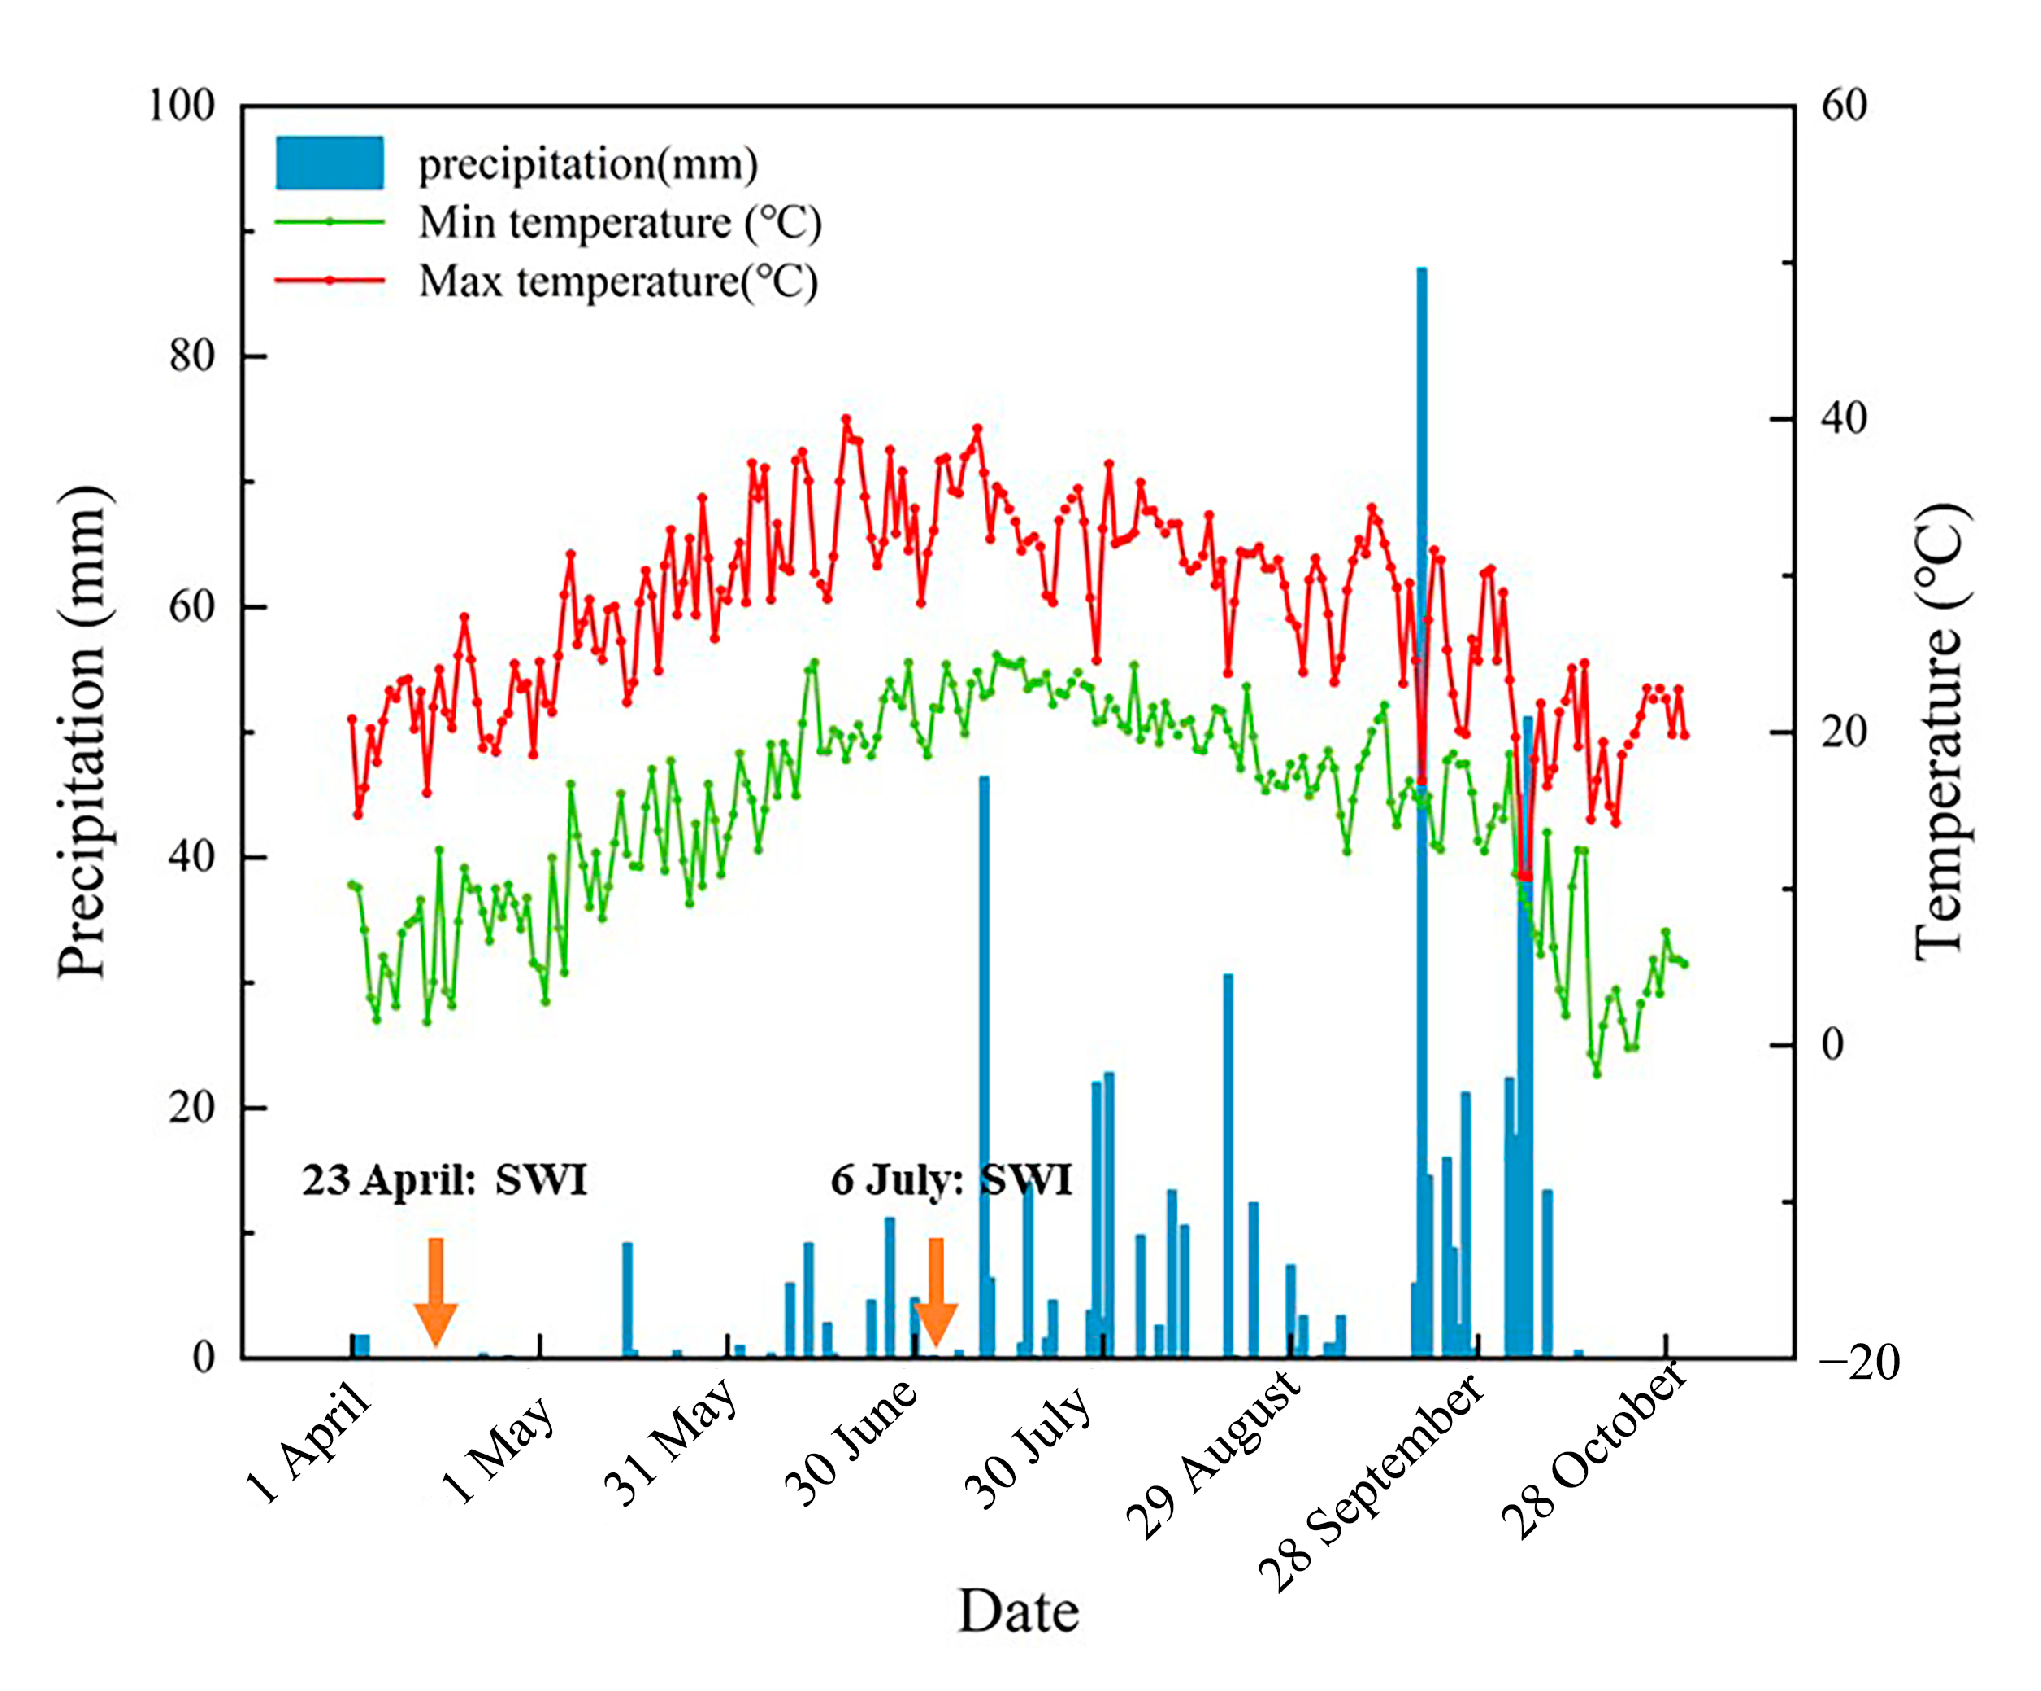
2.1. Study Site Description

The experiment was conducted at the dry-land farming and water-saving agricultural test site (37°44′ N, 115°47′ E; and 21 m above sea level) at the Dry-Land Farming Institute of Hebei Academy of Agriculture and Forestry Sciences (Figure 1). The study site is characterized by a semi-humid and semiarid climate with an annual average temperature of 12.8 °C. The annual average rainfall is 500 mm, which mostly occurs during July and September. The soil texture of the experimental field is loam (0–20 cm), and the groundwater depth is below 5 m. This study was carried out in the field with long-term saline water irrigation. The physical and chemical properties of the soil plow layer at the beginning of the experiment in 2006 are presented in Table 1.

2.2. Experimental Design

The long-term saline water irrigation experiment began in April 2006. The experimental plots were arranged in a randomized block design, and each plot was 37.62 m2 (6.6 m × 5.7 m) in area. According to the reports, shallow groundwater salinity in the Heilonggang region tends to increase from low plains to coastal plains, mainly ranging from 2 to 10 g L−1 (about 3.4 to 17.7 dS m−1) [25,26]. Therefore, five salinity levels of irrigation water were tested in the study: 3.4, 7.1, 10.6, 14.1, and 17.7 dS m−1, named S1, S2, S3, S4, and S5, respectively. The treatments were replicated three times. In addition, local deep groundwater with an EC of 1.3 dS m−1 (considered as freshwater) was used as the control treatment (CK). The shallow saline groundwater in the study area was mainly formed by continental salinization and seawater intrusion and primarily included Na+ and CI- ions [27]. Therefore, the irrigation water for the S1–S5 treatments was obtained by mixing deep groundwater (1.3 dS m−1) with sea salt. The ion content in the irrigation water is presented in Table 2. The irrigation method was border irrigation, and the water meter was used for measurement. Irrigation water was supplied when the soil moisture content was lower than 65% of the field capacity.
This paper took the 16th year of continuous SWI experiments (2021) as an example to analyze the effects of long-term SWI on SR. Spring cotton cultivar Ji 863 was sown on 29 April and harvested on 9 November 2021. The 2021 experiment was conducted from April to November. Field preparation, tillage, and fertilizer application were conducted on 28 April. A total of 750 kg ha−1 of compound fertilizer (15% N, 15% P2O5, and 15% K2O) was applied to the plots, followed by rotary tillage. Cotton was sown manually, with three seeds per hole in each plot. The rows had an alternating narrow-wide spacing of 50–90 cm, and the narrow rows were mulched with transparent plastic film.
The irrigation dates and quotas of the six treatments were the same during the experiment. Irrigation water of 75 mm was applied on 23 April and 6 July. Daily air temperatures and precipitation were collected from a weather station (Figure 2). The rainfall was 587.6 mm during the experimental period. The rainfall in the bud stage (from 14 June to 11 July) and the flowering and boll stage (from 12 July to 28 August) were 71.20 mm and 159.60 mm, respectively.

2.3. Soil Physical and Chemical Properties Measurement

The current study’s soil physical and chemical properties included soil salinity, water-stable aggregates, porosity, and enzyme activity. Soil samples were collected from the soil tillage layer (0–20 cm layer). The sampling dates were 19 April (BE: before the experiment), 5 July (BS: the bud stage), and 14 August (FBS: the flowering and boll stage).

2.3.1. Soil Salinity

After air-drying, the soil samples were ground and then sieved using a 1 mm sieve. The electrical conductivity (EC1:5) of the mixed solution, prepared using soil and water in a 1:5 ratio by weight, was measured using a conductivity meter (Orion Star A322, Thermo Scientific, Waltham, MA, USA). To facilitate comparisons with other international research, the EC of the saturated soil extract (ECe) was also measured. The saturated paste was prepared according to the US Salinity Laboratory (1954) method, which was employed to obtain a saturated extract. ECe was measured using the conductivity meter, and the relationship between the EC1:5 and ECe is expressed by Equation (1):
EC e = 9.367 EC 1 : 5   0.001 R 2 = 0 . 990

2.3.2. Soil Water-Stable Aggregates

The TPF-100 soil aggregate structure analyzer was used to determine the composition of soil water-stable aggregates, and the determination method was the wet sieving method. A total of 50 g of the air-dried soil sample was put into the top layer of the sieve. The mesh sizes of the sieves were 5, 2, 1, 0.5, 0.25, and 0.053 mm, respectively. The soil of all the sieve layers was collected into aluminum boxes after sieving. Then, the soil was weighed after being dried in an oven at 60 °C.
R0.25 (>0.25 mm water-stable aggregate content) was calculated as follows [28]:
  R 0.25 = M i > 0.25 M T
where R0.25 (%) is the soil particle size greater than 0.25 mm water-stable aggregate content. Mi>0.25 (g) is the mass of water-stable aggregates greater than 0.25 mm in diameter. MT (g) is the total aggregate mass.

2.3.3. Soil Porosity

The ring-knife method was used to measure soil bulk density [29]. The soil samples were taken from the 0–20 cm soil layer of each plot, and three ring knives were taken from each plot.
Soil porosity was calculated as follows:
P = 1     γ / d   ×   100
where P is the soil porosity (%), γ is the soil bulk density (g cm–3), and d is the soil-specific gravity (2.65 g cm–3) [30].

2.3.4. Soil Enzyme Activity

Soil enzyme activity was measured using an enzyme activity assay kit (Suzhou Keming Biotechnology Co., Ltd., Suzhou, China). Soil cellulase, α-glucosidase, and alkaline phosphatase activity were calculated as follows:
S - CL = ( Δ A + 0.0462 ) / 2.5090   ×   V / W / T
  S - α - GC = Δ A + 0.0027 / 0.0016   ×   V / W / T
S - AKP = 0.725   ×   A 1   A 0 / A 2   A 0 / W
where S-CL (mg d−1 g−1) is the soil cellulase activity. S-α-GC (μmol d−1 g−1) is the soil α-glucosidase activity. S-AKP (μmol d−1 g−1) is the soil alkaline phosphatase activity. ΔA (Abs) is the difference in the photometric value between the measured value group and the control group, determined by the microplate reader (Thermo Fisher, VarioskanFlash, Waltham, MA, USA). A0 (Abs) is the luminosity value of the blank group. A1 (Abs) is the photometric value of the measurement group. A2 (Abs) is the photometric value of the standard group. V(ml) is the total volume of the reaction system. W(g) is the sample weight. T (d) is the reaction time. The coefficients in the three formulas are determined according to the standard regression equation. In Equation (4), the unit of coefficient 0.0462 is Abs, and the unit of coefficient 2.5090 is Abs ml mg−1. In Equation (5), the unit of coefficient 0.0462 is Abs, and the unit of coefficient 0.0016 is Abs ml μmol−1. In Equation (6), the unit of coefficient 0.725 is μmol d−1.

2.4. SR Measurement

The static chamber (50 cm by 50 cm by 15 cm) system, made up of a base (groove at the top), which was permanently installed into the ground, and a chamber box (opaque PVC), equipped with a battery-powered fan and an access tube for the gas collection, was used for gas sampling. After sowing the cotton, the base of the sampling box was installed 15 cm below the bare ground between cotton rows with a groove at the top of the base located at the surface.
Gas samples were collected once a week during the cotton bud, flowering, and boll stages. Samples were collected for five consecutive days after the irrigation event until the emission rate stabilized. After the sampling box was fixed on the base, water was poured into the groove of the base to ensure the tightness of the static chamber system. The gas was then extracted at 0, 10, 20, and 30 min using a 50 mL syringe. The temperature was also measured at the same time, and the samples were collected between 8:00 am and 11:00 am. The samples were analyzed within 24 h using a gas chromatograph system (Shimadzu 2010 Plus, Shimadzu CO., Ltd., Kyoto, Japan).
The CO2 gas emission fluxes were calculated as follows [31]:
F = ρ   ×   h   ×   273 273 + T × dc dt
where F is the gas emission flux in mg m−2 h−1, ρ is the gas density in the standard atmospheric pressure condition, h (m) is the height of the chamber, T (°C) is the temperature inside the chamber, dc is the concentration of gases, dt (h) is the interval of time, and dc/dt (mg m−3 h−1) is the change rate of gas concentrations inside the chamber according to the slope of data plotted by four sampling points.
The cumulative emissions during the cotton growth season were calculated as follows [32]:
C = i = 1 n ( F i + 1 + F i ) / 2   ×   ( t i + 1   t i )   ×   24
where C is cumulative emissions in mg m−2 h−1, F is the gas emission flux in mg m−2 h−1, i is the number of measurements, (ti+1 − ti) is the number of days between two measurements, and n is the total number of measurement times.

2.5. Cotton Yield and Components Measurement

Cotton was divided into three batches based on maturity for manual picking from the central rows of each plot to determine seed cotton yield. The boll number per plant, the weight of 100 bolls, and the harvesting density were determined at the boll-opening stage.

2.6. Statistical Analysis

Origin 2019 (Origin, Wellesley, MA, USA) was used to plots the charts. SPSS 23.0 (SPSS, Chicago, IL, USA) was used for analysis of variation (ANOVA), and Duncan’s multiple range test was used to compare significant differences. Furthermore, we employed the structural equation model (SEM) to establish direct versus indirect relationships between SR and soil physical and chemical properties. We constructed our SEM in the “lavaan” package [33] of R 4.2.0 (R Core Team (2022)).

3. Results

3.1. Soil Physical and Chemical Properties

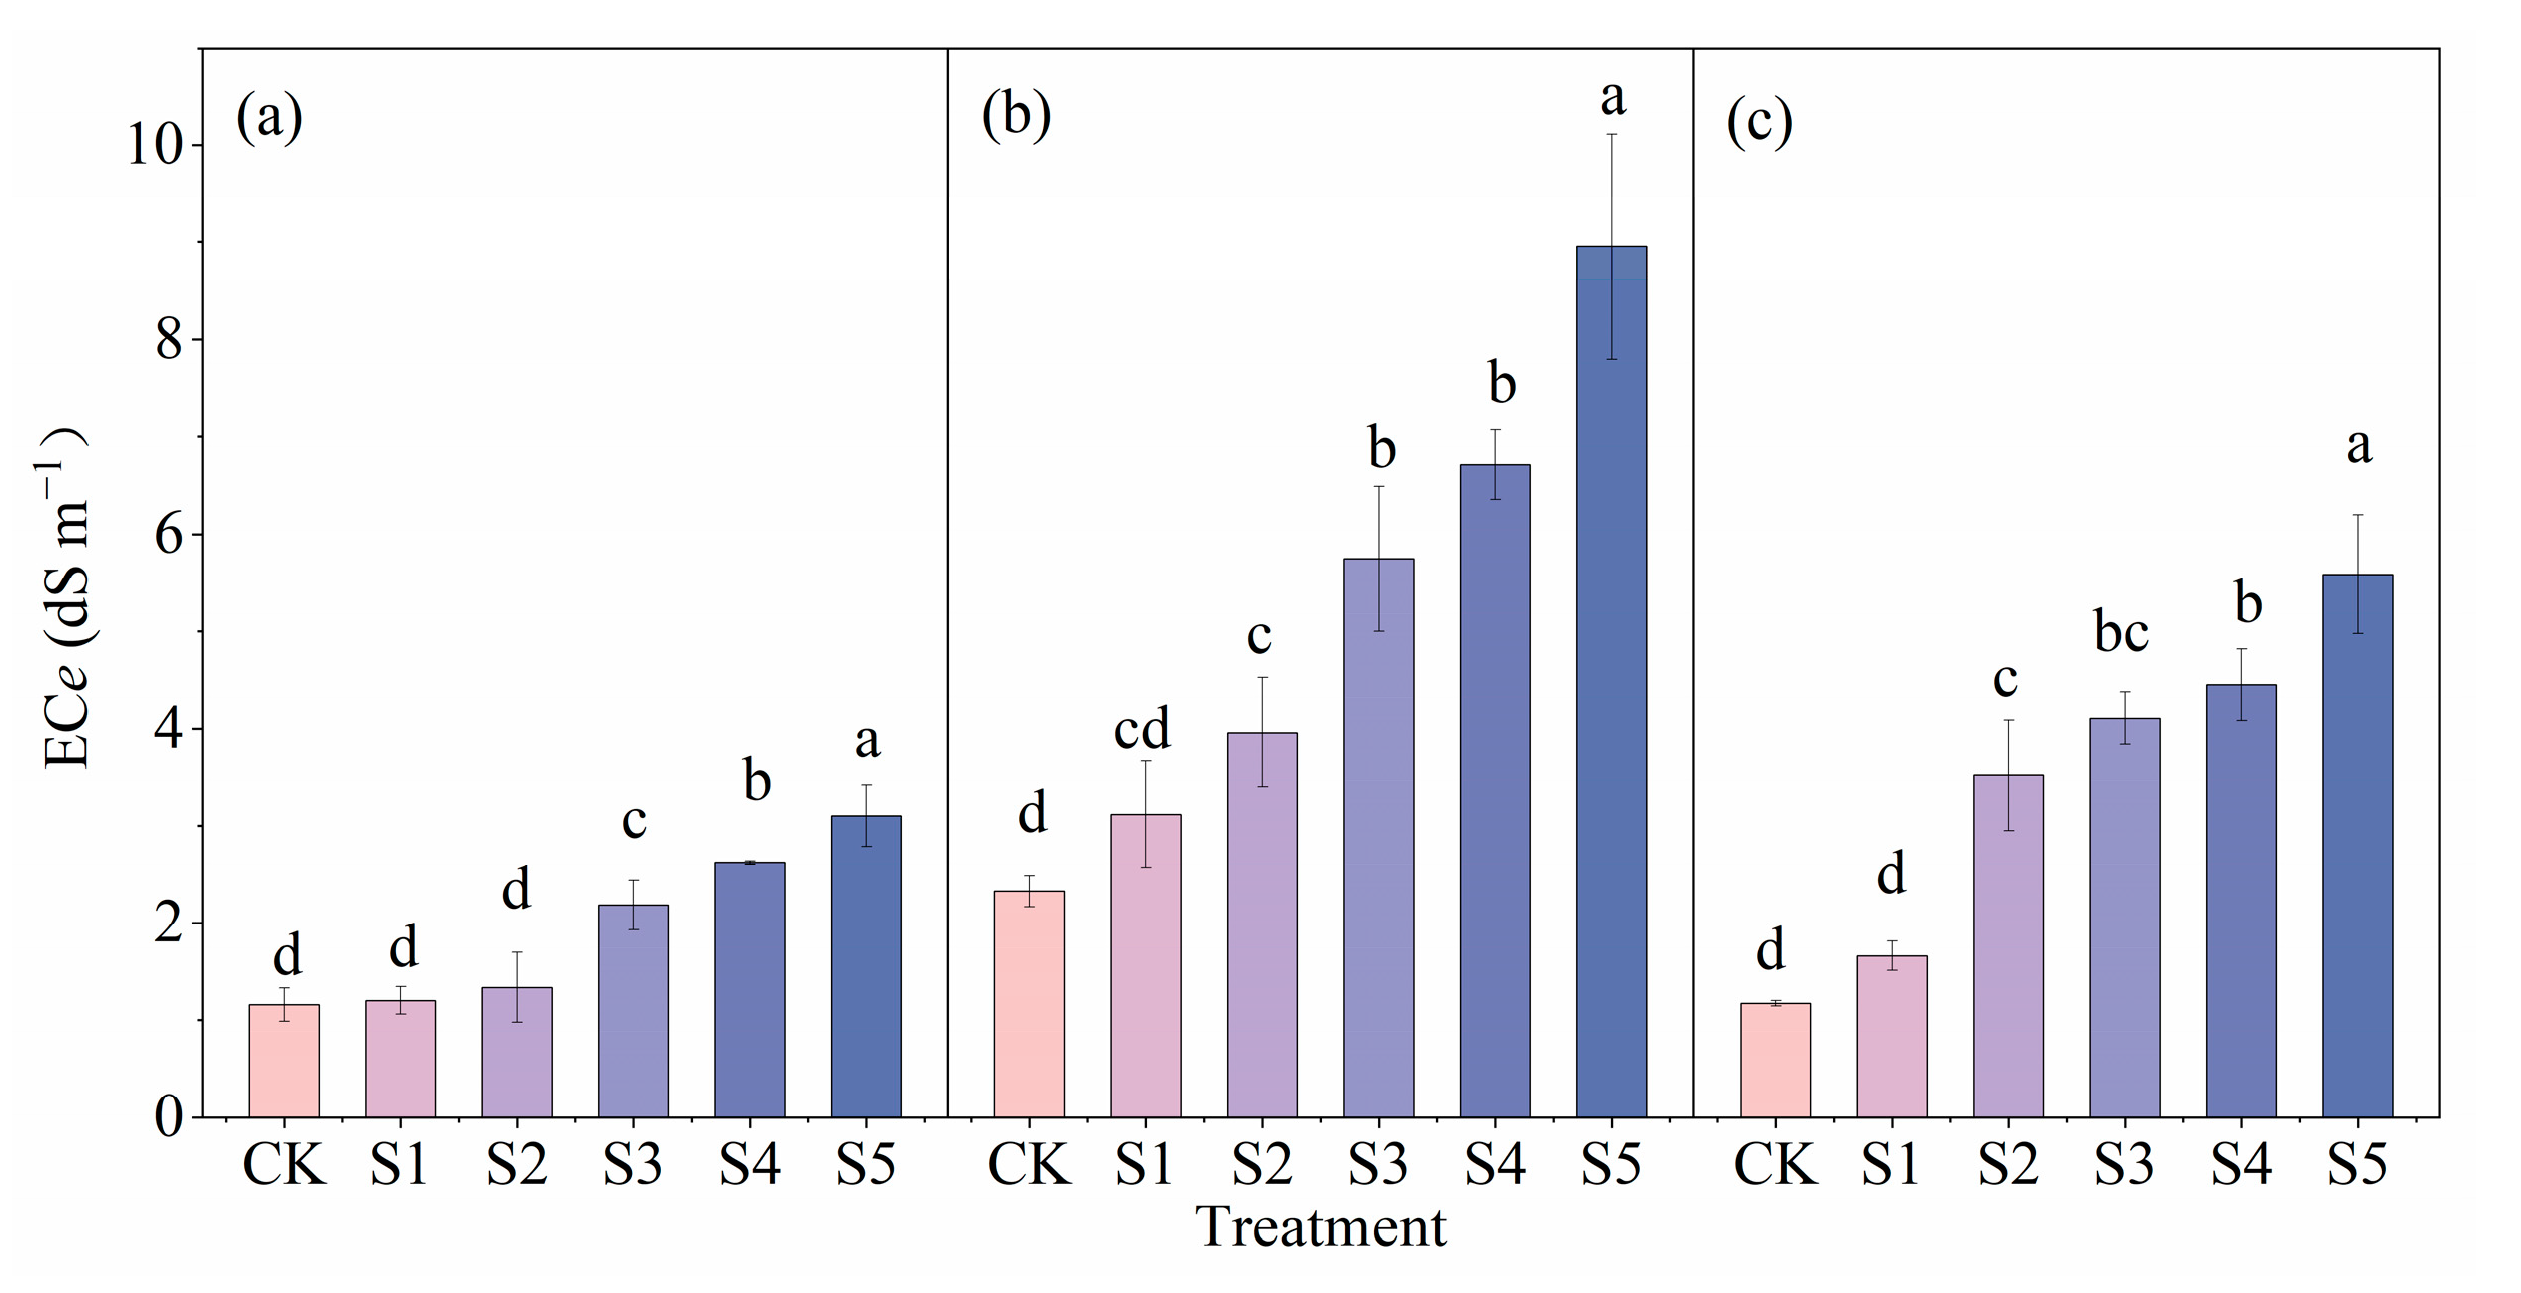
3.1.1. Soil Salinity

ECe had a consistent trend in the three stages (BE, BS, and FBS). It showed an increasing trend with increased irrigation water salinity (Figure 3). Compared with CK, S3–S5 of BE significantly increased by 88.80–167.79% (p < 0.01) (Figure 3a), while S2–S5 significantly increased by 70.15–284.66% and 41.60–375.86% in BS and FBS (p < 0.01), respectively (Figure 3b,c). ECe in BS and FBS was 101.01–188.74% and 1.32–80.05% higher, respectively, than that in BE. Soil salinity decreased in FBS, which may be related to the rainfall in FBS (159.60 mm) being higher than that in BS (71.20 mm).

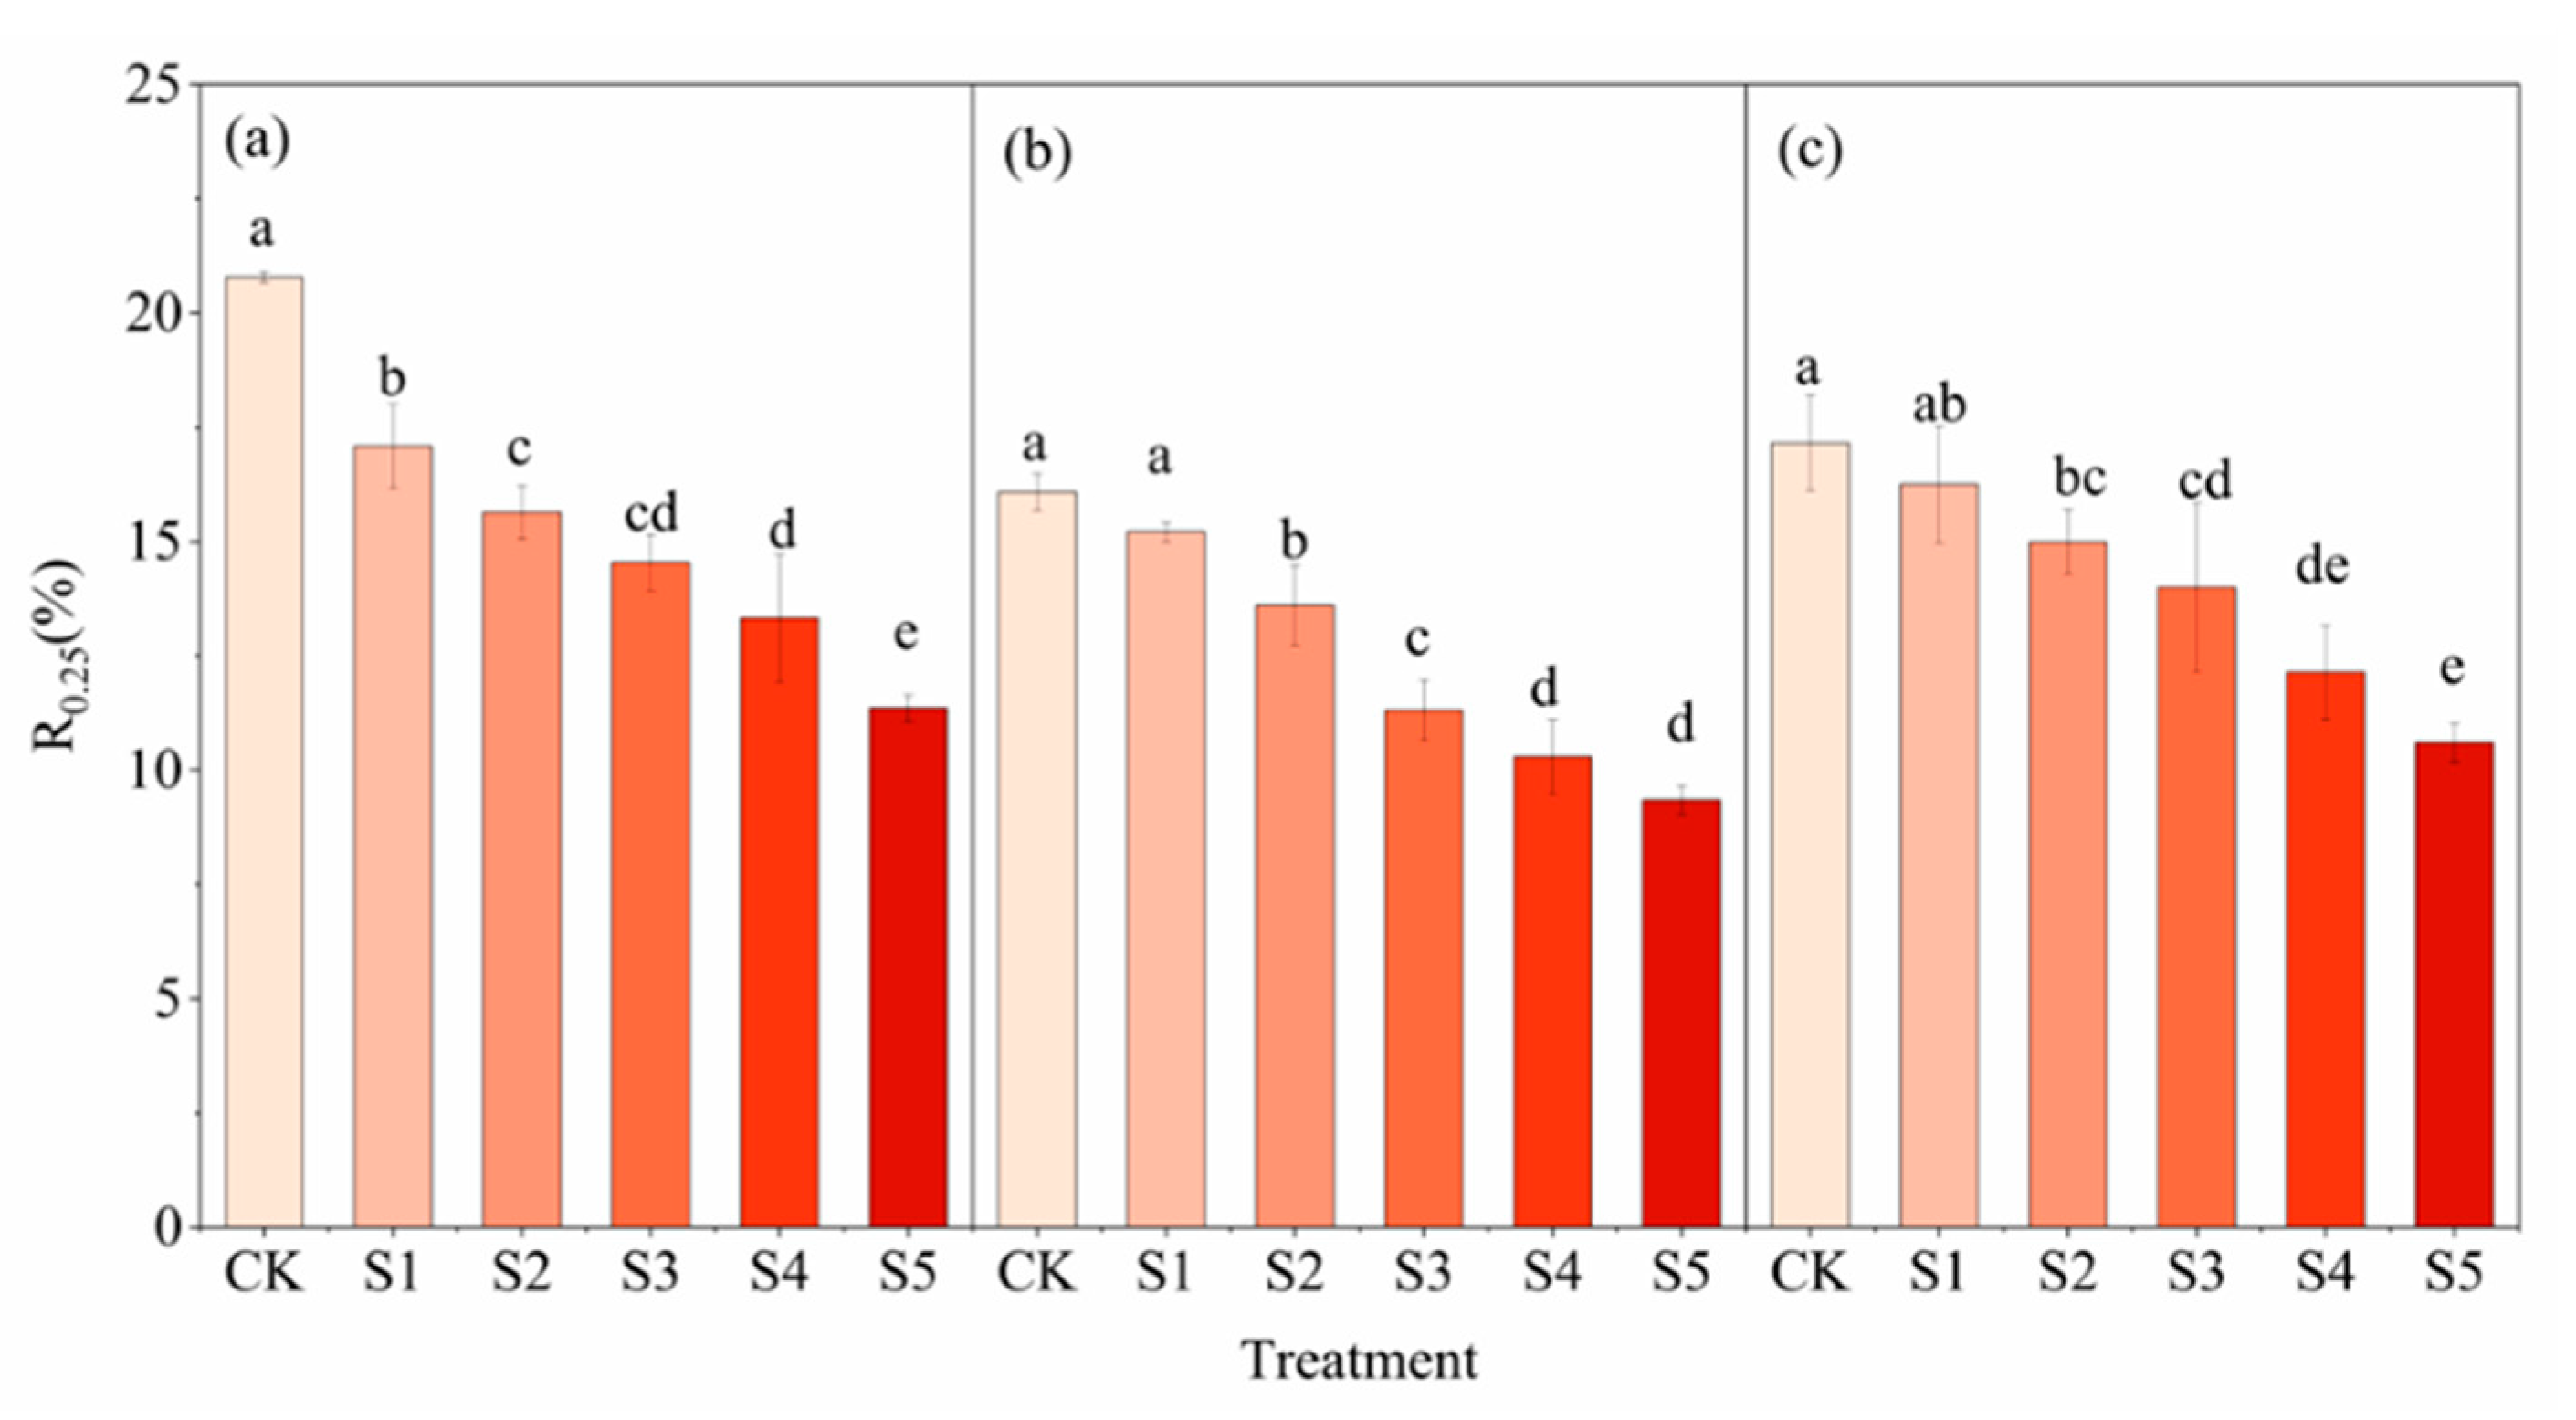
3.1.2. Soil Water-Stable Aggregates

In this study, we found that SWI resulted in a decrease in soil water-stable aggregate content (R0.25) (Figure 4). Compared with CK, the R0.25 of S1–S5 decreased significantly by 17.79–45.33% in BE (p < 0.01) (Figure 4a), while the R0.25 of S2–S5 significantly decreased by 4.42–41.92% and 12.63–38.21% in BS and FBS (p < 0.01), respectively (Figure 4b,c). Compared with BE (Figure 4a), the R0.25 was reduced by 10.97–22.76% and 3.72–17.42% in BS and FBS, respectively.

3.1.3. Soil Porosity

The variation of soil porosity in the three stages was generally consistent and showed a decreasing trend with increased irrigation water salinity (Figure 5). Compared with CK, the soil porosity of S2–S5 reduced significantly by 7.39–14.10% (p < 0.05) and 6.52–13.01% (p < 0.01) in BE and BS, respectively (Figure 5a,b). By contrast, the porosity with S4–S5 treatments significantly decreased by 9.43–10.37% compared with CK in FBS (p < 0.05) (Figure 5c). Compared with BE (Figure 5a), the soil porosity decreased by 6.20–9.06% and 0.30–4.45% in BS and FBS, respectively (Figure 5b,c).

3.1.4. Soil Enzyme Activity

The soil enzyme activity decreased as irrigation water salinity increased. The cellulase activity of S4 and S5 was significantly lower than that of CK in BE (p < 0.05) (Figure 6a–c). Compared with BE, the alkaline phosphatase activity of BS and FBS was decreased by 11.03–20.00% and 14.25–35.58%, respectively (Figure 6d–f), and the α-glucosidase activity of BS and FBS was decreased by 23.52–43.76% and 21.83–37.45%, respectively (Figure 6g–i). Moreover, the activity of the three enzymes in FBS was higher than those in BS.

3.2. SR

With increased irrigation salinity, soil CO2 emissions decreased (Figure 7). The trends for all treatments were consistent at each date. After the irrigation on 6 July, the CO2 emissions of each treatment increased first and then decreased. Although the soil carbon emissions from SWI treatments (S1–S5) increased after irrigation, they were still lower than those of CK. Compared with FBS, the variations of SR were more intense in BS, and the SR values were lower. The highest emissions in BS and FBS were 543.10 and 607.93 mg m−2 h−1, respectively. The lowest emissions in BS and FBS were 139.59 and 201.35 mg m−2 h−1, respectively (Figure 7).
Table 3 shows the effects of SWI on CO2 cumulative emissions in different growth stages of cotton. The cumulative CO2 emissions decreased as irrigation water salinity increased. Compared with CK, the cumulative CO2 emissions of S1–S5 significantly decreased by 5.28–33.08% in BS. In FBS, the cumulative CO2 emissions of S2–S5 significantly decreased by 15.89–30.70%, and S1 decreased by 6.70% but not significantly compared with CK. The cumulative CO2 emissions were 49.99–51.70% higher in FBS than those in BS.

3.3. Cotton Yield

In the cotton growing season of 2021, the final number of bolls, boll weight, and seed cotton yield did not decrease with increased soil salinity (Table 4). The number of bolls in S5 was significantly lower than that in CK by 22%. The single boll weight of S4 and S5 was significantly lower than CK by 19% and 14%. The differences in these indicators among S1, S2, S3, and S4 treatments were slight. The order of seed cotton yield in 2021 from high to low was S1, CK, S2, S3, S4, and S5. Compared with CK, the yield of S1 increased by 1.64%, and the yields of S2, S3, S4, and S5 decreased by 3.35%, 7.33%, 20.81%, and 30.49%, respectively (Table 3). Irrigation water salinity below 10.6 dS m−1 had no significant impact on cotton yield components and yield in 2021.

3.4. Pathways Determining SR by SWI

We conducted structural equation model (SEM) analyses separately for the data from BS and FBS (Figure 8). We use ECe for SWI and CO2 cumulative emissions to represent SR. In BS, SWI significantly and negatively affected R0.25 (p < 0.005), α-glucosidase activity (p < 0.05), and alkaline phosphatase activity (p < 0.005) (Figure 8a). The effect of R0.25 (46%) was the greatest on SR among the five soil physical and chemical properties. Among the three enzymes, alkaline phosphatase activity (22%) has the greatest effect on SR (Figure 8a). In FBS, SWI had a significant negative effect on R0.25 and α-glucosidase activity (p < 0.005). Soil salinity (62%) (p < 0.01) and soil porosity (25%) (p < 0.05) significantly affect SR. Among the three enzymes, α-glucosidase activity (20%) had the most significant effect on SR (Figure 8b). In addition, soil porosity (43% and 33%) had a significant positive effect on alkaline phosphatase activity in BS and FBS (p < 0.05) (Figure 8b).

4. Discussion

4.1. Effect of SWI on Soil Physical and Chemical Properties

In this paper, we show that SWI increases soil salinity. ECe showed an increasing trend with increased irrigation water salinity. This is because the higher the salinity of irrigation water, the more salt it brings into the soil [34]. We found that the soil salinity of CK in BS was higher than in the other two periods. This is because the irrigation water salinity of CK was 1.3 dS m−1. Soil salinity will increase after irrigating salt water in BS. However, the soil ECe did not accumulate linearly with years, although it was related closely to amounts of irrigation and rainfall [23]. ECe in FBS is lower than that in BS, which may be due to the rainfall being large and concentrated in FBS, and the infiltration of soil water caused the migration of soil salt from the plow layer to the deep layer [35]. Therefore, soil salinity is dynamic and does not stay in the topsoil. It was found that rainfall can regulate the movement of water and solute in soil and reduce the accumulation of soil salinity in the plant root zone [36,37]. The leaching effect of rainfall alleviates the salt stress of SWI on crop production.
In order to evaluate the effect of SWI on soil structure, we analyzed the soil R0.25 and porosity under SWI. R0.25 of the SWI treatments was decreased compared with that of CK. SWI tended to reduce the content of soil water-stable aggregates, mainly because the Na+ ions brought by saline water exhibited a low electric charge, large radius, and small hydration energy, which caused the expansion and dispersion of soil colloidal particles [38]. At the same time, soil porosity decreased as irrigation water salinity increased. The study of Ji et al. [39] also showed that the increase in soil salinity reduced soil porosity. This is mainly due to the decrease in the proportion of elongated continuous pores [40]. Therefore, the soil R0.25 and porosity of FBS were slightly higher than those of BS due to the higher ECe in BS.
In addition, we found that SWI reduced the activities of some enzymes involved in carbon conversion. Compared with CK, cellulase, α-glucosidase, and alkaline phosphatase activity was decreased in the same stages of SWI treatment. This is because soil salt can change the soil microbial community structure and quantity, reduce soil enzyme activity through osmotic stress, and reduce the overall activity of soil enzymes [41].

4.2. Effect of SWI on SR and Cotton Yield

In our study, SWI reduced SR markedly (Figure 7 and Table 3). This may be because the ions brought by the SWI affect soil structure and enzyme activities, which lead to changes in microbial respiration [42]. The authors of [43] also found a negative correlation between the fluxes of CO2 and soil electrical conductivity. This may be because salt can affect the soil microbial community structure and quantity [44]. The results of [45] showed that soil microbial activities were greatly restrained in saline-water-irrigated soils and the number of bacterial phyla decreased with irrigation salinity. Our study also found that SWI reduced soil enzyme activity. Soil CO2 efflux is a combination of autotrophic and heterotrophic respiration [46], so the weakening of soil microbial activity reduces SR. At the same time, we also found that SWI reduced soil porosity, which indicated that soil permeability was weakened, and soil carbon emissions would be reduced because of this. This study also showed that soil carbon emissions were different in different growth stages of cotton. The cumulative soil carbon emissions were higher in FBS than in BS. The soil enzyme activity and porosity of FBS in this experiment were higher than those of BS, resulting in higher soil carbon emissions.
Meanwhile, the results showed that the soil CO2 emissions trend increased first and then decreased after SWI. The authors of [47] found that the increase of soil moisture can increase soil CO2 emissions. This trend may be because irrigation increases soil moisture and stimulates soil microbial activity and root respiration, leading to higher soil carbon emissions [14,48]. Although the soil carbon emissions of SWI also increased after irrigation, they were still lower than those of CK. It is because salinity decreases soil R0.25, porosity, and soil enzyme activity, resulting in a decrease in soil carbon emissions [13,14,15]. In addition, we found the CO2 emissions on June 14 to be even higher than those after irrigation. This is related to the rainfall conditions, as it rained on 13 June. Increased soil water content stimulates microbes, leading to higher gas emissions.
It can be seen from above that soil salinity and rainfall can affect soil respiration in cotton fields irrigated with saline water. Due to the influence of the inter-annual variation of rainfall, the salt migration dynamics in fields with SWI are very complex, which leads to the continuous effect of saltwater irrigation on the physical and chemical properties of surface soil [23]. It is difficult to determine the effect of salt on soil under short-term SWI. This study was carried out on the same localization experiment. We focus on the analysis of the results of the 16th year, which can comprehensively reflect the impact of successive years of SWI on soil. It remains to be further explored how SWI soil respiration changes under different annual patterns of rainfall.
We also found that the cotton yield increased first and then decreased with the increase of irrigation water salinity. It can be seen from Table 4 that this was related to the cotton harvest density, the final number of bolls, and the boll weight of each treatment. SWI with an appropriate saline water concentration had little effect on the cotton harvest density, boll number, boll weight, and seed cotton yield, but the yield decreased significantly when the irrigation water concentration exceeded 10.6 dS m−1. The reason is that cotton has a strong salt tolerance and drought resistance, and the salt stress caused by low saline water does not yet reach the level that significantly inhibits the number of cotton bolls and boll weight [23,49]. Considering the influence of SWI on SR and cotton yield, it is recommended to use water with salinity below 10.6 dS m−1 to irrigate cotton fields. However, this threshold for the salinity of irrigation water is only proposed based on the analysis of one year’s data, and it needs to be demonstrated using data from many years.

4.3. Effect of SWI on Relationships between Soil Respiration and Soil Physical and Chemical Properties

Section 4.1 and Section 4.2 show that soil salt destroyed the soil structure and reduced enzyme activities after the long-term SWI, thus affecting soil respiration. This was also proved by the SEM performance in BS and FBS. In addition, we found that soil physical properties can affect soil enzyme activities. Soil porosity had a significant positive effect on alkaline phosphatase activity with SWI in SEM. This may be because soil physical properties can change the soil oxygen concentration [50], and soil microbial activity and enzyme activity are closely related to soil oxygen conditions [51].
It can be seen from SEM that soil physical indicators have significant effects on SR at different growth stages of cotton. The soil water-stable aggregates of BS significantly positively affect SR. This is consistent with Yang et al. [52]. The soil porosity of FBS also has a significant effect on SR, which is consistent with Zhu et al. [13]. This may be because physical indicators affecting the soil aeration structure can not only directly regulate soil carbon emissions, but also indirectly affect SR by affecting soil enzyme activities.

5. Conclusions

This study was carried out based on a long-term SWI experiment. The results showed that SWI increased soil salinity while decreasing the soil water-stable aggregate content, porosity, enzymatic activity, and soil respiration. Additionally, SWI with salinity below 10.6 dS m−1 has no significant effect on cotton yield. Furthermore, it can be seen from SEM that soil salinity, water-stable aggregate content, and soil porosity have significant effects on SR, and soil porosity has a significant positive effect on soil alkaline phosphatase activity.
In summary, SWI with salinity below 10.6 dS m−1 can alleviate water shortages and reduce soil carbon emissions without affecting the cotton yield in the study area. However, the process of soil salinity migration in cotton fields is very complex and is affected by many factors such as rainfall and irrigation. The effects of SWI on SR in different rainfall years need to be further studied.

Author Contributions

Data curation, S.Z., J.P. and C.X.; formal analysis, S.Z.; resources, H.D. and C.C.; writing—original draft, S.Z.; review and editing, J.Z., G.W., A.K.M.H., Y.G. and J.S. All authors have read and agreed to the published version of the manuscript.

Funding

This research was partially funded by Cotton System Major Project of National Natural Science Foundation of China: Special Project for the Construction of Modern Agricultural Cotton Industry Technology System (CARS-15-13), National Natural Science Foundation of China major project (51790534), National Natural Science Foundation of China (51709264), the Basic Scientific Research Project of Chinese Academy of Agricultural Sciences (FIRI202004-02).

Data Availability Statement

The data presented in this study are available on reasonable request from the corresponding author.

Acknowledgments

We thank the editor and reviewers for their insightful comments on the manuscript.

Conflicts of Interest

The authors declare no conflict of interest.

References

  1. IPCC. Climate Change and Land: An IPCC Special Report on Climate Change, Desertification, Land Degradation, Sustainable Land Management, Food Security, and Greenhouse Gas Fluxes in Terrestrial Ecosystems; Cambridge University Press: Cambridge, UK; New York, NY, USA, 2019. [Google Scholar]
  2. Cheng, K.; Pan, G.; Smith, P.; Luo, T.; Li, L.; Zheng, J.; Zhang, X.; Han, X.; Yan, M. Carbon footprint of China’s crop production—An estimation using agro-statistics data over 1993–2007. Agric. Ecosyst. Environ. 2011, 142, 231–237. [Google Scholar] [CrossRef]
  3. Yang, G.; Wang, M.; Chen, H.; Liu, L.; Wu, N.; Zhu, D.; Tian, J.; Peng, C.; Zhu, Q.; He, Y. Responses of CO2 emission and pore water DOC concentration to soil warming and water table drawdown in Zoige Peatlands. Atmos. Environ. 2017, 152, 323–329. [Google Scholar] [CrossRef]
  4. Vermeulen, J.S.; Campbell, M.B.; Ingram, I.J.S. Climate change and food systems. Annu. Rev. Env. Resuor. 2012, 1, 195–222. [Google Scholar] [CrossRef]
  5. Todkari, G. Impact of irrigation on agriculture productivity in solapur district of maharashtra state. Int. J. Agric. Sci. 2012, 1, 165–167. [Google Scholar] [CrossRef]
  6. Wang, J.T.; Li, Q.K. Study of Water-Salt Production function based on saline water irrigation. Adv. Mater. Res. 2012, 518–523, 4350–4353. [Google Scholar] [CrossRef]
  7. Bezborodov, G.A.; Shadmanov, D.K.; Mirhashimov, R.T.; Yuldashev, T.; Qureshi, A.S.; Noble, A.D.; Qadir, M. Mulching and water quality effects on soil salinity and sodicity dynamics and cotton productivity in Central Asia. Agric. Ecosyst. Environ. 2010, 138, 95–102. [Google Scholar] [CrossRef]
  8. Ben, A.C.; Magdich, S.; Ben, R.B.; Boukhris, M.; Ben, A.F. Saline water irrigation effects on soil salinity distribution and some physiological responses of field grown Chemlali olive. J. Environ. Manag. 2012, 113, 538–544. [Google Scholar] [CrossRef]
  9. Abakumov, E.; Yuldashev, G.; Darmonov, D.; Turdaliev, A.; Askarov, K.; Khaydarov, M.; Mirzayev, U.; Nizamutdinov, T.; Davronov, K. Influence of Mineralized Water Sources on the Properties of Calcisol and Yield of Wheat (Triticum aestivum L.). Plants 2022, 11, 3291. [Google Scholar] [CrossRef]
  10. Wang, T.; Wang, Z.; Zhang, J.; Ma, K. An optimum combination of irrigation amount, irrigation water salinity and nitrogen application rate can improve cotton (for fiber) nitrogen uptake and final yield. Ind. Crops Prod. 2022, 187, 115386. [Google Scholar] [CrossRef]
  11. Li, X.; Kang, Y.; Wan, S.; Chen, X.; Chu, L. Reclamation of very heavy coastal saline soil using drip-irrigation with saline water on salt-sensitive plants. Soil Tillage Res. 2015, 146, 159–173. [Google Scholar] [CrossRef]
  12. Li, P.; Ren, L. Evaluating the saline water irrigation schemes using a distributed agro-hydrological model. J. Hydrol. 2020, 7, 125688, (In Chinese with English Abstract). [Google Scholar] [CrossRef]
  13. Zhu, Y.; Dyck, M.; Cai, H.; Song, L.; Chen, H. The effects of aerated irrigation on soil respiration, oxygen, and porosity. J. Integr Agr. 2019, 18, 2854–2868. [Google Scholar] [CrossRef]
  14. Yang, C.; Liu, N.; Zhang, Y. Soil aggregates regulate the impact of soil bacterial and fungal communities on soil respiration. Geoderma 2019, 337, 444–452. [Google Scholar] [CrossRef]
  15. Ge, G.F.; Li, Z.J.; Zhang, J.; Wang, L.G.; Xu, M.G.; Zhang, J.B.; Wang, J.K.; Xie, X.L.; Liang, Y.C. Geographical and climatic differences in long-term effect of organic and inorganic amendments on soil enzymatic activities and respiration in field experimental stations of China. Ecol. Complex. 2009, 6, 421–431. [Google Scholar] [CrossRef]
  16. Nie, M.; Pendall, E.; Bell, C.; Wallenstein, M.D. Soil aggregate size distribution mediates microbial climate change feedbacks. Soil Biol. Biochem. 2014, 68, 357–365. [Google Scholar] [CrossRef]
  17. Bhattacharyya, R.; Rabbi, S.M.F.; Zhang, Y.; Young, I.M.; Jones, A.R.; Dennis, P.G.; Menzies, N.W.; Kopittke, P.M.; Dalal, R.C. Soil organic carbon is significantly associated with the pore geometry, microbial diversity and enzyme activity of the macro-aggregates under different land uses. Sci. Total Environ. 2021, 778, 146286. [Google Scholar] [CrossRef]
  18. Xia, Q.; Rufty, T.; Shi, W. Soil microbial diversity and composition: Links to soil texture and associated properties. Soil Biol. Biochem. 2020, 149, 107953. [Google Scholar] [CrossRef]
  19. Tian, D.; Zhang, Y.; Mu, Y.; Liu, J.; He, K. Effect of N fertilizer types on N2O and NO emissions under drip fertigation from an agricultural field in the North China Plain. Sci. Total Environ. 2020, 715, 136903. [Google Scholar] [CrossRef]
  20. Zhou, S.; Sun, H.; Bi, J.; Zhang, J.; Riya, S.; Hosomi, M. Effect of water-saving irrigation on the N2O dynamics and the contribution of exogenous and endogenous nitrogen to N2O production in paddy soil using 15N tracing. Soil Till. Res. 2020, 200, 104610. [Google Scholar] [CrossRef]
  21. Feng, G.; Zhang, Z.; Wan, C.; Lu, P.; Bakour, A. Effects of saline water irrigation on soil salinity and yield of summer maize (Zea mays L.) in subsurface drainage system. Agr. Water Manag. 2017, 193, 205–213. [Google Scholar] [CrossRef]
  22. Maucieri, C.; Zhang, Y.; Mcdaniel, M.D.; Borin, M.; Adams, M.A. Short-term effects of biochar and salinity on soil greenhouse gas emissions from a semi-arid Australian soil after rewetting. Geoderma 2017, 307, 267–276. [Google Scholar] [CrossRef]
  23. Zhang, A.; Li, K.; Sun, J.; Dang, H.; Sun, C.; Rahma, A.E.; Wang, G.; Zhang, J.; Feng, D. Effects of a 10-year irrigation with saline water on soil physico-chemical properties and cotton production. J. Soil Water Conserv. 2020, 75, 629–639. [Google Scholar] [CrossRef]
  24. Li, Y.; Guo, H.; Ge, Z.; Wang, D.; Liu, W.; Xie, L.; Li, S.; Tan, L.; Zhao, B.; Li, X.; et al. Sea-level rise will reduce net CO2 uptake in subtropical coastal marshes. Sci. Total Environ. 2020, 747, 141214. [Google Scholar] [CrossRef] [PubMed]
  25. Wang, J.Z.; Zhang, G.H.; Yan, M.J.; Li, Y.; Zhou, Z.M. Analysis of soil salinity distribution and influencing factors in area around Bohai Sea. J. Arid Land Resour. Environ. 2012, 11, 104–109, (In Chinese with English Abstract). [Google Scholar]
  26. Sun, H.Y.; Liu, X.J.; Zhang, X.Y. Regulations of salt and water of saline-alkali soil: A review. Chin. J. Eco-Agric. 2018, 10, 1528–1536. [Google Scholar] [CrossRef]
  27. Zhou, X.N.; Liu, S.Y.; Wang, Z.; Zhou, Z.C. Analysis of chemical characteristics and availability of shallow groundwater in typical areas of North China Plain-Taking Hengshui as an example. Water Sci. Eng. Technol. 2008, 2, 56–59, (In Chinese with English Abstract). [Google Scholar]
  28. Zhou, H.; Lv, Y.; Yang, Z.; Li, B. Effects of conservation tillage on soil aggregates in Huabei Plain, China. Sci. Agric. Sinica. 2007, 40, 1973–1979, (In Chinese with English Abstract). [Google Scholar]
  29. Zhang, J.Z.; Zhu, J. Observation Method of Soil and Water Conservation Monitoring Indicators; China Forestry Publishing House: Bejing, China, 2013. (In Chinese) [Google Scholar]
  30. Chu, D.H.; Yang, S.Z.; Ren, S.K.; Tian, D.Z. Soil specific gravity in Hebei Province. J. Agric. Univ. Hebei 1985, 8, 84–90, (In Chinese with English Abstract). [Google Scholar]
  31. Rolston, D.E. Nitrous Oxide from Agriculture. J. Environ. Qual. 1995, 24, 200. [Google Scholar] [CrossRef]
  32. Ni, K.; Ding, W.; Cai, Z.; Wang, Y.; Zhang, X.; Zhou, B. Soil carbon dioxide emission from intensively cultivated black soil in Northeast China: Nitrogen fertilization effect. J. Soil. Sediment. 2012, 12, 1007–1018. [Google Scholar] [CrossRef]
  33. Rosseel, Y. lavaan: An R Package for Structural Equation Modeling. J. Stat Softw. 2012, 48, 1–36. [Google Scholar] [CrossRef]
  34. Sang, H.; Guo, W.; Gao, Y.; Jiao, X.; Pan, X. Effects of alternating fresh and saline water irrigation on soil salinity and chlorophyll fluorescence of summer maize. Water 2020, 12, 3054. [Google Scholar] [CrossRef]
  35. Su, F.; Wu, J.; Wang, D.; Zhao, H.; Wang, Y.; He, X. Moisture movement, soil salt migration, and nitrogen transformation under different irrigation conditions: Field experimental research. Chemosphere 2020, 300, 134569. [Google Scholar] [CrossRef] [PubMed]
  36. Walter, J.; Lück, E.; Bauriegel, A.; Facklam, M.; Zeitz, J. Seasonal dynamics of soil salinity in peatlands: A geophysical approach. Geoderma 2018, 310, 1–11. [Google Scholar] [CrossRef]
  37. Phogat, V.; Pitt, T.; Stevens, R.M.; Cox, J.W.; Šimůnek, J.; Petrie, P.R. Assessing the role of rainfall redirection techniques for arresting the land degradation under drip irrigated grapevines. J. Hydrol. 2020, 587, 125000. [Google Scholar] [CrossRef]
  38. Morshedi, A.; Sameni, A.M. Hydraulic conductivity of calcareous soils as affected by salinity and sodicity. II. Effect of gypsum application and flow rate of leaching solution. Commun. Soil Sci. Plant Anal. 2000, 1–2, 51–67. [Google Scholar] [CrossRef]
  39. Ji, Q.; Feng, S.; Yuan, C.; Huo, Z.; Qi, Y. Effects of saline water irrigation on soil physical properties in Shiyang River Basin. J. Drain. Irrig. Mach. Eng. 2014, 32, 802–807, (In Chinese with English Abstract). [Google Scholar]
  40. Kabiri, K.; Omidian, H.; Hashemi, S.A.; Zohuriaan-Mehr, M.J. Synthesis of fast-swelling superabsorbent hydrogels: Effect of crosslinker type and concentration on porosity and absorption rate. Eur. Polym. J. 2003, 39, 1341–1348. [Google Scholar] [CrossRef]
  41. García-Gil, J.C.; Plaza, C.; Soler-Rovira, P.; Polo, A. Long-term effects of municipal solid waste compost application on soil enzyme activities and microbial biomass. Soil Biol. Biochem. 2000, 32, 1907–1913. [Google Scholar] [CrossRef]
  42. Adviento Borbe, M.A.A.; Doran, J.W.; Drijber, R.A.; Dobermann, A. Soil electrical conductivity and water content affect nitrous oxide and carbon dioxide emissions in intensively managed soils. J. Environ. Qual. 2006, 35, 1999–2010. [Google Scholar] [CrossRef]
  43. Tang, J.; Liang, S.; Li, Z.; Zhang, H.; Wang, S.; Zhang, N. Emission laws and influence factors of greenhouse gases in saline-alkali paddy fields. Sustainability 2016, 8, 163. [Google Scholar] [CrossRef]
  44. Cucci, G.; Lacolla, G.; Pagliai, M.; Vignozzi, N. Effect of reclamation on the structure of silty-clay soils irrigated with saline-sodic waters. Int. Agrophys. 2015, 29, 23–30. [Google Scholar] [CrossRef]
  45. Chen, L.; Li, C.; Feng, Q.; Wei, Y.; Zheng, H.; Zhao, Y.; Feng, Y.; Li, H. Shifts in soil microbial metabolic activities and community structures along a salinity gradient of irrigation water in a typical arid region of China. Sci. Total Environ. 2017, 598, 64–70. [Google Scholar] [CrossRef] [PubMed]
  46. Hanson, P.J.; Edwards, N.T.; Garten, C.T.; Andrews, J.A. Separating root and soil microbial contributions to soil respiration; a review of methods and observations. Biogeochemistry 2000, 48, 115–146. [Google Scholar] [CrossRef]
  47. Wu, X.; Yao, Z.; Brüggemann, N.; Shen, Z.; Wolf, B.; Dannenmann, M.; Zheng, X.; Butterbach-Bahl, K. Effects of soil moisture and temperature on CO2 and CH4 soil-atmosphere exchange of various land use/cover types in a semi-arid grassland in Inner Mongolia, China. Soil Biol. Biochem. 2010, 5, 773–787. Available online: https://www.cabdirect.org/cabdirect/abstract/20103140353 (accessed on 15 March 2021). [CrossRef]
  48. Liu, L.; Estiarte, M.; Bengtson, P.; Li, J.; Asensio, D.; Wallander, H.; Peñuelas, J. Drought legacies on soil respiration and microbial community in a Mediterranean forest soil under different soil moisture and carbon inputs. Geoderma 2022, 405, 115425. [Google Scholar] [CrossRef]
  49. Zhang, J.; Li, K.; Zheng, C.; Cao, C.; Sun, C.; Dang, H.; Feng, D.; Sun, J. Cotton Responses to Saline Water Irrigation in the Low Plain around the Bohai Sea in China. J. Irrig. Drain Eng. 2018, 144, 04018027. [Google Scholar] [CrossRef]
  50. Neira, J.; Ortiz, M.; Morales, L.; Acevedo, E. Oxygen diffusion in soils: Understanding the factors and processes needed for modeling. Chil. J. Agr. Res. 2015, 75, 35–44. [Google Scholar] [CrossRef]
  51. Wolinska, A.; Bennicelli, R.P. Dehydrogenase activity response to soil reoxidation process described as varied conditions of water potential, air porosity and oxygen availability. Pol. J. Environ. Stud. 2010, 3, 651–657. [Google Scholar] [CrossRef]
  52. Yang, X.; Ali, A.; Xu, Y.; Jiang, L.; Lv, G. Soil moisture and salinity as main drivers of soil respiration across natural xeromorphic vegetation and agricultural lands in an arid desert region. CATENA 2019, 177, 126–133. [Google Scholar] [CrossRef]
Figure 1. (a) Location of the study site and (b) plots of long-term saline irrigation experiment. Note: The data come from the results of a groundwater resource evaluation in 2003. Accessed on 15 March 2021. (http://www.cigem.gov.cn/kjqb/jx001_1.htm).
Agronomy 13 01197 g001
Figure 2. Daily precipitation (bars), maximum air temperatures (red), and minimum air temperatures (green) from 1 April to 30 October, 2021.
Agronomy 13 01197 g002
Figure 3. The soil salinity (ECe) in different growth periods of cotton. (a) ECe in BE; (b) ECe in BS; (c) ECe in FBS. Letters a, b, c and d located above columns indicate that the means of each column are/aren’t significantly different (p ≤ 0.05) according to Duncan’s multiple range test (DMRT). Columns that share the same letter are not significantly different according to the DMRT (p ≤ 0.05). Columns labeled with the different letters are significantly different according to the DMRT (p ≤ 0.05).
Agronomy 13 01197 g003
Figure 4. Water-stable aggregate content (R0.25) in different growth periods of cotton under SWI. (a) R0.25 in BE; (b) R0.25 in BS; (c) R0.25 in FBS. Letters a, b, c, d and e located above columns indicate that the means of each column are/aren’t significantly different (p ≤ 0.05) according to Duncan’s multiple range test (DMRT). Columns that share the same letter are not significantly different according to the DMRT (p ≤ 0.05). Columns labeled with the different letters are significantly different according to the DMRT (p ≤ 0.05).
Agronomy 13 01197 g004
Figure 5. The variation of soil porosity in different growth periods of cotton. (a) Soil porosity in BE; (b) soil porosity in BS; (c) soil porosity in FBS. Letters a, b, c and d located above columns indicate that the means of each column are/aren’t significantly different (p ≤ 0.05) according to Duncan’s multiple range test (DMRT). Columns that share the same letter are not significantly different according to the DMRT (p ≤ 0.05). Columns labeled with the different letters are significantly different according to the DMRT (p ≤ 0.05).
Agronomy 13 01197 g005
Figure 6. The soil enzyme activity of each treatment in different growth periods of cotton. (a) The soil cellulase activity in BE; (b) the soil cellulase activity in BS; (c) the soil cellulase activity in FBS; (d) the soil alkaline phosphatase activity in BE; (e) the soil alkaline phosphatase activity in BS; (f) the soil alkaline phosphatase activity in FBS; (g) the soil α-glucosidase activity in BE; (h) the soil α-glucosidase activity in BS; (i) the soil α-glucosidase activity in FBS. Letters a, b and c located above columns indicate that the means of each column are/aren’t significantly different (p ≤ 0.05) according to Duncan’s multiple range test (DMRT). Columns that share the same letter are not significantly different according to the DMRT (p ≤ 0.05). Columns labeled with the different letters are significantly different according to the DMRT (p ≤ 0.05). Different colors of the columns indicate different treatments.
Agronomy 13 01197 g006
Figure 7. Variations of CO2 emissions under different saline water irrigation treatments for the 2021 cotton growing season. Each data point represents the average of three replicates. (a) The CO2 emissions in BS; (b) the CO2 emissions in FBS.
Agronomy 13 01197 g007
Figure 8. Structural equation model (SEM) of saline water irrigation impacts on soil physical and chemical properties and SR. (a) SEM in BS; (b) SEM in FBS. * p < 0.05, ** p < 0.01, and *** p< 0.005. The numbers adjacent to the lines are the standardized path coefficients, which means how much standard deviation changes the independent variable if each of the independent variables changes by one standard deviation. The blue lines represent the direct effects of SWI on soil physical and chemical properties and SR. Orange lines indicate the interactions of soil physical and chemical properties. Green lines represent the indirect effects of SWI on SR.
Agronomy 13 01197 g008
Table 1. Physical and chemical properties of soil plow layer at beginning of experiment in 2006.
ECe
(dS m−1)
SAR
(meq L−1)1/2
pHOM
(g kg−1)
NPKCa2+/Mg2+ RatioBD
(g cm−3)
(mg kg−1)
2.121.048.0511.576151124.441.37
Note: ECe = electrical conductivity of a saturated soil extract. SAR = sodium adsorption ratio. Ca2+ = calcium ion. Mg2+ = magnesium ion. OM organic matter. N: available nitrogen. P: available phosphorus. K: available potassium. BD: bulk density.
Table 2. Electrical conductivity and salt-ion composition of the irrigation water.
TreatmentWater Salinity
(dS m−1)
Ion Concentration (mEq L−1)
Ca2+Mg2+K+Na+SO42−HCO3CL
CK1.31.431.610.1510.735.881.047.36
S13.41.713.190.1825.6210.321.1121.45
S27.12.004.600.2056.4416.911.2147.27
S310.62.335.780.2387.8423.341.3173.58
S414.12.796.260.25119.9730.141.44100.04
S517.73.217.030.28150.4636.891.56126.22
Table 3. CO2 cumulative emissions under different saline water irrigation treatments.
Growth StageTreatmentCO2 Cumulative Emissions (g m−2)
the bud stageCK228.86 ± 3.17a
S1216.77 ± 3.74b
S2197.27 ± 4.33c
S3189.18 ± 2.99c
S4173.85 ± 8.12d
S5153.15 ± 5.50e
the flowering and boll stageCK457.60 ± 9.15a
S1426.83 ± 8.16a
S2384.89 ± 11.32b
S3364.69 ± 31.29b
S4356.84 ± 21.98b
S5317.11 ± 23.49c
Note: each value represents mean ± standard errors of three replications; Letters a, b and c indicate that the means of each treatment is/isn’t significantly different (p ≤ 0.05) according to Duncan’s multiple range test (DMRT). The same letter is not significantly different according to the DMRT (p ≤ 0.05). The different letters are significantly different according to the DMRT (p ≤ 0.05).
Table 4. Composition of cotton yields with different irrigation treatments in 2021.
TreatmentCotton Harvest DensityBoll Weight
(g)
Final Number of BollsSeed Cotton Yield
(Plants per Hectare)(Number per Plant)(kg hm−2)
CK45,477 ± 265.95a6.27 ± 0.15a20.48 ± 0.06a4385.86 ± 332.28a
S145,566 ± 812.49a6.43 ± 0.28a20.28 ± 0.20a4457.79 ± 72.52a
S245,743 ± 531.90a6.30 ± 0.31a20.19 ± 0.08a4238.84 ± 189.74a
S345,566 ± 1338.58a6.23 ± 0.32a20.42 ± 0.04a4064.22 ± 293.92a
S446,541 ± 265.95a5.06 ± 0.83b19.13 ± 0.32a3473.36 ± 253.96b
S546,807 ± 1063.80a5.39 ± 0.24b15.93 ± 2.30b3048.44 ± 268.37b
Note: each value represents mean ± standard errors of three replications; Letters a and b indicate that the means of each treatment is/isn’t significantly different (p ≤ 0.05) according to Duncan’s multiple range test (DMRT). The same letter is not significantly different according to the DMRT (p ≤ 0.05). The different letters are significantly different according to the DMRT (p ≤ 0.05).
Disclaimer/Publisher’s Note: The statements, opinions and data contained in all publications are solely those of the individual author(s) and contributor(s) and not of MDPI and/or the editor(s). MDPI and/or the editor(s) disclaim responsibility for any injury to people or property resulting from any ideas, methods, instructions or products referred to in the content.

