Article

Thickness of a Compost Layer on the Distribution of Water and Nutrients in a Surface-Drip-Irrigated Sandy Soil Column

1
College of Agriculture, Ningxia University, Helanshan Xilu No. 489, Yinchuan 750021, China
2
College of Horticulture, China Agricultural University, Beijing 100193, China
3
Institute of Horticulture, Ningxia Academy of Agricultural and Forestry Sciences, Huanghe Donglu No. 590, Yinchuan 750002, China
*
Authors to whom correspondence should be addressed.
Agronomy 2023, 13(5), 1181; https://doi.org/10.3390/agronomy13051181
Submission received: 11 February 2023 / Revised: 9 April 2023 / Accepted: 12 April 2023 / Published: 22 April 2023

Abstract

:
The management of crop production in a sandy soil “culture” is difficult, mainly due to its low soil-water-holding capacity, organic matter and poor fertilizer efficiency. Options to increase soil water and nutrient retention for these soils include the addition of surface mulch covers, amendment with biochar and the use of layers of a mixture of charcoal and compost material. Our objective was to measure the distribution of water and nutrients for layers of control 1 (CK1), control 2 (CK2) and compost material of different thicknesses (0.02, 0.05 and 0.10 m) buried 0.01 m from the surface in a column (0.2 m radius, 0.5 m height) filled with sand. The experiment was conducted in a greenhouse located at the Agricultural Science Training Base of Ningxia University, China. There were three replicates per treatment and one soil column per replicate. The soil columns were watered with 2 L via a surface drip emitter and 45 days later, soil samples were obtained in 0.01 m increments across the diameter and depth of 0.4 m, with a total of 12 samples per column. In each sample, we measured soil water, pH, electrical conductivity, ammonium and nitrate nitrogen and available P and K. The results showed that the distribution of water content and nutrient contents were centered on the dripper and diffused to its surroundings. Notably, the horizontal diffusion distance was smaller than that of the vertical direction. In the vertical direction, compared with control 1, adding compost changed the spatial distribution of WC and nutrients and had a greater impact on available potassium (AK) than on inorganic nitrogen (IN) and available phosphorus (AP). Compared with control 1, the composting treatment decreased the content of water in the 0–10 cm surface soil, reduced the electrical conductivity (EC) and nitrate nitrogen (NO3-N), C5 and C10 increased the available potassium. Moreover, composting treatments increased the electrical conductivity, available phosphorus, available potassium and nitrate nitrogen of the 10–30 cm substrate by 61–384%, 10–240%, 11–45% and 133–929%, respectively, when compared with control 1.The nutrients increased as the thickness of the compost interlayer increased. A principal component analysis (PCA) of the C5 and C10 treatments significantly distinguished them from control 1. A linear regression fitting analysis showed that the inorganic nitrogen, available potassium and total nutrients positively correlated with the water content and electrical conductivity of the sand. The 5 cm and 10 cm composting interlayers had a high water content and ability to conserve fertilizer for sand culture, but C10 caused an excessive accumulation of nutrients. Thus, it was concluded that a composting interlayer that was less than 5 cm reduced the base fertilizer input by 24–84%. All these results suggest that applying a composting interlayer of 5 cm could retain more suitable root zone water and fertilizer for the next crop season and provide technological support to reduce fertilizer inputs.

1. Introduction

Desertification is a widespread problem worldwide and has affected more than 900 million hectares [1]. With industrialization and urbanization, a large amount of cultivated land has gradually been desertified; thus, cultivated land resources are becoming increasingly rare [2]. Additionally, there has been a reduction in the productivity of crops [3]. The shortage of arable land and the desertification of the land conflict with the demand for food and crops for the world’s growing population [4,5].
The area of sandy land in China accounts for 18% of the total land area [6]. The area of Northwest China that desertified reached 1.47 × 10⁶ km2, which accounted for 56% of the total desertification area of the country [7]. Faced with the continuous shrinkage of arable land, the need to ensure that the demand for crop productivity owing to population growth is met has caused interest in the search for new farmland in the desert and the utilization of low productivity sandy soil for crop production [8]. Sand culture has always been one of the primary methods of soilless culture used in the adjacent desert areas where sand has the advantages of good permeability, low cost and few soilborne diseases [9]. However, when the soil is affected by the shortcomings of sand, such as large porosity and low moisture-holding capacity, it has difficulty in retaining nutrients, resulting in low nutrient utilization [10,11]. Therefore, exploring methods to improve the and ability of the sand culture to fix nutrients is vital to guarantee the farm use of sandy soils. Thus, the pursuit of a highly efficient and sustainable agricultural production is important.Researchers have focused on the uses of sand by considering different configurations in a soil profile. For example, the surface of a sandy soil in an experiment was covered with straw strips, which increased the accumulation of organic matter and nutrients and promoted plant growth [12]. The amendment with biochar in saline soil has been shown to increase the rate of transport and range of distribution of soil water, salt and N [13]. The addition of a mixture of biomass charcoal and compost topdressing significantly increased the pH, total N (nitrogen), P (Phosphorus), organic matter and available nutrient content of sandy soils [14]. Organic amendments in combination with bentonite significantly increased the contents of organic nutrients in sandy soils in an oasis [15]. The addition of compost to sandy soils increased the levels of available nutrients, such as N, P, Ca and Mg, and promoted the growth of wheat (Triticum aestivum) [16]. Further, the introduction of man-made soil layers with added clay at the bottom of the profile can increase water and intercept nutrients that would otherwise be lost [17]. Filling a reclaimed land profile with coal gangue can effectively increase soil quality and promote the growth of corn (Zea mays) [18]. Lastly, the addition of a biochar layer at a depth of 20 cm in a saline soil increased the soil water in the upper soil profiles [19].
Previous measures used to enhance the water and fertilizer retention capacity of cultivated substrates primarily included covering the surface layer of the soil or the mixture of substrate composition to regulate the moisture-holding characteristics and ability to supply nutrients. However, there have only been a few studies concerning organic fertilizers applied as an interlayer at the bottom of sand, and an inadequate amount of research has been conducted on systematically evaluating their combined effect on the spatial distribution of water, salt and N in a sand culture. As an organic fertilizer, compost can increase soil fertility and crop yield and reduce the use of chemical fertilizers to promote ecologically sustainable agriculture [20,21]. Therefore, this study addresses the effect of a compost interlayer that was constructed on the spatial distribution of moisture and nutrients. In addition, it examined their contribution to the moisture and ability to retain fertilizers of 10–30 cm in the primary distribution area of common crop roots. Thus, the major objectives of the study were as follows:
(1)
To investigate the effect of compost interlayer constructed on the spatial distribution of water and nutrients in sand;
(2)
To determine the optimum thickness of the compost layer for adding 10–30 cm of water and nutrients; and
(3)
To propose a new way of using compost.

2. Materials and Methods

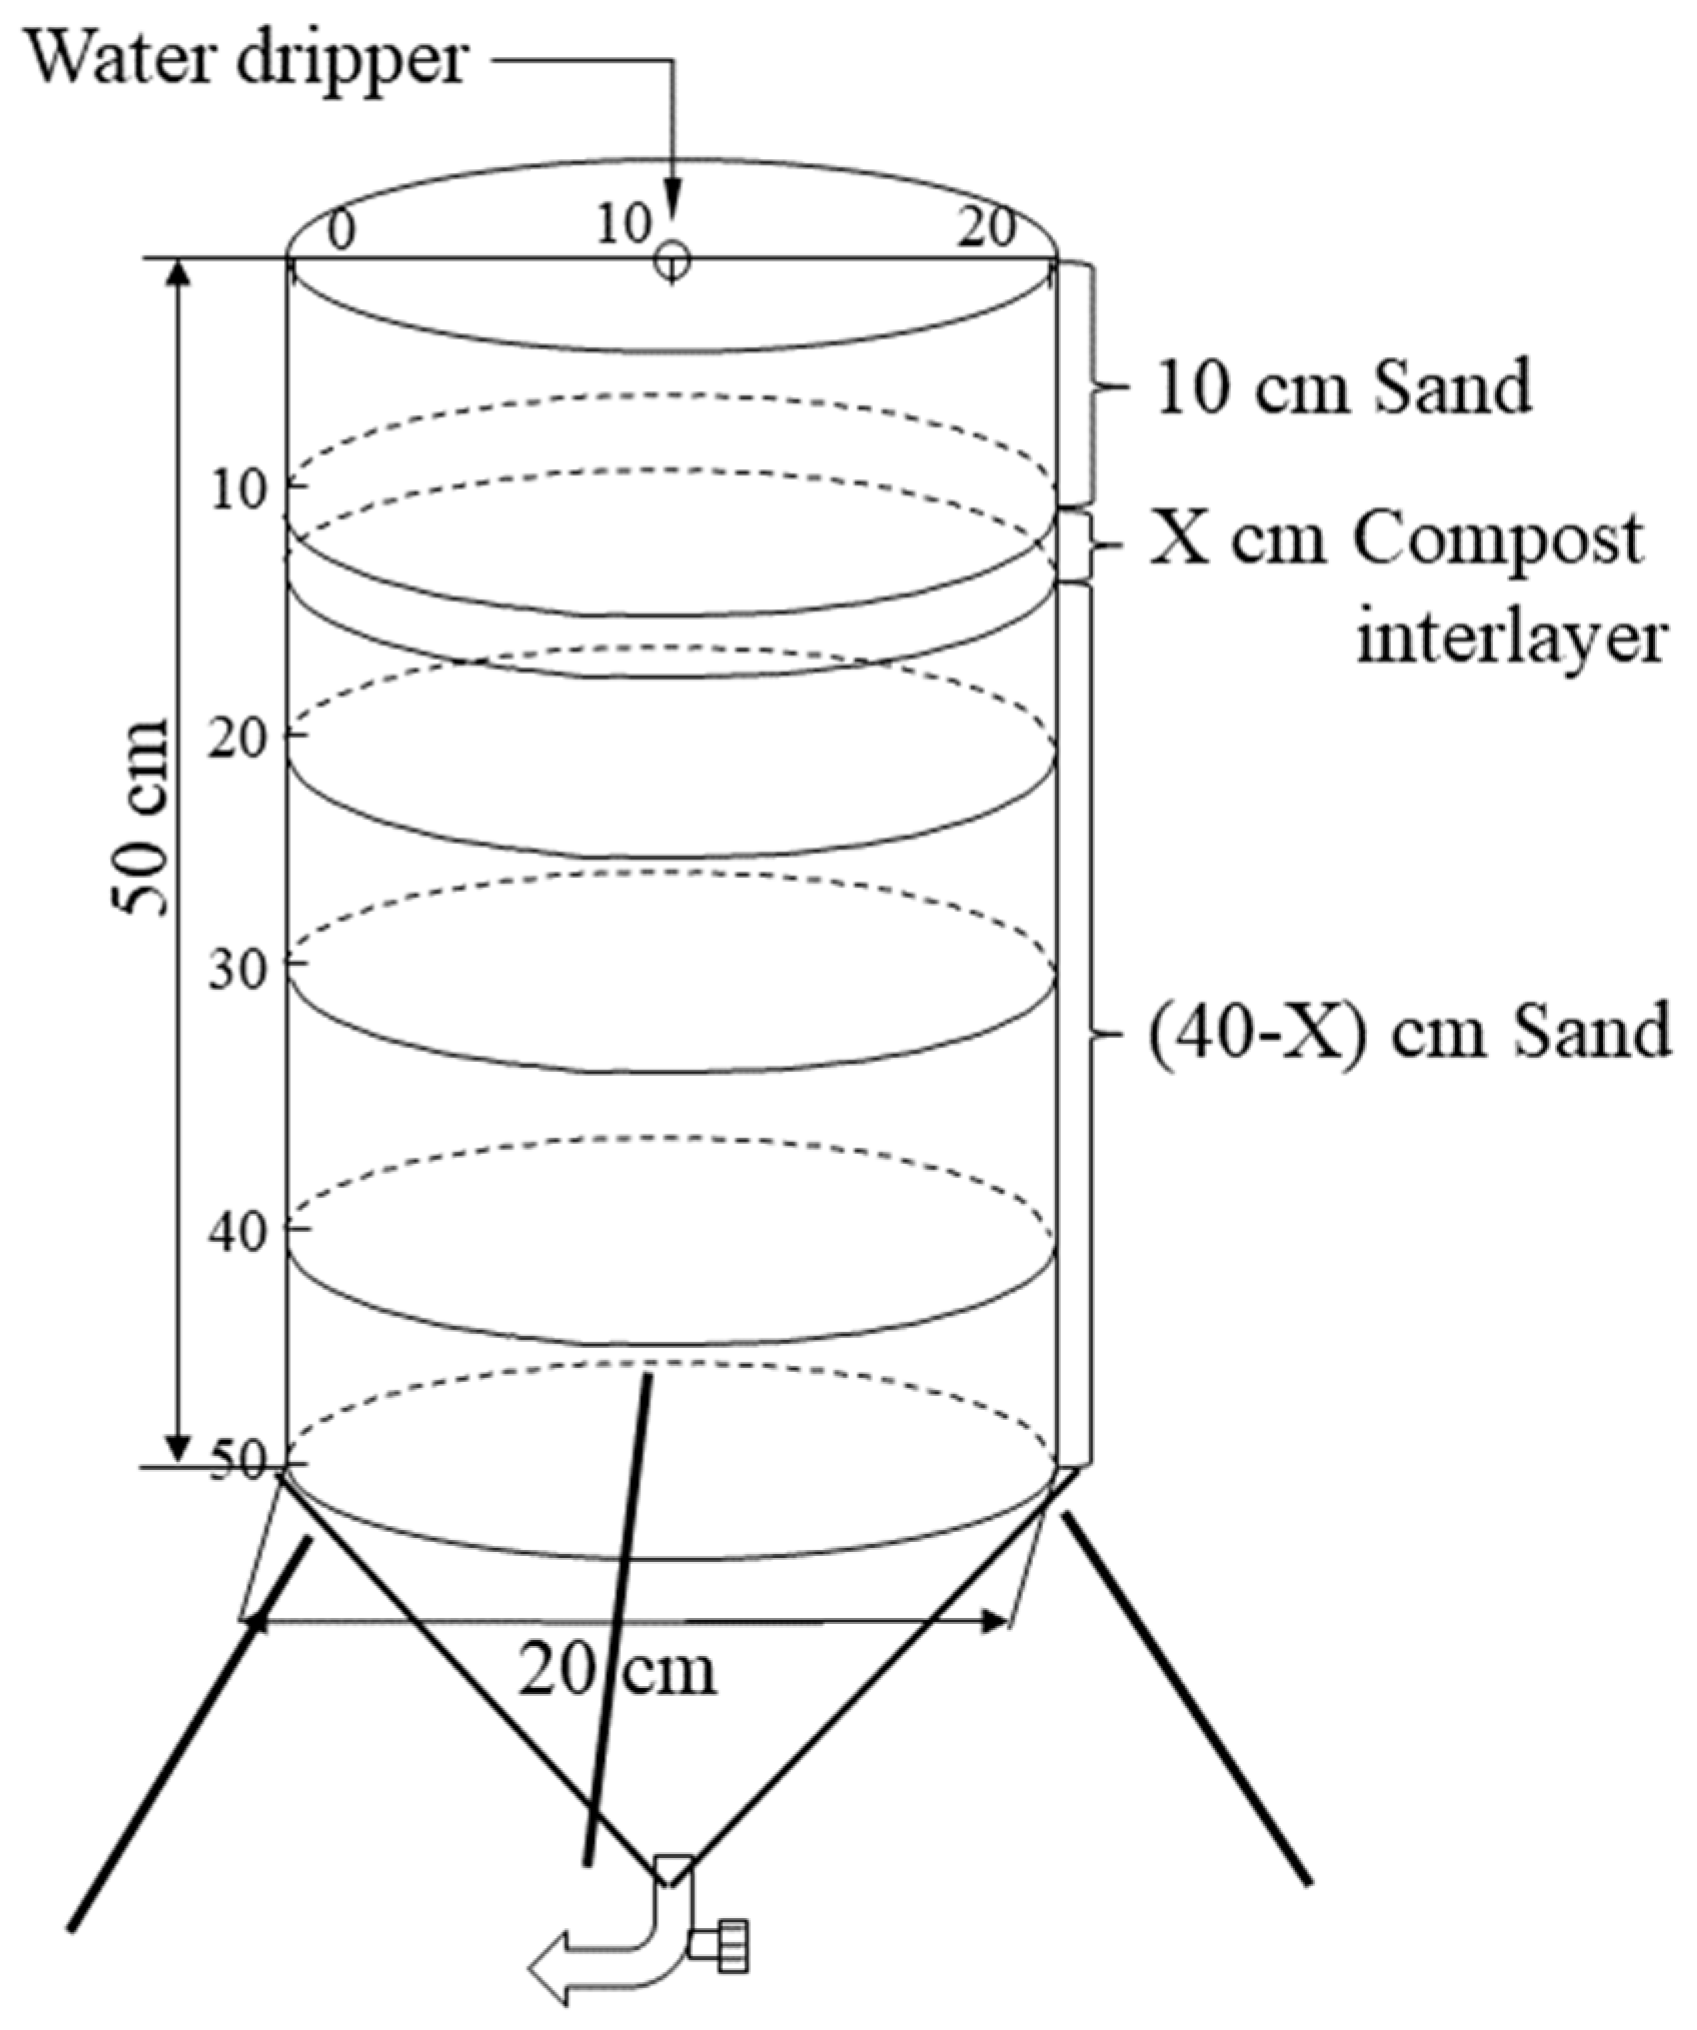
2.1. Experimental Design and Management

The experiment was carried out for a 45 day period, starting at a greenhouse located in Ningxia University Agricultural Science Training Base, Ningxia, China. A column with drip irrigation was built and used (Figure 1). To avoid the influence of light and ambient temperature, the side wall of the soil column was coated with a 5 mm silver gray insulation foam. In this experiment, sand was identified by control 1 (CK1). Compost mixed with 20 cm of surface sand was identified by control 2 (CK2, traditional compost mixed application (0.454 g/column)) and 0.02 cm of compost layers (0.157 kg/column) was identified by C2; 0.05 m compost layers (0.3925 kg/column) was identified by C5, and 0.1 m compost layers (0.785 kg/column) was identified by C10. The compost was added 0.1 m below the surface of sand. The bulk density of compost remained at 0.25 g∙cm−3, and the bulk density of sand remained at 0.83 g∙cm−3. The compost was a commercial organic fertilizer made from a mixture of animal manure and fermented straw (courtesy of Ningxia Lv feng yuan Agricultural Development Co). Each column was arranged from the bottom to the top with sand and compost according to the different treatments. There were three replicates per treatment and one soil column per replicate. The experiment was conducted in the winter. No crops were planted during this period due to the low ambient temperatures. The soil was irrigated and each column received the same amount of water, i.e., 2 L. The columns were sampled 45 days after irrigation, which was consistent with a fallow period between the spring and autumn growing seasons. The basic physicochemical properties of the compost and sand are shown in Table 1.

2.2. Sand Sampling and Analyses

Soil samples were taken 45 days after irrigation with 2 L of water to analyze the distribution of water and nutrients in the column. They were measured at the intersection of 0 lateral distance, 10 cm left and right, and 10, 20, 30 and 40 cm longitudinal distance from the infiltration point. A 2 cm diameter soil auger was used to sample soil samples in 0.01 m increments across a depth of 0.4 m, and each sand column collected 12 samples. The samples were then air-dried and passed through a 1 mm sieve to determine the nutrient amount. The water content (WC (v/v)) was determined by the gravimetric method. The sand pH was determined by a basic pH meter (sand/water ratio of 1:5 (v)) (PHSJ-3F, Rex, Shanghai, China) and the electrical conductivity (EC) was determined by a conductivity meter (DDS-307A, Rex). Sand NH4+-N and NO3-N were measured using an AA3-AA001-02E continuous flow analyzer (SEAL Analytical GmbH, Norderstedt, Germany). The inorganic N was the sum of NH4+-N and NO3-N. The sand available P was determined using the 0.5 mol L−1 NaHCO3 extraction-molybdenum antimony anti-colorimetric method [22], and the available K was determined by 1 mol·L−1 NH4AC extraction-flame photometry [23]. The total nutrients (TN) are the sum of the measured inorganic N, available P and K.

2.3. Statistical Analysis

Microsoft Excel 2016 (Redmond, WA, USA) and SPSS 25 (IBM, Armonk, NY, USA) were used for statistical analyses of the experimental data, and Origin 2021 (OriginLab, Northampton, MA, USA) was used for graphing. A one-way analysis of variance (ANOVA) was used with the Duncan’s test to determine significance at p < 0.05. The contour map of the distribution of different indicators was drawn using Surfer 15 (Golden Software, Golden, CO, USA). The origin was 10 cm to the left of the infiltration point directly below the dripper and the vertical down was the ordinate axis. The horizontal right was the abscissa axis, and the point (X, Y) represented the spatial coordinate point whose horizontal distance was X and vertical distance was Y to construct a two-dimensional coordinate system that described the water–salt–nutrient distribution of sand (Figure 1). The Kriging interpolation method was used to process the data grid and contour maps were drawn to obtain the distribution of each index. A principal component analysis (PCA) of the primary nutrients was conducted using Origin 2021. Inorganic nitrogen, available phosphorus, available potassium and total nutrients were selected for linear fitting analysis with the WC and EC, respectively.

3. Results

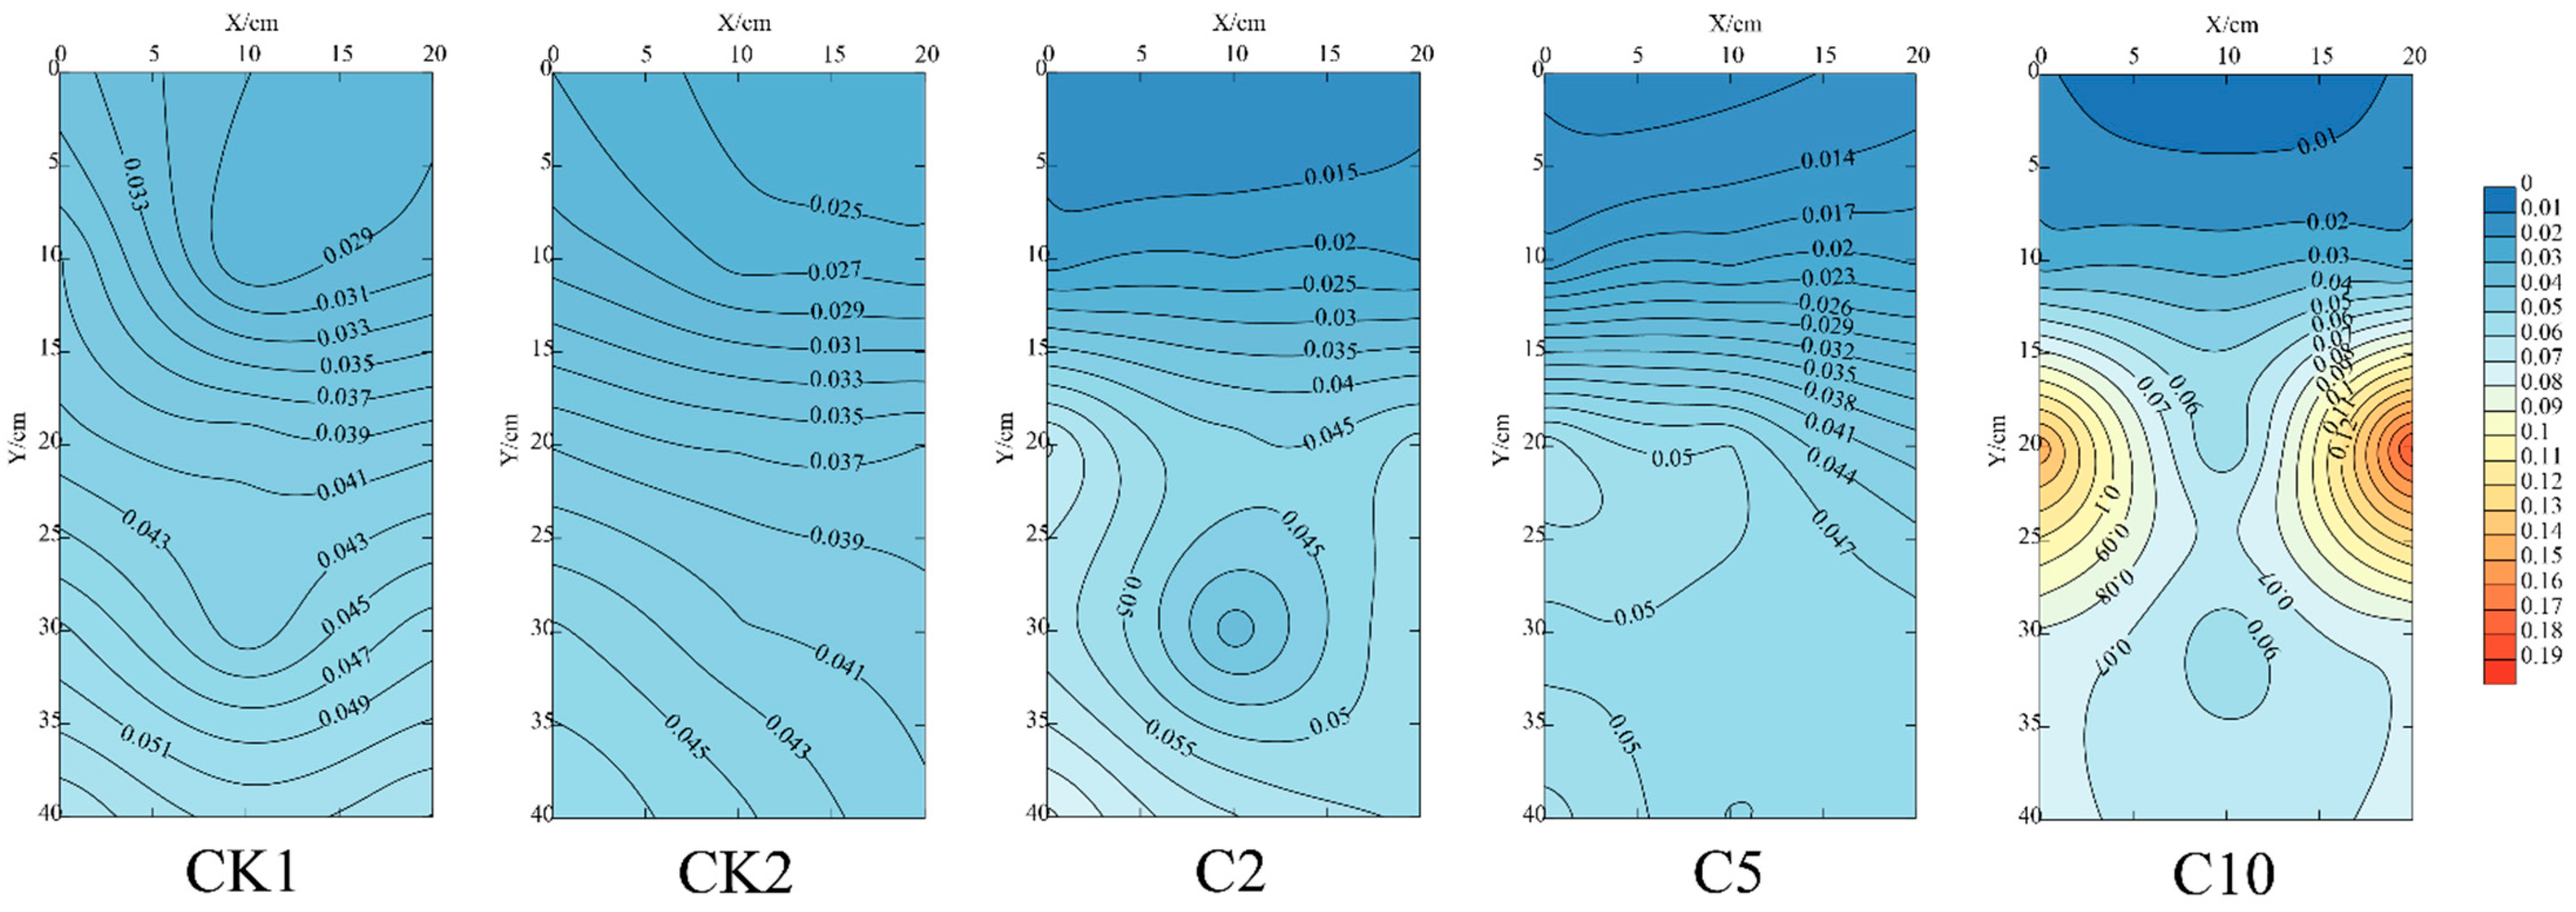
3.1. Spatial Distribution of the WC under Compost Interlayers with Different Thicknesses

As shown in Figure 2, the water distribution of the treatments was spread around with the dripper as the center; the horizontal distance was smaller than the vertical diffusion distance and the distribution satisfied the symmetrical relationship. In the vertical direction, the WC of sand increased with the increase in sand depth. CK1 and CK2 followed the same trend, both showing an increase in WC with depth. The WC of C2 increased with depth from 10–30 cm, with a central zone appearing at the 30 cm attachment. The WC of C5 increased with depth from 0 to 25 cm and tended to a stable value after 25 cm. There was no significant difference of the WC of C2, C5 and C10 at 20–30 cm when the compost interlayer thickness was added, but all values were lower than that of the C10. The WC of C10 showed a high value in the central area at 20 cm, and the approximate circle decreased to the surrounding area. Compared with CK1 and CK2, the compost interlayer did not increase the WC in the 0–10 cm layer, but increased it in the 15–30 cm and 30–40 cm layers. This showed that adding the compost interlayer treatments promoted the accumulation of the WC under the compost interlayer usually at the main distribution area of the root system.

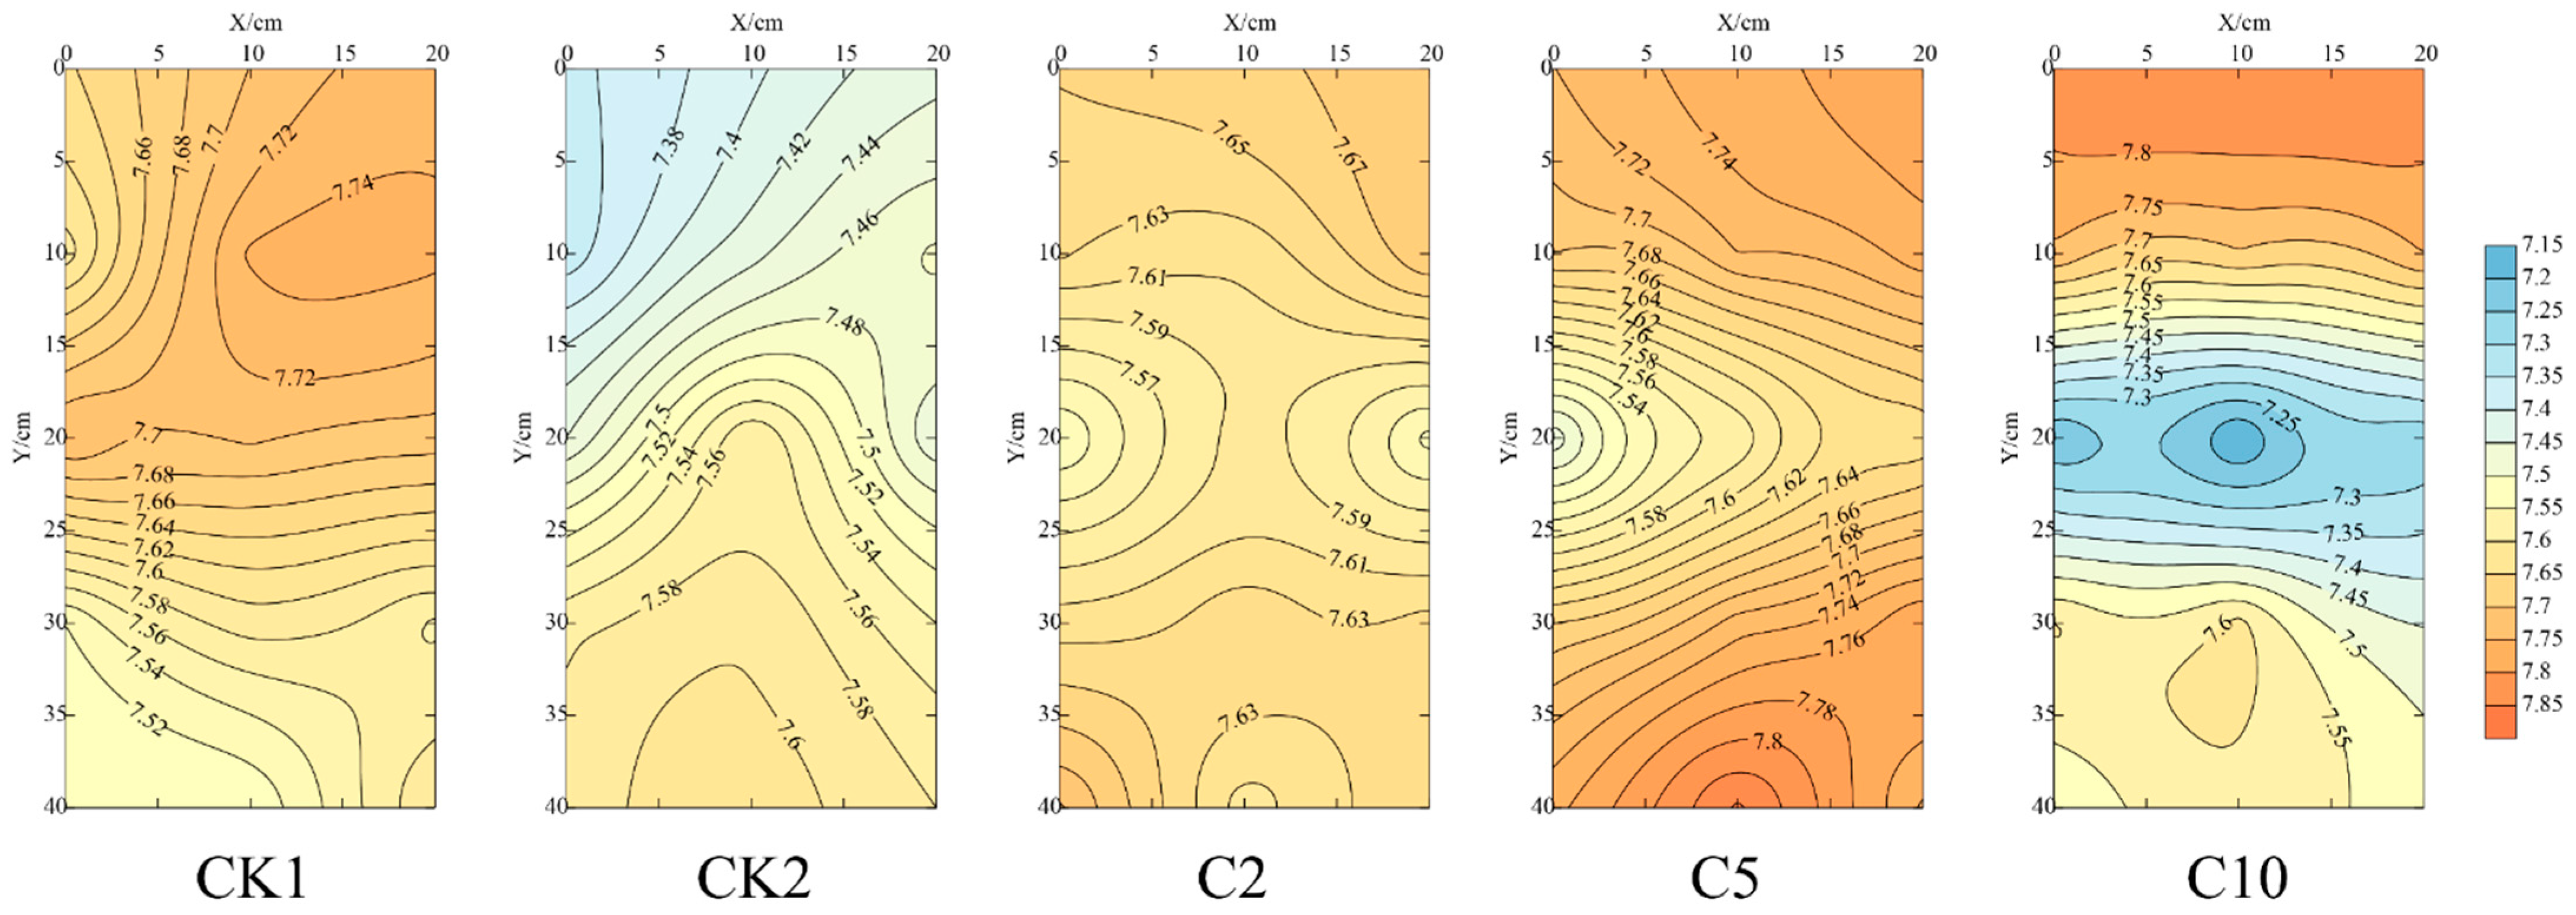
3.2. Spatial Distribution of the pH and EC of Sand under the Construction of Compost Layers with Different Thicknesses

The pH distribution was similar than that of the soil water content. With increasing sand depth, the pH of CK1 increased first and then decreased. The pH of 0–20 cm layer was higher than that of the sand layer below 20 cm, and the maximum value appeared at 20 cm. The pH of CK2 showed a decreasing trend, and the pH of the 0–20 cm sand layer was lower than that of the sand layer below 20 cm. In contrast to CK1 and CK2, the addition of a compost interlayer thickness resulted in a trend in which the pH values of C2, C5 and C10 treatments first decreased and then increased and formed a low-value central area at 15–25 cm. There was an increasing trend from the low-value central area to the surrounding areas, and the pH of C10′s low-value center was significantly lower than that of the other treatments. Compared with CK1, C5 increased the pH at 0–10 cm and below 20 cm, and the pH value of CK1 showed a decreasing trend below 20 cm (Figure 3). Although there is relatively little variation in pH across all treatments, there are some differences in terms of counter line. In contrast to CK1 and CK2, the addition of compost interlayer thickness resulted in a trend in which the pH values of C2, C5 and C10 treatments first decreased and then increased and formed a low-value central area at 15–25 cm.
The spatial distribution showed that the EC was statistically greater in the vertical direction than in the horizontal direction (Figure 4). With the increase in sand depth, both CK1 and CK2 showed a decreasing trend in EC. CK1 exhibited a low value of 280 μS·cm−1 at 30 cm, and the decreasing trend of the EC of CK2 at 25–40 cm was less than 0–25 cm. The EC of C2 showed a turning point at 10 cm and first decreased and then increased before decreasing. The EC of C5 and C10 showed a trend of first increasing and then decreasing, and the high value appeared near 20 cm. The distribution was oval-shaped and decreased from this center to the surrounding areas. The EC of CK2 was higher than the other treatments in the 0–10 cm. Compared with the CK1 and CK2, the EC of C5 and C10 decreased from 0–10 cm and increased below 20 cm.

3.3. Spatial Distribution of Nutrients under Different Thicknesses of Compost Layer

Under drip irrigation conditions, the distribution direction of NH4+-N was primarily in the vertical direction and less in the horizontal direction. With increasing sand depth, the NH4+-N of all the treatments showed a decreasing trend, and the density of the 0–20 cm contour line was significantly lower than that of the 20–40 cm contour line. In the 0–20 cm, all the treatments except CK1 showed a low value at 10 cm, and C2 had higher amounts of NH4+-N than the CK2 in the 0–10 cm contour line. The NH4+-N of the 20–40 cm counter line was lower in CK1 than in CK2 and C2, but there was no difference between CK2 and C2 in the 20–40 cm contour line. At 0–40 cm, the NH4+-N of C5 and C10 was lower than that in the other treatments. This indicated that the NH4+-N above the compost interlayer did not increase with the addition of compost thickness but decreased instead, and the NH4+-N below the compost interlayer also decreased (Figure 5).
The spatial distribution of NO3-N and NH4+-N differed from each other. With increasing depth (Figure 6), CK1, CK2 and C2 showed a decreasing trend of NO3-N, and C5 and C10 showed an increasing and then a decreasing trend. The low-value central areas of CK1, CK2 and C2 appeared at 20 cm, 40 cm and 10 cm, respectively, and then spread to the surrounding areas. The high values of C5 and C10 were distributed in the 20 cm sand layer, and the diffusion to the surrounding area decreased. The high value of NO3-N in C10 was 1.52-fold that of C5. Compared with the other treatments, the increasing range of NO3-N in the sands at different depths of C5 and C10 from high to low was as follows: 20–30 cm, 30–40 cm and 0–10 cm.
The spatial distribution of AP and EC of each treatment was similar (Figure 7). With increasing sand depth, the content of AP in CK1, CK2, C2 and C5 showed a downward trend, while C10 showed a trend of increasing first and then decreasing. The AP was primarily distributed in the 10–15 cm sand layer of CK1, the 0–30 cm sand layer of CK2, C2 and C5, and the 0–25 cm sand layer of C5 and C10. CK1 showed a low value at 20 cm and gradually decreased to the periphery, and the content of AP below 20 cm was significantly lower than that of the other treatments. In the 0–20 cm sand layer, CK2 showed a high value at 10 cm, C2 showed a low value at 10 cm and the AP of C2 was close to that of CK2 in the same sand layer. C10 showed a high value near 20 cm, and the high value of AP was 1.24-fold that of C5 and gradually decreased in all directions.
The spatial distribution of AK and EC was similar, and the C10 showed a high value at 20 cm. In terms of the overall distribution characteristics, the content of AK in CK1, CK2 and C2 showed a decreasing trend with increasing sand depth, while C5 and C10 showed a trend of increasing first and then decreasing. In the 0–10 cm sand layer, compared with CK1, only CK2 had an increase in the content of AK. Below 20 cm of sand, the content of AK in the compost interlayer treatments compared with CK1 was higher than that in the CK2 compared with CK1 and increased with the addition of compost interlayer thickness. The maximum values of C5 and C10 appeared at 30 cm and 20 cm, respectively, and the high value of C10 was 2.8-fold higher than that of C5 (Figure 8).

3.4. Influence of the Construction of Different Thicknesses of Compost Layer on the Sand Water Content and Primary Nutrient Distribution

In the 0–10 cm layer, C2 and C5 significantly reduced the sand WC compared with that of CK1, and C5 significantly reduced the sand WC compared with that of CK2. In the 10–20 cm and 20–30 cm layers, C10 significantly increased the WC compared with that of the other treatments. There was no significant difference between CK1, C2 and C10 in the 30–40 cm layer, and C10 was significantly higher than those of CK2 and C5 (Figure 9a). There was no significant difference in the amount of IN among the treatments in the 0–10 cm layer. There was no difference in the amount of IN among CK1, CK2 and C2 in the 10–20 cm, 20–30 cm and 30–40 cm layers, respectively, and they were all lower than those in C5 and C10 (Figure 9b). There was no difference in the content of AP in each treatment in the 0–10 cm layer. There was no difference in the AP among the compost interlayer treatments in the 10–20 cm, 20–30 cm and 30–40 cm layers and CK1 had the lowest amount of AP (Figure 9c). The content of AK in CK1 was the lowest in the 0–10 cm layer, and it was lower than that in CK2. The content of AK also increased with the addition of compost interlayer thickness in the 10–20 cm, 20–30 cm and 30–40 cm layers compared with CK1. The content of AK also increased, and the compost interlayer treatments were higher than the CK2 (compost mixed application). The content of AK increased significantly, and its content in C10 was 3.7-fold that of C5, 5.2-fold that of C2 and 6.1-fold that of CK2 in the 10–20 cm layer. The content of AK in C10 was 1.2-fold that of C5 and 2.94-fold that of C2 in the 20–30 cm layer (Figure 9d).

3.5. PCA of the Primary Plow Layer Nutrients in Different Treatments and a Linear Fitting Analysis with WC and EC

Major root layer nutrients (10–30 cm) of each treatment were selected for principal component analysis (PCA), and PC1 (principal component 1) and PC2 (principal component 2) were obtained. PC1 and PC2 could explain 67% and 16% of the total variation, respectively. The primary contributing indicators for PC1 were WC, NO3-N, AK, EC, total available N (TAN) and IN, and the primary contributing indicators for PC2 were NH4+-N, AP, WC and NO3-N. The EC value significantly positively correlated with the content of IN, AP, AK and TAN in the sand layer, and there was a significant positive correlation between the contents of each available nutrient (Figure 10a,b). IN, AK and TAN all had extremely significant correlations with WC (p < 0.01), but there was no significant correlation between AP and WC. The R2 and r of the line fitting of IN, AK and TAN with WC were higher than those of AP. The WC of sand had a significant effect on the distribution of IN and AP (Figure 10d). The contents of IN, AP, AK and TAN extremely significantly correlated with that of the EC (p < 0.01). The R2 and r of the line between IN, AK and TAN with EC were all greater than those of the AP, which was consistent with the fitting situation with WC in Figure 10c. This indicated that the spatial distribution of sand nutrients significantly affected the sand EC, and these differences were primarily caused by differences in the IN and AK.

4. Discussion

The irrigation with 2 L of water resulted in the accumulation of applied nutrients, which then led to a large amount of nutrient accumulation in the topsoil [24]. Results from this study showed that in the 0–10 cm surface sand layer, the WC of CK1 and CK2 were the highest and they were significantly higher than those of the other compost interlayer treatments, and the WC of CK1 was significantly higher than that of C5 by 50%. This showed that the construction of the compost interlayer reduced the movement of water to the surface layer and hindered the evaporation of water. Thus, the constructed compost interlayer has a low bulk density and a high proportion of capillary voids, which increased its ability to retain water and effectively reduced the movement of deep water to the surface layer [25]. The EC of the 0–10 cm sand layer of CK2 was higher than that of the other treatments, and C5 and C10 reduced the sand EC. The compost was rich in nutrients (inorganic N and ions among others) and mixing with the surface sand layer increased the EC in the sand layer. However, if compost is placed under the sand layer as an interlayer, the permeability coefficient will increase due to its high porosity. Alternatively, the interlayer may lead to the slow infiltration of water which is conducive to ion exchange and desorption, thus, promoting the transfer of nutrients and EC from the surface layer to the deep layer [26]. These results suggested that the compost mix (CK2) was susceptible to salt phenology and secondary salinization compared with the compost layer construction treatment [27]. Compared with CK1, the C5 and C10 treatments increased the EC content at the 0–10 cm layer, and C10 caused the most significant increase. This is because the compost interlayer impedes the movement of water to the surface layer, reducing the accumulation of nutrients in the surface layer and subsequently increasing the surface sand pH [28]. Compared with CK1, the addition of compost interlayer thickness did not significantly change the content of NH4+-N, but that of NO3-N showed an increasing trend. The NO3-N content of C10 was the highest and reached 125.84 mg·kg−1, and there was an increase in the content of AK. Similar to the results reported by Huang Yan et al. [29], we also found that the application of organic fertilizers had a greater impact on NO3-N, and the NO3-N content increased with the addition of a compost interlayer.
It is well known that the root system of vegetable crops is primarily distributed on the surface at 10 to 20 cm. A linear regression analysis showed that WC and EC were significantly positively correlated with the available nutrients, and the TAN, IN and AK were better than AP in fitting with the WC and EC. This was probably because P is unstable in the soil and has little mobility [30]. Compared with CK1, the compost had colloid and capillary voids, and the compost interlayer significantly increased the water content of the 10–30 cm sand layer; C10 had the most significant increase [31]. Compared with CK1 and CK2, the compost layer construction treatment decreased the sand pH. Compared with CK1, the other treatments significantly increased the sand EC, and the C10 treatment increased the most significantly. This also occurred because the compost layer increases the permeability coefficient owing to its high porosity and simultaneously reduces the accumulation of salt in the surface layer, thus causing the transfer of nutrients from the surface layer to the deep layer, followed by increases in the nutrient and salt contents of the deep sand [32].
The amount of NH4+-N showed a decreasing trend with the addition of compost interlayer thickness, and NO3-N showed an increasing trend. The contents of C5 and C10 IN were significantly higher than those in other treatments, and the proportion of NO3-N increased. The transport and distribution of nutrients are determined by the type of fertilizer and the physicochemical properties of the cultivation medium. The trend of NO3-N to migrate is significantly higher than the spatial distribution characteristics of NH4+-N, which could be owing to the high solubility of NO3-N, and the migration is more noticeable with the distribution of water [33]. Vegetable crops benefit from NO3-N, but the appropriate ratio of NH4+-N can promote the growth and development of crops and is beneficial to the absorption of K+ by crops to some extent. Cui Jihan et al. [34] reported that there is an antagonistic relationship between NH4 and K when the crops absorb nutrients. It shows that C5 and C10 increase the proportion of NO3-N in N and reduce the proportion of NH4+-N while increasing the amount of IN, which will also be conducive to promoting the use of K by crops.
In the 30–40 cm sand layer, compared with CK2, the addition of compost interlayer first caused an increase in the pH, which then decreased. The EC and IN increased significantly; the NH4+-N decreased, and the WC and IN in the contents of C10 were the highest. This was primarily caused by the increase in NO3-N. The AP and AK significantly increased at the same time as the increase in IN, and the available nutrients were the highest in the C10 treatment, which was significantly higher than those in CK1 and CK2. The addition of a compost interlayer can significantly increase the available nutrients of the deep sand, but an excessive thickness will lead to the accumulation of nutrients such as nitrates in the deep sand. Too many nutrients cannot be fully used by the crop, which results in less efficient nutrient use, and the accumulation of large amounts of nitrate tends to cause nitrate pollution and environmental hazards [35].
With the addition of a compost interlayer thickness, the WC, EC and nutrients of the primary plow layer in the sand all increased. The excessive thickness brings in a large number of available nutrients, which far exceeds the needs of crops, resulting in excessive nutrient input [36,37]. Compared with the other treatments, the C10 treatment had higher EC values and amounts of TAN. The analysis of the fitting results indicates that a higher EC is often accompanied by higher nutrient contents, and a high EC is more likely to cause salinity stress, which can lead to water loss in the root system and even to the dehydration of plants [38]. This can cause ion poisoning [39,40]. For non-salt-tolerant crops, when the EC is greater than 1 mS·cm−1, a physiological obstacle will appear, which will significantly reduce the yield. In addition, Li et al. [41] pointed out that salinity negatively correlates with the digestion of N, and excessive salinity will inhibit the digestion of N and reduce the benefits of nutrients. In addition, values of EC that are too high are not conducive to the normal growth and development of crops in the later stage. Therefore, it is recommended to build a 5 cm compost interlayer to improve the water and nutrient characteristics of the sand plow layer area, provide more root zone nutrients for the next vegetable crop planting and reduce the input of fertilizer.

5. Conclusions

The study demonstrates that control 2 can increase the nutrients and electrical conductivity of the surface sand. However, this results in the accumulation of salinity. It is necessary to emphasize that the construction of a compost interlayer can reduce the movement of water to the surface, hinder the evaporation of water and promote the transfer of nutrients from the surface layer to the deep layer. In addition, as the compost layer thickness increases, it reduces the amount of ammonium nitrogen and increases the amounts of nitrate nitrogen and available phosphorus. Furthermore, the compost layer can increase the water content by 32 to 156% and also increase the electrical conductivity and the proportion of nitrate nitrogen in the primary distribution area of 10–30 cm. This has a significant effect on the IN and AP of the sand in the primary distribution area of 10–30 cm in the root system and total nutrients positively correlated with those of the electrical conductivity and water content. An analysis of the findings of this study, combined with the PCA, showed that when the compost layer < 5 cm, the sand layer contributed to the retention of water and fertilizer. Compared with control 2, the fertilizer input was reduced by 24 to 84%, which would provide more root zone nutrients in the 10–30 cm area. Taking into account the cost of the compost material and the contribution of the different compost interlayer treatments to the nutrients in the primary root layer, we recommend 5 cm to be used among those applied.Next, we will plant the main vegetable crops and explore the effect of the compost layer on the improvement of the vegetables.

Author Contributions

X.Z. and D.Y. conceived and designed the experiments. J.Z., Z.L., X.W., Y.L. performed the research and analyzed the data. X.Z. and J.Z. wrote the paper. All authors have read and agreed to the published version of the manuscript.

Funding

This study was supported by the Key R & D projects of the Autonomous Region in Ningxia (2022BBF02024), Helan Mountain Scholars in Ningxia University (2020), the Science and Technique Innovation Leader Program of Ningxia (KJT2017001), and the Horticulture Science Program of Western First-class Discipline Project in Ningxia (NXYLXK2017B03).

Data Availability Statement

Not applicable.

Conflicts of Interest

The authors declare no conflict of interest.

References

  1. Driessen, P.; Deckers, J.; Spaargaren, O.; Nachtergaele, F. (Eds.) Lecture Notes on the Major Soils of the World; Food and Agricultural Organization of the United Nations: Roma, Italy, 2001; Volume 94, p. 334. Available online: https://edepot.wur.nl/82729 (accessed on 1 September 2020).
  2. Shi, P.-J.; Shimizu, H.; Wang, J.-A.; Liu, L.-Y.; Li, X.-Y.; Fan, Y.-D.; Yu, Y.-J.; Jia, H.-K.; Zhao, Y.; Wang, L. Land degradation and blown-sand disaster in China. In Plant Responses to Air Pollution and Global Change; Springer: Tokyo, Japan, 2005; pp. 261–269. [Google Scholar]
  3. Yu, X.; Grace, M.; Zou, Y.; Yu, X.; Lu, X.; Wang, G. Surface sediments in the marsh-sandy land transitional area: Sandification in the western Songnen Plain, China. PLoS ONE 2014, 9, e99715. [Google Scholar] [CrossRef] [PubMed]
  4. Wang, F.; Pan, X.; Wang, D.; Shen, C.; Lu, Q. Combating desertification in China: Past, present and future. Land Use Policy 2013, 31, 311–313. [Google Scholar] [CrossRef]
  5. Paolo, D.O.; Abinash, B.; Kyle, F.D.; Sujith, R.; Christiane, W.R. Global desertification: Drivers and feedbacks. Adv. Water Resour. 2013, 51, 326–344. [Google Scholar] [CrossRef]
  6. Han, Y.; Liu, Z.; Yu, X.; Wang, J. Desertification monitoring and early warning in context of sandy land consolidation. Trans. Chin. Soc. Agric. Eng. 2017, 33, 271–277. [Google Scholar]
  7. Ma, S.; Wang, G.; Yang, S. Land desertification control and ecological restoration in northwestern China. Bull. Soil Water Conserv. 2004, 5, 105–108. [Google Scholar] [CrossRef]
  8. Kwesi Asomaning, S.; Abekoe, M.; Dowuona, G.N.N.; Borggaard, O.; Kristensen, J.; Breuning-Madsen, H. Sustainable long-term intensive application of manure to sandy soils without phosphorus leaching: A case study from Ghana. Acta Agric. Scand. Sect. B—Soil Plant Sci. 2015, 65, 747–754. [Google Scholar] [CrossRef]
  9. Li, C.; Huang, l.; Guo, S.; Guo, S.; Lu, C.; Cui, J. Screening test on the variety conversion of gift watermelon with sand culture in the desert solar greenhouse. North. Hortic. 2014, 16, 37–39. [Google Scholar]
  10. Weber, J.; Karczewska, A.; Drozd, J.; Licznar, M.; Licznar, S.; Jamroz, E.; Kocowicz, A. Agricultural and ecological aspects of a sandy soil as affected by the application of municipal solid waste composts. Soil Biol. Biochem. 2007, 39, 1294–1302. [Google Scholar] [CrossRef]
  11. Duan, Z.; Xiao, H.; Dong, Z.; Wang, G.; Drake, S. Morphological, physical and chemical properties of aeolian sandy soils in northern China. J. Arid Environ. 2007, 68, 66–76. [Google Scholar] [CrossRef]
  12. Li, X.; Xiao, H.L.; He, M.; Zhang, J.G. Sand barriers of Straw checkerboard for habitat restoration in extremely arid desert region of China. Ecol. Eng. 2006, 28, 149–157. [Google Scholar] [CrossRef]
  13. Yao, R.; Li, H.; Yang, J.; Chen, Q.; Zheng, F.; Shang, H. Regulation effect of biomass improved materials on migration of soil water, salt and nitrogen in salt-affected soil under drip irrigation. Trans. Chin. Soc. Agric. Mach. 2020, 51, 282–291. [Google Scholar]
  14. Ding, L. The Effect of Sheep Dung Biochar and Composting Products on the Nutrient Improvement of Sandy Soil. Master’s Thesis, Zhejiang Agricultural and Forestry University, Hangzhou, China, 2018. [Google Scholar]
  15. Karbout, N.; Brahim, N.; Mlih, R.; Moussa, M.; Bousnina, H.; Weihermuller, L.; Bol, R. Bentonite clay combined with organic amendments to enhance soil fertility in oasis agrosystem. Arab. J. Geosci. 2021, 14, 428. [Google Scholar] [CrossRef]
  16. Boutchich, G.E.K.; Tahiri, S.; Krati, M.E.; Kabil, E.M.; Lhadi, E.K.; Mahi, M.; de la Guardia, M. Sandy soil modification by bio-composts for wheat production. Waste Biomass Valorization 2018, 9, 1129–1139. [Google Scholar] [CrossRef]
  17. Han, Y.; Xu, Y.; He, J.; Bai, W.; Song, J.; Lv, G. Movement of water and nitrate in sandy soil containing a layer of mixture of water-absorbing polymer and soil. J. Irrig. Drain. 2019, 38, 44–48. [Google Scholar] [CrossRef]
  18. Hu, Z.; Liu, S.; Gong, Y. Evaluation of soil quality and maize growth in different profiles of reclaimed land with coal gangue filling. Land 2021, 10, 1307. [Google Scholar] [CrossRef]
  19. Yang, M.; Yang, R.; Li, Y.; Pan, Y.; Sun, J.; Zhang, Z. Effects of different biomass materials as a salt-isolation layer on water and salt migration in coastal saline soil. PeerJ 2021, 9, e11766. [Google Scholar] [CrossRef]
  20. Kusparwanti, T.R.; Eliyatiningsih; Wardana, R. Application legume compost with bio-activator Trichoderma sp as Inorganic fertilizer substitution in sweet corn (Zea mays L. saccharata) cultivation. IOP Conf. Ser. Earth Environ. Sci. 2020, 411, 012063. [Google Scholar] [CrossRef]
  21. Bergstrand, K.-J. Organic fertilizers in greenhouse production systems—A review. Sci. Hortic. 2022, 295, 110855. [Google Scholar] [CrossRef]
  22. Olsen, S.R. Estimation of Available Phosphorus in Soils by Extraction with Sodium Bicarbonate; USDA Circular No. 939; USA Government Print Office: Washington DC, USA, 1954; pp. 1–19.
  23. Knudsen, D.; Peterson, G.; Pratt, P. Lithium, sodium, and potassium. In Methods of Soil Analysis: Part 2 Chemical and Microbiological Properties, 9.2.2, 2nd ed.; American Society of Agronomy: Madison, WI, USA, 1983; Volume 9, pp. 225–246. [Google Scholar]
  24. Zhang, Z.; Sun, D.; Tang, Y.; Zhu, R.; Li, X.; Gruda, N.; Dong, J.; Duan, Z. Plastic shed soil salinity in China: Current status and next steps. J. Clean. Prod. 2021, 296, 126453. [Google Scholar] [CrossRef]
  25. Hassan, M.; Mohamed, M.; Mostafa, Z. Response of lettuce (Lactuca sativa L.) plants to application of compost levels under various irrigation regimes. Middle East J. 2019, 8, 662–674. [Google Scholar]
  26. Wang, J.; Huang, Y.; Long, H.; Hou, S.; Xing, A.; Sun, Z. Simulations of water movement and solute transport through different soil texture configurations under negative-pressure irrigation: No have. Hydrol. Process. 2017, 31, 2599–2612. [Google Scholar] [CrossRef]
  27. Lu, W.; Zhang, J.; Wang, Y.; Jing, M.; Hu, Y. Research progress on soil secondary salinization in solar greenhouse. J. Heilongjiang Agric. Sci. 2021, 8, 112–116. [Google Scholar]
  28. Lin, Y.; Ye, G.; Kuzyakov, Y.; Liu, D.; Fan, J.; Ding, W. Long-term manure application increases soil organic matter and aggregation, and alters microbial community structure and keystone taxa. Soil Biol. Biochem. 2019, 134, 187–196. [Google Scholar] [CrossRef]
  29. Huang, Y.; Cao, G.; Geng, Y.; Ye, Q.; Li, J.; Han, Y. Effects of agricultural wastes returned to the field on soil nitrogen content and nitrogen use efficiency. J. Jilin Agric. Univ. 2020, 42, 167–174. [Google Scholar] [CrossRef]
  30. Huang, C.; Xu, J. Soil Science, 3rd ed.; China Agriculture Press: Beijing, China, 2010; pp. 202–206. [Google Scholar]
  31. Gallardo-Lara, F.; Nogales, R. Effect of the application of town refuse compost on the soil-plant system: A review. Biol. Wastes 1987, 19, 35–62. [Google Scholar] [CrossRef]
  32. Liu, Y.; Li, T.; Yu, H.; Zhang, X. Effect of interaction between manure and inorganic fertilizers on salt content and ion composition in greenhouse soil. J. Agro-Environ. Sci. 2009, 28, 292–298. [Google Scholar] [CrossRef]
  33. Zhang, J.; Li, J.; Zhao, B.; Li, Y. Simulation of water and nitrogen dynamics as affected by drip fertigation strategies. J. Integr. Agric. 2015, 14, 2434–2445. [Google Scholar] [CrossRef]
  34. Cui, J.; Liu, M.; Zhao, Y.; Song, S.; Liu, X.; Xia, X.; Li, S.; Liu, J. Effects of different nitrogen forms on growth and nitrogen utilization of foxtail millet. Shandong Agric. Sci. 2021, 53, 58–64. [Google Scholar] [CrossRef]
  35. Xiao, Y.; Yang, P.; Wu, B.; Liu, J.; Guo, T. Analysis of arid oasis areas soil nitrogen accumulation and winter irrigation effect. Water Sav. Irrig. 2018, 2, 71–76. [Google Scholar]
  36. Yu, H.; Li, T.; Zhang, X. Nutrient budget and soil nutrient status in greenhouse system. Sci. Agric. Sin. 2010, 43, 514–522. [Google Scholar] [CrossRef]
  37. Luan, H.; Gao, W.; Tang, J.; Li, R.; Li, M.; Zhang, H.; Chen, X.; Masiliunas, D.; Huang, S. Aggregate-associated changes in nutrient properties, microbial community and functions in a greenhouse vegetable field based on an eight-year fertilization experiment of China. J. Integr. Agric. 2020, 19, 2530–2548. [Google Scholar] [CrossRef]
  38. Zhang, J.; Duan, Z. Preliminary study on classification and grading standards and causes and hazards of secondary salinization of facility vegetable soils. Soils 2011, 43, 6. [Google Scholar]
  39. Wang, Q.; Liu, Q.; Gao, Y.; Liu, X. Review on the mechanisms of the response to salinity-alkalinity stress in plants. Acta Ecol. Sin. 2017, 37, 5565–5577. [Google Scholar]
  40. Corwin, D.L.; Lesch, S.M. Apparent soil electrical conductivity measurements in agriculture. Comput. Electron. Agric. 2005, 46, 11–43. [Google Scholar] [CrossRef]
  41. Li, J.; Huang, G. Pilot study of salinity (NaCl) affecting nitrogen transformation in silt loam soil. Res. Environ. Sci. 2008, 21, 98–103. [Google Scholar] [CrossRef]
Figure 1. Sand column diagram. The sand column was made of acrylic material 50 cm high and had an inner diameter of 20 cm. The bottom knob controlled the movement of water and X is the thickness of the composting interlayer.
Agronomy 13 01181 g001
Figure 2. Spatial distribution of the water content under different treatments (m3/m3).
Agronomy 13 01181 g002
Figure 3. Spatial distribution of the pH under different treatments.
Agronomy 13 01181 g003
Figure 4. Spatial distributions of electrical conductivity under different treatments (μS·cm−1).
Agronomy 13 01181 g004
Figure 5. Spatial distribution of the NH4+-N content under different treatments (mg·kg−1).
Agronomy 13 01181 g005
Figure 6. Spatial distribution of NO3-N content under different treatments (mg·kg−1).
Agronomy 13 01181 g006
Figure 7. Spatial distribution of AK content under different treatments (mg·kg−1).
Agronomy 13 01181 g007
Figure 8. Spatial distribution of available potassium under different treatments (mg·kg−1).
Agronomy 13 01181 g008
Figure 9. Effect of different treatments on the water content and available nutrients under different sandy layers. (a) Water content of different treatments. (b) Inorganic nitrogen of different treatments. (c) Available phosphorus of different treatments. (d) Available potassium of different treatments. p < 0.05 indicates significance, and p < 0.01 indicates extreme significance. Different letters (e.g., a, b, c, etc.) are statistically significant (p < 0.05) from each other.
Agronomy 13 01181 g009
Figure 10. PCA of primary surface nutrients under different treatments and linear fitting analysis with WC and EC. (a) Score map of each treatment in PCA1 and PCA2. (b) Loading map of each variable in PCA, ammonium nitrogen (NH4+-N), nitrate nitrogen (NO3-N), electrical conductivity (EC), water content (WC), inorganic nitrogen (IN), available potassium (AK), total nutrients (TAN) and available phosphorus (AP). (c) The fitting diagram of each nutrient and water content. (d) Each nutrient and conductivity fitting graph. R2 is the goodness of fit, and a larger value indicates a greater degree of explanation of the independent variable to the dependent variable. r is Pearson’s correlation coefficient. A larger absolute value indicates a stronger correlation. EC, electrical conductivity; PCA, principal component analysis; WC, water content. p < 0.05 indicates significance, and p < 0.01 indicates extreme significance.
Agronomy 13 01181 g010
Table 1. Physical and chemical properties of the test materials.
MaterialsBulk
Density
(g cm−3)
pHElectrical
Conductivity
mS cm−1)
Available Potassium (mg kg−1)Available
Phosphorus
(mg kg−1)
Ammonium Nitrogen
(mg kg−1)
Nitrate
Nitrogen (mg kg−1)
Sand0.839.020.148.963.9119.7512.24
Compost0.257.861.66979.102024.791948.333316.66
The values are means of triplicate analyses.
Disclaimer/Publisher’s Note: The statements, opinions and data contained in all publications are solely those of the individual author(s) and contributor(s) and not of MDPI and/or the editor(s). MDPI and/or the editor(s) disclaim responsibility for any injury to people or property resulting from any ideas, methods, instructions or products referred to in the content.

