Article

Energy Budgeting and Carbon Footprints Estimation of Fodder Maize Varieties Sown under Different Nutrient Management Practices in Indo-Gangetic Plains of India

1
ICAR-National Dairy Research Institute, Karnal 132001, India
2
ICAR-Central Coastal Agricultural Research Institute, Old Goa 403402, India
3
Rajasthan Agricultural Research Institute, Sri Karan Narendra Agriculture University, Jobner 302018, India
4
Seed Farm, Punjab Agricultural University, Nabha, Patiala 147201, Punjab, India
5
ICAR-Research Complex for Eastern Region, Patna 800014, India
6
ICAR-Indian Agricultural Research Institute, New Delhi 110012, India
*
Authors to whom correspondence should be addressed.
Agronomy 2023, 13(4), 981; https://doi.org/10.3390/agronomy13040981
Submission received: 14 February 2023 / Revised: 20 March 2023 / Accepted: 24 March 2023 / Published: 26 March 2023

Abstract

:
Inappropriate agricultural practices consume more input energy and emit higher greenhouse gases (GHGs) which cause global warming and climate change, thereby threatening environmental sustainability. To identify energy and carbon-efficient varieties and nutrient management practices, the present study was undertaken during the kharif season of 2018 and 2019 in a split-plot design with three varieties of fodder maize (African Tall, J-1006 and P-3396) and four nutrient management practices such as N0: Absolute control, N1: 100% recommended dose of fertilizers (RDF), N2: 75% RDF + plant growth promoting rhizobacteria (PGPR) + Panchagavya spray and N3: 50% RDF + 25% farmyard manure (FYM) + PGPR + Panchagavya spray). Results indicated that variety J-1006 and applying 75% RDF + PGPR + Panchagavya spray produced significantly higher dry fodder yield. Among the varieties, J-1006 recorded the highest total energy output (224,123 MJ ha−1), net energy (211,280 MJ ha−1), energy use efficiency (17.64), energy productivity (0.98 kg MJ−1), energy profitability (16.64), and lowest specific energy (1.03 MJ ha−1). Regarding nutrient management, 75% RDF + PGPR + Panchagavya spray fetched the highest total energy output (229,470 MJ ha−1) and net energy (215,482 MJ ha−1). However, energy use efficiency, energy productivity, and energy profitability were significantly higher with integrated nutrient management (N2 and N3) over 100% RDF. Concerning the carbon estimation, J-1006 resulted in a significantly higher carbon output (5479 kg CE ha−1), net carbon gain (5029 kg CE ha−1), carbon efficiency (12.46), carbon sustainability index (11.46), and significantly lower carbon footprint per unit yield (CFy) (131.3 kg CO2-e Mg−1). For nutrient management, the application of 75% RDF + PGPR + Panchagavya spray showed significantly higher carbon output (5609 kg CE ha−1) and net carbon gain (5112 kg CE ha−1). However, significantly higher carbon efficiency, carbon sustainability index, and lower CFy were reported with integrated nutrient management over 100% RDF. Overall, selecting the J-1006 variety and applying 75% RDF + PGPR + Panchagavya spray for fodder maize cultivation could be the most productive in terms of dry fodder production, energy, and carbon efficiency approach.

1. Introduction

The agriculture sector is energy intensive and contributes to greenhouse gas (GHGs) emissions [1]. Out of the total primary energy available globally, food production consumes from 15 to 30%, but at the same time, it emits around 25 to 34% of total GHG emissions [1,2]. For the past five decades, especially after the green revolution, the consumption of energy for crop production has increased extensively, mainly due to the excessive use of fossil fuels, chemical fertilizers, etc. [3]. In the meantime, the emission of GHGs has also increased in the atmosphere. The main GHGs are methane (CH4), nitrous oxide (N2O), and carbon dioxide (CO2) [4]. Atmospheric CO2 levels have rapidly increased worldwide for the last few decades, especially after industrialization [5], which causes global warming. In 2021, the CO2 concentration in the atmosphere was 412.74 ppm [6], and it will increase further if proper management practices are not adopted. As per a recent estimate, agriculture, forestry, and other land use accounted for 23% of total GHGs emissions during 2007–2016 [7]. Though, extensive use of input energy and carbon in crop production is not sustainable as it contributes to GHGs emissions, global warming, and climate change, which adversely influences crop yield and environmental and human life [8]. Improving the energy and carbon use efficiency in agriculture will help in minimizing the CO2 and other GHGs emissions [9]. The adoption of efficient technology for crop production, which has the capacity for higher carbon sequestration and requires less input energy, will surely curtail the carbon emission from the agriculture sector and signifies environmental sustainability [10]. For crop production, the input energy comes from direct, indirect, renewable, and non-renewable sources [11]. The maximum input energy and carbon consumption required for fuel, machinery, nutrient management, tillage, etc. [9]. Therefore, estimation of energy and carbon budgeting is required to know its efficiency and productivity for a particular treatment or input. Energy indices such as energy use efficiency, energy productivity, energy profitability, etc., and carbon indices such as carbon use efficiency, carbon sustainability index, and carbon footprints per unit yield (CFy), etc., are the common indices computed for energy and carbon budgeting.
Livestock is an integral part of the Indian agriculture sector, where most farmers are small and marginal holders (>75%). India has around 536.76 million livestock population [12], but sufficient fodder is not available to feed these livestock. India faces a net deficit of 35.6, 10.95, and 44% in green fodder, dry crop residues, and concentrate feed ingredients, respectively [13]. Therefore, fodder production may either be increased through the selection of high biomass-producing crops, variety, or adequate agronomic management practice [14]. Cereal crops are well known for higher productivity in terms of green biomass. Maize is popularly known as the queen of cereal due to incomparable productivity among cereal crops [15]. It has very high biomass production [16] with excellent fodder quality as it is free from toxicants; therefore, it can be safely fed to animals at any stage of crop growth [17]. Amongst the non-legume cultivated fodders, maize is the only fodder that provides higher nutritional quality and good biomass quantity. The green biomass of fodder crops is directly related to nutrient application, especially nitrogen. Indiscriminate and higher use of chemical fertilizers for cereal fodder cause inadequacy in one or more micronutrients, deteriorating soil health that leads to a drop in productivity [18]. For sustainable crop production, the soil organic matter and microbial activities that are crucial nutrient management features should be maintained [19]. Including organic manures in crop nutrition significantly improved crop productivity and soil fertility [20,21]. Farmyard manure (FYM) and plant growth-promoting rhizobacteria (PGPR) are organic sources of nutrients that improve the physicochemical conditions of soils [22], solubilizing nutrients and augmenting plant growth [23,24]. Integrated use of organic nutrient sources with chemical fertilizers is a better nutrient management approach for sustainable fodder production under Indian conditions [25]. Many researchers have also advocated the integrated nutrient management system [26,27,28]. However, most of the studies showed only productivity, fodder quality, and soil health information. In the current global warming and agricultural mechanization era, the studies on fodder crops should not be restricted to productivity and quality but also assess energy budgeting and carbon footprints. Until now, studies on fodder crops have rarely been determined and documented concerning energy budgeting and estimation of carbon footprints. Therefore, we have undertaken this study to analyze the energy budgeting and estimate the carbon footprints for three varieties under different nutrient management practices to identify the most suitable variety, energy, and carbon-efficient nutrient management practices for fodder maize cultivation.

2. Materials and Methods

2.1. Experimental Site

The experiment was conducted at the Research Farm of the Agronomy Section, ICAR-National Dairy Research Institute, Karnal, Haryana, India, during the kharif season of 2018 and 2019. The location is situated at an elevation of 245 m above mean sea level with a latitude of 29°43′ North and longitude of 76°58′ East. This area falls under a typical semi-arid climate with a mean annual rainfall of about 690–720 mm. More than 2/3rd of the total rainfall is received during the kharif season. The soil of the study area was neutral to slightly alkaline (pH 7.61) and had 0.312 dS m−1 electrical conductivity, 0.63% organic carbon, and 192.4, 29.71, and 195.7 kg ha−1 available N, P, and K, respectively. The details of weather conditions during the experimental years are presented in the Supplementary File (Figures S1 and S2).

2.2. Treatments Details and Crop Management

The study was carried out in a split-plot design using three varieties of fodder maize in the main plot, four nutrient management practices in the subplot, and three replications. Treatment details are given in Table 1. The recommended dose of FYM was 10 t ha−1, of which 25% was applied in the N3 treatment at the time of sowing. The recommended dose of fertilizers (RDF) of N, P2O5 and K2O was 100, 60, and 40 kg ha−1, respectively, supplied through urea, single super phosphate, and muriate of potash. Half a dose of N fertilizer was applied at the time of sowing, and the remaining half dose was applied at 26 DAS. However, a full dose of P2O5 and K2O was applied as basal. Panchagavya was prepared by mixing 15 L of cow urine, 10 kg of cow dung, four liters of cow milk, four kg of cow curd, and one kg of cow ghee in a plastic drum. Two dozen ripened bananas and two kg of jaggery were cut into small pieces and mixed with the above cow ingredients, along with 500 g of turmeric powder and one liter of coconut water. After mixing, the plastic drum was sealed tightly. These ingredients were shaken twice a day for up to 25 days (till the panchagavya preparation). Then, the panchagavya was filtered with white muslin cloth using 8 liters of distilled water. Around 30 liters of panchagavya were obtained which was sufficient for two 3% foliar sprays over one hectare. Panchagavya was applied at 25 and 40 days after sowing (DAS) through a foliar spray. The chemical and microbial compositions of the FYM and Panchagavya are given in the Supplementary File (Tables S1 and S2). The liquid formulation of PGPR consisting of nitrogen fixer (Azotobacter spp.), phosphorus solubilizing bacteria (PSB), and potassium mobilizing bacteria (KMB) was utilized for the study. The PGPR was used as a seed treatment at the rate of 120 mL ha−1 of seeds. After treatment, the seeds were kept in the shade for about half an hour for drying and then used for sowing. Soon after sowing, the herbicide Atrazine @ 0.75 kg a.i. ha−1 was sprayed to keep minimal weed growth at the initial stage. The pre-sowing irrigation was not required during monsoon season. After sowing, two irrigations at 5 cm depth were given in 2018, while three irrigations were supplied in 2019 through the check basin method. The crop was harvested for fodder purposes at 66 and 67 DAS during the first and second years of experimentation. Treatment-wise, fodder samples were collected for dry matter estimation. Dry fodder yield (t ha−1) was calculated by multiplying the green fodder yield (t ha−1) and dry matter content (%).

2.3. Energy Budgeting

Energy budgeting was computed by estimating the energy of all inputs and outputs. All inputs used during the cultivation of fodder maize and its output (dry fodder yield) were recorded. These inputs and outputs were multiplied with their respective energy equivalent to get energy estimation. Energy equivalents used for this study were obtained from various sources and presented in Table 2. In agriculture, energy is classified into direct and indirect sources based on its release pattern [29]. In our study, direct sources release energy directly upon their utilization, including human labor, diesel, electricity, and irrigation water. However, radiation, rain, and wind are also direct sources of energy but were not considered for this study. Indirect sources do not release energy directly but dissipate energy during different conversion processes. In our experiment, indirect sources include seeds, fertilizers, herbicides, pesticides, and machinery. However, nutrients absorbed by crops from the soil or degradation of soil organic matter are also indirect sources but were not considered in the present study. Based on resources, energy is classified into renewable (includes human labor, irrigation water, and seeds) and non-renewable energy (includes diesel, electricity, fertilizers, herbicides, and machinery) [29]. Energy inputs, such as source-wise, operation-wise, direct, indirect, renewable, and non-renewable energy, were calculated for varieties and nutrient management practices. All input energy equivalents were summed to get the anticipated total input energy. Energy use indices such as energy output, net energy, energy use efficiency, energy productivity, energy profitability, and specific energy were calculated as per the standard procedure [30].
Energy   Output   ( MJ   ha 1 ) =   Dry   Fodder   Yield   ( kg   ha 1 ) × 18
Net   Energy   ( MJ   ha 1 ) = Energy   output   ( MJ   ha 1 )   Energy   input   ( MJ   ha 1 )  
Energy   Use   Efficiency   = Energy   output   ( MJ   ha 1 ) Energy   input   ( MJ   ha 1 )  
Energy   Productivity   ( kg   MJ 1 ) = Dry   fodder   yield   ( kg   ha 1 ) Energy   input   ( MJ   ha 1 )  
Energy   Profitability   = Net   energy   ( MJ   ha 1 ) Energy   input   ( MJ   ha 1 )  
Specific   Energy   ( MJ   kg 1 ) = Energy   input   ( MJ   ha 1 ) Dry   fodder   yield   ( kg   ha 1 )  

2.4. Carbon Footprints Estimation

The carbon footprints in terms of spatial and yield basis for varieties under different nutrient management practices were determined to assess the environmental impacts due to fodder maize cultivation. Source-wise (machinery, diesel, labor, seeds, manures and fertilizers, N2O, irrigation, herbicide, and insecticides and fungicides) and operation-wise (field preparation, sowing, nutrient management, water management, weed management, plant protection, and harvesting), carbon consumption in terms of carbon emission equivalent (CO2-e) (CCE) were estimated using their respective equivalent carbon emission. The equivalent carbon emission (kg CO2-e unit−1) used in the present study for inputs and output were collected from various sources and presented in Table 3. However, carbon equivalents for each plant protection chemical are not available; therefore, the CCE is computed after assuming that the carbon emission in the production, transportation, storage and field application is the same for the protection chemical within a class [40,41].
The N2O emission from N applied through fertilizer, manure, and panchagavya was calculated using the following equation [42]. To convert the N2O emission kg year−1 to kg CO2-e ha−1, it was multiplied by 265 [43].
N 2 O   emission   ( kg   year 1 ) = N   applied   ( kg   ha 1 ) ×   EF 1 × 44 28
where N applied is the total N supplied through chemical fertilizer, FYM, and panchagavya; EF1 is the emission factor 0.01 for N2O emissions from N inputs [42].
Table 3. Equivalent carbon emissions of inputs and output used for fodder maize cultivation.
Sr. No.ParticularsUnitEquivalent Carbon Emission
(kg CO2-e Unit−1)
References
1Seedskg1.22Wang et al. [44]
2Human laborhr0.86Deng [45]
3DieselL3.32Deng [45]
4Disc Harrowha31.97West and Marland [41]
5Rotovator *1ha98.08West and Marland [41]
6Seed drill *2ha24.90West and Marland [41]
7Bund Former *2ha24.90West and Marland [41]
8FYMkg0.007Basavalingaiah et al. [46]
9Nkg4.96Lal [40]
10P2O5kg1.35Lal [40]
11K2Okg0.58Lal [40]
12Irrigationha m2192.41Singh and Ahlawat [47]
13HerbicideL6.3Lal [40]
14InsecticideL5.1Lal [40]
15FungicideL3.9Lal [40]
16Dry fodder (output)kg0.44Lal [40]
Note: *1 Equivalent carbon emission of MB plow was considered; *2 Equivalent carbon emission of planting was considered.
The CCE on an area basis (kg CO2-e ha−1) is known as spatial carbon footprints (CFs). To convert the equivalent quantity of carbon dioxide (kg CO2-e ha−1) to equivalent carbon (kg CE ha−1), the former value was divided by 3.66. Total CCE or CFs were estimated by summation of the CCE of all sources used in the present study. Carbon footprint per unit yield (CFy) was calculated using the procedure given by Lal et al. [36]. Carbon indices such as total carbon output, net carbon gain, carbon efficiency, and carbon sustainability index were calculated per the standard procedures [40,48]. All carbon emission/consumption (source-wise and operation-wise) and carbon indices were calculated under different varieties and nutrient management practices.
CFy   ( kg   CO 2 - e   Mg 1 ) = CFs   ( kg   CO 2 - e   ha 1 ) Dry   fodder   yield   ( Mg   ha 1 )  
Net   Carbon   Gain   ( kg   CE   ha 1 ) = Carbon   output   ( kg   CE   ha 1 )   Carbon   input   ( kg   CE   ha 1 )  
Carbon   Efficiency = Carbon   output   ( kg   CE   ha 1 ) Carbon   input   ( kg   CE   ha - 1 )  
Carbon   Sustainability   Index   ( CSI ) = Net   carbon   gain   ( kg   CE   ha 1 ) Carbon   input   ( kg   CE   ha 1 )  

2.5. Statistical Analyses

Experimental data were subjected to analysis with the help of the analysis of variance (ANOVA) technique for a split-plot design using statistical analysis system (SAS 9.1) software on the ICAR-Indian Agricultural Statistics Research Institute (IASRI) server. To test significant differences among treatment means for various parameters, a least significant difference (LSD) at a 0.05 probability level was computed.

3. Results

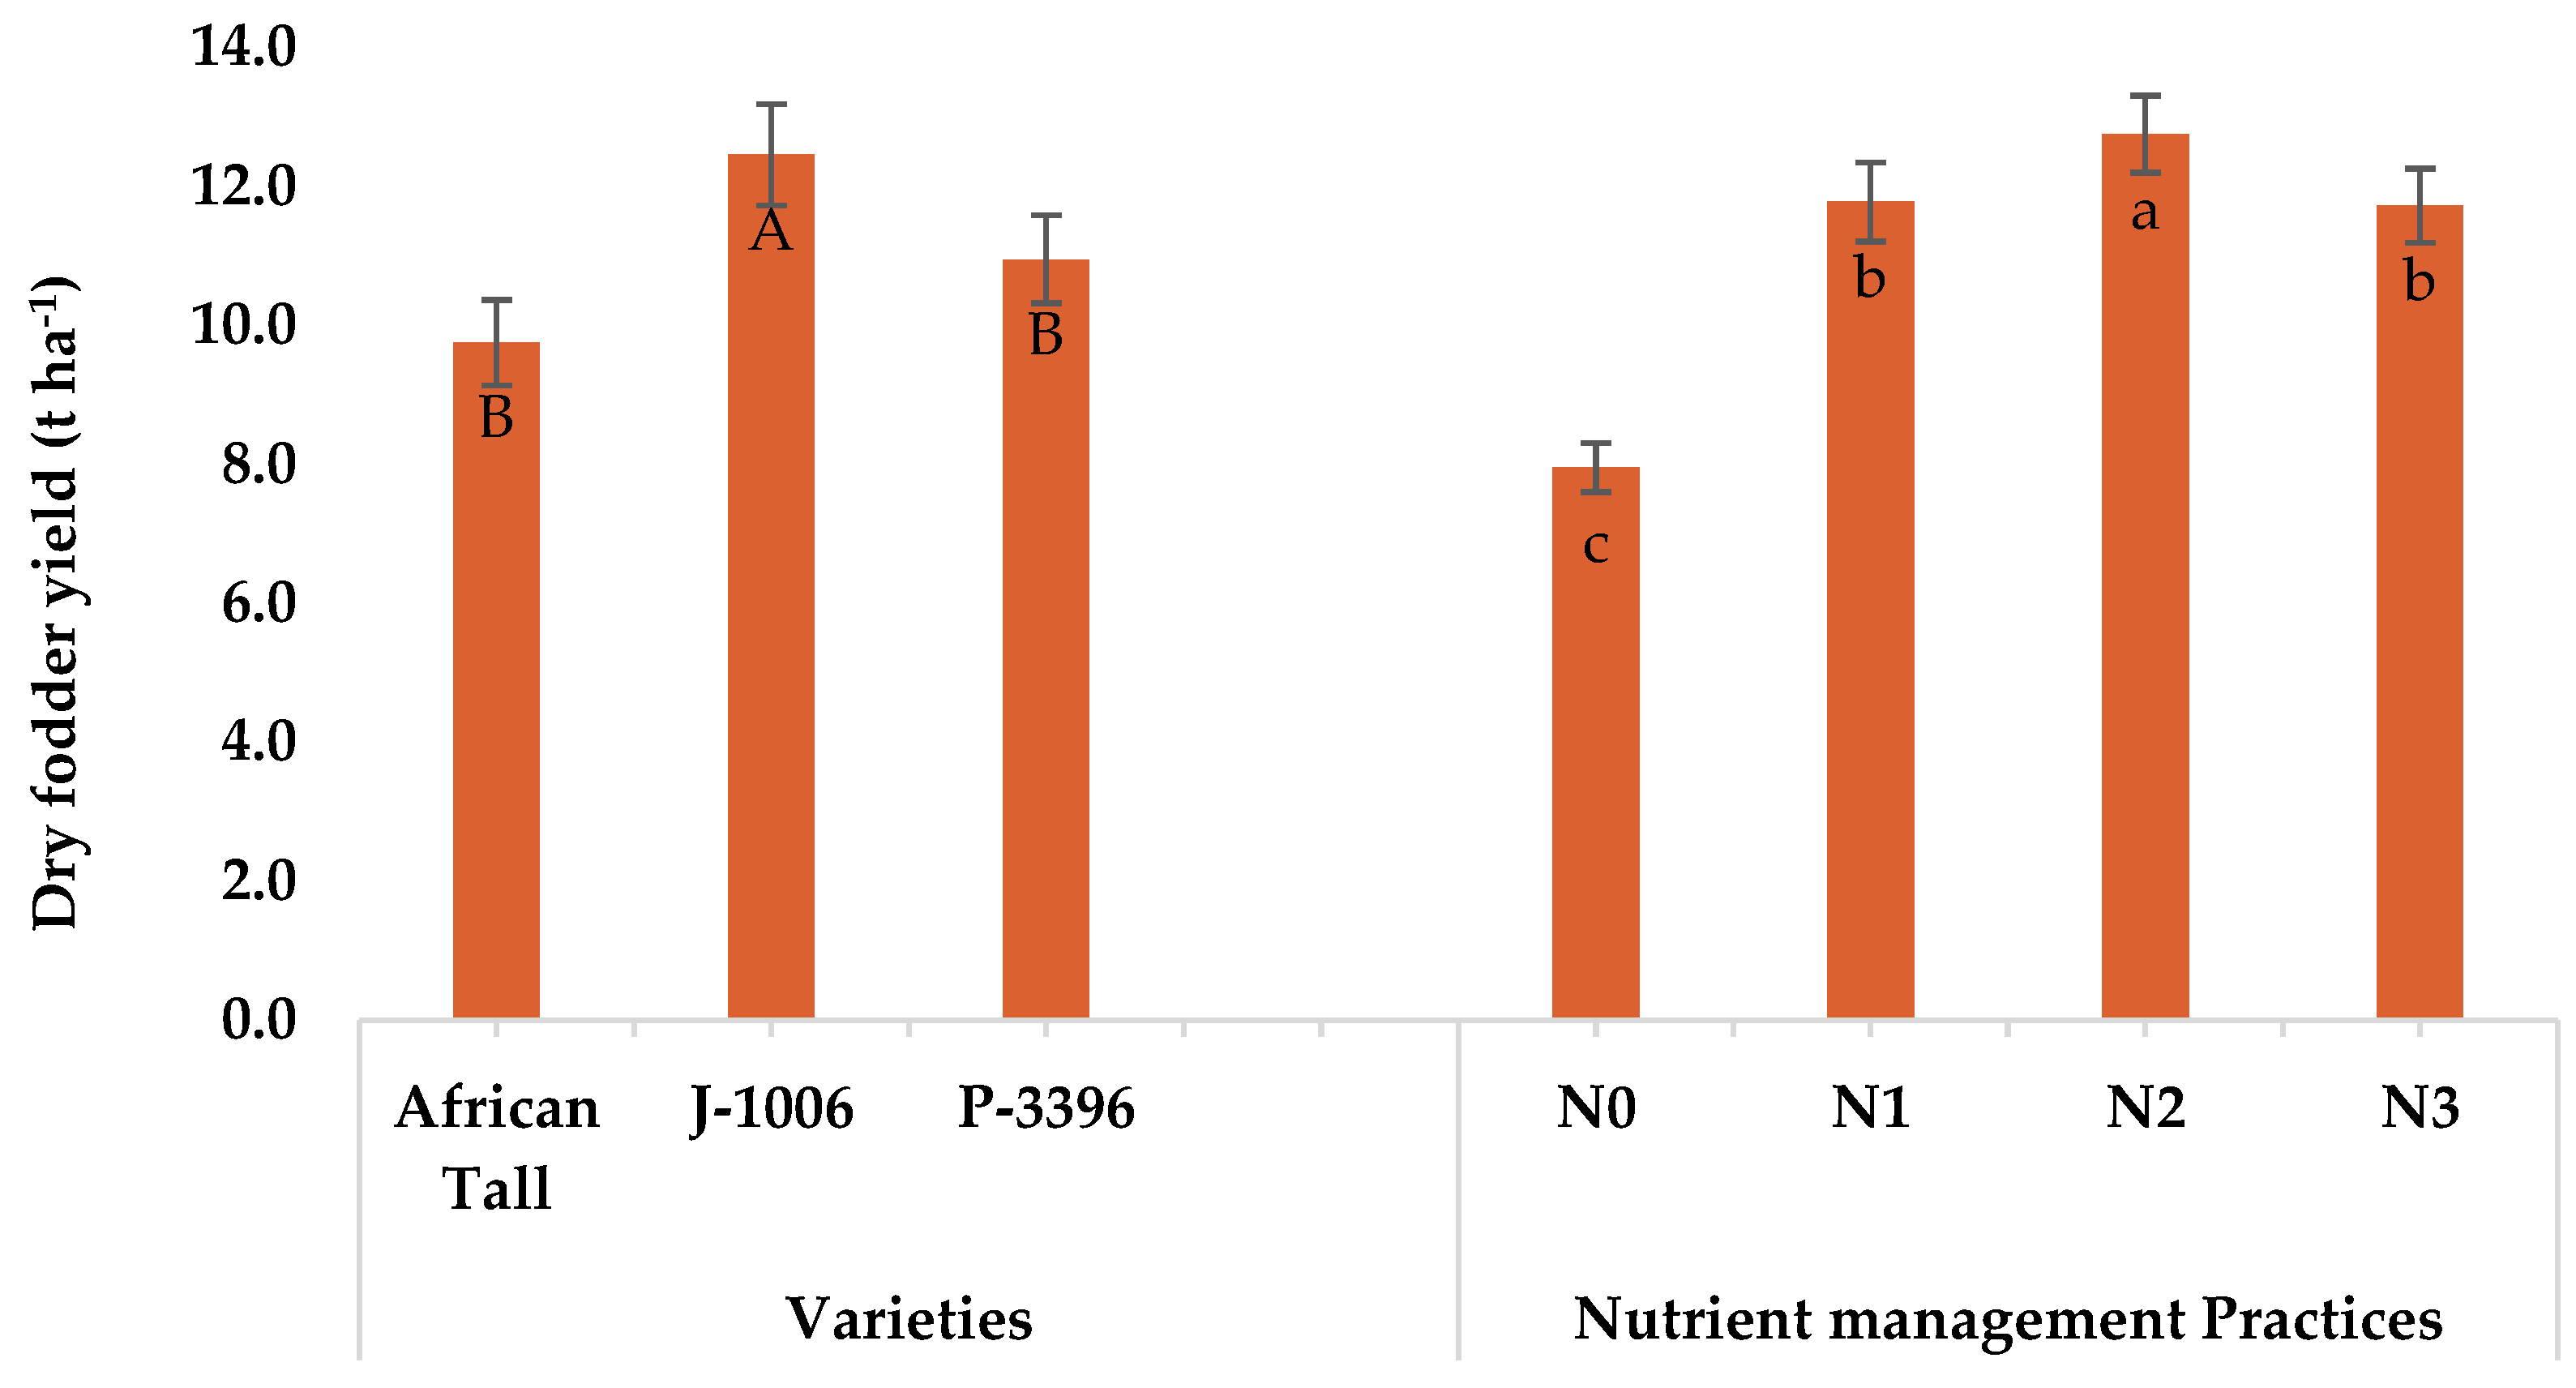
3.1. Dry Fodder Yield

Dry plant biomass is an important component for estimating energy and carbon footprints. Crop varieties and nutrient management practices significantly affected the dry fodder yield of maize (Figure 1). Variety J-1006 recorded significantly higher dry fodder yield over P-3396 and African Tall. This variety showed 27.7 and 13.7% yield improvements over African Tall and P-3396, respectively. Among nutrient management practices, the application of 75% RDF + PGPR + Panchagavya spray outperformed and recorded 60.4, 8.3, and 8.8% dry fodder yield over N0, N1, and N3, respectively.

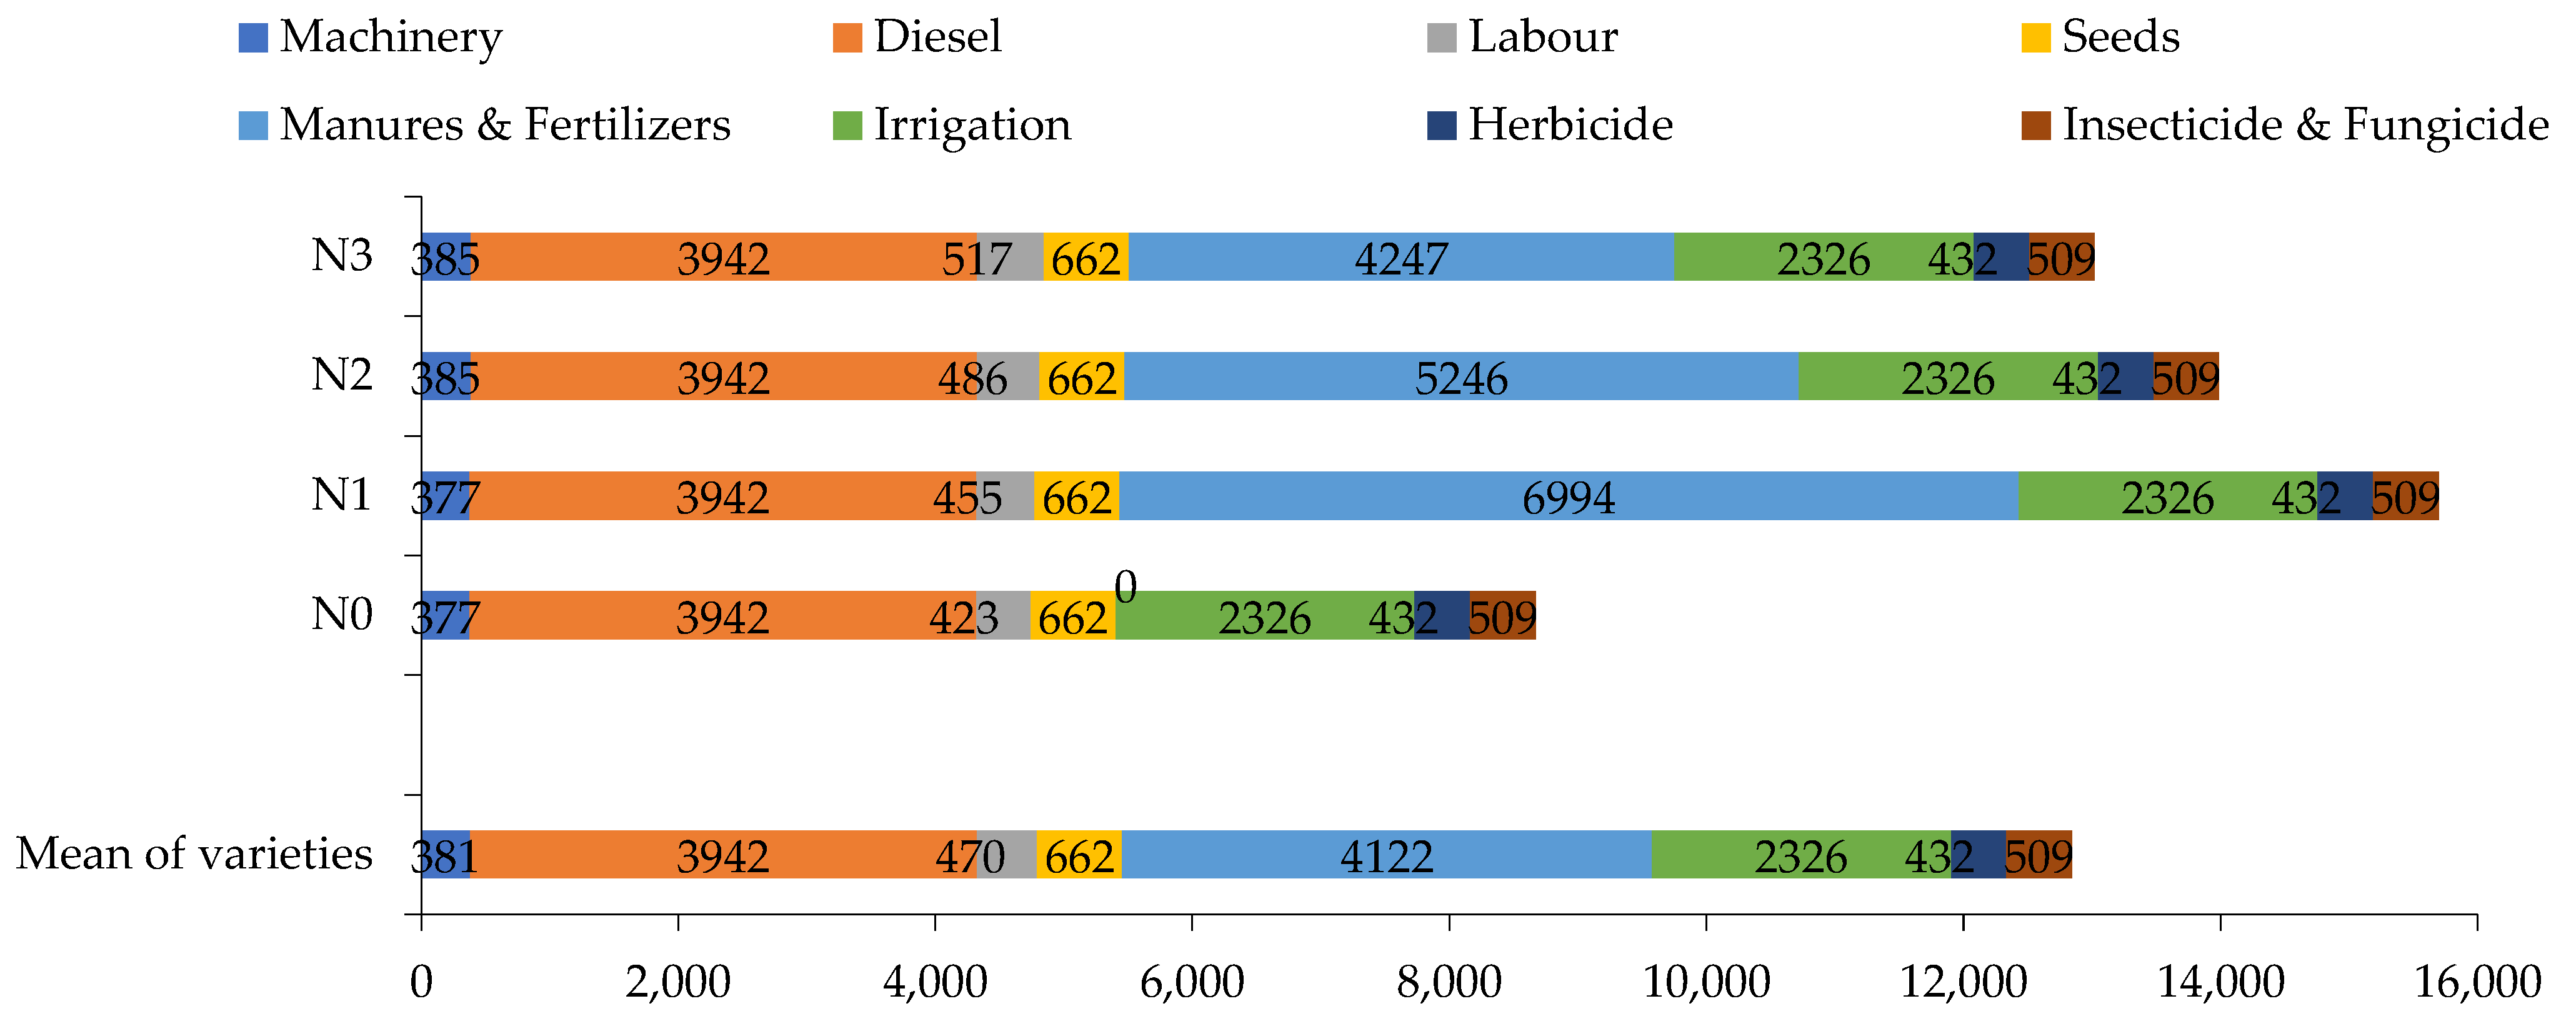
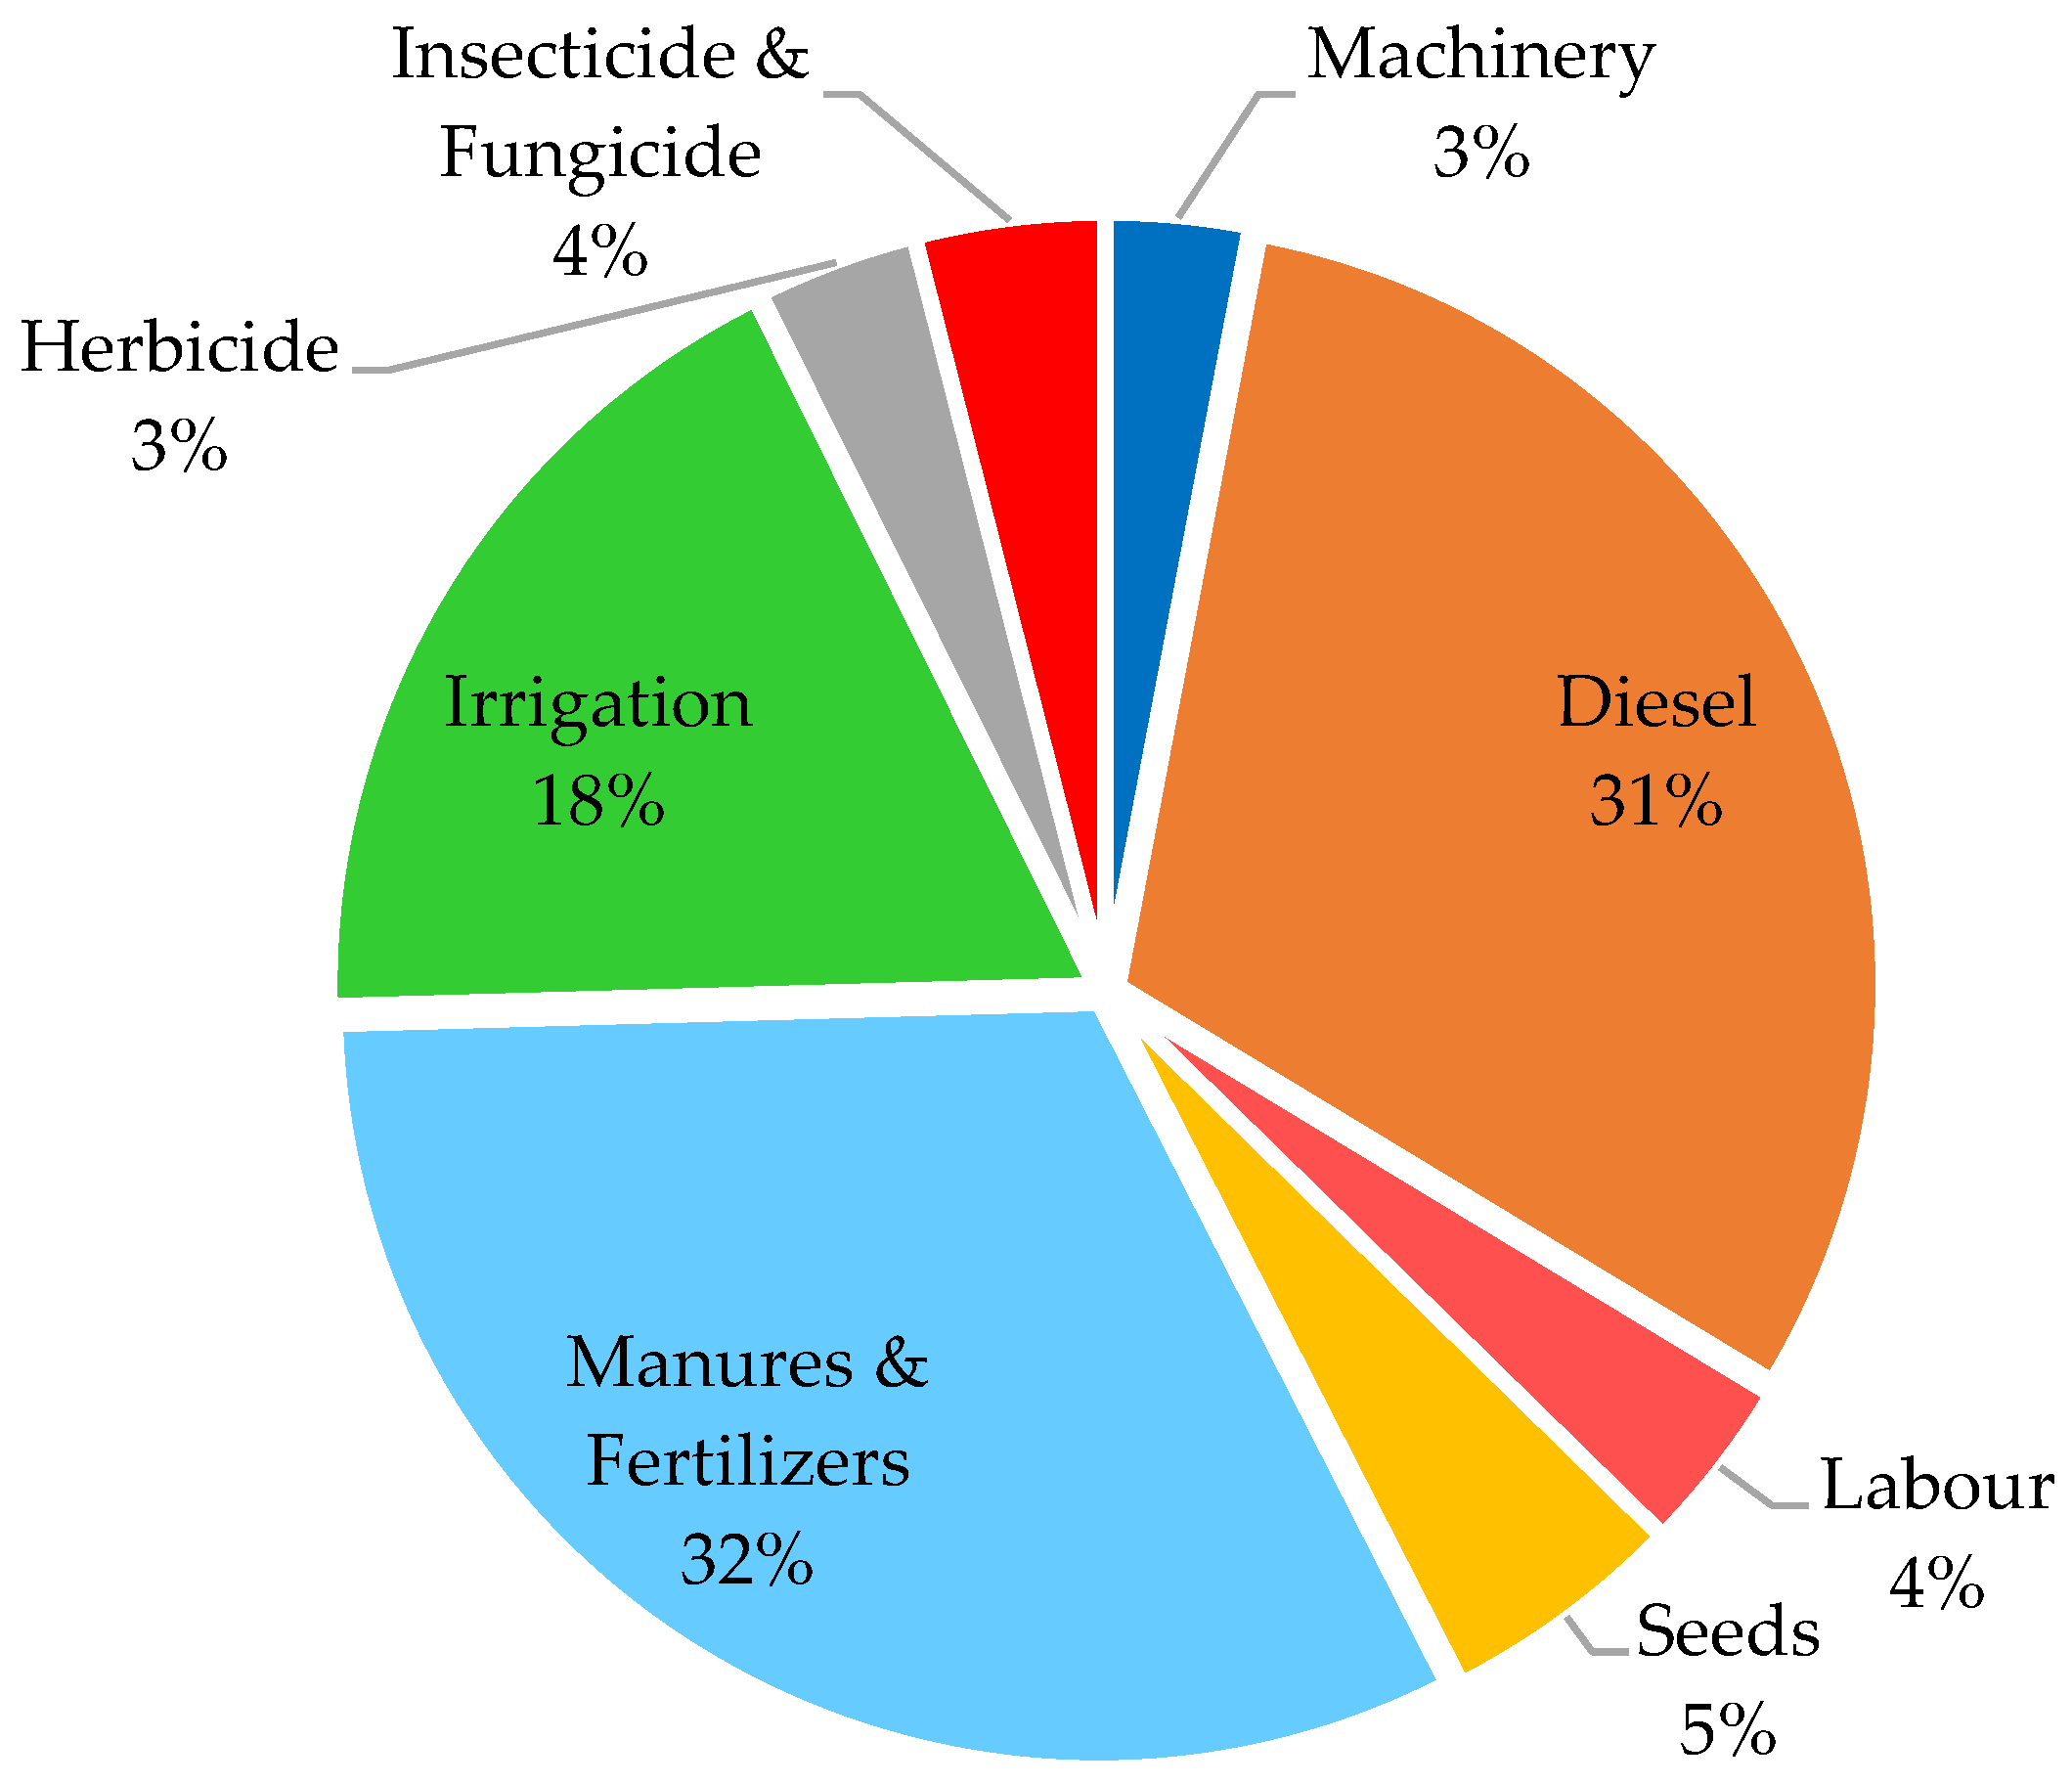
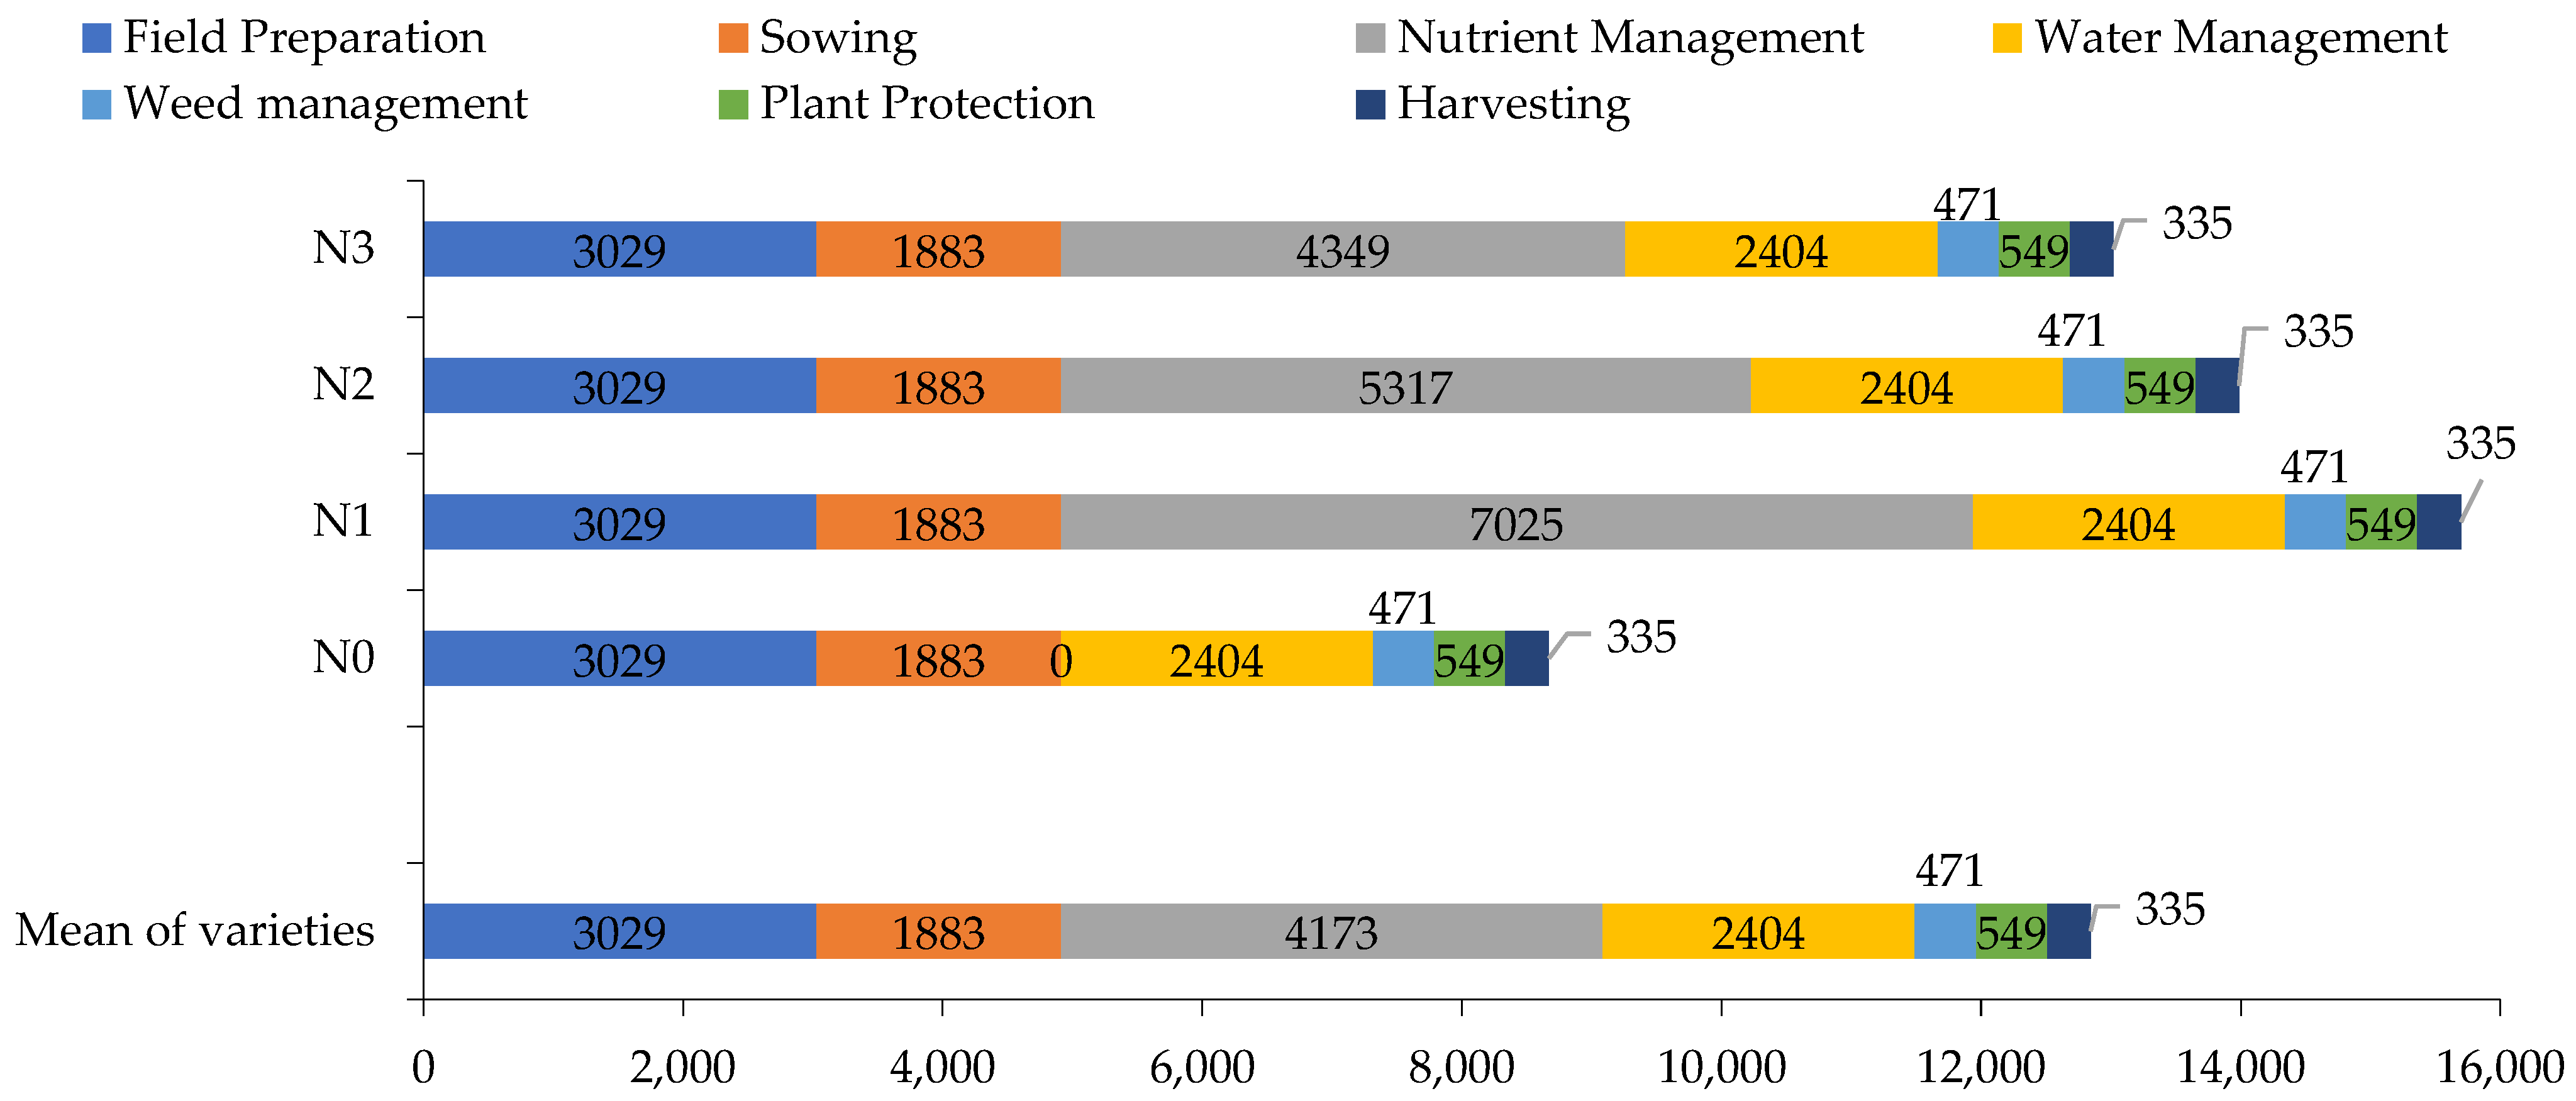
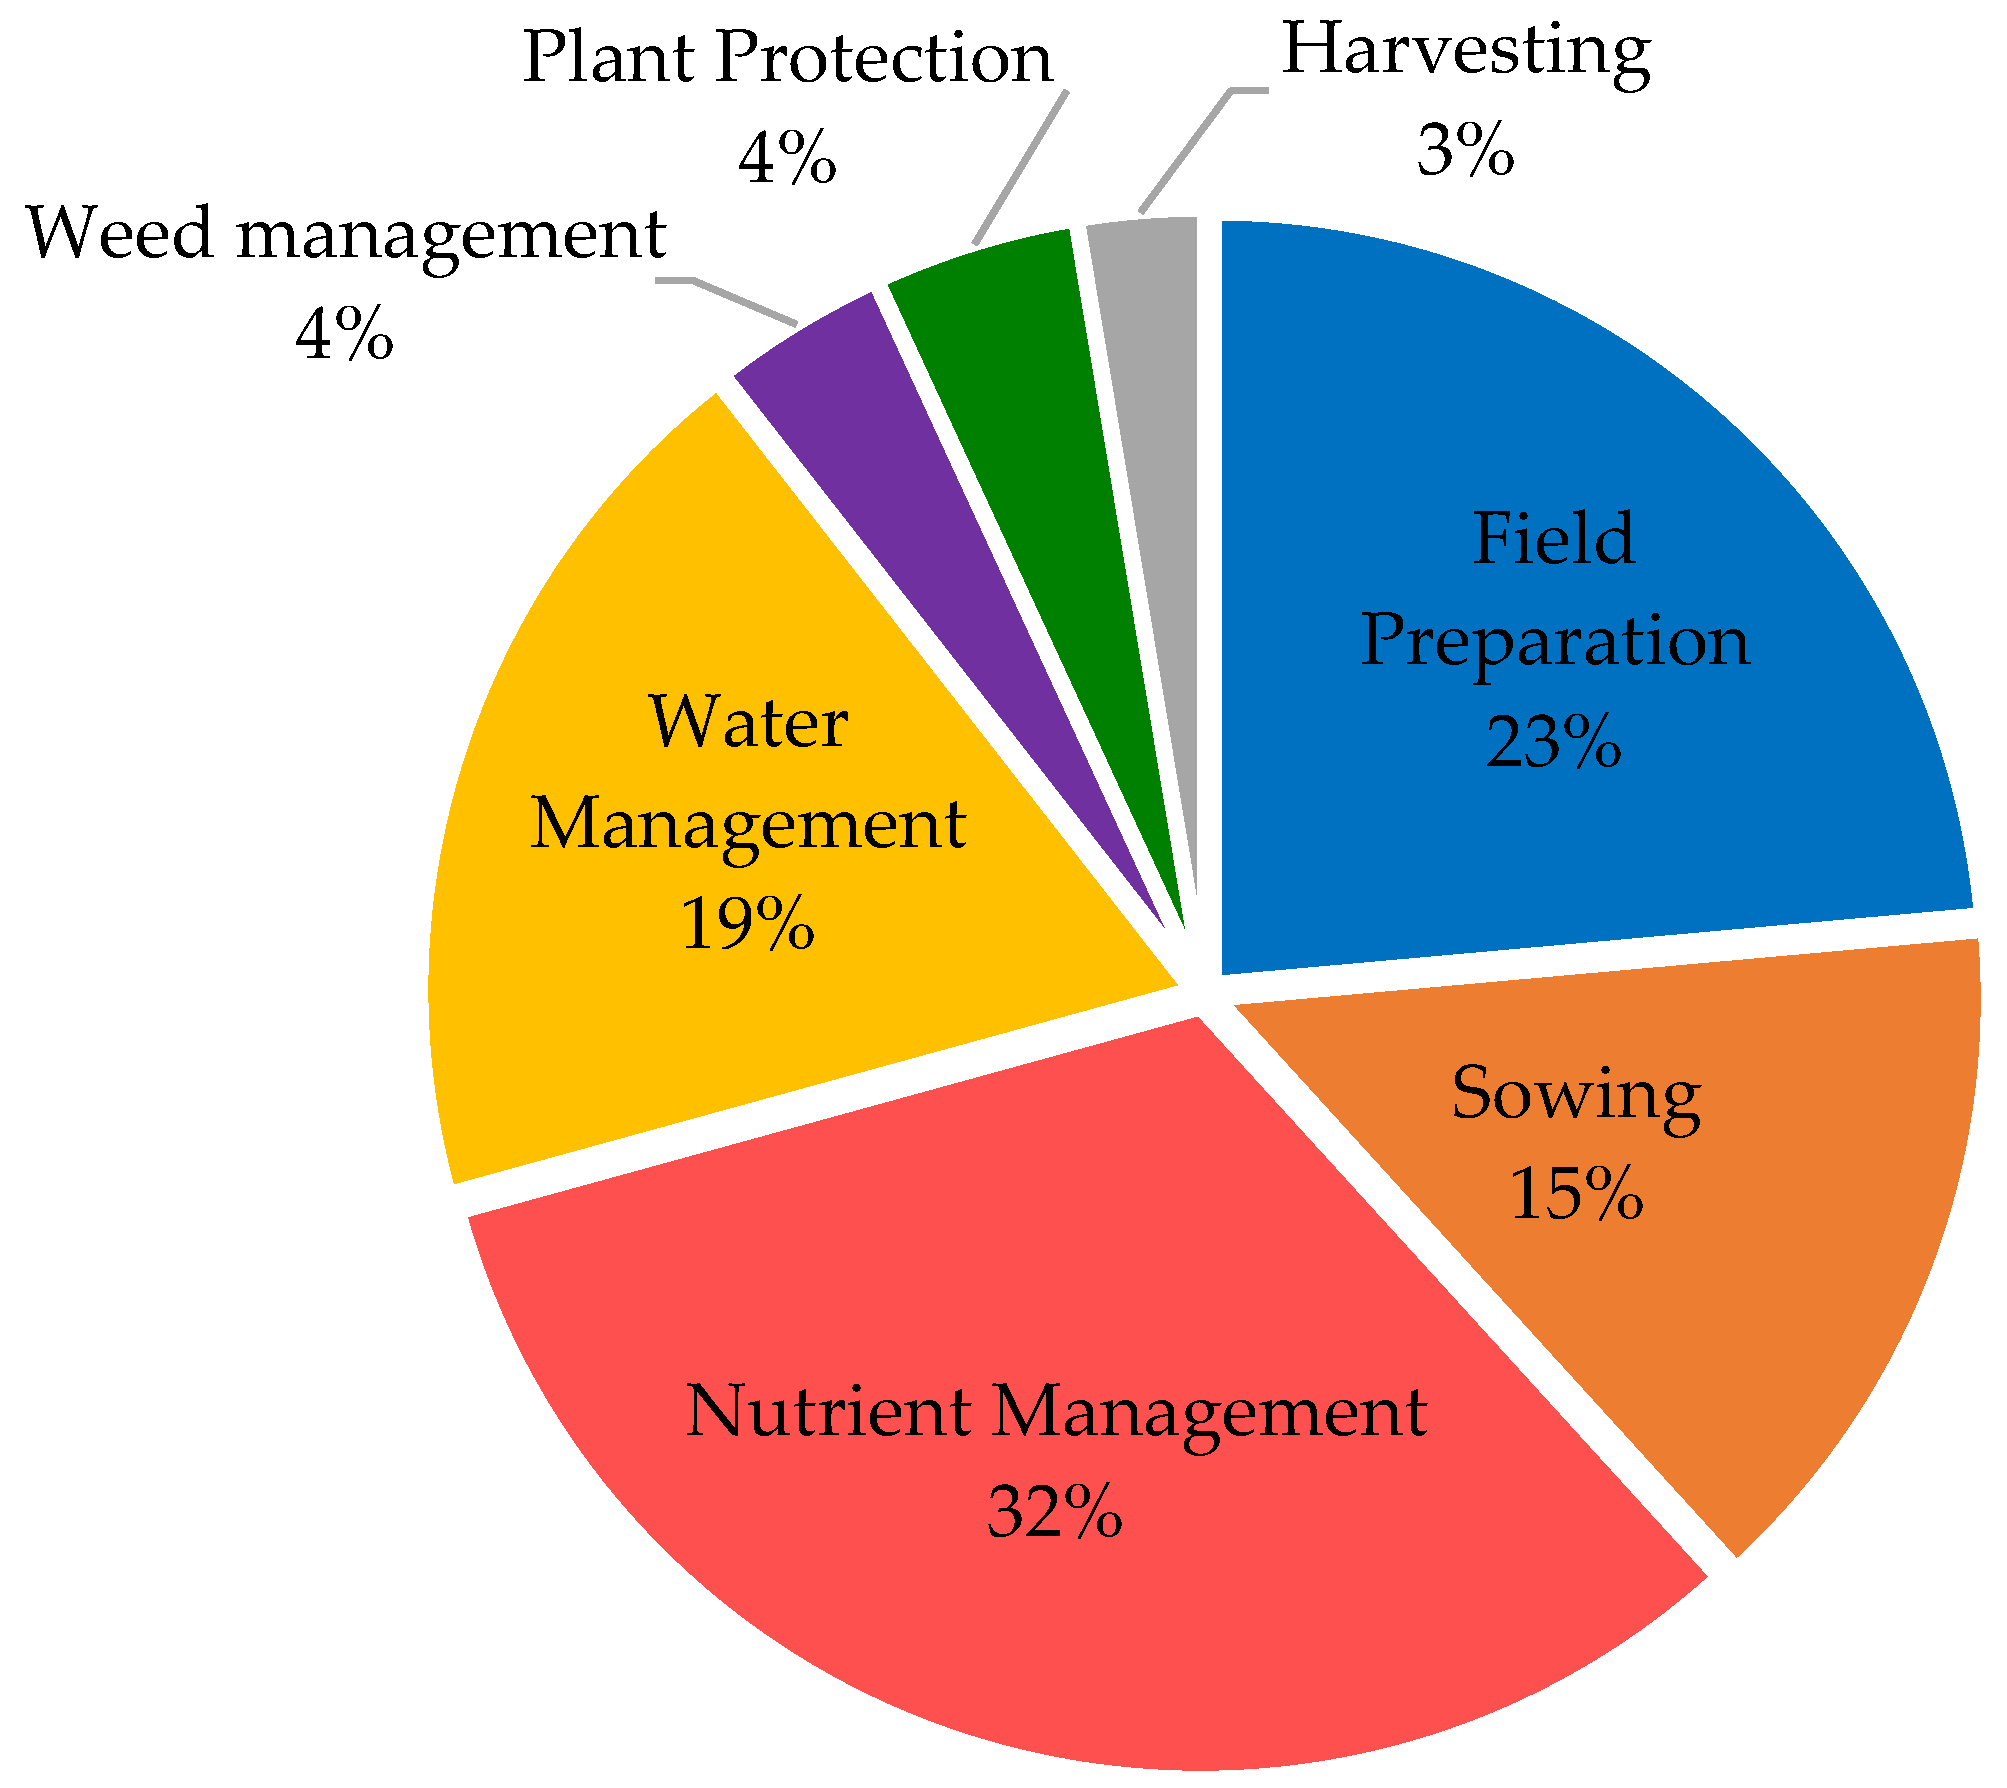
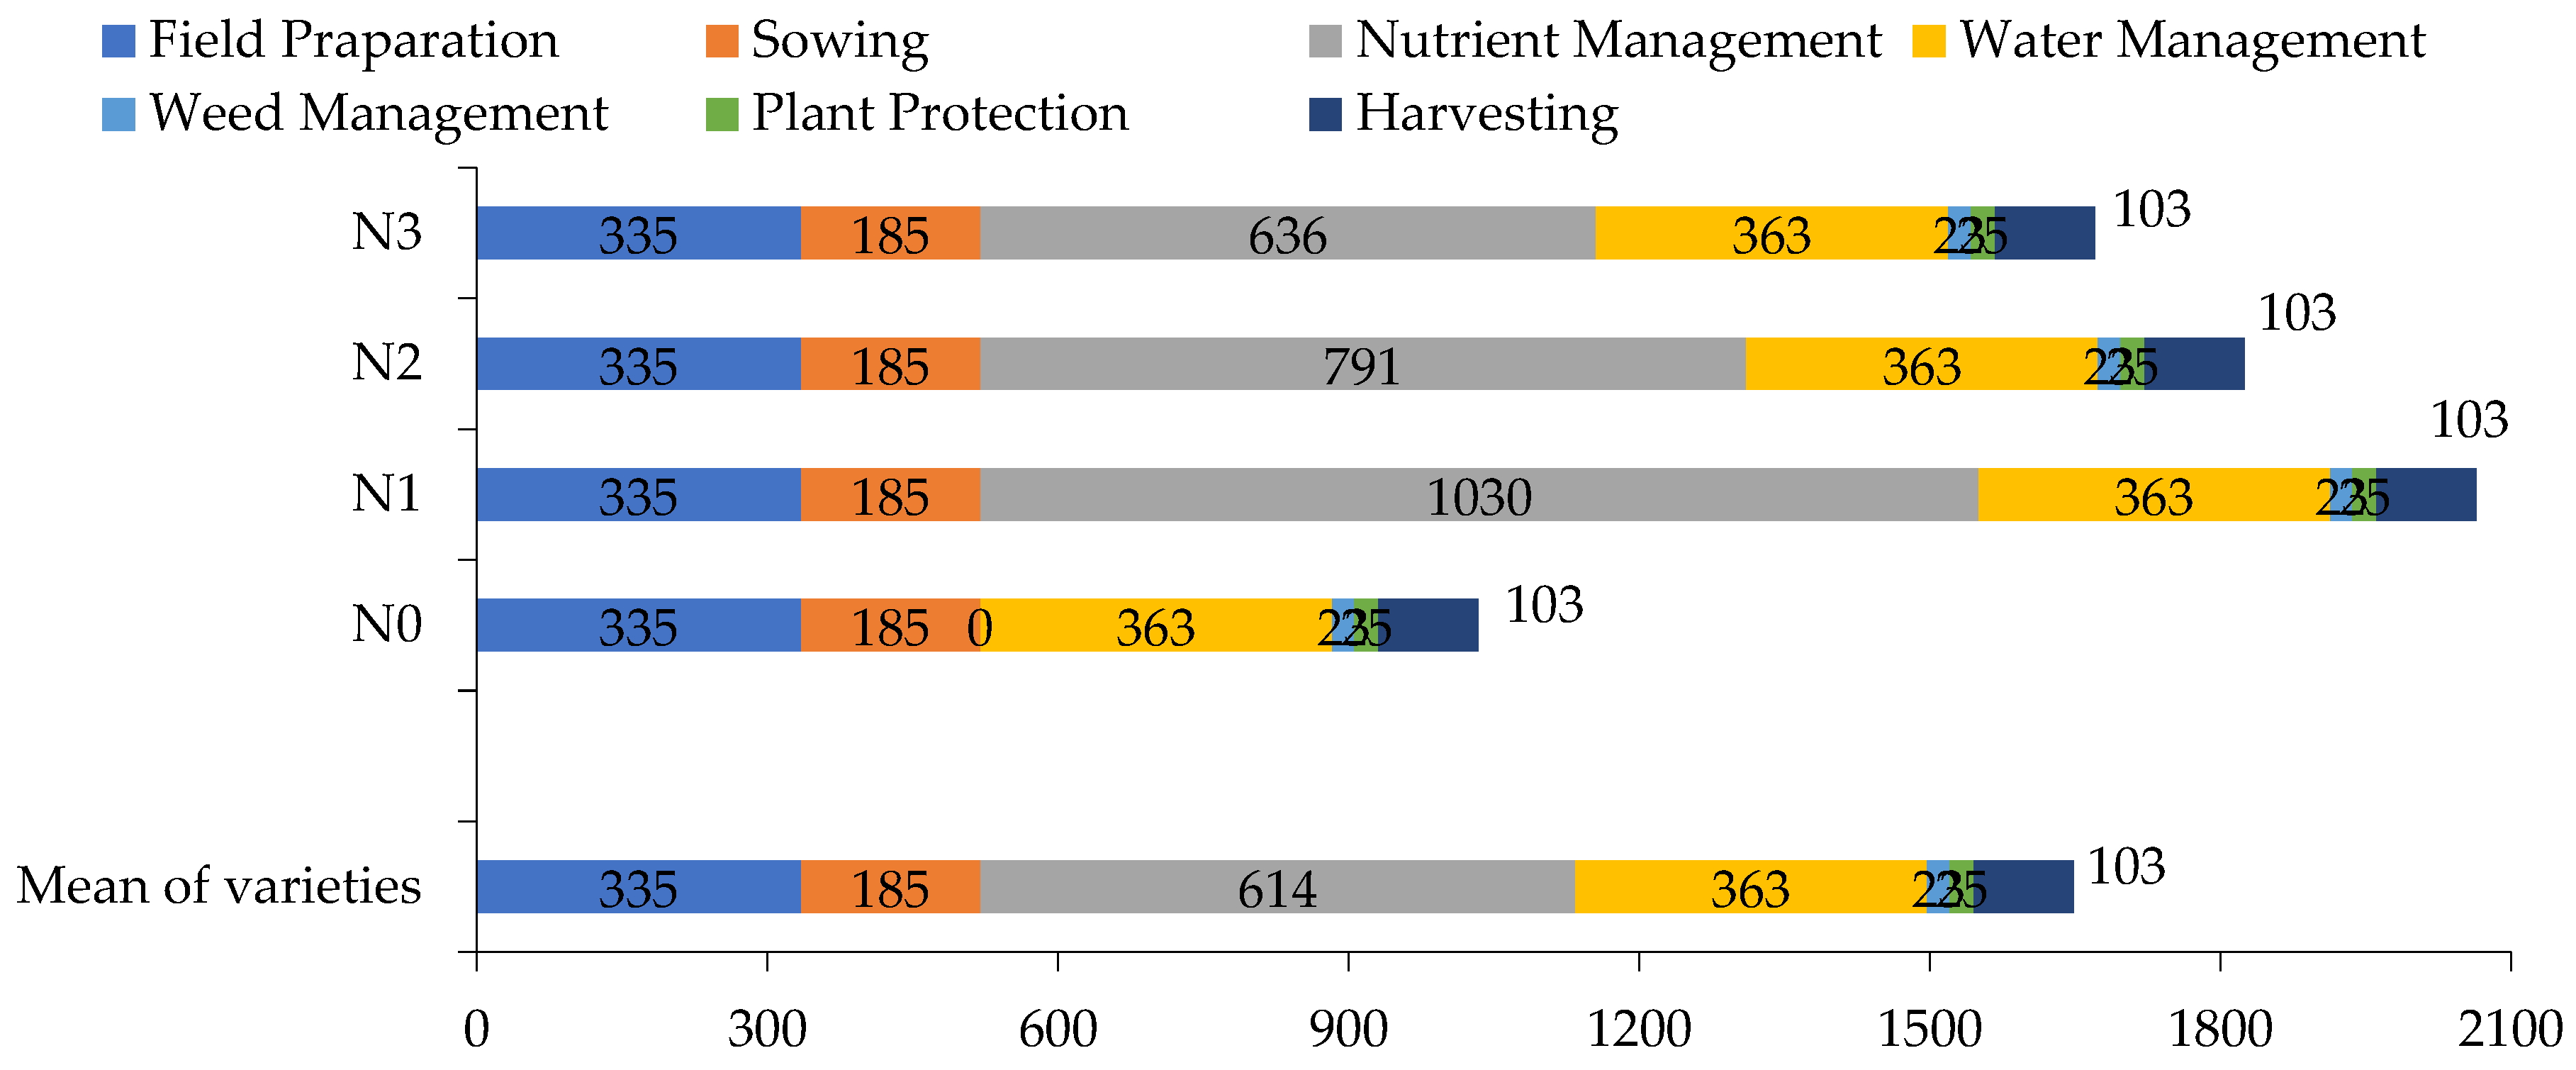
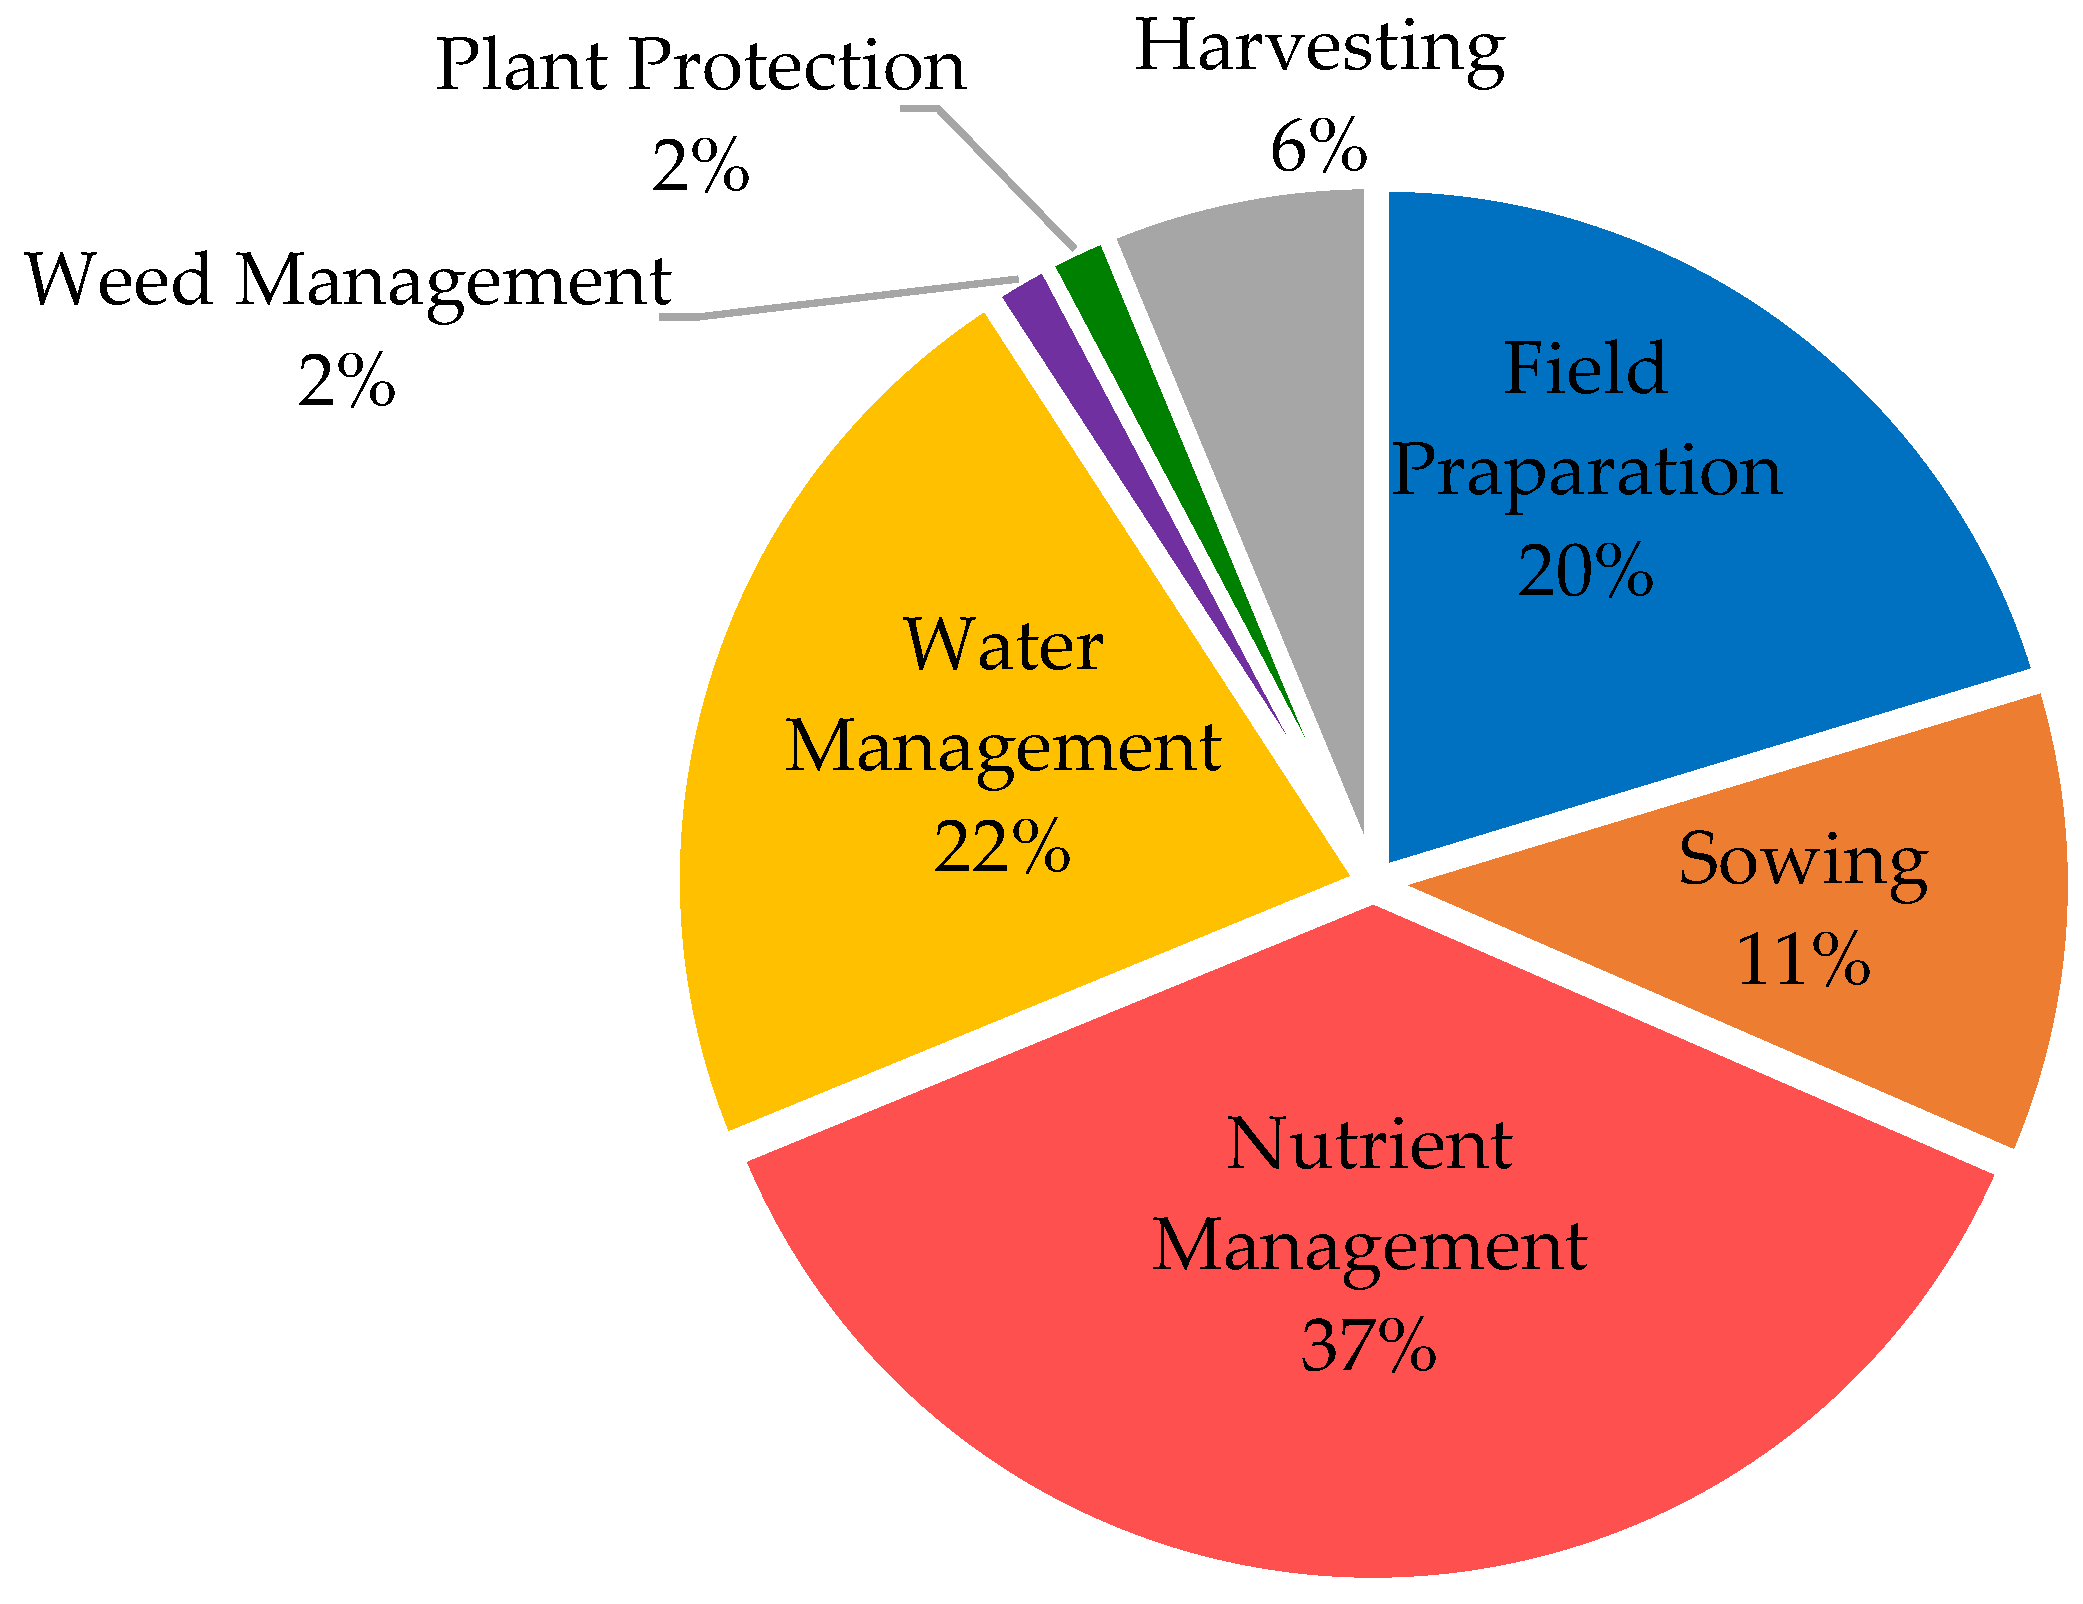
3.2. Source-Wise and Operation-Wise Energy Inputs and Their Percentage Share
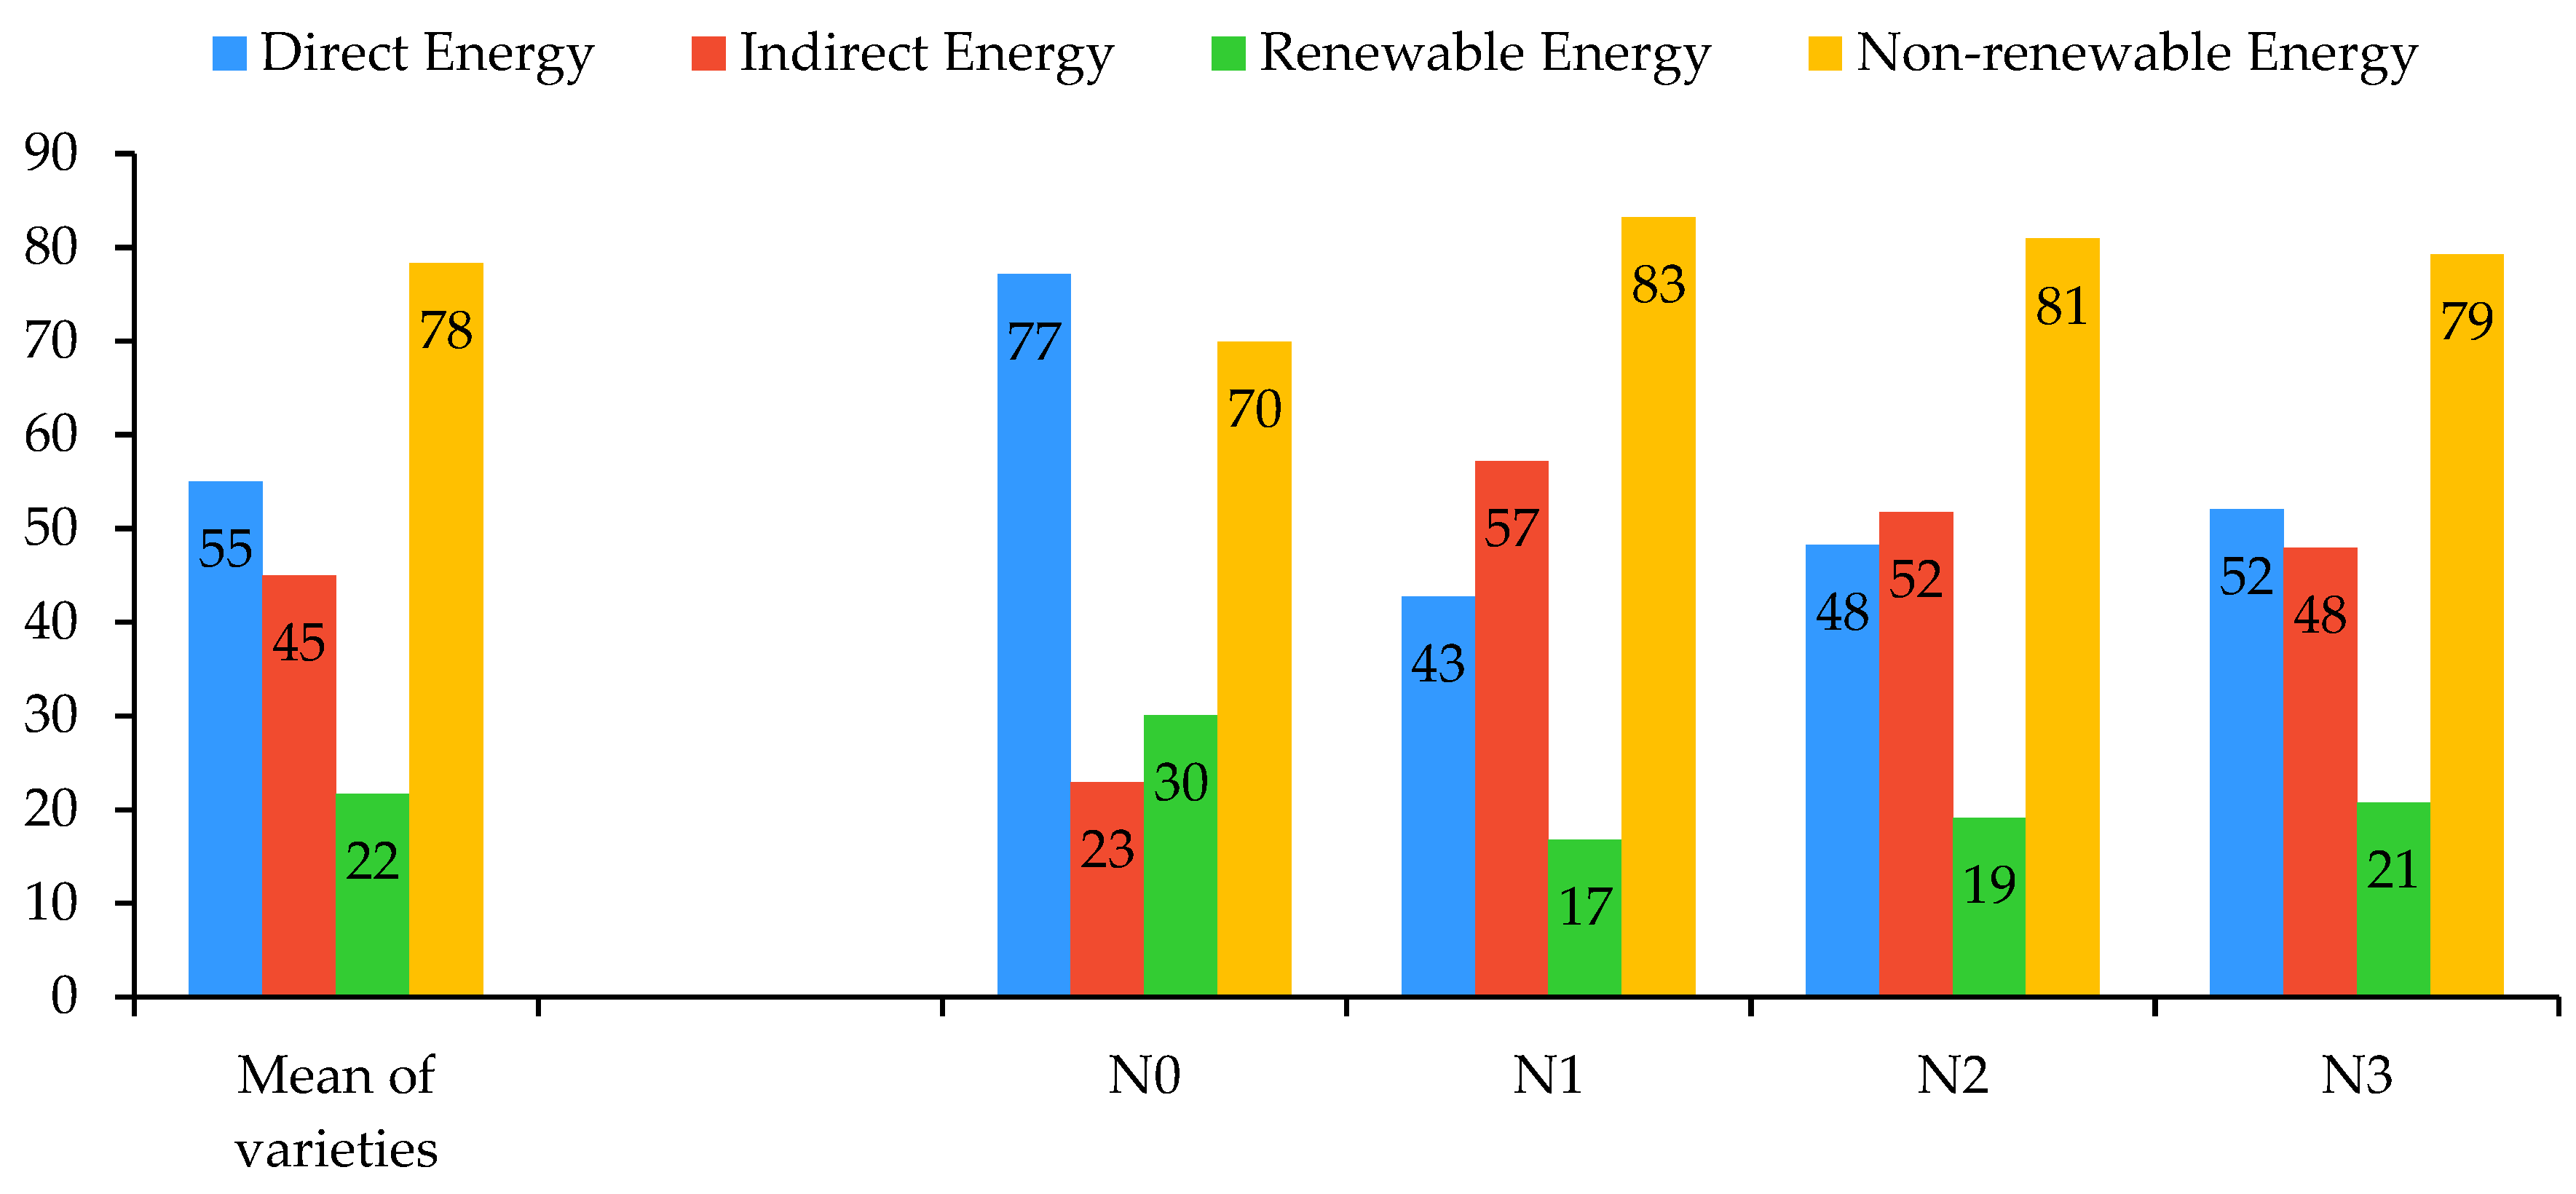
Understanding the energy consumption pattern for various inputs is essential to optimize the energy demand in the agriculture system through proper management practices. The source-wise and operation-wise energy use patterns for nutrient management practices and varieties have been computed (Figure 2, Figure 3, Figure 4 and Figure 5). The input energy required for cultivating all three maize varieties was similar to the type and quantity of inputs used for each variety. Thus, the energy consumption of varieties or the mean of varieties can be considered as a general energy consumption pattern or input energy for fodder maize. The FYM and fertilizers consumed the maximum energy (4122 MJ ha−1), while the least energy was required for machinery (381 MJ ha−1). Source-wise energy use pattern for maize was in the following order: FYM and fertilizers (4122 MJ ha−1) > diesel (3942 MJ ha−1) > irrigation water (2326 MJ ha−1) > seeds (662 MJ ha−1) > insecticides and fungicides (509 MJ ha−1) > human labor (470 MJ ha−1) > herbicides (432 MJ ha−1) > machinery (381 MJ ha−1). In the case of nutrient management practices, the energy inputs were different for each nutrient management practice. The highest energy inputs required for FYM and fertilizers sources ranged from 4247 to 6994 MJ ha−1 (N3 to N1), while zero energy consumption was noted under absolute control (N0). Source-wise mean share of inputs energy (Figure 3) indicates that manures and fertilizers accounted maximum share (32%) of total input energy, followed by diesel (31%) and irrigation (18%). However, machinery, herbicides, insecticides, and fungicides accounted for ≤4% in this study.
Operation-wise input energy estimation gives an idea about energy being consumed under various management practices. Similar to source-wise energy consumption, the operation-wise consumption was similar for all three varieties (Figure 4). Among all operations, nutrient management consumed the maximum energy, followed by field preparation and water management. The order of energy consumption was: nutrient management (4173 MJ ha−1) > field preparation (3029 MJ ha−1) > water management (2404 MJ ha−1) > sowing (1883 MJ ha−1) > plant protection (549 MJ ha−1) > weed management (471 MJ ha−1) > harvesting (335 MJ ha−1). In nutrient management practices, the highest energy consumption was found in nutrient management and ranged from 4349 to 7025 MJ ha−1. It indicates how nutrient management is important for fodder maize. Figure 5 indicates the operation-wise mean share of inputs energy. Nutrient management accounted for the maximum share (32%), followed by field preparation (23%), water management (19%), and sowing (15%). Nevertheless, the contribution of harvesting, plant protection, and weed management was ≤4% in this study.

3.3. Energy Sources

Energy is broadly classified into two groups based on their release patterns (direct and indirect energy) and resources (renewable and non-renewable energy). All the sources of energy (direct, indirect, renewable, and non-renewable energy) remained similar for all three varieties as identical resources were used to grow these varieties (Figure 6). In the present study, direct energy accounted for 55% of total energy, while indirect energy contributed only 45%. Similarly, renewable energy contributed only 22% of total energy inputs, while non-renewable energy accounted for a major share (78%). However, the scenarios for the contributions of energy sources were quite different for nutrient management practices. The contribution of direct and indirect energy sources ranged from 43 to 77% and 23 to 57% among nutrient management treatments (N0 to N3). With increasing the share of organic nutrients in the total nutrient application (N1 to N3), the direct source contribution was increasing, and results were reversed for indirect sources. Similarly, renewable and non-renewable energy sources accounted for 17–30% and 70–83%, respectively. Similar to direct and indirect energy sources, the renewable energy contribution was increasing with organic nutrient management compared with 100% RDF through chemical fertilizers, and a reverse trend was noticed for non-renewable energy sources.

3.4. Total Energy Input, Output, and Energy Indices

The total energy input, energy output, and various energy indices determined using dry fodder yield are presented in Table 4. Similar to the energy sources, the total energy input utilization was similar for all the varieties (12,844 MJ ha−1). However, the nutrient management practices showed varied total energy input utilization. Total energy input varied from 8617 MJ ha−1 under control to 15,696 MJ ha−1 under 100% RDF. Application of 100% RDF consumed around 81.0, 12.2, and 20.6% more energy compared to N0, N2, and N3, respectively. Application of 75% RDF + PGPR + Panchagavya spray and 50% RDF + 25% FYM + PGPR + Panchagavya spray reduced the total energy input utilization by 10.9 and 17.0%, respectively, over 100% RDF through chemical fertilizers. Nonetheless, total energy output was significantly varied with varieties and nutrient management practices (Table 4). The variety J-1006 was superior in terms of total energy output and recorded 27.7 and 13.7% higher values over African Tall and P-3396, respectively. In nutrient management, a significantly higher total energy output was recorded with 75% RDF + PGPR + Panchagavya spray compared to the rest of the treatments. Further results revealed that 100% RDF and 50% RDF + 25% FYM + PGPR + Panchagavya spray were statistically at par, and both showed higher total energy output than the control (N0). Compared to N1 and N3 practices, the application of 75% RDF + PGPR + Panchagavya spray practice enhanced the total energy output by 8.3 and 8.8%, respectively.
Energy indices, such as net energy, energy use efficiency, energy productivity, energy profitability, and specific energy, significantly differed with varieties and nutrient management practices (Table 4). Significantly higher net energy, energy use efficiency, energy productivity, and energy profitability were registered with the J-1006 variety compared to African Tall and P-3396. However, the latter two varieties were statistically similar with respect to net energy, energy use efficiency, energy productivity, and energy profitability. Variety J-1006 resulted in 29.9 and 14.7% higher net energy, 27.3 and 13.5% higher energy use efficiency, 27.3 and 14.0% higher energy productivity, and 29.4 and 14.4% higher energy profitability over African Tall and P-3396, respectively. In contrast to these indices, the specific energy was significantly lower J-1006 compared to African Tall. However, the P-3396 variety was statistically at par with J-1006 as well as African Tall. In the case of nutrient management practices, the highest net energy was recorded under 75% RDF + PGPR + Panchagavya spray treatment (215,482 MJ ha−1) among all nutrient treatments. However, 100% RDF and 50% RDF + 25% FYM + PGPR + Panchagavya sprays were statistically at par, and both showed higher net energy than the control. Compared with 50% RDF + 25% FYM + PGPR + Panchagavya spray, the application of 75% RDF + PGPR + Panchagavya spraying practice enhanced the net energy by 9.8 and 8.9%, respectively.
With respect to energy use efficiency, energy productivity, and energy profitability, the values ranged between 13.51 to 16.59, 0.75 to 0.92 kg MJ−1, and 12.51 to 15.59, respectively. Compared to the control, 75% RDF + PGPR + Panchagavya spray and 50% RDF + 25% FYM + PGPR + Panchagavya spray were statistically at par with each other and registered significantly higher values of these indices over 100% RDF. Application of 75% RDF + PGPR + Panchagavya spray and 50% RDF + 25% FYM + PGPR + Panchagavya spray were identified as the best energy-efficient nutrient management practices as they showed 21.5 and 20.0% higher energy use efficiency, 21.5 and 20.0% higher energy productivity, and 23.2 and 21.6% higher energy profitability over 100% RDF through chemical fertilizers, respectively. However, the converse trend was noticed for specific energy. The specific energy ranged from 1.11 to 1.36 MJ kg−1. Application of 75% RDF + PGPR + Panchagavya spray and 50% RDF + 25% FYM + PGPR + Panchagavya spray showed significantly lower specific energy of 18.0 and 16.7%, respectively, compared to 100% RDF.

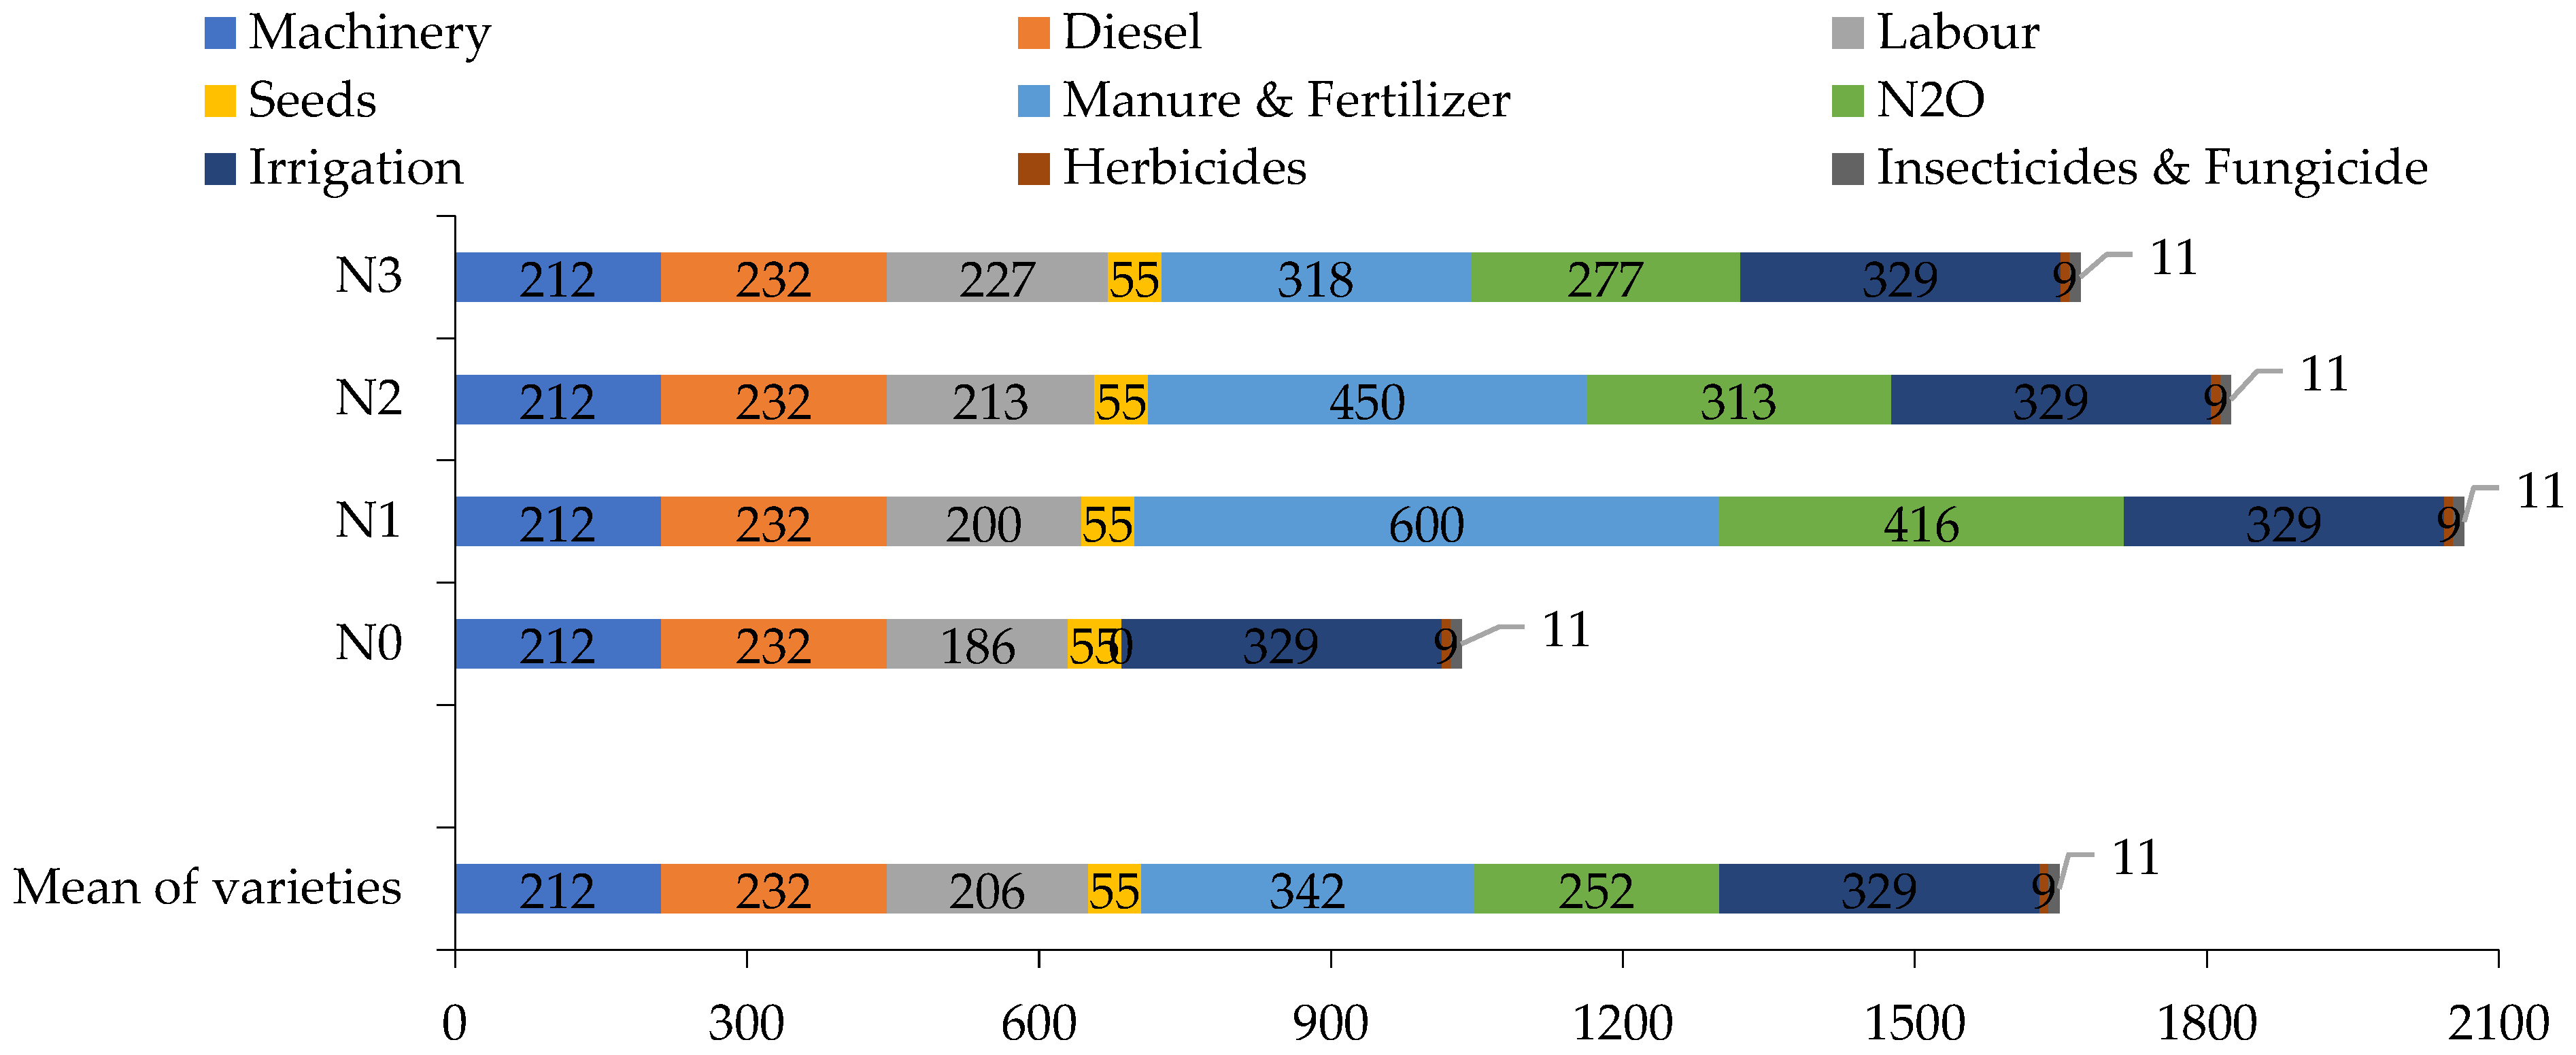
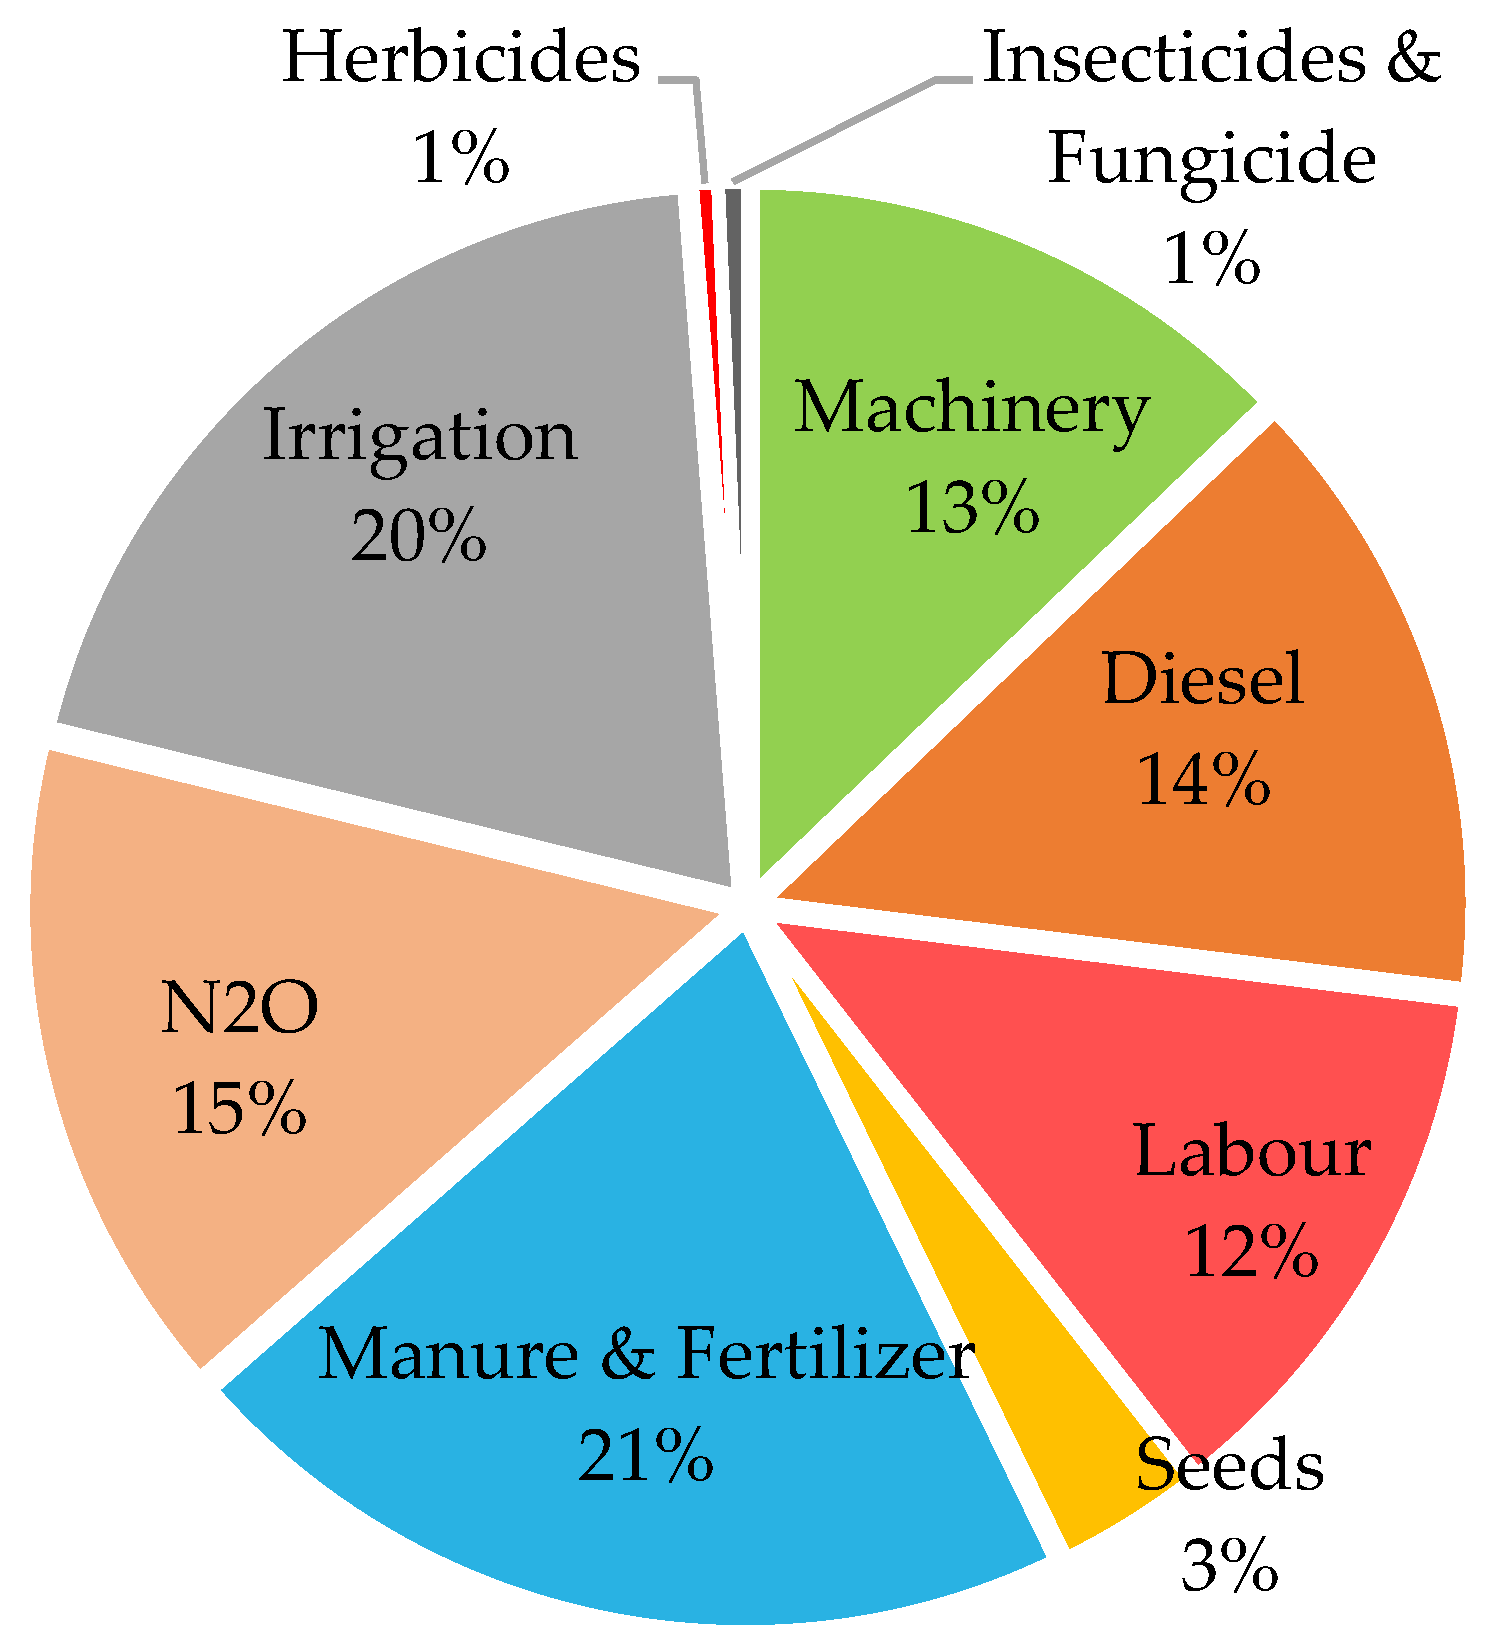
3.5. Source-Wise and Operation-Wise Carbon Inputs and Their Percentage Share

To get an idea of the consumption of carbon by various sources and operations carried out in the cultivation of fodder maize and reduce the carbon emission by efficient crop management practices, the source-wise and operation-wise equivalent carbon emissions were computed and depicted in Figure 7, Figure 8, Figure 9 and Figure 10. The equivalent carbon emissions from the cultivation of all three maize varieties were similar as the type and quantity of inputs used for each variety were the same. Therefore, the mean of the varieties can be considered as the general equivalent carbon emission for fodder maize. The source-wise equivalent carbon emission pattern for fodder maize was in the following order: FYM and fertilizers (342 kg CO2-e ha−1) > irrigation (329 kg CO2-e ha−1) > N2O (252 kg CO2-e ha−1) > diesel (232 kg CO2-e ha−1) > machinery (212 kg CO2-e ha−1) > human labor (206 kg CO2-e ha−1) > seeds (55 kg CO2-e ha−1) > insecticides and fungicides (11 kg CO2-e ha−1) > herbicides (9 kg CO2-e ha−1). In the case of nutrient management practices, the equivalent carbon emission from labor, manure and fertilizer, and N2O was different for each nutrient management practice. Application of 100% RDF was registered with the highest equivalent carbon emission for manure and fertilizer and N2O, followed by 75% RDF + PGPR + Panchagavya spray and 50% RDF + 25% FYM + PGPR + Panchagavya spray. However, the contrary trend was noted for labor. The source-wise mean share of carbon emission presented in Figure 8 indicates that the contribution of equivalent carbon emission was highest from manure and fertilizer (21%), followed by irrigation (20%), N2O (15%), diesel (14%), machinery (13%) and labor (12%). However, seeds, insecticides and fungicides, and herbicides accounted for ≤3% in this study.
Similar to source-wise, the equivalent carbon emission from operation-wise was also analogous for all three varieties (Figure 9). Amongst all operations, the highest equivalent carbon emission was recorded from the nutrient management operation, while the least value was registered from the weed management. Operation-wise equivalent carbon emission patterns for the cultivation of fodder maize varieties were found in the following order: nutrient management (614 kg CO2-e ha−1) > water management (363 kg CO2-e ha−1) > field preparation (335 kg CO2-e ha−1) > sowing (185 kg CO2-e ha−1) > harvesting (103 kg CO2-e ha−1) > plant protection (25 kg CO2-e ha−1) > weed management (23 kg CO2-e ha−1). In the case of nutrient management treatments, the equivalent carbon emission was varied from 636 to 1030 kg CO2-e ha−1 for nutrient management operation, being the highest value with 100% RDF followed by 75% RDF + PGPR + Panchagavya spray and 50% RDF + 25% FYM + PGPR + Panchagavya spray. However, zero carbon emission was reported from absolute control. Operation-wise mean share of equivalent carbon emission (Figure 10) shows that nutrient management accounted for the maximum share (37%), followed by water management (22%), field preparation (20%), sowing (11%), and harvesting (6%). However, the contribution of plant protection and weed management was ≤2% in the present study.

3.6. Spatial Carbon Footprints, Carbon Input, Output, and Carbon Indices

The spatial carbon footprints (CFs) were determined by summating the equivalent carbon emission of all sources used in the present study (Table 5). The CFs were similar for each variety, as the input type and quantity were the same for the varieties. However, CFs were slightly varied among the nutrient management practices ranging from 1034 kg CO2-e ha−1 under control to 2064 kg CO2-e ha−1 under 100% RDF. Application of 75% RDF + PGPR + Panchagavya spray and 50% RDF + 25% FYM + PGPR + Panchagavya spray emitted 11.6 and 19.1% lesser equivalent carbon compared to 100% RDF. The carbon input in terms of kg CE ha−1 was computed by dividing the CFs (kg CO2-e ha−1) to a value of 3.66. Similar to CFs, the carbon input was similar for all three varieties (450 kg CE ha−1) but varied among nutrient management practices (Table 5). Carbon input differed from 282 kg CE ha−1 under control to 563 kg CE ha−1 under 100% RDF.
The carbon output computed using dry fodder yield is presented in Table 5. Both studied factors (varieties and nutrient management practices) significantly influenced the carbon output. Variety J-1006 resulted in significantly higher carbon output of 27.7 and 13.7% compared to African Tall and P-3396. However, the latter two varieties were statistically non-significant to each other. Comparison among the nutrient management practices revealed that the application of 75% RDF + PGPR + Panchagavya spray reported significantly higher carbon output compared to the rest of the treatments. This shows 8.3 and 8.8% higher carbon output over 100% RDF and 50% RDF + 25% FYM + PGPR + Panchagavya spray, respectively.
To identify the carbon-efficient fodder maize variety and nutrient management practice, the various carbon indices, such as net carbon gain, carbon efficiency, carbon sustainability index, and carbon footprints per unit yield, were determined (Table 5). Comparison among varieties indicates that J-1006 exhibited significantly higher net carbon gain, carbon efficiency, and carbon sustainability index than the rest of the tested varieties. In terms of percentage increment, variety J-1006 recorded 31.0 and 15.2% higher net carbon gain, 27.1 and 13.5% higher carbon efficiency, and 30.2 and 14.8% higher carbon sustainability index compared to African Tall and P-3396, respectively. In contrast to these indices, the carbon footprints per unit yield (Cfy) were significantly lower with the J-1006 variety than African Tall but remained statistically at par with P-3396. Cultivation of J-1006 and P-3396 had a lower Cfy of 22.6 and 11.5% compared to African Tall. In the case of nutrient management practices, a significantly higher net carbon gain was found with the 75% RDF + PGPR + Panchagavya spray compared with other treatments. The use of 75% RDF + PGPR + Panchagavya spray showed 10.7 and 8.7% higher net carbon gain over 100% RDF and 50% RDF + 25% FYM + PGPR + Panchagavya spray, respectively. However, the highest carbon efficiency was noticed under absolute control. Regardless of control, the application of 75% RDF + PGPR + Panchagavya spray and 50% RDF + 25% FYM + PGPR + Panchagavya spray showed higher carbon efficiency of 22.5 and 23.1%, respectively, over 100% RDF. Similar to carbon efficiency, the trend for the carbon sustainability index was also noticed among nutrient management practices. Application of 75% RDF + PGPR + Panchagavya spray and 50% RDF + 25% FYM + PGPR + Panchagavya spray enhanced the carbon sustainability index by 25.3 and 25.9%, respectively, compared to 100% RDF. For Cfy, the highest value was noted under 100% RDF. Compared to the absolute control, 75% RDF + PGPR + Panchagavya spray and 50% RDF + 25% FYM + PGPR + Panchagavya spray were remarkably at par with each other and indicated significantly lower Cfy than 100% RDF. Adoption of 75% RDF + PGPR + Panchagavya spray and 50% RDF + 25% FYM + PGPR + Panchagavya spray produced 18.6 and 18.8% lower Cfy compared to 100% RDF.

4. Discussion

4.1. Dry Fodder Yield

Selection of an appropriate crop variety and nutrient management practice is essential for higher fodder productivity. Among the three tested varieties, the cultivation of J-1006 showed significantly higher dry fodder yield over African Tall and P-3396, respectively (Figure 1). Significant variations among different varieties for dry fodder yield could be ascribed to variations in dry matter content and green fodder yield resulting from dissimilarities in the genetic makeup of these varieties and their responses to climatic conditions. Several researchers have also reported the genetic makeup as one of the reasons for significant differences in the dry fodder yield of maize crops [49,50,51]. Crop nutrition plays a key role in plant health and, thereby, its productivity. In our study, significantly higher dry fodder yield was recorded under the integrated use of organic and inorganic nutrient sources (75% RDF + PGPR + Panchagavya spray) compared with the absolute control, 100% RDF through chemical fertilizers and 50% RDF + 25% FYM + PGPR + Panchagavya spray (Figure 1). Significantly higher dry fodder yield with 75% RDF + PGPR + Panchagavya spray could be ascribed to better crop growth, yield, and dry matter content. The integrated use of RDF, which acts as a quick supplier of nutrients and organic sources (such as PGPR, FYM, and Panchagavya), serves as a slow and continuous releaser of nutrients that probably would have supplied the essential nutrients to fodder maize adequately and continuously which resulted into higher biomass yield. Seed inoculation with PGPR induces plant growth through nitrogen fixation, phytohormones, siderophore production, P and K solubilization, etc., which is finally converted into a higher fodder yield [52]. In fodder maize crops, Piromyou et al. [53] also reported on the positive relationship of seed treatment with PGPR on shoot dry weight. In addition to the above, the foliar spray of panchagavya, which contains essential plant nutrients, beneficial microorganisms [25], vitamins [54], and secondary metabolites [55], could be the probable reason for higher fodder yield. Several researchers have also reported the beneficial impact of panchagavya on rice, baby corn, groundnut, fodder cowpea, and fodder oats [56,57,58,59,60,61,62]. Therefore, the integrated use of organic and inorganic nutrient sources is proven to be beneficial for sustainable maize production [14,63,64,65].

4.2. Energy Sources, Inputs, Outputs, and Its Indices

The computation of energy sources is important as it gives the idea of sustainable agricultural production. In recent years, the consumption of indirect and non-renewable energy sources has been increasing for crop production, which may contribute a lot to GHG emissions [11]. For field crops, the use of fertilizers and diesel are the principal non-renewable energy inputs. In the present study (Figure 2 and Figure 3), the application of FYM and fertilizers consumed maximum energy, followed by diesel for the cultivation of fodder maize. Similarly, Mishra et al. [66] and Patel et al. [67] also reported that fertilizers are a major energy consumption input for fodder crops. Therefore, reducing the proportion of fertilizers in total nutrients application to crops may help in enhancing energy efficiency. A crop production system with a higher share of renewable energy is more sustainable on a long-term basis [68]. Therefore, to make an agriculture system more sustainable and resilient, the dependency on non-renewable and indirect energy sources needs to be reduced, and more emphasis should be given to adopting renewable and direct energy sources. Organic nutrient sources such as FYM, PGPR, and panchagavya are renewable sources, and increasing their proportion in total nutrients application and reducing the proportion of chemical fertilizers indicates higher sustainability compared with the application of 100% RDF through chemical fertilizers. In the present study (Figure 6), non-renewable energy sources accounted for 70–83%, while renewable energy accounted for only 17–30%. Li et al. [69] in China and Manoj et al. [11] in India also reported a higher share of non-renewable energy sources than renewable energy for crop production. Comparison among nutrient management practices revealed that application of 75% RDF + PGPR + Panchagavya spray and 50% RDF + 25% FYM + PGPR + Panchagavya spray accounted for a higher share of renewable energy compared with 100% RDF through chemical fertilizers. Total energy input consumption was similar for all the varieties. This is because the similar type and quantity of inputs applied to all three varieties led to similar energy consumption. Yadav et al. [9] also reported similar energy inputs for five barley cultivars.
The energy output was determined by dry fodder production (Table 4). Among all the three varieties, J-1006 resulted in significantly higher total energy output, net energy, energy use efficiency, energy productivity, and energy profitability than African Tall and P-3396 at a similar input energy level. This could be attributed to higher dry fodder production compared to the rest of both varieties. Comparison among nutrient management practices indicated that the control plot required less total energy input than the nutrient treatments. The higher energy input under nutrient treatments might be due to the fact that fertilizers manufacturing needed more energy. Nemecek and Erzinger [70] also reported that N fertilizers manufactured using an energy-intensive Haber–Bosch process involving natural gas led to its higher energy equivalent. Adopting 75% RDF + PGPR + Panchagavya spray and 50% RDF + 25% FYM + PGPR + Panchagavya spray reduced energy consumption by 10.9 and 17.0%, respectively, over 100% RDF. It might be due to the comparatively lower energy equivalent of FYM and PGPR than chemical fertilizers. The present result agrees with the findings of Singh et al. [71]. Prajapat et al. [72] also reported that partial substitution of RDF through organic nutrient sources reduced the energy requirement of fodder sorghum compared to 100% RDF through chemical fertilizer. Total energy output and net energy were significantly higher under 75% RDF + PGPR + Panchagavya spray (Table 4). Applying 75% RDF + PGPR + Panchagavya spray and 50% RDF + 25% FYM + PGPR + Panchagavya spray exhibited significantly higher energy use efficiency, productivity, and profitability and a lower value of specific energy compared to 100% RDF (Table 4). The higher energy output with 75% RDF + PGPR + Panchagavya spray might be due to its higher dry fodder yield resulting from better growth by continuous nutrient supply through the combined use of organic and chemical fertilizer as compared to chemical fertilizer alone. Singh et al. [73] also reported the higher net energy in wheat using manure and chemical fertilizers. Apart from higher dry fodder yield, the lower input energy was attributed to higher energy use efficiency, energy productivity, and energy profitability with integrated use of organic and inorganic nutrient sources compared to 100% RDF through chemical fertilization. The higher energy profitability of wheat due to lower input energy was also reported [73]. Rautaray et al. [74] reported that INM practices enhanced the energy use efficiency in rice crops. Several researchers have also suggested that integrated use of organic nutrient sources along with a reduced dose of chemical fertilizers enhanced the energy output, use efficiency, productivity, and profitability and lowered the specific energy [47,72,75,76].

4.3. Carbon Inputs, Outputs, and Its Indices

In the past few decades, the atmosphere’s CO2 concentration was also increased rapidly, and it was 412.74 ppm in 2021 [6]. Agriculture, forestry, and other land use sectors contributed 23% of the total GHGs emissions from 2007 to 2016 [7]. Fodder production is an important component for livestock as fodder crops fulfill around 80–90% of the total nutrient requirements of livestock [14]. Therefore, efficient fodder production is a key challenge for sustainable livestock production. To minimize the GHGs emission from the agriculture sector, we need to emphasize increasing carbon use efficiency and reducing the carbon input. Therefore, a suitable crop variety with more biomass production and requiring lower carbon inputs and an efficient nutrient management practice with lesser carbon emissions must be identified. In the present study (Figure 7, Figure 8, Figure 9 and Figure 10), the carbon input was the same for all three tested varieties because the type and quantity of inputs used were similar. Among varieties, significantly higher carbon output was reported from J-1006 due to higher dry fodder production compared with African Tall and P-3396 varieties (Table 5). At the same level of carbon input, the higher carbon output led to a higher net carbon gain, carbon efficiency, and carbon sustainability index in the J-1006 compared to the rest of the varieties (Table 5). The variety J-1006 showed significantly lower Cfy compared to African Tall and P-3396 at the same level of carbon input. The higher carbon output in terms of dry fodder production with J-1006 was a reason for lower Cfy.
In the meantime, the role of efficient nutrient management in sustainable fodder production is also very high, as the maximum share of total input carbon comes from fertilizers and manures/nutrient management in the current study. In a study conducted in Karnataka (India), Manoj et al. [11] reported on the maximum share of fertilizers and FYM in total carbon inputs for different fodder cropping systems. Similarly, Gong et al. [77] and Jiang et al. [78] also reported fertilizers as a major contributor to total carbon inputs for agricultural production in China. Among the nutrient management treatments (Table 5), the application of 75% RDF + PGPR + Panchagavya spray showed significantly higher carbon output that could be attributed to higher dry fodder production compared with 100% RDF through chemical fertilizers. The carbon input and output are important factors in computing the carbon indices for crop production. In this study (Figure 7, Figure 8, Figure 9 and Figure 10; Table 5), the lower carbon input and higher carbon output resulted in a higher value of net carbon gain, carbon efficiency, and carbon sustainability index with 75% RDF + PGPR + Panchagavya spray. Our results closely conform with the findings of Prajapat et al. [72]. The Cfy was significantly lower under 75% RDF + PGPR + Panchagavya spray compared with 100% RDF. This might be associated with higher dry fodder production resulting from its genetic makeup and response to microclimatic conditions. Van Groenigen et al. [79] and Singh and Ahlawat [47] also reported lower Cfy due to the integrated use of organic nutrient sources and reduced mineral fertilizer dose. Henceforth, this study identified the 75% RDF + PGPR + Panchagavya spray as a carbon-efficient nutrient management practice.

5. Conclusions

In this study, the J-1006 variety outperformed the African Tall and P-3396 varieties in terms of dry fodder yield, energy, and carbon output. Notably, the higher output of energy, carbon, and dry biomass resulted in efficient energy and carbon indices and lower carbon footprints per unit yield. In the case of nutrient management practices, the integrated use of organic and inorganic nutrient sources, especially 75% RDF + PGPR + Panchagavya spray, produced significantly higher dry fodder yield, energy, and carbon output, which led to efficient energy and carbon indices compared with 100% RDF through chemical fertilizer. Application of the recommended dose of nutrients through 100% chemical fertilizers (100% RDF) utilized the lesser renewable and more non-renewable energy compared to integrated nutrient management treatments (75% RDF + PGPR + Panchagavya spray and 50% RDF + 25% FYM + PGPR + Panchagavya spray), which indicate lesser sustainability. Overall, cultivating the J-1006 variety of fodder maize and adopting integrated nutrient management practices, particularly 75% RDF + PGPR + Panchagavya spray, will help enhance energy use efficiency and curtail the carbon footprint while sustaining animal production through higher dry fodder productivity.

Supplementary Materials

The following are available online at https://www.mdpi.com/article/10.3390/agronomy13040981/s1, Figure S1: Mean weekly meteorological data during the kharif season of 2018; Figure S2: Mean weekly meteorological data during the kharif season of 2019; Table S1. Chemical characteristics of FYM used in the experimentation; Table S2. Chemical and microbial characteristics of panchagavya used in the experimentation.

Author Contributions

Conceptualization, D.K., M.S., R.K.M. and S.K. (Sanjeev Kumar); methodology, D.K., M.S. and S.K. (Sanjeev Kumar); software, D.K., M.R.Y. and S.B.; validation, R.K.M., S.K. (Sanjeev Kumar) and R.K.; formal analysis, D.K., M.R.Y. and M.K.; investigation, D.K.; data curation, M.S., R.K. and R.K.M.; writing—original draft preparation, D.K., M.R.Y., M.K., G.M., B.B. and P.K.; writing—review and editing, R.K., S.K. (Suryakanta Kashyap), B.B., R. and P.K.; visualization, M.K., G.M., S.B. and S.K. (Suryakanta Kashyap); supervision, M.S., R.K.M. and S.K. (Sanjeev Kumar). All authors have read and agreed to the published version of the manuscript.

Funding

This research received no external funding.

Data Availability Statement

Not applicable.

Acknowledgments

The authors would like to acknowledge the Director of the ICAR-National Dairy Research Institute, Karnal (India), for providing the necessary facilities to carry out this research work.

Conflicts of Interest

The authors declare that they have no known competing financial interests or personal relationships that could have appeared to influence the work reported in this paper.

References

  1. Rosa, L.; Rulli, M.C.; Ali, S.; Chiarelli, D.D.; Dell’Angelo, J.; Mueller, N.D.; Scheidel, A.; Siciliano, G.; D’Odorico, P. Energy implications of the 21st century agrarian transition. Nat. Commun. 2021, 12, 2319. [Google Scholar] [CrossRef]
  2. Crippa, M.; Solazzo, E.; Guizzardi, D.; Monforti-Ferrario, F.; Tubiello, F.N.; Leip, A. Food systems are responsible for a third of global anthropogenic GHG emissions. Nat. Food 2021, 2, 198–209. [Google Scholar] [CrossRef]
  3. Parihar, C.M.; Jat, S.L.; Singh, A.K.; Kumar, B.; Rathore, N.S.; Jat, M.L.; Saharawat, Y.S.; Kuri, B.R. Energy auditing of long-term conservation agriculture based irrigated intensive maize systems in semi-arid tropics of India. Energy 2018, 142, 289–302. [Google Scholar] [CrossRef]
  4. Bhatia, A.; Aggarwal, P.K.; Jain, N.; Pathak, H. Greenhouse gas emission from rice- and wheat-growing areas in India: Spatial analysis and upscaling. Greenhouse Gas Sci. Technol. 2012, 2, 115–125. [Google Scholar] [CrossRef]
  5. Kim, T.-L.; Lim, H.; Chung, H.; Veerappan, K.; Oh, C. Elevated CO2 alters the physiological and transcriptome responses of Pinus densiflora to long-term CO2 exposure. Plants 2022, 11, 3530. [Google Scholar] [CrossRef] [PubMed]
  6. Zhang, L.; Wang, Z.; Zhou, W.; Yang, X.; Zhao, S.; Li, Q. GOSAT mapping of global greenhouse gas in 2020 and 2021. Atmosphere 2022, 13, 1814. [Google Scholar] [CrossRef]
  7. IPCC. Climate Change and Land: An IPCC Special Report on Climate Change, Desertification, Land Degradation, Sustainable Land Management, Food Security, and Greenhouse Gas Fluxes in Terrestrial Ecosystems; Shukla, P.R., Skea, J., Buendia, E.C., Masson-Delmotte, V., Pörtner, H.-O., Roberts, D.C., Zhai, P., Slade, R., Connors, S., van Diemen, R., et al., Eds.; 2019; Available online: https://www.ipcc.ch/site/assets/uploads/2019/11/SRCCL-Full-Report-Compiled-191128.pdf (accessed on 5 January 2021).
  8. Ghorbani, R.; Mondani, F.; Amirmoradi, S.; Feizi, H.; Khorramdel, S.; Teimouri, M.; Sanjani, S.; Anvarkhah, S.; Aghel, H. A case study of energy use and economical analysis of irrigated and dryland wheat production systems. Appl. Energy 2011, 88, 283–288. [Google Scholar] [CrossRef]
  9. Yadav, M.R.; Kumar, S.; Behera, B.; Yadav, V.P.; Khrub, A.S.; Yadav, L.R.; Gupta, K.C.; Meena, O.P.; Baloda, A.S.; Raza, M.B.; et al. Energy-carbon footprint, productivity and profitability of barley cultivars under contrasting tillage-residue managements in semi-arid plains of North-West India. J. Soil Sci. Plant Nutr. 2023, 23, 1109–1124. [Google Scholar] [CrossRef]
  10. Meena, O.P.; Sammauria, R.; Gupta, A.K.; Gupta, K.C.; Behera, B.; Saxena, R.; Yadav, M.R.; Singh, P.; Meena, R.K.; Raza, M.B.; et al. Energy-carbon footprint vis-à-vis system productivity and profitability of diversified crop rotations in semi-arid plains of North-West India. J. Soil Sci. Plant Nutr. 2022, 22, 2026–2041. [Google Scholar] [CrossRef]
  11. Manoj, K.N.; Shekara, B.G.; Sridhara, S.; Mudalagiriyappa; Chikkarugi, N.M.; Gopakkali, P.; Jha, P.K.; Vara Prasad, P.V. Carbon footprint assessment and energy budgeting of different annual and perennial forage cropping systems: A study from the semi-arid region of Karnataka, India. Agronomy 2022, 12, 1783. [Google Scholar] [CrossRef]
  12. Anonymous. Livestock Population with Global Comparison. 2021. Available online: http://www.indiaagristat.com/agriculture-data/2/animal-husbandrylivestock/48/livestock-population-with-global-comparison/973615/stats.aspx (accessed on 5 January 2021).
  13. Anonymous. Vision 2050; ICAR—Indian Grassland and Fodder Research Institute: Jhansi, India, 2018.
  14. Kumar, D.; Singh, M.; Kumar, S.; Meena, R.; Yadav, M.R.; Makarana, G.; Kushwaha, M.; Dutta, S.; Kumar, R.; Rajesh, R. Productivity and quality enhancement in fodder maize (Zea mays) cultivars through nutrient management strategies. Indian J. Agric. Sci. 2022, 92, 126–130. [Google Scholar] [CrossRef]
  15. Meena, V.K.; Subramannian, S.; Anjlo, P.; Dipti, N.V. Popularization of maize among the small farmers of Ernakulam District of Kerala through front line demonstration. Indian J. Agric. Res. 2015, 49, 558–561. [Google Scholar] [CrossRef] [Green Version]
  16. Chaudhary, D.P.; Kumar, A.; Mandhania, S.S.; Srivastava, P.; Kumar, R.S. Maize as Fodder? An Alternative Approach; ICAR-Directorate of Maize Research: New Delhi, India, 2012; pp. 1–26.
  17. Kumar, R.; Rathore, D.K.; Meena, B.S.; Ashutosh; Singh, M.; Kumar, U.; Meena, V.K. Enhancing productivity and quality of fodder maize through soil and foliar zinc nutrition for improving livestock performance. Indian J. Agric. Res. 2016, 50, 259–263. [Google Scholar] [CrossRef] [Green Version]
  18. Godara, A.; Gupta, U.; Singh, R. Effect of integrated nutrient management on herbage, dry fodder yield and quality of oat (Avena sativa L.). Forage Res. 2012, 38, 59–61. [Google Scholar]
  19. Johnston, A.E.; Poulton, P.R.; Coleman, K. Soil organic matter: Its importance in sustainable agriculture and carbon dioxide fluxes. In Advances in Agronomy; Sparks, D.L., Ed.; Academic Press: Burlington, ON, Canada, 2009; Volume 101, pp. 1–57. ISBN 978-0-12-374817-1. [Google Scholar]
  20. Bandyopadhyay, K.K.; Misra, A.K.; Ghosh, P.K.; Hati, K.M. Effect of integrated use of farmyard manure and chemical fertilizers on soil physical properties and productivity of soybean. Soil Till. Res. 2010, 110, 115–125. [Google Scholar] [CrossRef]
  21. Diacono, M.; Montemurro, F. Long-term effects of organic amendments on soil fertility. a review. Agron. Sustain. Dev. 2010, 30, 401–422. [Google Scholar] [CrossRef] [Green Version]
  22. Khan, N.I.; Malik, A.U.; Umer, F.; Bodla, M.I. Effect of tillage and farm yard manure on physical properties of soil. Int. Res. J. Plant Sci. 2010, 1, 75–82. [Google Scholar]
  23. Beneduzi, A.; Ambrosini, A.; Passaglia, L.M.P. Plant growth-promoting rhizobacteria (PGPR): Their potential as antagonists and biocontrol agents. Genet. Mol. Biol. 2012, 35, 1044–1051. [Google Scholar] [CrossRef] [Green Version]
  24. Vejan, P.; Abdullah, R.; Khadiran, T.; Ismail, S.; Nasrulhaq Boyce, A. Role of plant growth promoting rhizobacteria in agricultural sustainability—A review. Molecules 2016, 21, 573. [Google Scholar] [CrossRef] [Green Version]
  25. Kumar, D.; Singh, M.; Yadav, M.R.; Makarana, G.; Kushwaha, M.; Dutta, S.; Bhattacharjee, S. Rajesh Growth and yield performance of fodder oats (Avena Sativa) grown under different nutrient management practices. Indian J. Agri. Sci. 2022, 92, 267–272. [Google Scholar] [CrossRef]
  26. Prasad, J.; Karmakar, S.; Kumar, R.; Mishra, B. Influence of Integrated nutrient management on yield and soil properties in maize-wheat cropping system in an Alfisol of Jharkhand. J. Indian Soc. Soil Sci. 2010, 58, 200–204. [Google Scholar]
  27. Saha, R.; Mishra, V.K.; Majumdar, B.; Laxminarayana, K.; Ghosh, P.K. Effect of integrated nutrient management on soil physical properties and crop productivity under a maize (Zea mays)–mustard (Brassica campestris) cropping sequence in acidic soils of Northeast India. Commun. Soil Sci. Plant Anal. 2010, 41, 2187–2200. [Google Scholar] [CrossRef]
  28. Singh, C.M.; Sharma, P.; Kishor, P.; Mishra, P.; Singh, A.; Verma, R.; Raha, P. Impact of integrated nutrient management on growth, yield and nutrient uptake by wheat (Triticum aestivum L.). Asian J. Agric. Res. 2011, 5, 76–82. [Google Scholar] [CrossRef] [Green Version]
  29. Devasenapathy, P.; Senthilkumar, G.; Shanmugam, P.M. Energy management in crop production. Indian J. Agron. 2009, 54, 80–89. [Google Scholar]
  30. Mittal, J.P.; Dhawan, K.C. Research Manual on Energy Requirements in Agricultural Sector; ICAR: New Delhi, India, 1988. [Google Scholar]
  31. Parihar, C.M.; Bhakar, R.N.; Rana, K.S.; Jat, M.L.; Singh, A.K.; Jat, S.L.; Parihar, M.D.; Sharma, S. Energy scenario, carbon efficiency, nitrogen and phosphorus dynamics of pearlmillet-mustard system under diverse nutrient and tillage management practices. Afr. J. Agric. Res. 2013, 8, 903–915. [Google Scholar] [CrossRef]
  32. Singh, K.P.; Prakash, V.; Srinivas, K.; Srivastva, A.K. Effect of tillage management on energy-use efficiency and economics of soybean (Glycine max) based cropping systems under the rainfed conditions in North-West Himalayan Region. Soil Till. Res. 2008, 100, 78–82. [Google Scholar] [CrossRef]
  33. Nassiri, S.M.; Singh, S. Study on energy use efficiency for paddy crop using data envelopment analysis (DEA) technique. Appl. Energy 2009, 86, 1320–1325. [Google Scholar] [CrossRef]
  34. Toader, M.; Gheorghe, L. Researches over the efficacy of the technologic process of cereal straw briquetting. UPB Sci. Bull. D Mech. Eng. 2014, 76, 239–246. [Google Scholar]
  35. Mihov, M.; Antonova, G.; Masheva, S.; Yankova, V. Energy assessment of conventional and organic production of head cabbage. Bulg. J. Agric. Sci. 2012, 18, 320–324. [Google Scholar]
  36. Lal, B.; Gautam, P.; Nayak, A.K.; Panda, B.B.; Bihari, P.; Tripathi, R.; Shahid, M.; Guru, P.K.; Chatterjee, D.; Kumar, U.; et al. Energy and carbon budgeting of tillage for environmentally clean and resilient soil health of rice-maize cropping system. J. Clean. Prod. 2019, 226, 815–830. [Google Scholar] [CrossRef]
  37. Chaudhary, V.P.; Gangwar, B.; Pandey, D.K. Auditing of energy use and output of different cropping systems in India. Agric. Eng. Int. CIGR J. 2006, 8, 1–13. [Google Scholar]
  38. Khosruzzaman, S.; Asgar, M.A.; Rahman, K.R.; Akbar, S. Energy intensity and productivity in relation to agriculture-Bangladesh perspective. J. Bangladesh Acad. Sci. 2010, 34, 59–70. [Google Scholar] [CrossRef]
  39. Mittal, V.K.; Mittal, J.P.; Dhawan, K.C. Research Digest on Energy Requirements in Agricultural Sector; Co-Ordinating Cell, AICRP on Energy Requirements in Agricultural Sector; Punjab Agricultural University: Ludhiana, India, 1985. [Google Scholar]
  40. Lal, R. Carbon emission from farm operations. Environ. Int. 2004, 30, 981–990. [Google Scholar] [CrossRef] [PubMed]
  41. West, T.O.; Marland, G. A Synthesis of Carbon sequestration, carbon emissions, and net carbon flux in agriculture: Comparing tillage practices in the United States. Agric. Ecosyst. Environ. 2002, 91, 217–232. [Google Scholar] [CrossRef]
  42. Tubiello, F.N.; Cóndor-Golec, R.D.; Salvatore, M.; Piersante, A.; Federici, S.; Ferrara, A.; Rossi, S.; Flammini, A.; Cardenas, P.; Biancalani, R.; et al. Estimating Greenhouse Gas Emissions in Agriculture: A Manual to Address Data Requirements for Developing Countries; FAO: Rome, Italy, 2015; ISBN 978-92-5-108674-2. [Google Scholar]
  43. Yadav, G.S.; Das, A.; Lal, R.; Babu, S.; Meena, R.S.; Saha, P.; Singh, R.; Datta, M. Energy budget and carbon footprint in a no-till and mulch based rice–mustard cropping system. J. Clean. Prod. 2018, 191, 144–157. [Google Scholar] [CrossRef]
  44. Wang, H.; Yang, Y.; Zhang, X.; Tian, G. Carbon footprint analysis for mechanization of maize production based on life cycle assessment: A case study in Jilin Province, China. Sustainability 2015, 7, 15772–15784. [Google Scholar] [CrossRef] [Green Version]
  45. Deng, J.L. Grey controlling system. Cent. Inst. Technol. 1982, 10, 9–18. [Google Scholar]
  46. Basavalingaiah, K.; Ramesha, Y.M.; Paramesh, V.; Rajanna, G.A.; Jat, S.L.; Dhar Misra, S.; Kumar Gaddi, A.; Girisha, H.C.; Yogesh, G.S.; Raveesha, S.; et al. Energy Budgeting, data envelopment analysis and greenhouse gas emission from rice production system: A case study from puddled transplanted rice and direct-seeded rice system of Karnataka, India. Sustainability 2020, 12, 6439. [Google Scholar] [CrossRef]
  47. Singh, R.J.; Ahlawat, I.P.S. Energy budgeting and carbon footprint of transgenic cotton–wheat production system through peanut intercropping and fym addition. Environ. Monit. Assess. 2015, 187, 282. [Google Scholar] [CrossRef]
  48. Chaudhary, V.P.; Singh, K.K.; Pratibha, G.; Bhattacharyya, R.; Shamim, M.; Srinivas, I.; Patel, A. Energy conservation and greenhouse gas mitigation under different production systems in rice cultivation. Energy 2017, 130, 307–317. [Google Scholar] [CrossRef]
  49. Dawadi, D.; Sah, S. Growth and yield of hybrid maize (Zea mays L.) in relation to planting density and nitrogen levels during winter season in Nepal. Trop. Agric. Res. 2012, 23, 218–227. [Google Scholar] [CrossRef] [Green Version]
  50. Chaudhary, D.P.; Kumar, A.; Kumar, R.; Singode, A.; Mukri, G.; Sah, R.P.; Tiwana, U.S.; Kumar, B. Evaluation of normal and specialty corn for fodder yield and quality traits. Range Manag. Agrofor. 2016, 37, 79–83. [Google Scholar]
  51. Khedwal, R.S.; Yadav, D.B.; Hooda, V.S. Crop Residue management in no-till maize: Influence the growth, yield and economics of kharif maize (Zea mays L.). Forage Res. 2018, 44, 90–95. [Google Scholar]
  52. Sharma, I.P.; Chandra, S.; Kumar, N.; Chandra, D. PGPR: Heart of soil and their role in soil fertility. In Agriculturally Important Microbes for Sustainable Agriculture: Volume I: Plant-Soil-Microbe Nexus; Meena, V.S., Mishra, P.K., Bisht, J.K., Pattanayak, A., Eds.; Springer: Singapore, 2017; pp. 51–67. ISBN 978-981-10-5589-8. [Google Scholar]
  53. Piromyou, P.; Buranabanyat, B.; Tantasawat, P.; Tittabutr, P.; Boonkerd, N.; Teaumroong, N. Effect of plant growth promoting rhizobacteria (PGPR) inoculation on microbial community structure in rhizosphere of forage corn cultivated in Thailand. Eur. J. Soil Biol. 2011, 47, 44–54. [Google Scholar] [CrossRef]
  54. Ali, M.N.; Ghatak, S.; Ragul, T. Biochemical Analysis of panchagavya and sanjibani and their effect in crop yield and soil health. J. Crop Weed 2011, 7, 84–86. [Google Scholar]
  55. Khan, M.S.; Akther, T.; Hemalatha, S. Impact of panchagavya on oryza sativa l. grown under saline stress. J. Plant Growth Regul. 2017, 36, 702–713. [Google Scholar] [CrossRef]
  56. Yadav, B.K.; Lourduraj, A.C. Effect of organic manures and panchagavya spray on growth attributes and yield of rice (Oryza sativa L.). In Environment & Agriculture; Kumar, A., Ed.; APH Publishing Corporation: New Delhi, India, 2005; pp. 27–35. ISBN 978-81-7648-921-8. [Google Scholar]
  57. Loganathan, V.; Wahab, K. Effect of foliar spray of panchagavya on yield attributes, yield and economics of babycorn. J. Agron. 2013, 12, 109–112. [Google Scholar] [CrossRef]
  58. Loganathan, V.; Wahab, K. Influence of panchagavya foliar spray on the growth attributes and yield of baby corn (Zea mays) Cv. COBC 1. J. Appl. Nat. Sci. 2014, 6, 397–401. [Google Scholar] [CrossRef] [Green Version]
  59. Kumawat, R.N.; Mahajan, S.S.; Santra, P. Effect of panchgavya on soil chemical properties of groundnut (Arachis Hypogaea) rhizosphere and crop productivity in Western Rajasthan. J. Food Legumes 2013, 26, 39–43. [Google Scholar]
  60. Thirumeninathan, S.; Tamilnayagan, T.; Rajeshkumar, A.; Ramadass, S. Response of panchagavya foliar spray on growth, yield and economics of fodder cowpea (Vigna unguiculata L.). Int. J. Chem. Stud. 2017, 5, 1604–1606. [Google Scholar]
  61. Kumar, D.; Singh, M.; Kumar, S.; Meena, R.K.; Kumar, R. Fodder quality and nitrate estimation of oats grown under different nutrient management options. Indian J. Dairy Sci. 2021, 74, 331–337. [Google Scholar] [CrossRef]
  62. Kumar, D.; Singh, M.; Kushwaha, M.; Makarana, G.; Yadav, M.R. Integrated use of organic and inorganic nutrient sources influences the nutrient content, uptake and nutrient use efficiencies of fodder oats (Avena sativa). Indian J. Agron. 2021, 66, 466–473. [Google Scholar]
  63. Karforma, J.; Ghosh, M.; Ghosh, D.C.; Mandal, S. Effect of integrated nutrient management on growth, productivity, quality and economics of fodder maize in rainfed upland of terai region of West Bengal. Int. J. Agric. Environ. Biotechnol. 2012, 5, 419–427. [Google Scholar]
  64. Rathod, D.D.; Rathod, P.H.; Patel, K.P.; Patel, K.C. Integrated use of organic and inorganic inputs in wheat-fodder maize cropping sequence to improve crop yields and soil properties. Arch. Agron. Soil Sci. 2013, 59, 1439–1455. [Google Scholar] [CrossRef]
  65. Wailare, A.T.; Kesarwani, A. Effect of integrated nutrient management on growth and yield parameters of maize (Zea mays L.) as well as soil physicochemical properties. BJSTR 2017, 1, 1–6. [Google Scholar] [CrossRef]
  66. Mishra, P.K.; Sharma, S.; Tripathi, H.; Pandey, D. Energy input for fodder crop productions under different types of farming systems. Plant Arch. 2019, 19, 1358–1362. [Google Scholar]
  67. Patel, P.G.; Bhut, A.C.; Gupta, P. Energy requirement for kharif maize cultivation in Panchmahal district of Gujarat. J. Agri. Search 2014, 1, 168–172. [Google Scholar] [CrossRef]
  68. Wang, X.; Chen, Y.; Sui, P.; Gao, W.; Qin, F.; Zhang, J.; Wu, X. Energy Analysis of grain production systems on large-scale farms in the North China Plain based on LCA. Agric. Syst. 2014, 128, 66–78. [Google Scholar] [CrossRef]
  69. Li, J.; Cui, J.; Sui, P.; Yue, S.; Yang, J.; Lv, Z.; Wang, D.; Chen, X.; Sun, B.; Ran, M.; et al. Valuing the synergy in the water-energy-food nexus for cropping systems: A case in the North China Plain. Ecol. Indic. 2021, 127, 107741. [Google Scholar] [CrossRef]
  70. Nemecek, T.; Erzinger, S. Modelling representative life cycle inventories for swiss arable crops (9 Pp). Int. J. Life Cycle Assess. 2005, 10, 68–76. [Google Scholar] [CrossRef]
  71. Singh, R.J.; Ghosh, B.N.; Sharma, N.K.; Patra, S.; Dadhwal, K.S.; Mishra, P.K. Energy budgeting and energy synthesis of rainfed maize–wheat rotation system with different soil amendment applications. Ecol. Indic. 2016, 61, 753–765. [Google Scholar] [CrossRef]
  72. Prajapat, K.; Vyas, A.K.; Dhar, S.; Jain, N.K.; Hashim, M.; Choudhary, G.L. Energy input-output relationship of soybean-based cropping systems under different nutrient supply options. J. Environ. Biol. 2018, 39, 93–101. [Google Scholar] [CrossRef]
  73. Singh, P.; Benbi, D.K.; Verma, G. Nutrient management impacts on nutrient use efficiency and energy, carbon, and net ecosystem economic budget of a rice–wheat cropping system in Northwestern India. J. Soil Sci. Plant Nutr. 2021, 21, 559–577. [Google Scholar] [CrossRef]
  74. Rautaray, S.K.; Mishra, A.; Mohanty, R.K.; Behera, M.S.; Kumar, A. Energy Efficiency of transplanted rice under integrated nutrient management in a rainfed medium land. Extended Abstracts. In Proceedings of the Third International Agronomy Congress “Agricultural Diversification, Climate Change Management and Livelihoods”, New Delhi, India, 26–30 November 2012; p. 75. [Google Scholar]
  75. Mandal, K.G.; Saha, K.P.; Ghosh, P.K.; Hati, K.M.; Bandyopadhyay, K.K. Bioenergy and economic analysis of soybean-based crop production systems in Central India. Biomass Bioenergy 2002, 23, 337–345. [Google Scholar] [CrossRef]
  76. Billore, S.D.; Ramesh, A.; Joshi, O.P.; Vyas, A.K. Energy budgeting of soybean based cropping system under various tillage and fertility management. Indian J. Agric. Sci. 2009, 79, 827–830. [Google Scholar]
  77. Gong, H.; Li, J.; Sun, M.; Xu, X.; Ouyang, Z. Lowering carbon footprint of wheat-maize cropping system in North China plain: Through microbial fertilizer application with adaptive tillage. J. Clean. Prod. 2020, 268, 122255. [Google Scholar] [CrossRef]
  78. Jiang, Z.; Zhong, Y.; Yang, J.; Wu, Y.; Li, H.; Zheng, L. Effect of nitrogen fertilizer rates on carbon footprint and ecosystem service of carbon sequestration in rice production. Sci. Total Environ. 2019, 670, 210–217. [Google Scholar] [CrossRef]
  79. Van Groenigen, J.W.; Velthof, G.L.; Oenema, O.; Van Groenigen, K.J.; Van Kessel, C. Towards an agronomic assessment of N2O emissions: A case study for arable crops. Eur. J. Soil Sci. 2010, 61, 903–913. [Google Scholar] [CrossRef]
Figure 1. Dry fodder yield of maize varieties sown under different nutrient management practices (mean of two years). Note: Vertical bars labelled with different upper and lower-case letters shows significant variations among varieties and nutrient management practices, respectively using LSD (p = 0.05); Capped lines indicate the standard error of mean.
Agronomy 13 00981 g001
Figure 2. Source-wise inputs energy (MJ ha−1) used for fodder maize varieties sown under different nutrient management practices (mean of two years).
Agronomy 13 00981 g002
Figure 3. Source-wise mean share of inputs energy used for fodder maize (mean of two years).
Agronomy 13 00981 g003
Figure 4. Operation-wise inputs energy (MJ ha−1) used for fodder maize varieties sown under different nutrient management practices (mean of two years).
Agronomy 13 00981 g004
Figure 5. Operation-wise mean share of inputs energy used for fodder maize (mean of two years).
Agronomy 13 00981 g005
Figure 6. Percentage share of direct, indirect, renewable, and non-renewable energy sources to different nutrient management treatments and mean of varieties (mean of two years).
Agronomy 13 00981 g006
Figure 7. Source-wise equivalent carbon emission (kg CO2-e ha−1) for fodder maize varieties sown under different nutrient management practices (mean of two years).
Agronomy 13 00981 g007
Figure 8. Source-wise mean share of carbon emission for the cultivation of fodder maize (mean of two years).
Agronomy 13 00981 g008
Figure 9. Operation-wise equivalent carbon emission (kg CO2-e ha−1) for fodder maize varieties sown under different nutrient management practices (mean of two years).
Agronomy 13 00981 g009
Figure 10. Operation-wise mean share of carbon emission for the cultivation of fodder maize (mean of two years).
Agronomy 13 00981 g010
Table 1. Details of the varieties and nutrient management practices adopted in the fodder maize experiment.
TreatmentsTreatments Details
Main Plot—Varieties
V1African Tall
V2J-1006
V3P-3396
Sub-plot—Nutrient Management Practices
N0Control (Absolute)
N1100% RDF
N275% RDF + PGPR + Panchagavya spray
N350% RDF + 25% FYM + PGPR + Panchagavya spray
Note: Recommended dose of FYM was 10 t ha−1; RDF was 100, 60, and 40 kg ha−1 of N, P2O5, and K2O, respectively.
Table 2. Energy equivalents of inputs and output used for fodder maize cultivation.
Sr. No.ParticularsUnitEnergy Equivalent
(MJ Unit−1)
References
1Seedskg14.7Parihar et al. [31]
2Human laborhr1.96Devasenapathy et al. [29]
3Farm machinerykg62.7Mittal and Dhawan [30]
4DieselL56.31Singh et al. [32]
5Electrical motorkg64.8Devasenapathy et al. [29]
6Sicklehr0.836Nassiri and Singh [33]
7Sprayerhr0.50Nassiri and Singh [33]
8FYMkg0.3Parihar et al. [31]
9Nkg60.6Toader and Lazaroiu [34]
10Pkg11.1Toader and Lazaroiu [34]
11Kkg6.7Devasenapathy et al. [29]
12PGPR/Biofertilizerkg2.98Mihov et al. [35]
13Irrigationm31.02Lal et al. [36]
14HerbicideL288Chaudhary et al. [37]
15InsecticideL237Khosruzzaman et al. [38]
16FungicideL196Khosruzzaman et al. [38]
17Dry fodder (output)kg18Mittal et al. [39]
Table 4. Total energy input, output, and energy indices of fodder maize varieties sown under different nutrient management practices (mean of two years).
TreatmentsTotal Energy Input (MJ ha−1)Total Energy Output (MJ ha−1)Net Energy (MJ ha−1)Energy Use EfficiencyEnergy Productivity
(kg MJ−1)
Energy ProfitabilitySpecific Energy
(MJ kg−1)
Varieties
African Tall12,844175,468 B162,624 B13.86 B0.77 B12.86 B1.33 A
J-100612,844224,123 A211,280 A17.64 A0.98 A16.64 A1.03 B
P-339612,844197,055 B184,212 B15.54 B0.86 B14.54 B1.18 AB
SEd (±)934293420.700.040.700.06
LSD (p = 0.05)25,93725,9371.960.111.960.17
Nutrient management practices
N08671143,164 C134,493 C16.59 A0.92 A15.59 A1.11 B
N115,696211,920 B196,224 B13.51 B0.75 B12.51 B1.36 A
N213,987229,470 A215,482 A16.42 A0.91 A15.42 A1.11 B
N313,020210,975 B197,955 B16.21 A0.90 A15.21 A1.13 B
SEd (±)674967490.600.030.600.05
LSD (p = 0.05)14,17814,1781.270.071.270.10
Note: N0: Control; N1: 100% RDF; N2: 75% RDF + PGPR + Panchagavya spray; N3: 50% RDF + 25% FYM + PGPR + Panchagavya spray; Same letters within each column indicate non-significant difference among the treatments using LSD test (p < 0.05).
Table 5. Spatial carbon footprints, carbon inputs, outputs, and carbon indices of fodder maize varieties sown under different nutrient management practices (mean of two years).
TreatmentsSpatial Carbon Footprints (CFs)
(kg CO2-e ha−1)
Carbon Input
(kg CE ha−1)
Carbon Output
(kg CE ha−1)
Net Carbon gain
(kg CE ha−1)
Carbon EfficiencyCarbon Sustainability IndexCfy
(kg CO2-e Mg−1)
Varieties
African Tall16484504289 B3840 B9.80 B8.80 B169.6 A
J-100616484505479 A5029 A12.46 A11.46 A131.3 B
P-339616484504817 B4367 B10.98 B9.98 B150.1 AB
Sed (±)2282280.490.497.7
LSD (p = 0.05)6346341.371.3721.5
Nutrient management practices
N010342823500 C3218 C12.49 A11.49 A132.9 B
N120645635180 B4617 B9.21 C8.21 C178.4 A
N218254985609 A5112 A11.28 B10.28 B145.2 B
N316704565157 B4702 B11.33 B10.33 B144.9 B
Sed (±)1651650.440.446.2
LSD (p = 0.05)3473470.920.9212.9
Note: N0: Control; N1: 100% RDF; N2: 75% RDF + PGPR + Panchagavya spray; N3: 50% RDF + 25% FYM + PGPR + Panchagavya spray; Cfy: carbon footprint per unit yield; Same letters within each column indicate non-significant difference among the treatments using LSD test (p < 0.05).
Disclaimer/Publisher’s Note: The statements, opinions and data contained in all publications are solely those of the individual author(s) and contributor(s) and not of MDPI and/or the editor(s). MDPI and/or the editor(s) disclaim responsibility for any injury to people or property resulting from any ideas, methods, instructions or products referred to in the content.

