
Spectroscopic and Microscopic Analysis of Humic Acid Isolated from Stabilized Leachate HSs Fractionation

 , and
, and
Abstract
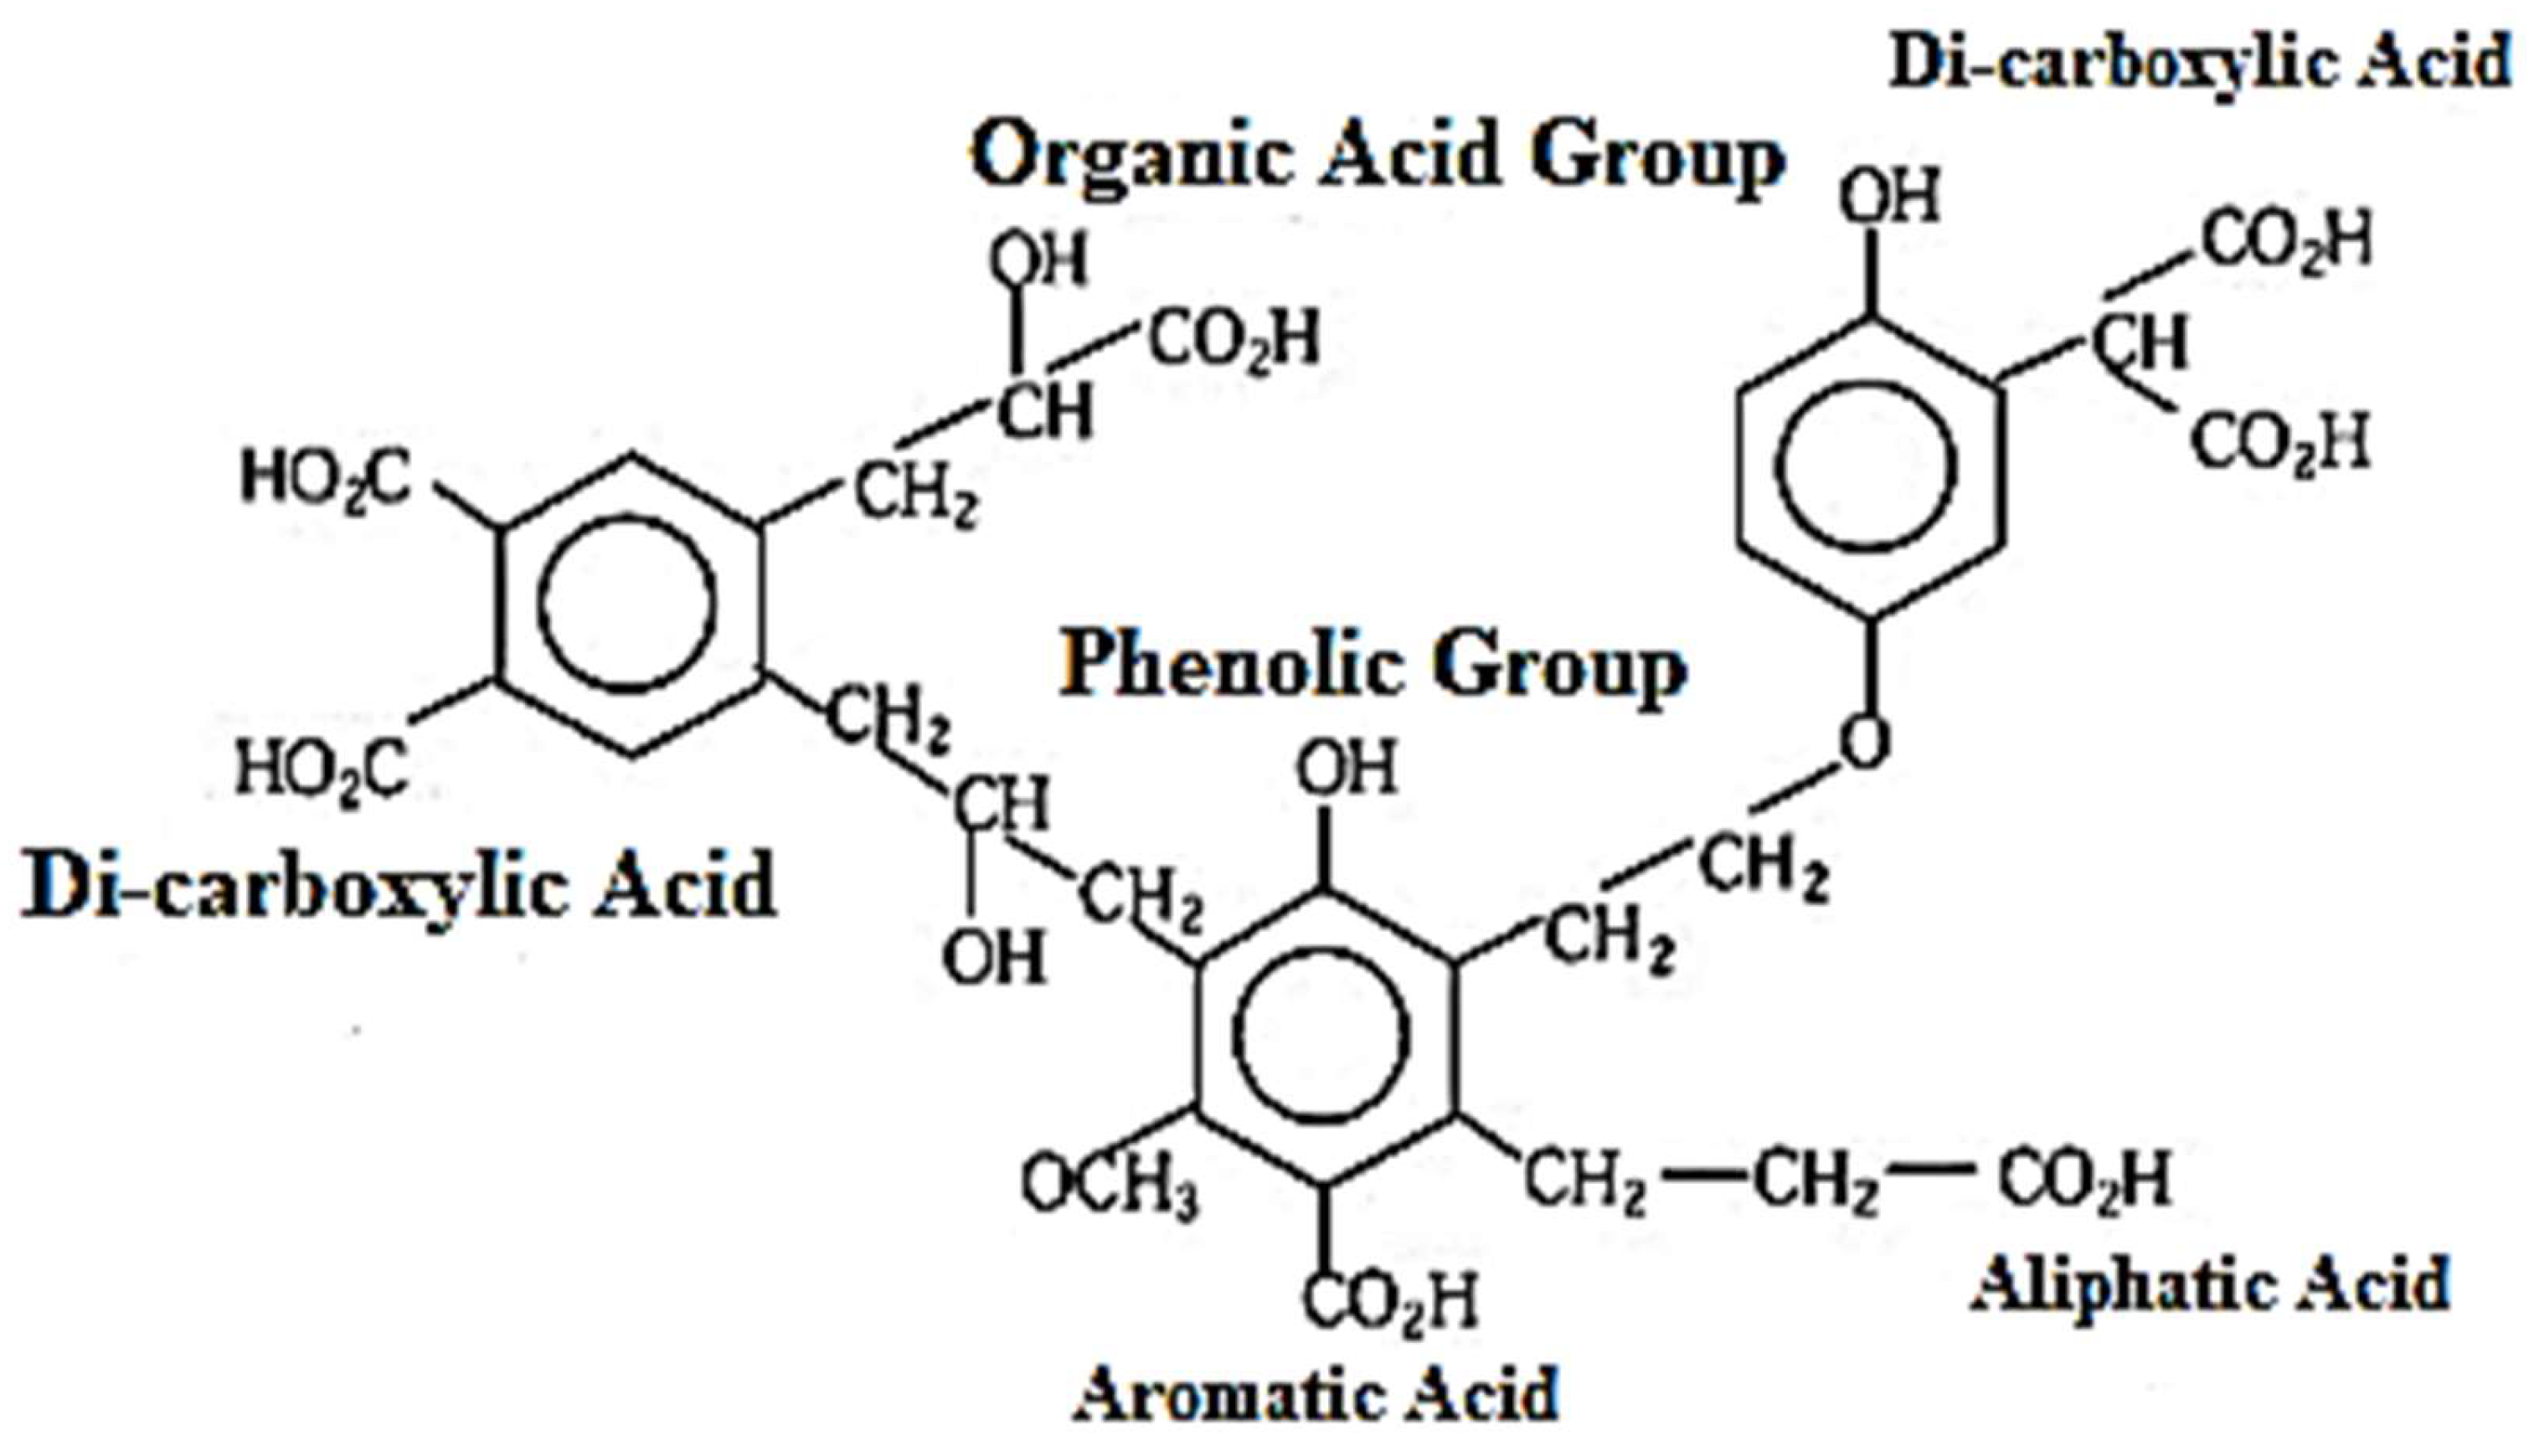
:1. Introduction
2. Materials and Methods
2.1. Collection of Stabilized Landfill Leachate
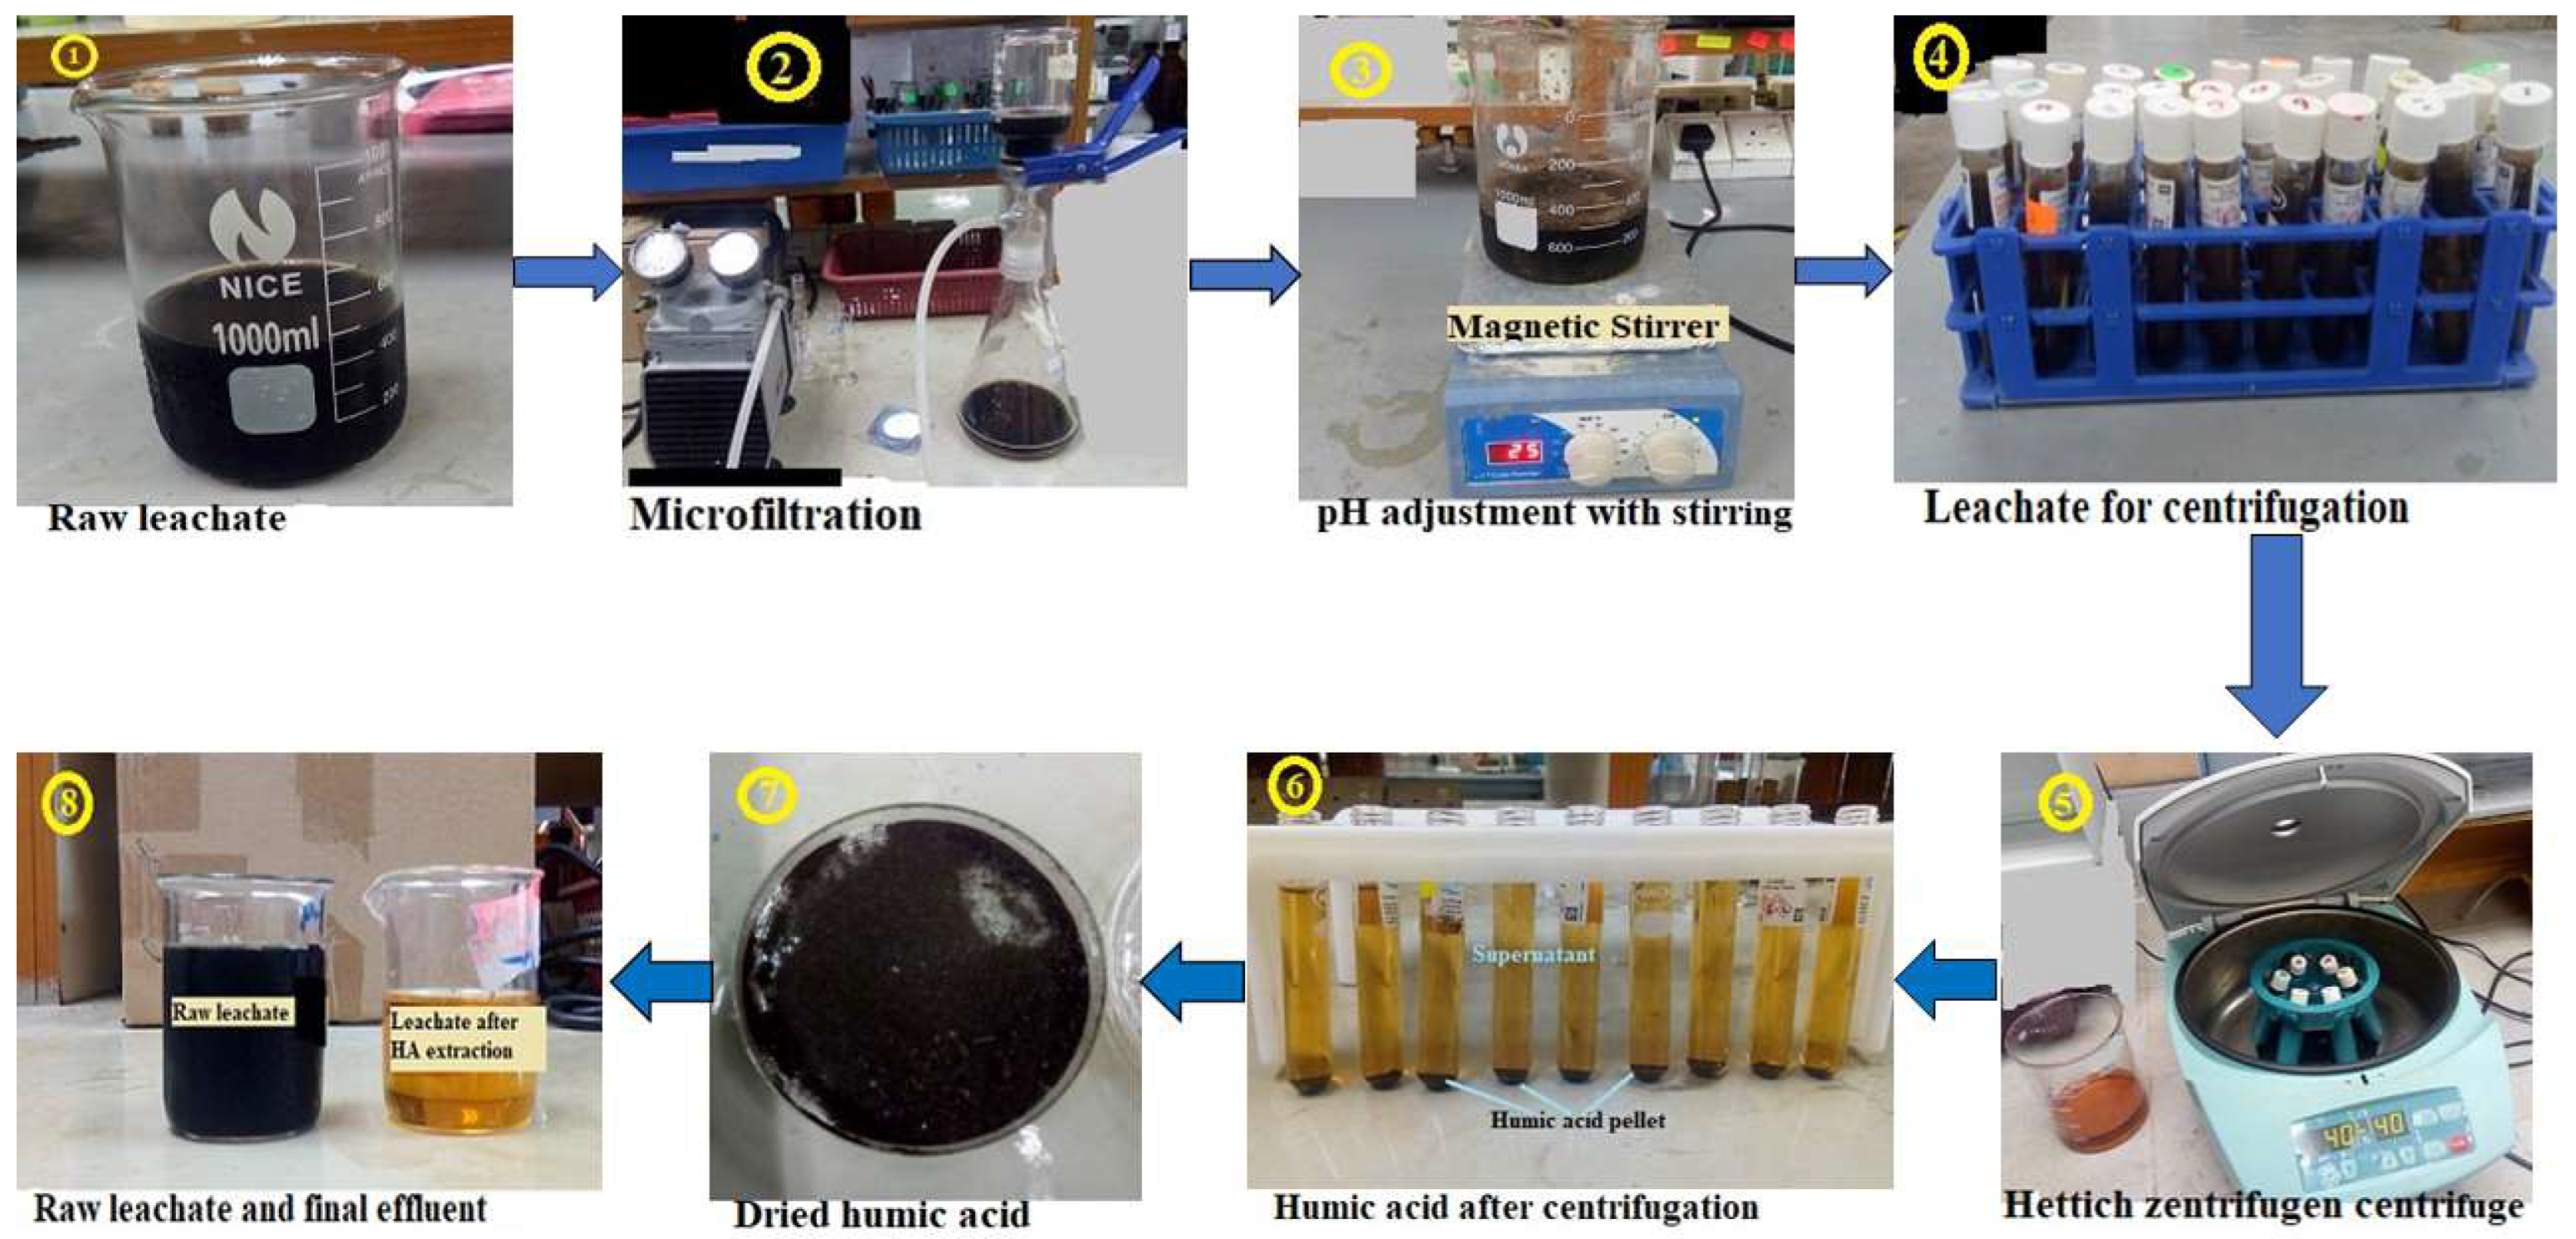
2.2. Isolation of Humic Acid from HSs of Stabilized Leachate
2.2.1. Microfiltration
2.2.2. pH Adjustment
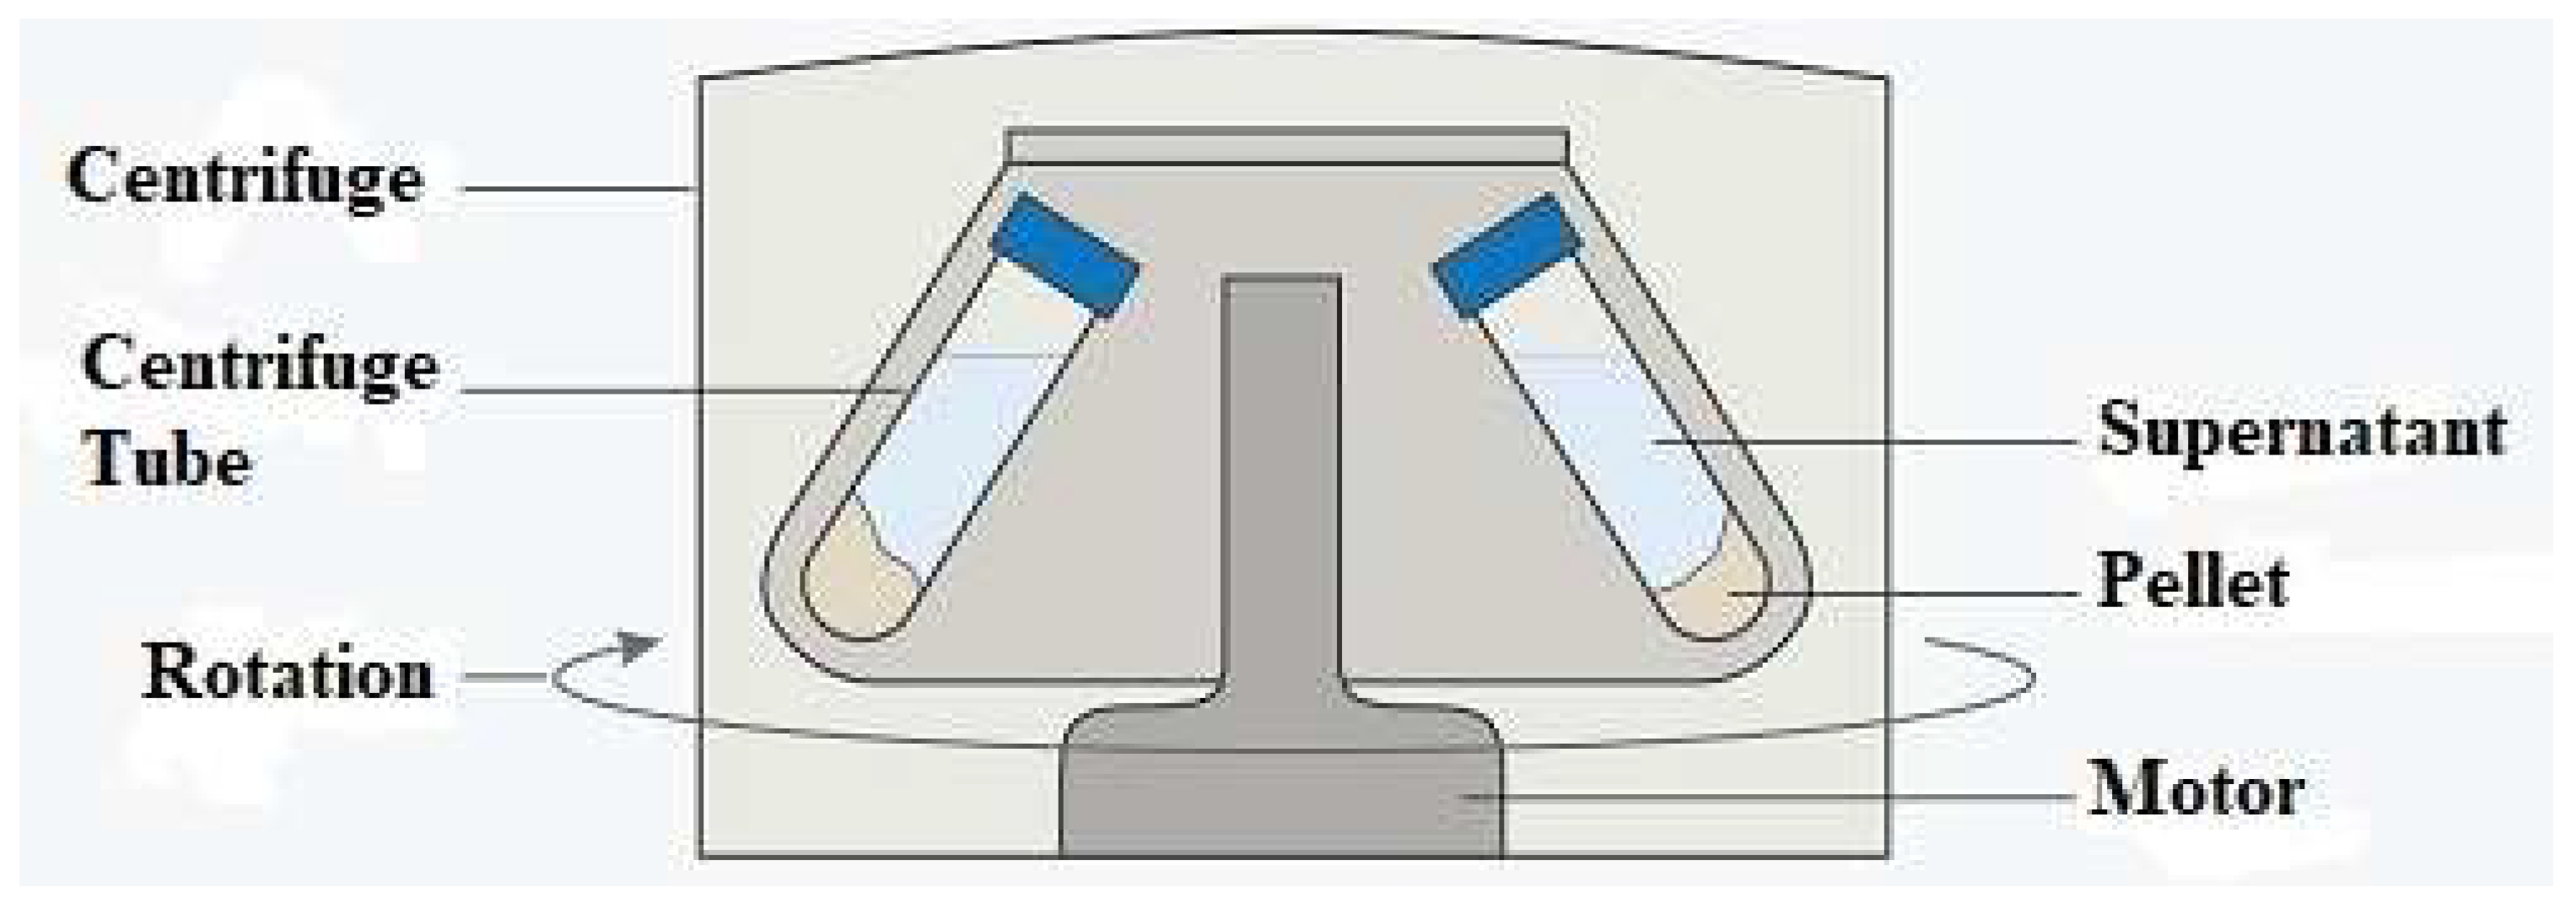
2.2.3. Centrifugation
2.3. Microscopic Analysis of Isolated Humic Acid
SEM-EDX Analysis
2.4. Spectroscopic Analysis of Isolated Humic Acid
2.4.1. UV–Vis Spectrum Analysis
2.4.2. FTIR Spectroscopy
2.4.3. XPS Analysis
2.5. Humic Acid Contribution as Pollutant (COD and Color)
3. Results
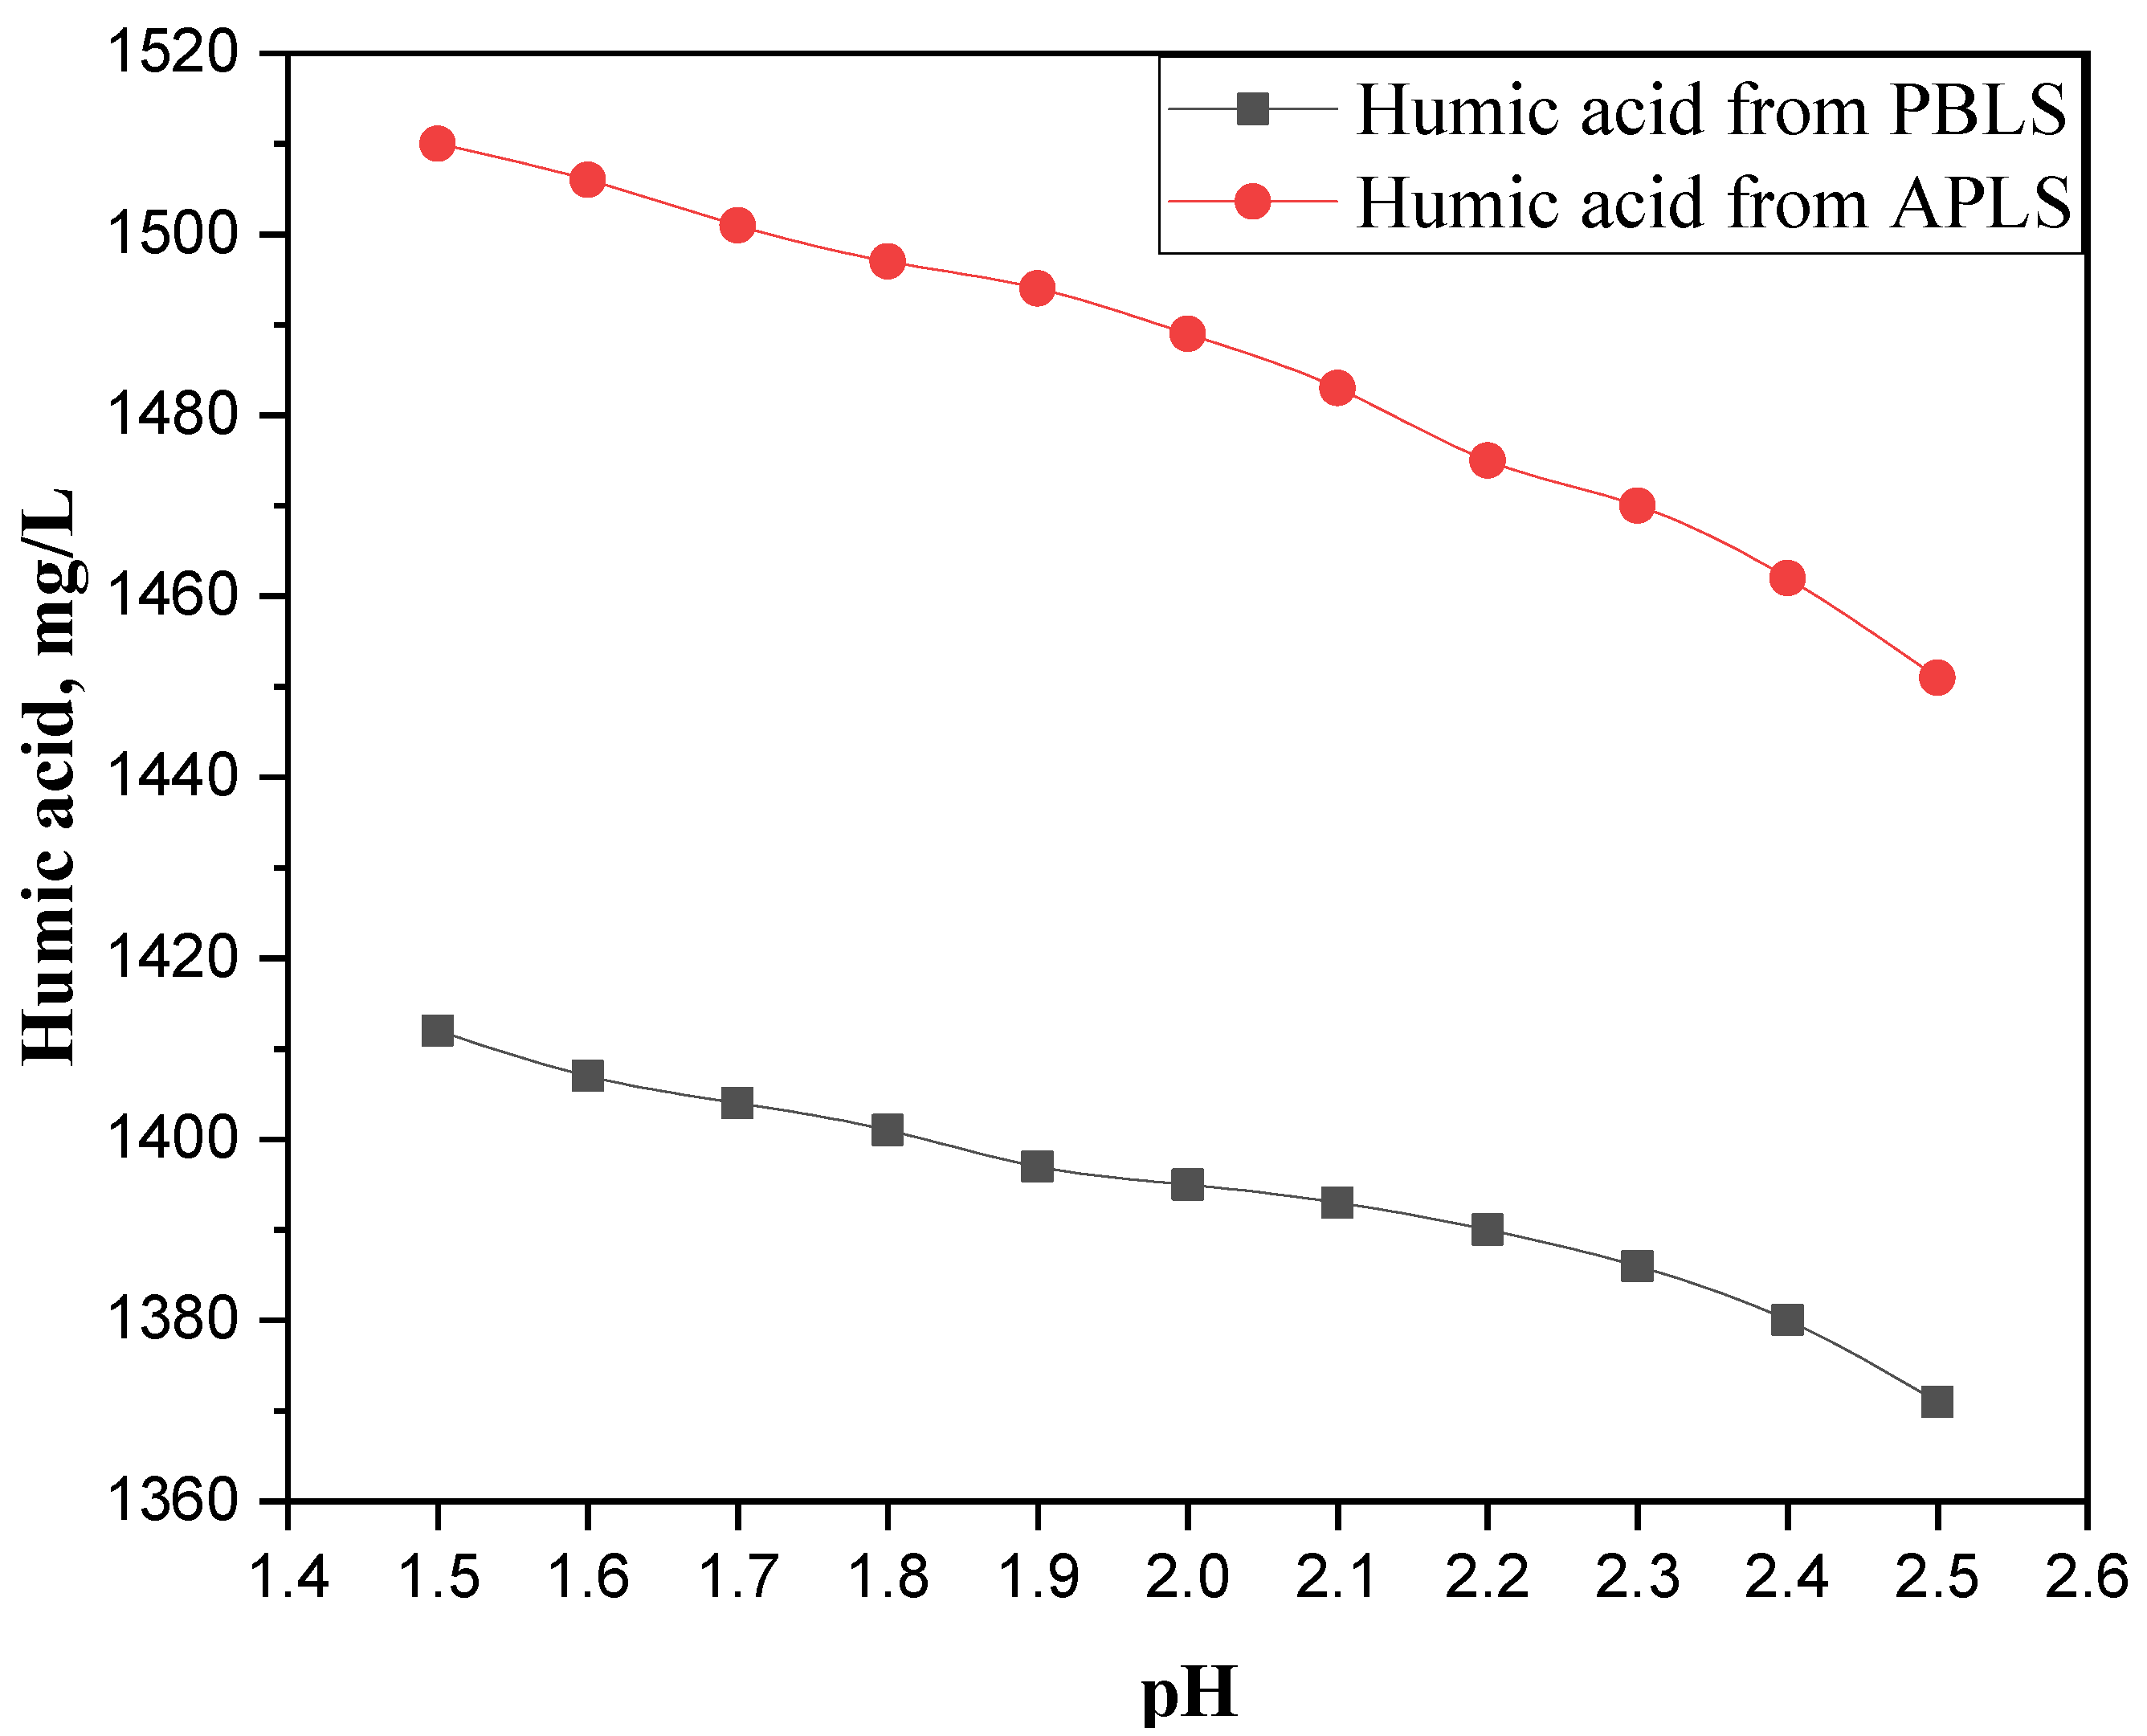
3.1. Humic Acid Isolation
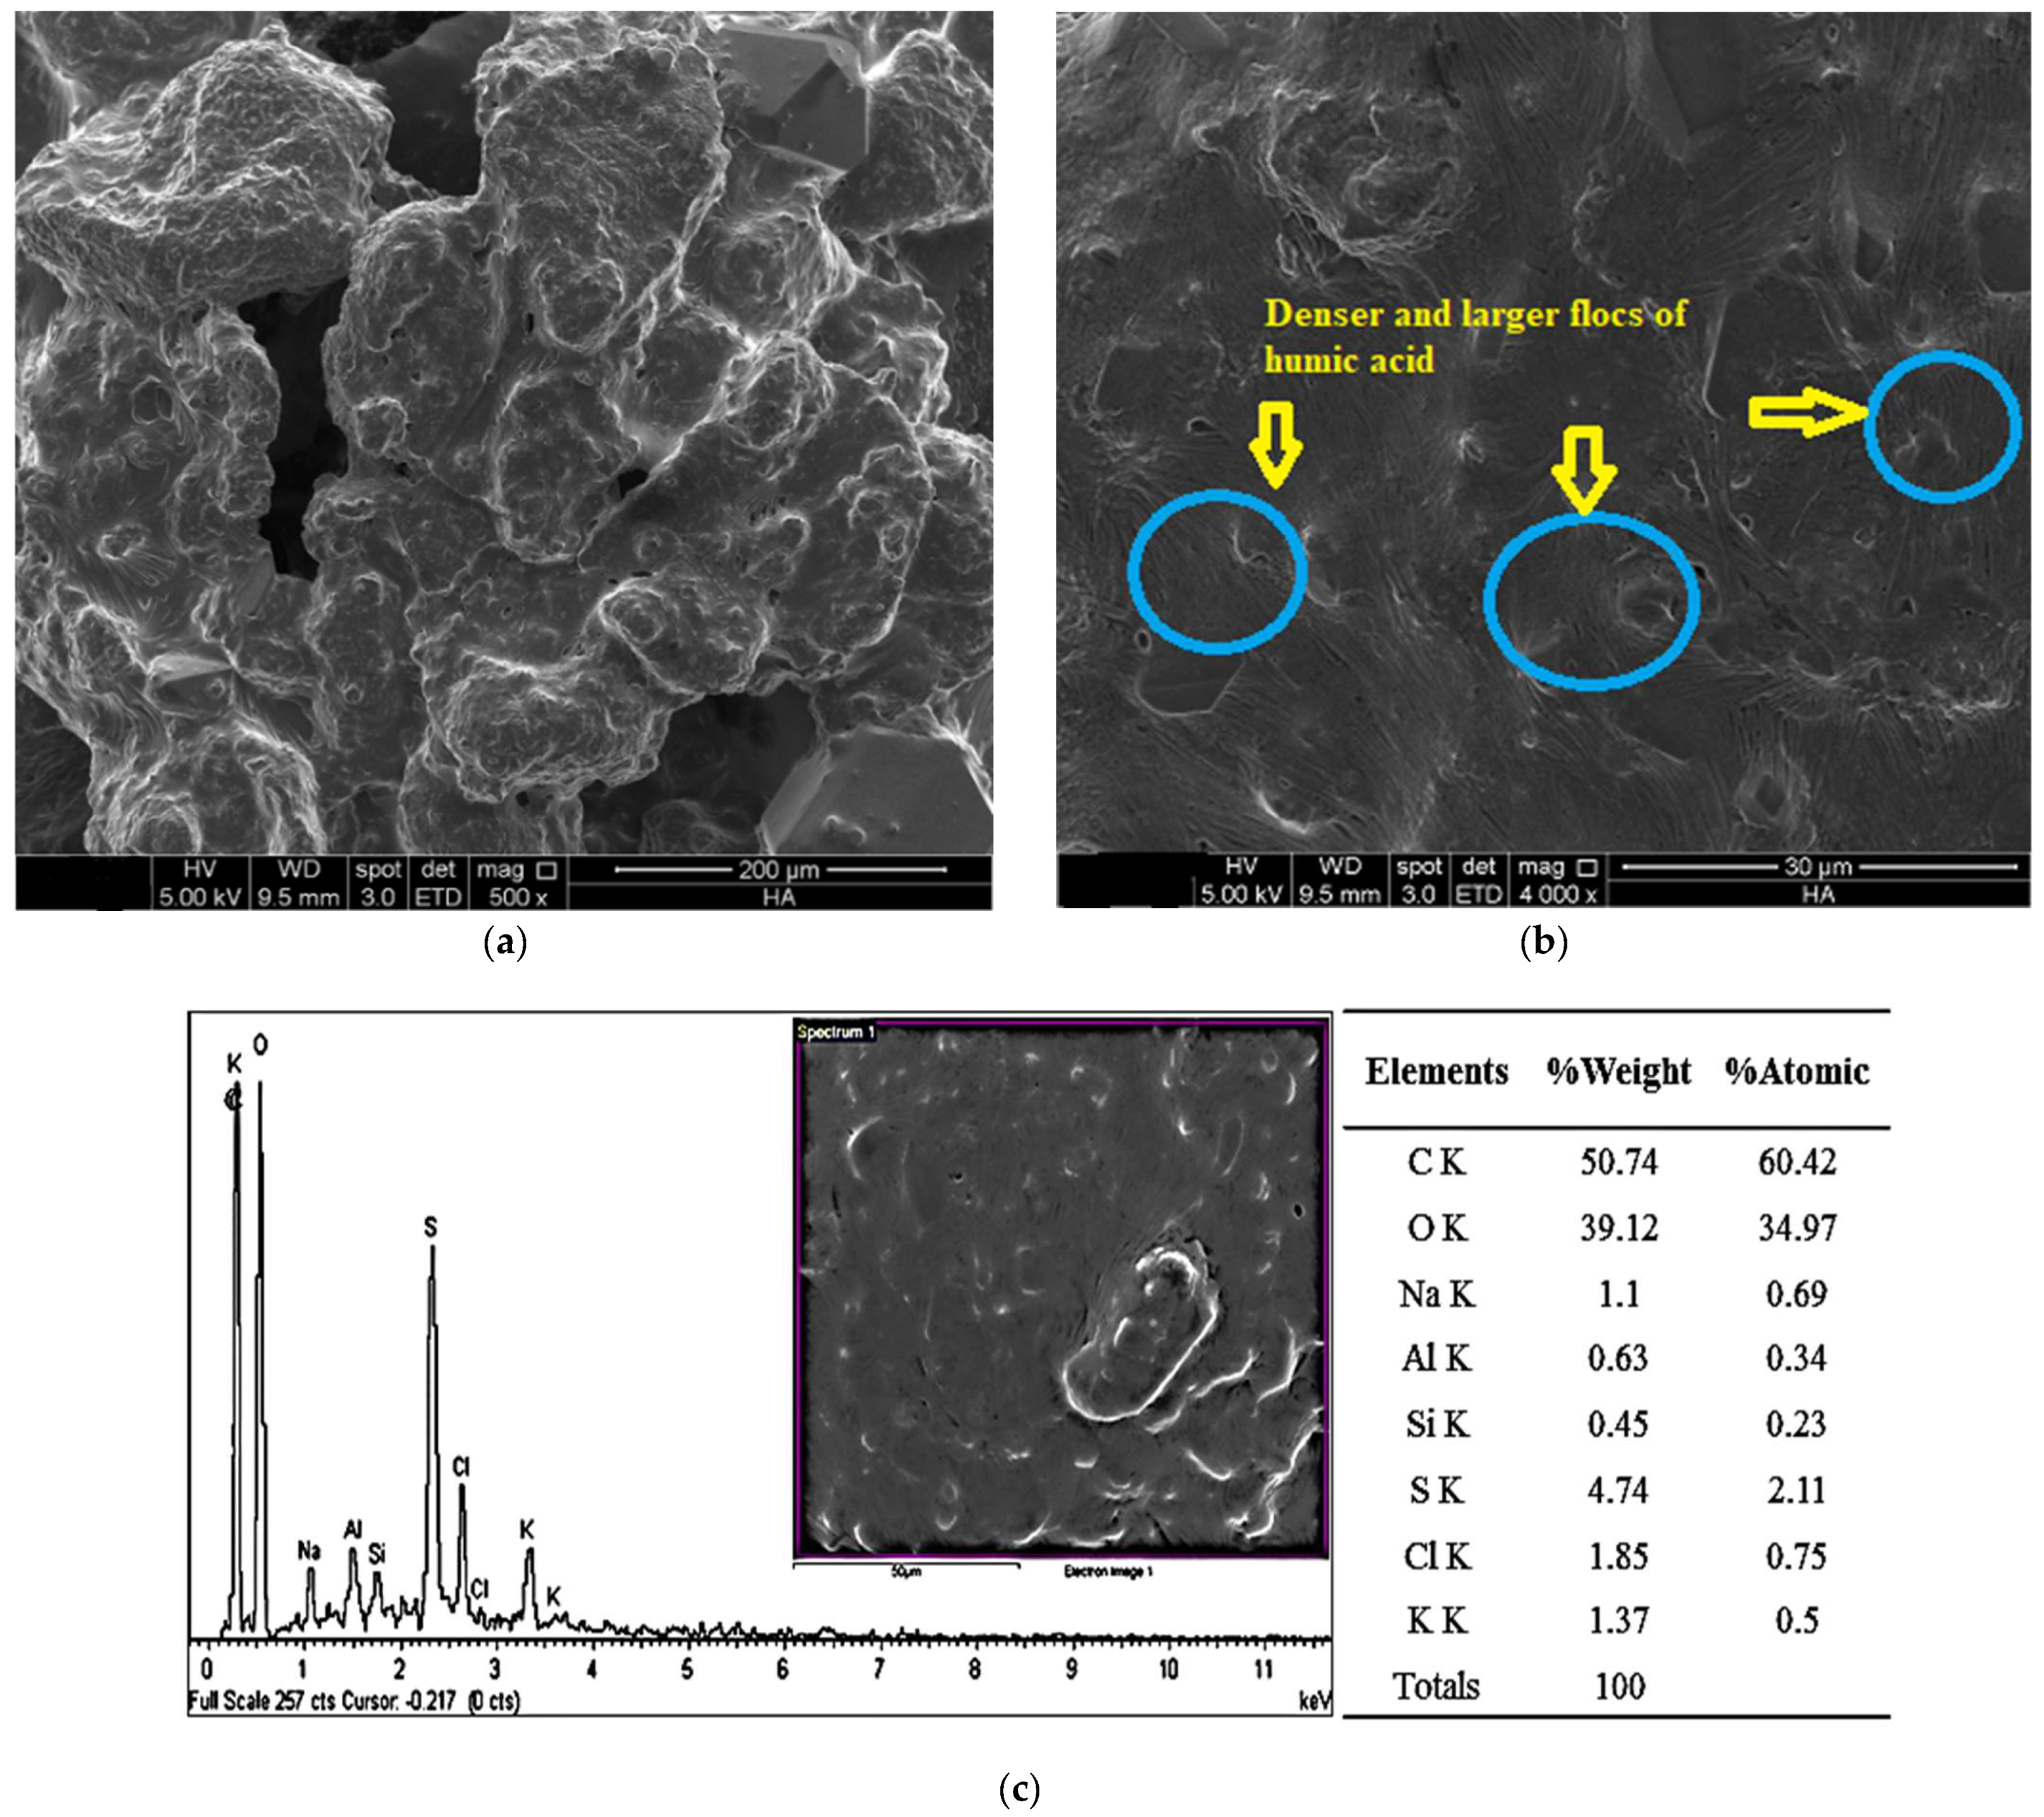
3.2. Microscopic Characterization of Isolated Humic Acid
Surface Morphology and EDX Analysis Outcomes
3.3. Spectroscopic Characterization of Isolated Humic Acid
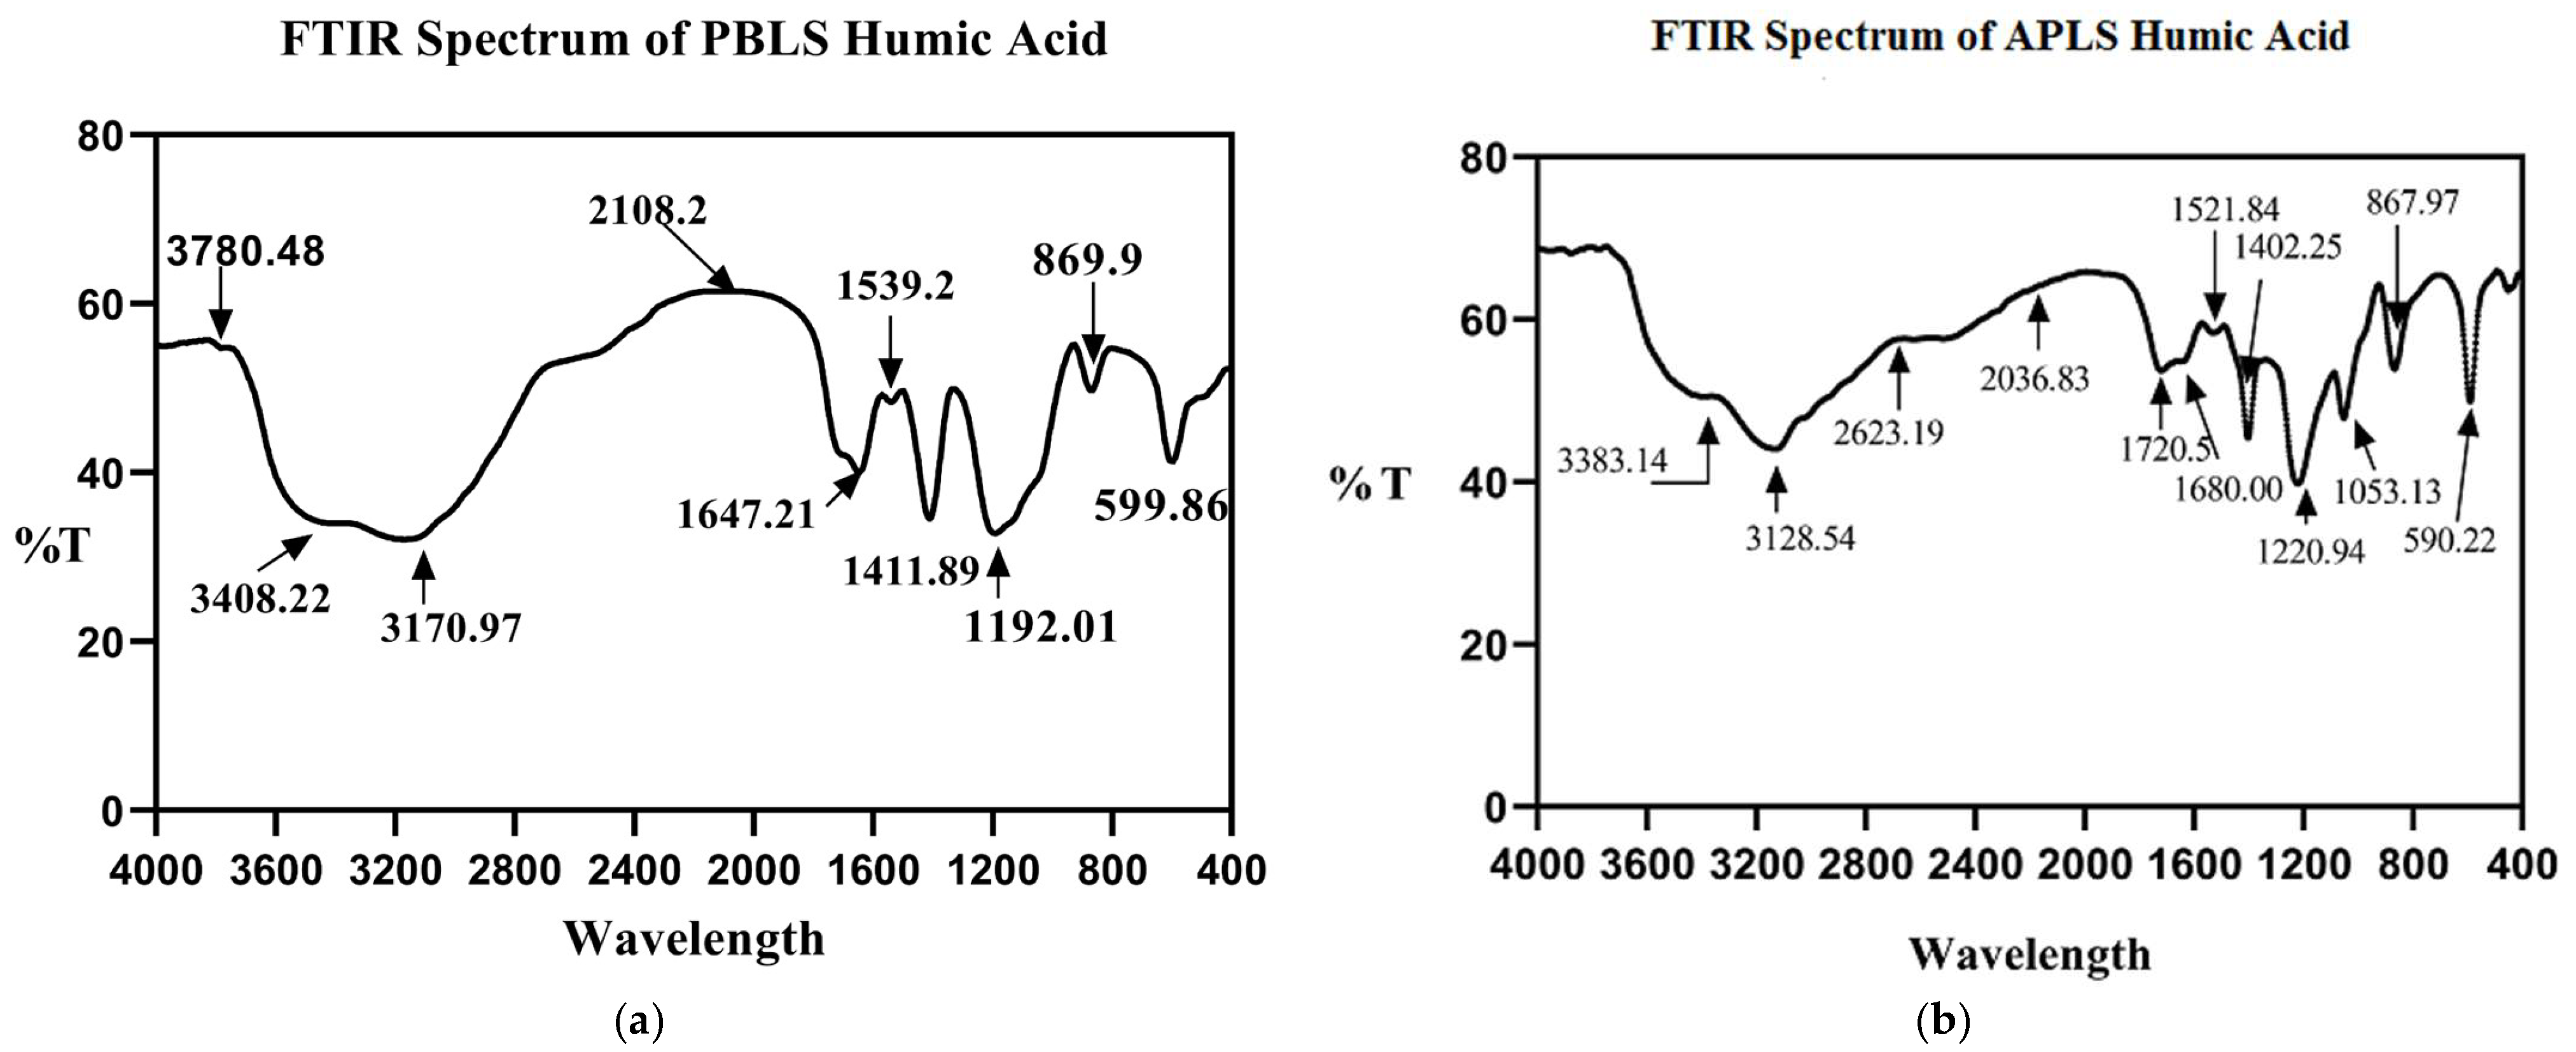
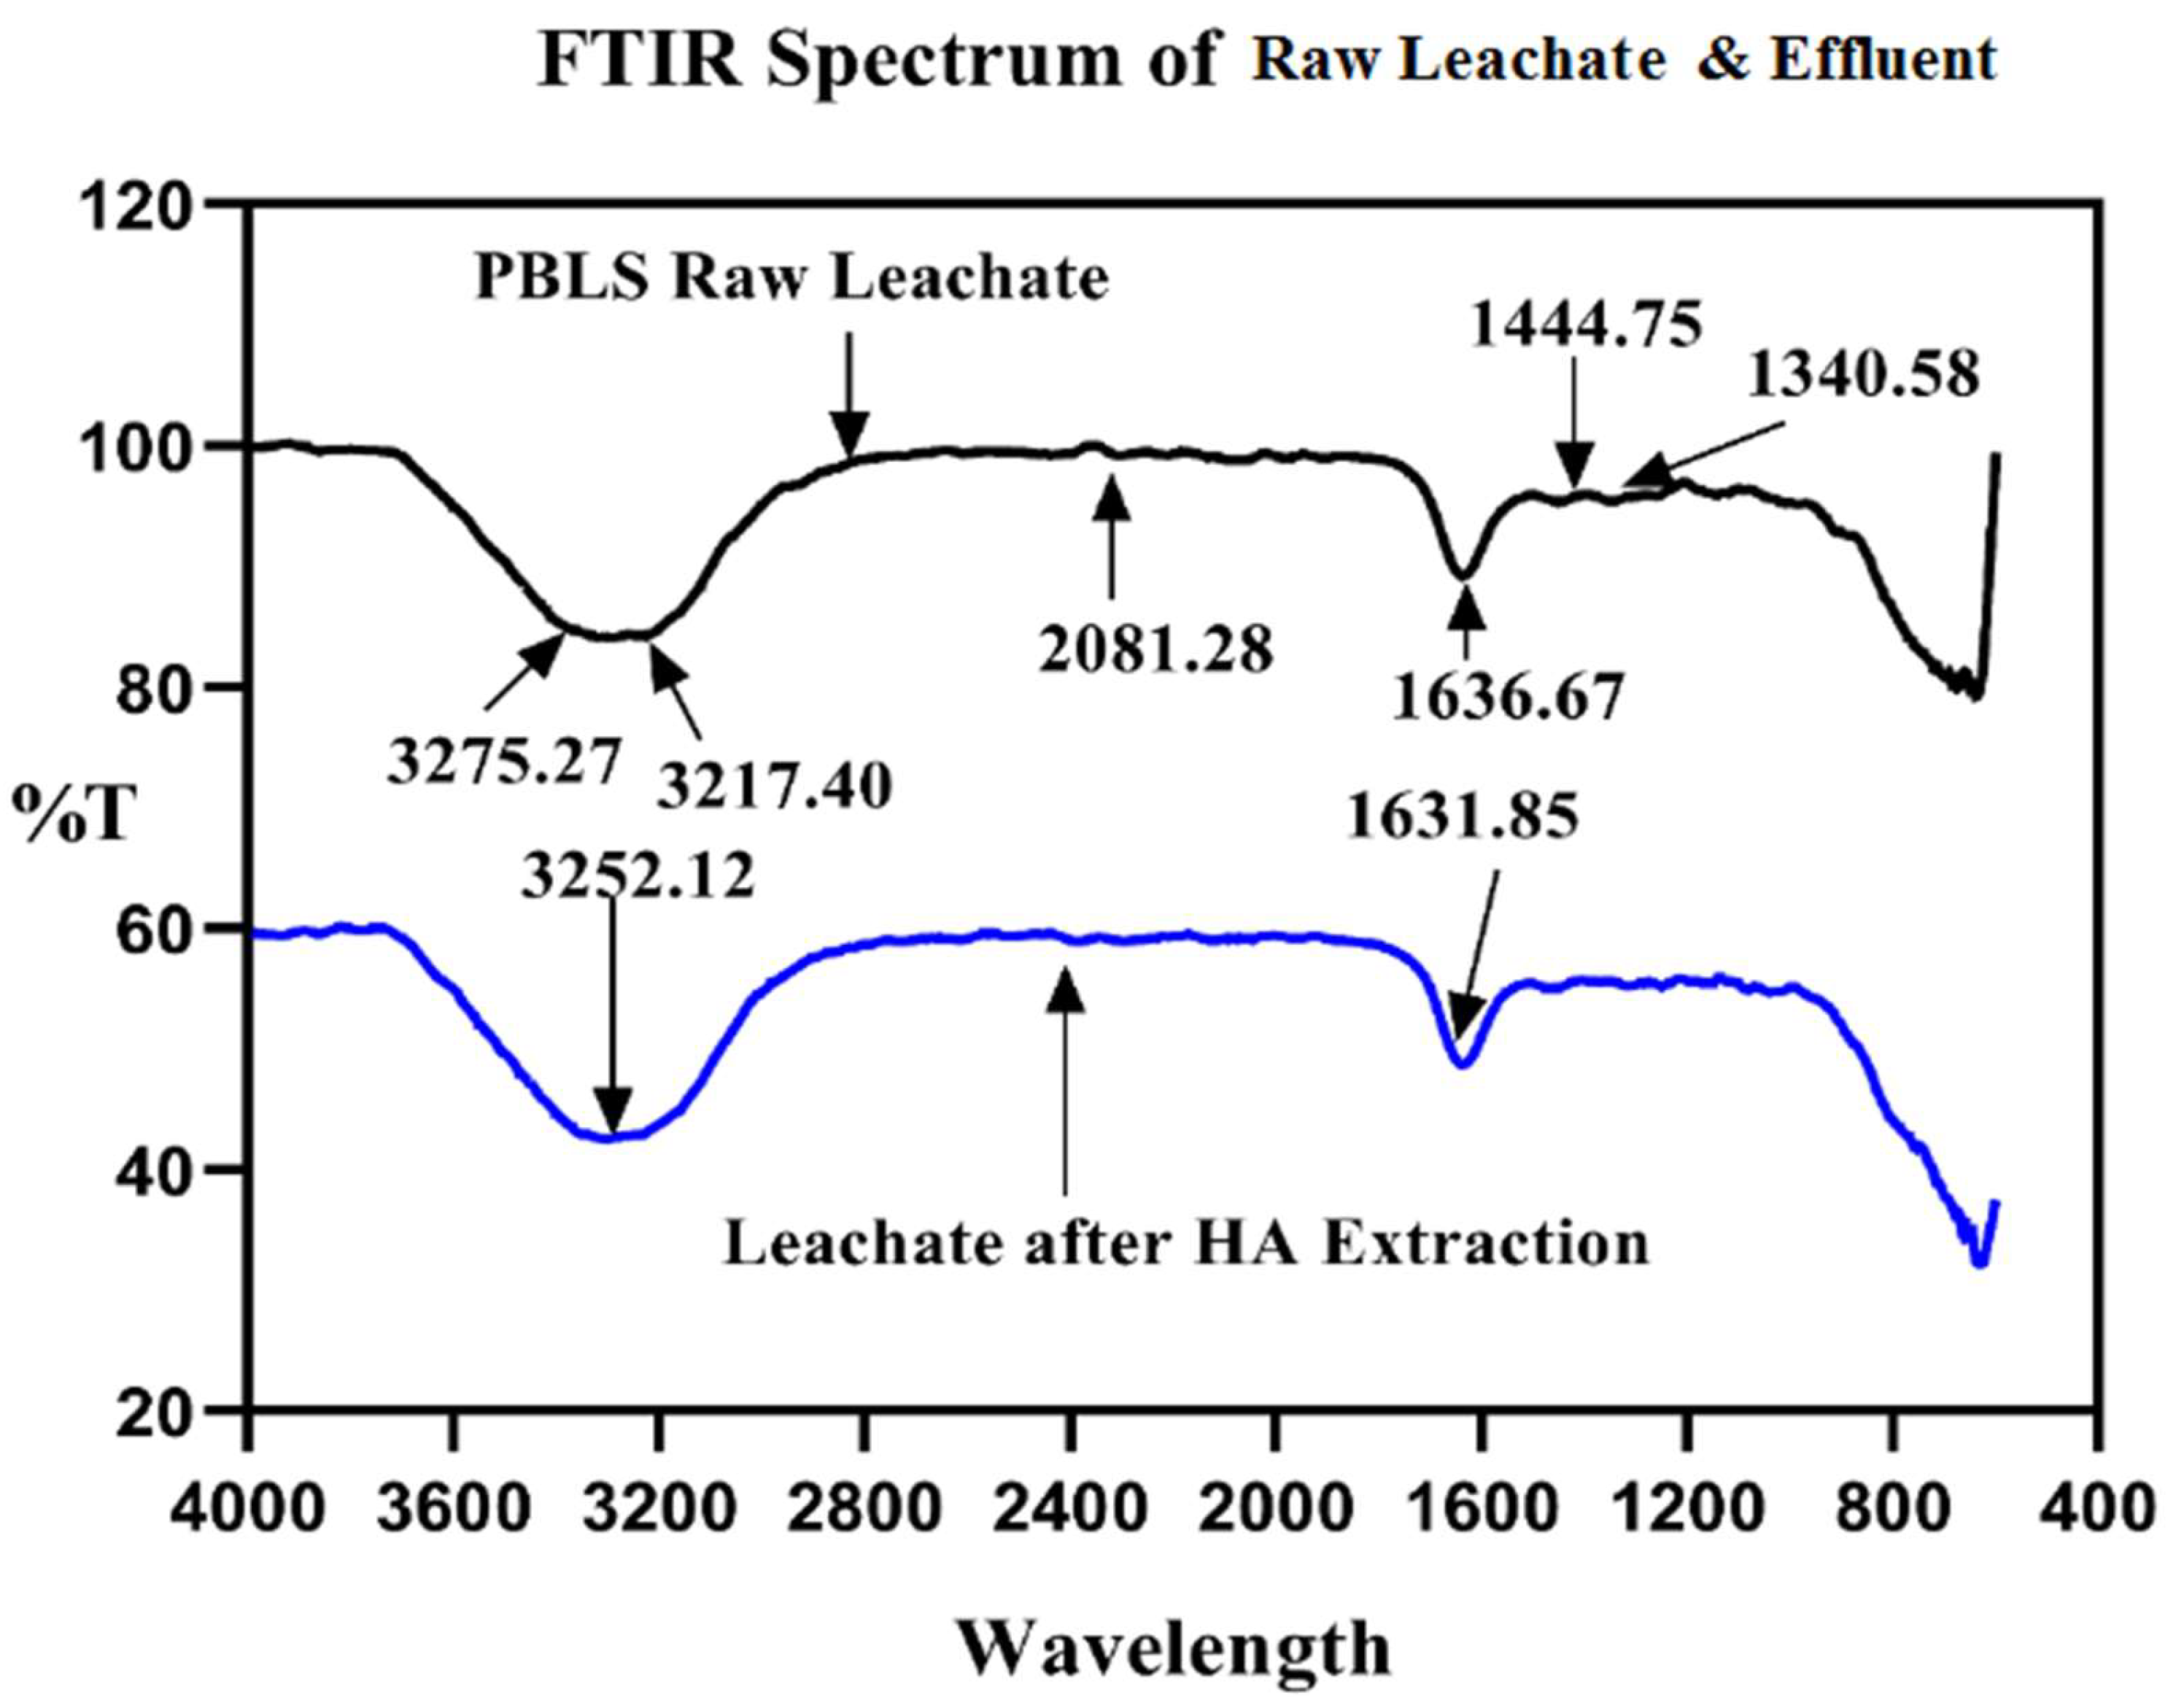
3.3.1. FTIR Analysis Outcomes
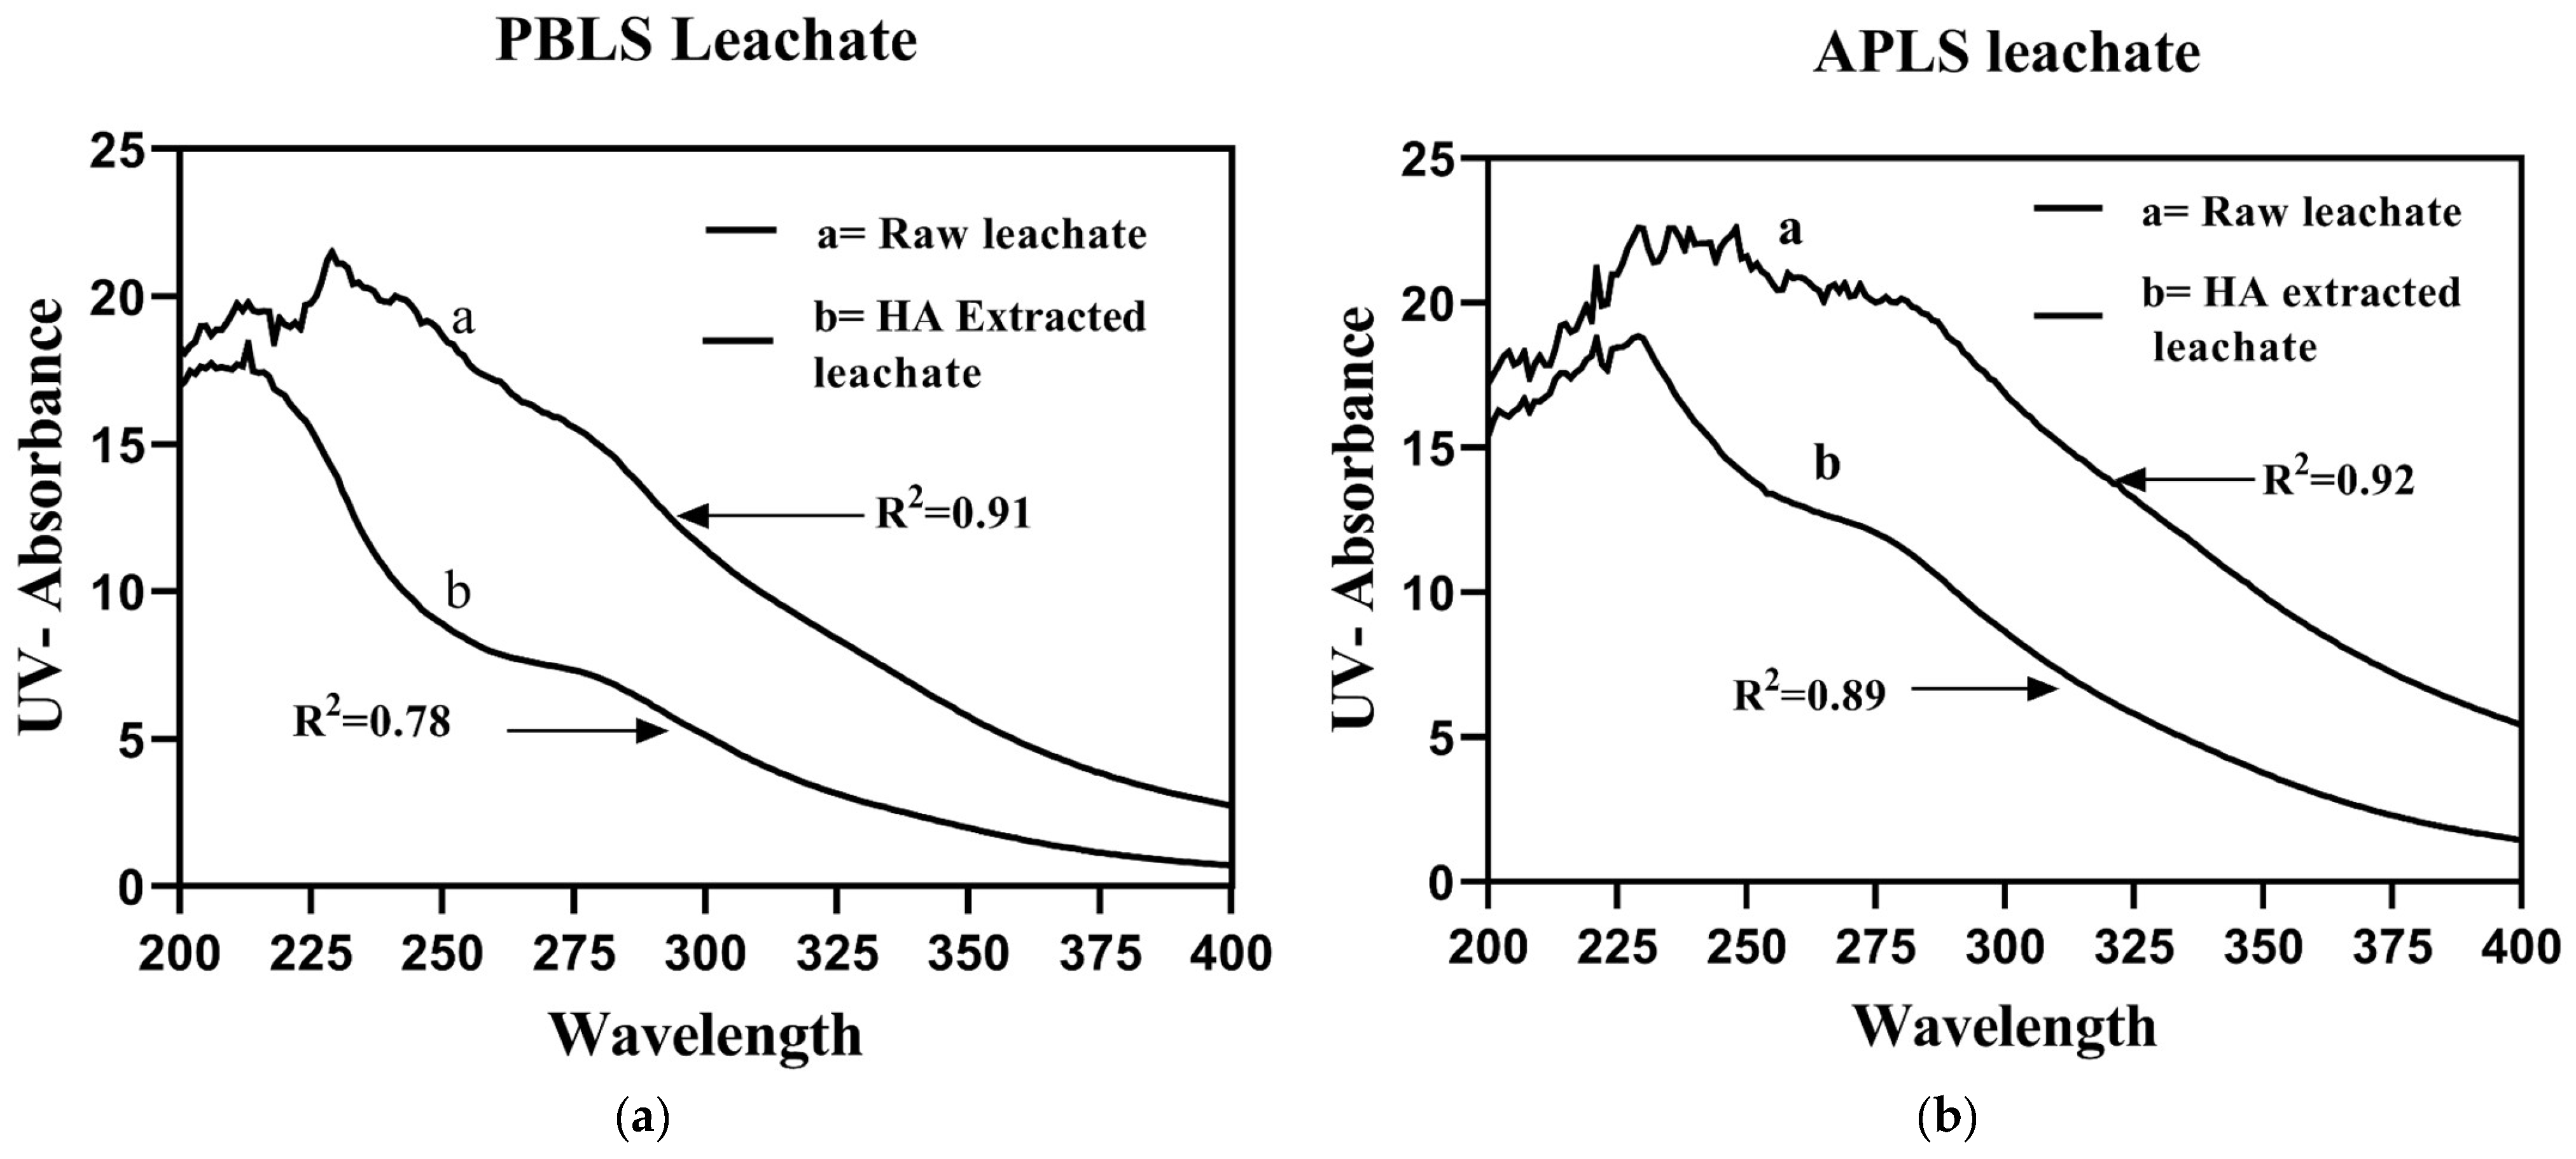
3.3.2. UV–Vis Spectrum Analysis
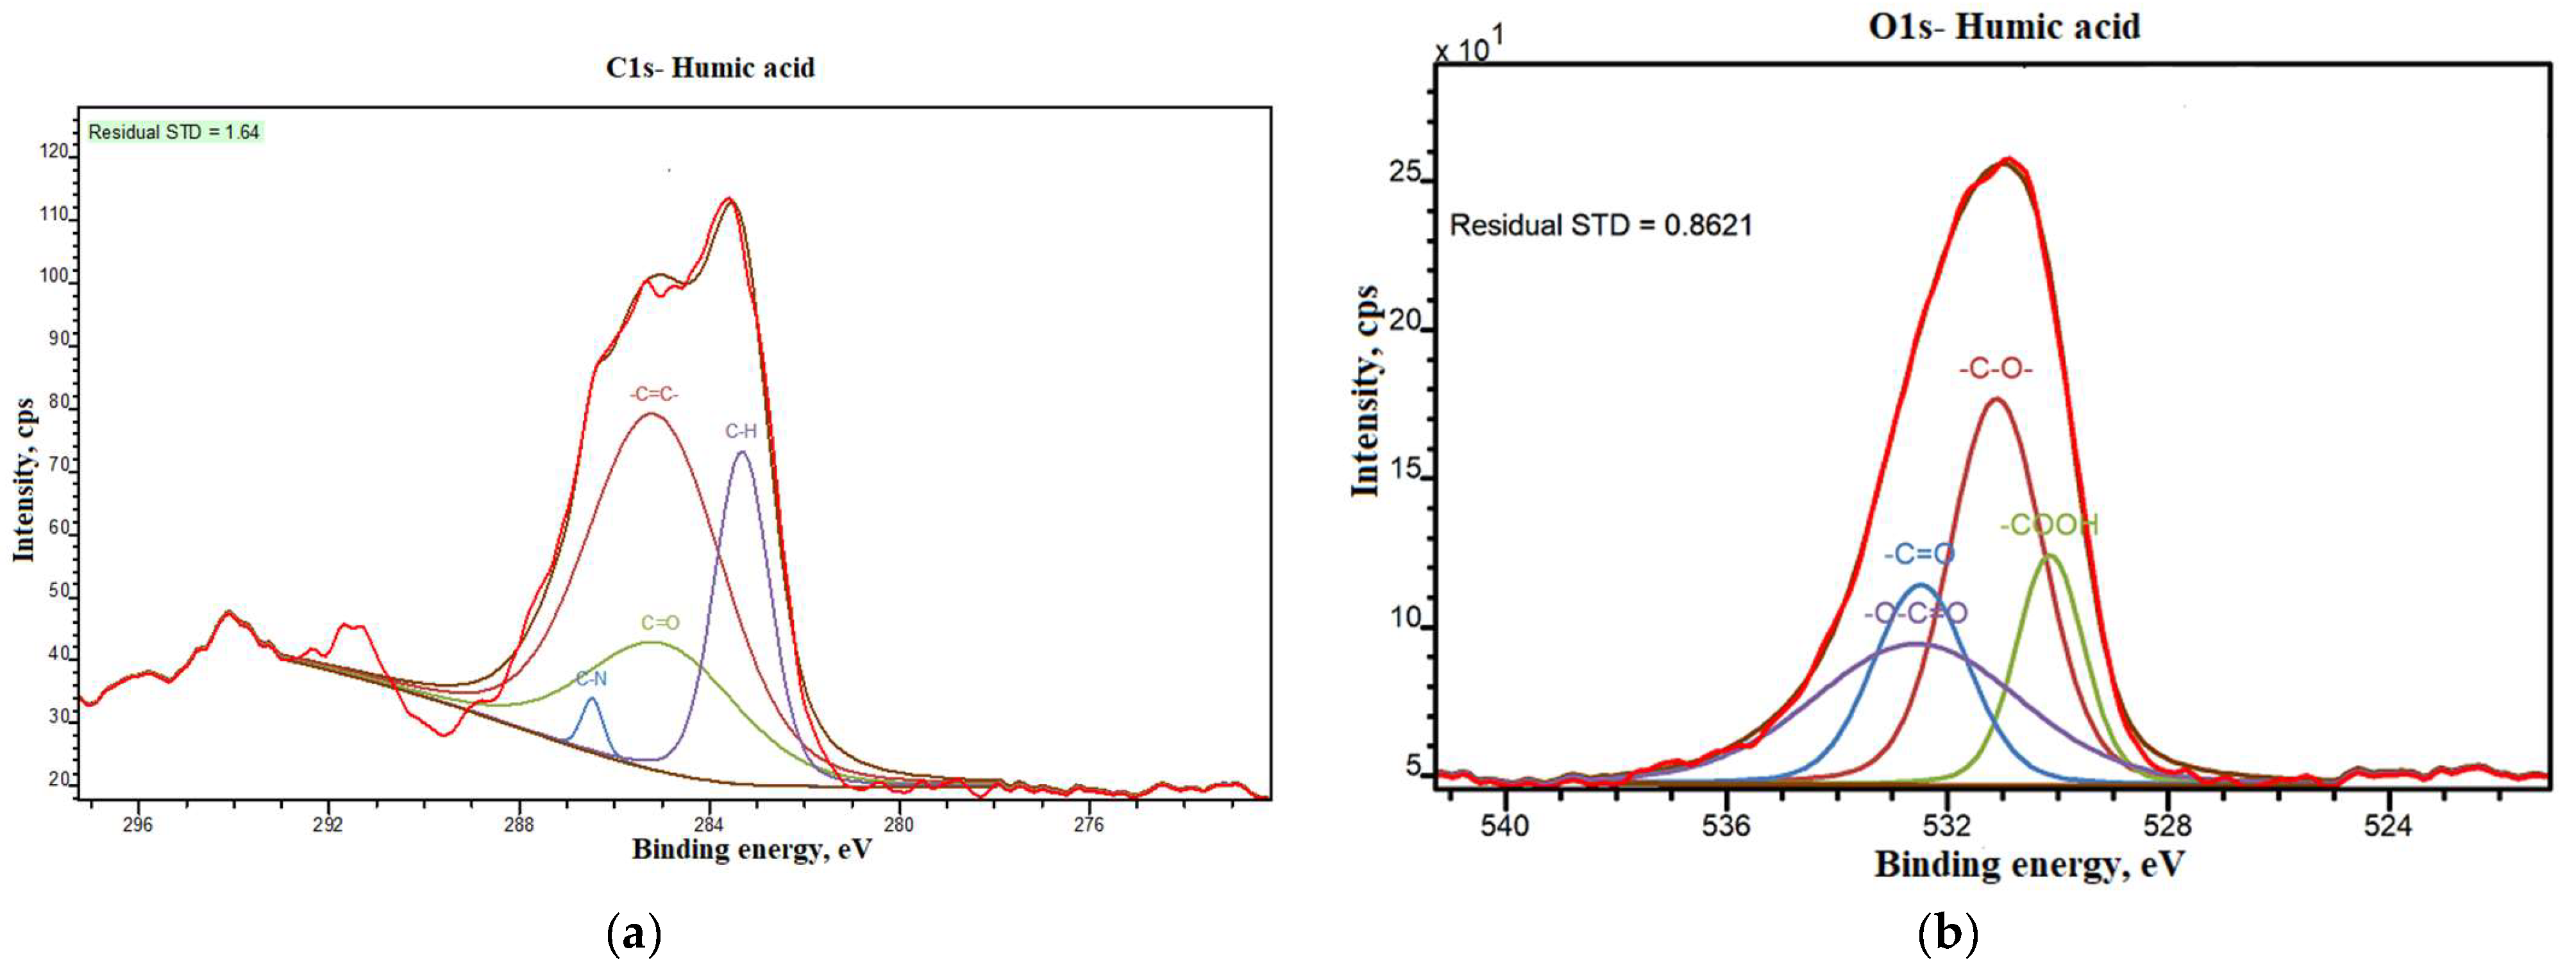
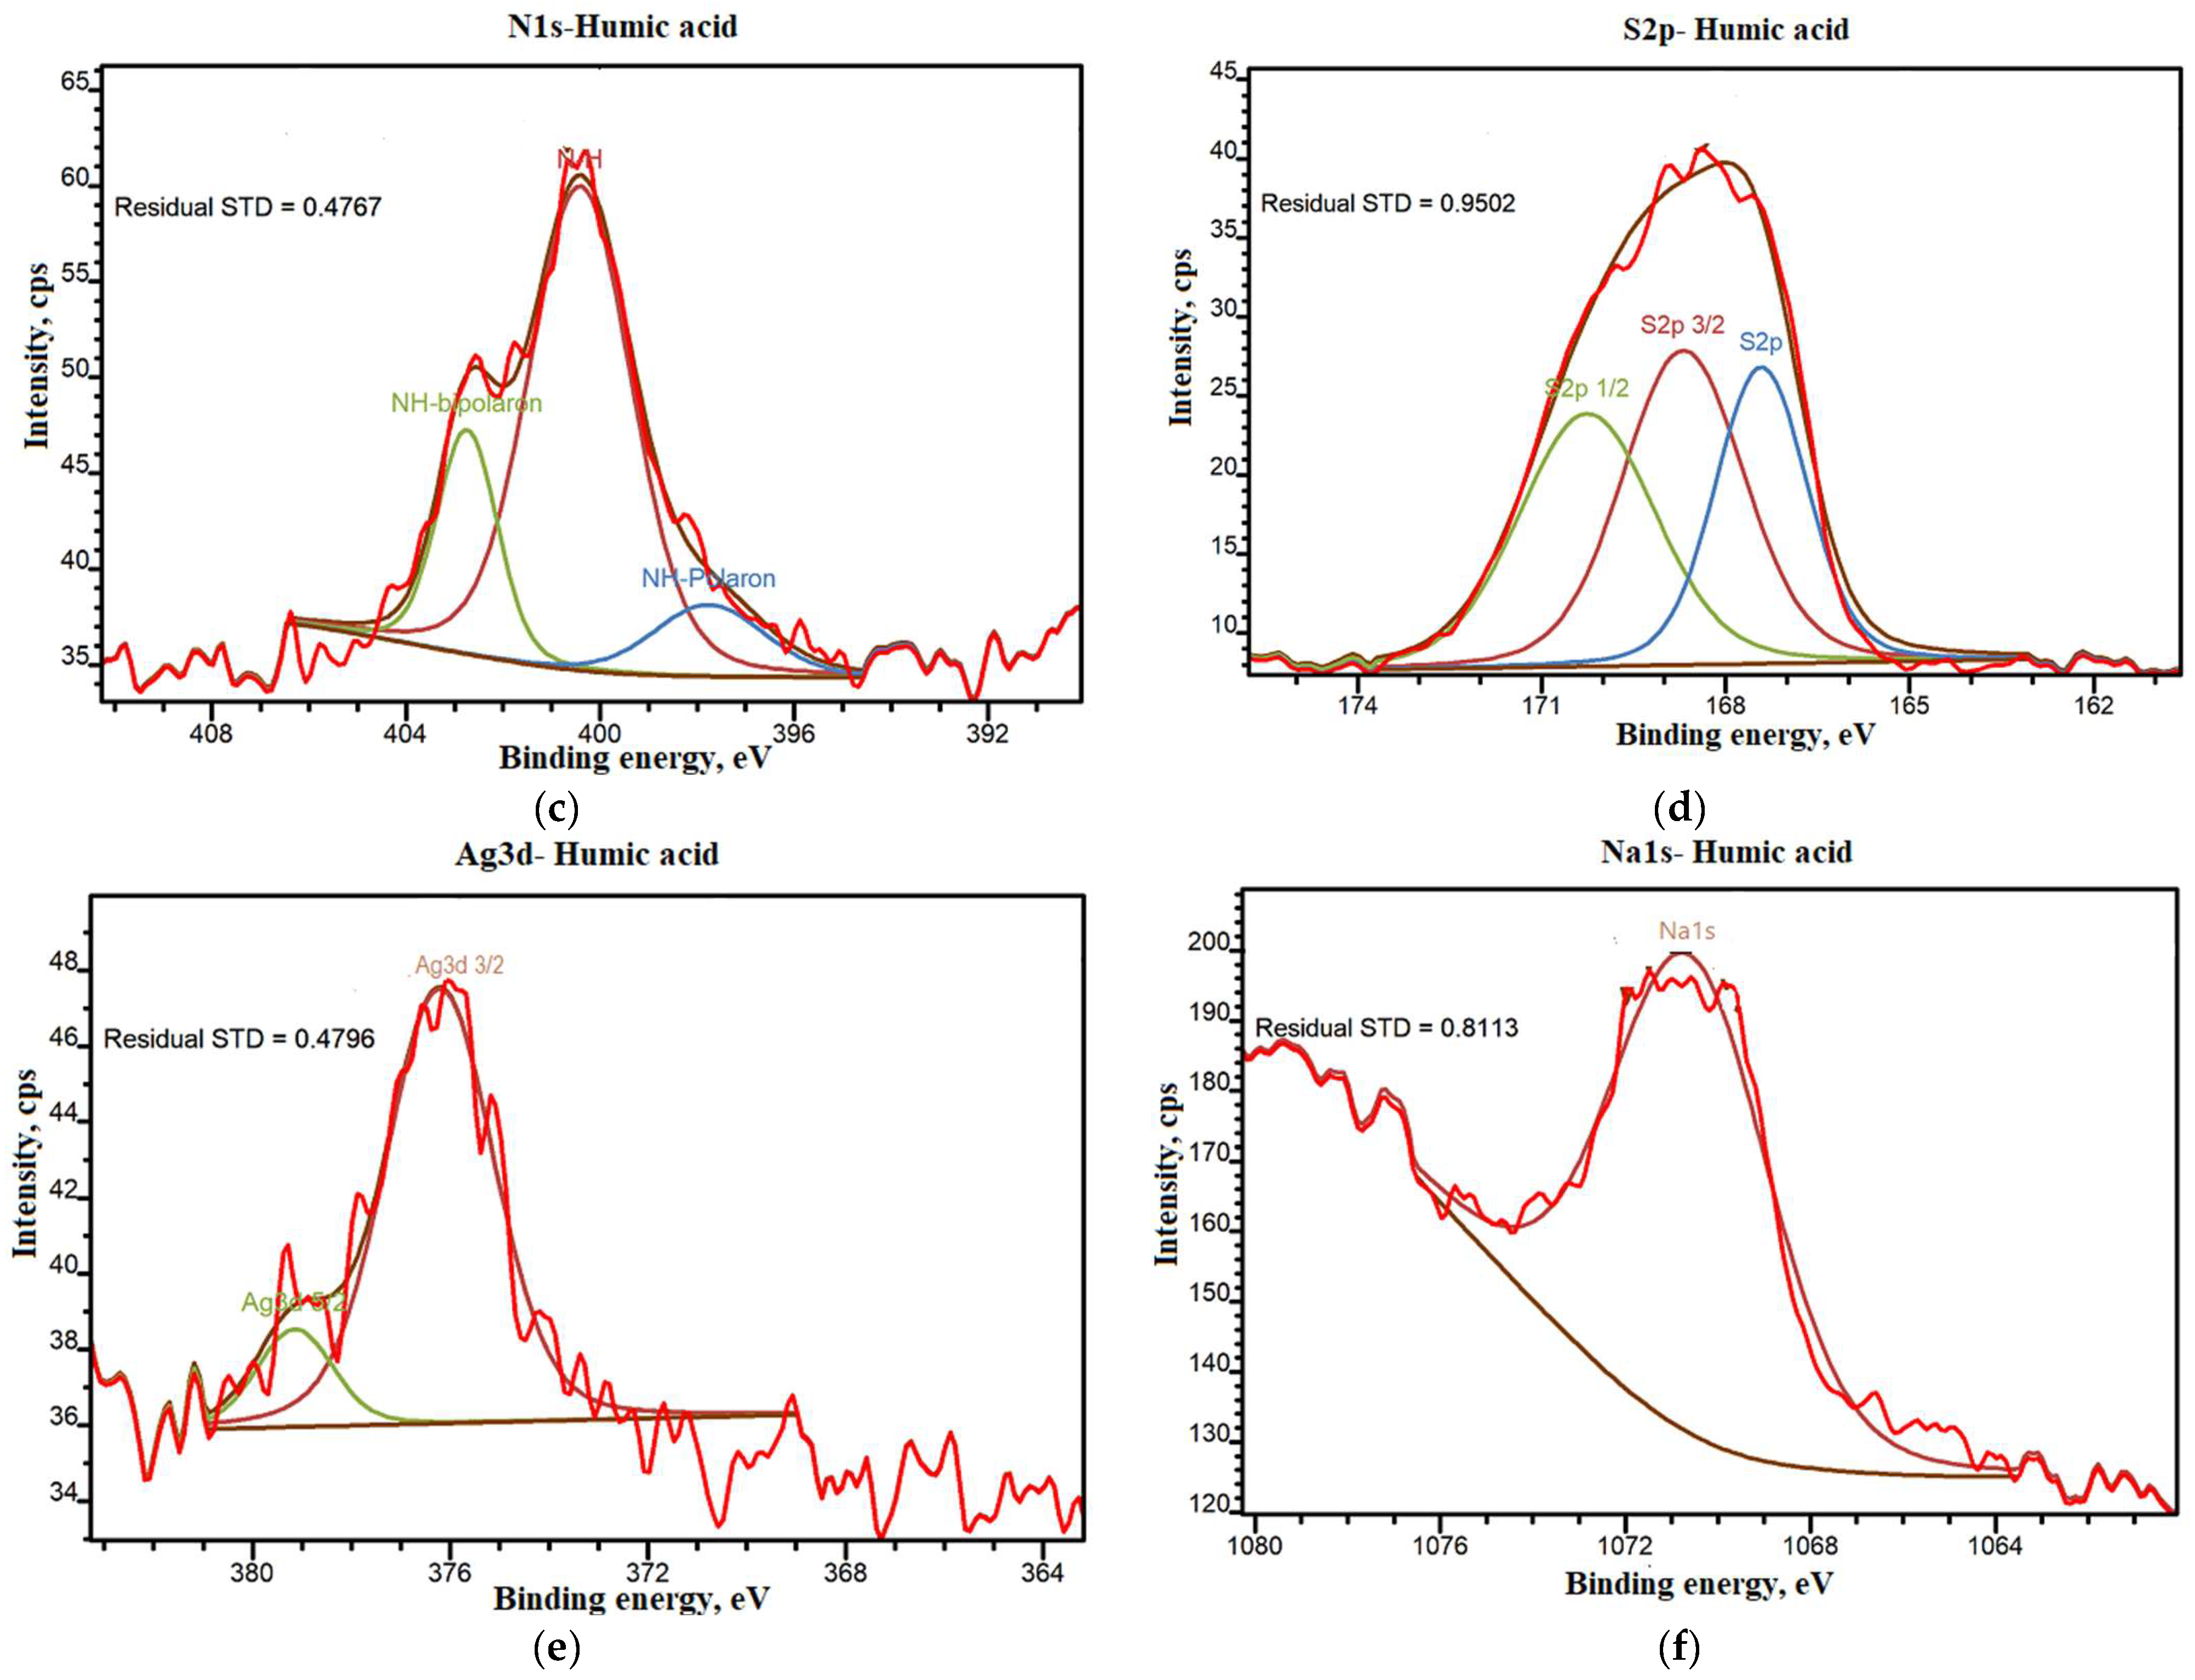
3.3.3. XPS Spectrum Analysis Outcomes
3.4. Humic Acid Contribution as a Major Pollutant

4. Conclusions
Author Contributions
Funding
Institutional Review Board Statement
Informed Consent Statement
Data Availability Statement
Acknowledgments
Conflicts of Interest
References
- Righetto, I.; Al-Juboori, R.A.; Kaljunen, J.U.; Mikola, A. Multipurpose treatment of landfill leachate using natural coagulants—Pretreatment for nutrient recovery and removal of heavy metals and micropollutants. J. Environ. Chem. Eng. 2021, 9, 105213. [Google Scholar] [CrossRef]
- Chen, W.; Zhang, A.; Jiang, G.; Li, Q. Transformation and degradation mechanism of landfill leachates in a combined process of SAARB and ozonation. Waste Manag. 2019, 85, 283–294. [Google Scholar] [CrossRef] [PubMed]
- Luo, H.; Zeng, Y.; Cheng, Y.; He, D.; Pan, X. Recent advances in municipal landfill leachate: A review focusing on its characteristics, treatment, and toxicity assessment. Sci. Total. Environ. 2019, 703, 135468. [Google Scholar] [CrossRef] [PubMed]
- Liu, X.; Novak, J.T.; He, Z. Removal of landfill leachate ultraviolet quenching substances by electricity induced humic acid precipitation and electrooxidation in a membrane electrochemical reactor. Sci. Total. Environ. 2019, 689, 571–579. [Google Scholar] [CrossRef]
- Song, Y.; Li, H.; Han, Y.; Lu, C.; Hou, Y.; Zhang, Y.; Guo, J. Landfill leachate as an additional substance in the Johannesburg-Sulfur autotrophic denitrification system in the treatment of municipal wastewater with low strength and low COD/TN ratio. Bioresour. Technol. 2019, 295, 122287. [Google Scholar] [CrossRef] [PubMed]
- Segundo, I.D.B.; Gomes, A.I.; Souza-Chaves, B.M.; Park, M.; dos Santos, A.B.; Boaventura, R.A.; Moreira, F.C.; Silva, T.F.; Vilar, V.J. Incorporation of ozone-driven processes in a treatment line for a leachate from a hazardous industrial waste landfill: Impact on the bio-refractory character and dissolved organic matter distribution. J. Environ. Chem. Eng. 2021, 9, 105554. [Google Scholar] [CrossRef]
- Jin, P.; Song, J.; Yang, L.; Jin, X.; Wang, X.C. Selective binding behavior of humic acid removal by aluminum coagulation. Environ. Pollut. 2018, 233, 290–298. [Google Scholar] [CrossRef]
- Iskander, S.; Novak, J.T.; He, Z. Reduction of reagent requirements and sludge generation in Fenton’s oxidation of landfill leachate by synergistically incorporating forward osmosis and humic acid recovery. Water Res. 2018, 151, 310–317. [Google Scholar] [CrossRef]
- Wang, H.; Cheng, Z.; Sun, Z.; Zhu, N.; Yuan, H.; Lou, Z.; Chen, X. Molecular insight into variations of dissolved organic matters in leachates along China’s largest A/O-MBR-NF process to improve the removal efficiency. Chemosphere 2019, 243, 125354. [Google Scholar] [CrossRef]
- De Almeida, R.; Couto, J.M.D.S.; Gouvea, R.M.; Oroski, F.D.A.; Bila, D.M.; Quintaes, B.R.; Campos, J.C. Nanofiltration applied to the landfill leachate treatment and preliminary cost estimation. Waste Manag. Res. J. Sustain. Circ. Econ. 2020, 38, 1119–1128. [Google Scholar] [CrossRef]
- Zielińska, M.; Kulikowska, D.; Stańczak, M. Adsorption—Membrane process for treatment of stabilized municipal landfill leachate. Waste Manag. 2020, 114, 174–182. [Google Scholar] [CrossRef] [PubMed]
- Hu, L.; Liu, Y.; Zeng, G.; Chen, G.; Wan, J.; Zeng, Y.; Wang, L.; Wu, H.; Xu, P.; Zhang, C.; et al. Organic matters removal from landfill leachate by immobilized Phanerochaete chrysosporium loaded with graphitic carbon nitride under visible light irradiation. Chemosphere 2017, 184, 1071–1079. [Google Scholar] [CrossRef] [PubMed]
- Li, Z.; Kechen, X.; Yongzhen, P. Composition characterization and transformation mechanism of refractory dissolved organic matter from an ANAMMOX reactor fed with mature landfill leachate. Bioresour. Technol. 2018, 250, 413–421. [Google Scholar] [CrossRef] [PubMed]
- Gu, N.; Liu, J.; Ye, J.; Chang, N.; Li, Y.-Y. Bioenergy, ammonia and humic substances recovery from municipal solid waste leachate: A review and process integration. Bioresour. Technol. 2019, 293, 122159. [Google Scholar] [CrossRef]
- Ahmed, Z.; Yusoff, M.S.; Kamal, N.H.M.; Aziz, H.A. Optimization of the humic acid separation and coagulation with natural starch by RSM for the removal of COD and colour from stabilized leachate. Waste Manag. Res. J. Sustain. Circ. Econ. 2021, 39, 1396–1405. [Google Scholar] [CrossRef]
- Zakaria, S.N.F.; Aziz, H.A. Characteristic of leachate at Alor Pongsu Landfill Site, Perak, Malaysia: A comparative study. IOP Conf. Ser. Earth Environ. Sci. 2018, 140, 012013. [Google Scholar] [CrossRef]
- Reis, B.G.; Silveira, A.L.; Teixeira, L.P.T.; Okuma, A.A.; Lange, L.C.; Amaral, M.C.S. Organic compounds removal and toxicity reduction of landfill leachate by commercial bakers’ yeast and conventional bacteria based membrane bioreactor integrated with nanofiltration. Waste Manag. 2017, 70, 170–180. [Google Scholar] [CrossRef]
- Yusoff, M.S.; Aziz, H.A.; Alazaiza, M.Y.D.; Rui, L.M. Potential use of oil palm trunk starch as coagulant and coagulant aid in semi-aerobic landfill leachate treatment. Water Qual. Res. J. 2019, 54, 203–219. [Google Scholar] [CrossRef]
- Liu, Z.; Wu, W.; Shi, P.; Guo, J.; Cheng, J. Characterization of dissolved organic matter in landfill leachate during the combined treatment process of air stripping, Fenton, SBR and coagulation. Waste Manag. 2015, 41, 111–118. [Google Scholar] [CrossRef]
- Dia, O.; Drogui, P.; Buelna, G.; Dubé, R.; Ihsen, B.S. Electrocoagulation of bio-filtrated landfill leachate: Fractionation of organic matter and influence of anode materials. Chemosphere 2017, 168, 1136–1141. [Google Scholar] [CrossRef]
- Tahiri, A.; Richel, A.; Destain, J.; Druart, P.; Thonart, P.; Ongena, M. Comprehensive comparison of the chemical and structural characterization of landfill leachate and leonardite humic fractions. Anal. Bioanal. Chem. 2016, 408, 1917–1928. [Google Scholar] [CrossRef]
- Liu, Z.; Li, X.; Rao, Z.; Hu, F. Treatment of landfill leachate biochemical effluent using the nano-Fe 3 O 4 /Na 2 S 2 O 8 system: Oxidation performance, wastewater spectral analysis, and activator characterization. J. Environ. Manag. 2018, 208, 159–168. [Google Scholar] [CrossRef]
- Bolyard, S.C.; Reinhart, D.R.; Richardson, D. Conventional and fourier transform infrared characterization of waste and leachate during municipal solid waste stabilization. Chemosphere 2019, 227, 34–42. [Google Scholar] [CrossRef] [PubMed]
- Liu, X.; Pang, H.; Liu, X.; Li, Q.; Zhang, N.; Mao, L.; Qiu, M.; Hu, B.; Yang, H.; Wang, X. Orderly Porous Covalent Organic Frameworks-based Materials: Superior Adsorbents for Pollutants Removal from Aqueous Solutions. Innovation 2021, 2, 100076. [Google Scholar] [CrossRef] [PubMed]
- Cornette, P.; Zanna, S.; Seyeux, A.; Costa, D.; Marcus, P. The native oxide film on a model aluminium-copper alloy studied by XPS and ToF-SIMS. Corros. Sci. 2020, 174, 108837. [Google Scholar] [CrossRef]
- Antony, J.; Niveditha, S.; Gandhimathi, R.; Ramesh, S.; Nidheesh, P. Stabilized landfill leachate treatment by zero valent aluminium-acid system combined with hydrogen peroxide and persulfate based advanced oxidation process. Waste Manag. 2020, 106, 1–11. [Google Scholar] [CrossRef] [PubMed]
- Tejera, J.; Miranda, R.; Hermosilla, D.; Urra, I.; Negro, C. Treatment of a Mature Landfill Leachate: Comparison between Homogeneous and Heterogeneous Photo-Fenton with Different Pretreatments. Water 2019, 11, 1849. [Google Scholar] [CrossRef]
- Ferraz, F.; Bruni, A.; Povinelli, J.; Vieira, E. Leachate/domestic wastewater aerobic co-treatment: A pilot-scale study using multivariate analysis. J. Environ. Manag. 2016, 166, 414–419. [Google Scholar] [CrossRef]
- Yang, S.; Xu, Y.; Liu, C.; Huang, L.; Huang, Z.; Li, H. The anionic flotation of fluorite from barite using gelatinized starch as the depressant. Colloids Surf. A Physicochem. Eng. Asp. 2020, 597, 124794. [Google Scholar] [CrossRef]
- Chen, H.; Li, Q.; Wang, M.; Ji, D.; Tan, W. XPS and two-dimensional FTIR correlation analysis on the binding characteristics of humic acid onto kaolinite surface. Sci. Total. Environ. 2020, 724, 138154. [Google Scholar] [CrossRef]
- Shi, M.; Zhao, Z.; Song, Y.; Xu, M.; Li, J.; Yao, L. A novel heat-treated humic acid/MgAl-layered double hydroxide composite for efficient removal of cadmium: Fabrication, performance and mechanisms. Appl. Clay Sci. 2020, 187, 105482. [Google Scholar] [CrossRef]
- Zhang, S.; Dang, J.; Lin, J.; Liu, M.; Zhang, M.; Chen, S. Selective enrichment and separation of Ag(I) from electronic waste leachate by chemically modified persimmon tannin. J. Environ. Chem. Eng. 2020, 9, 104994. [Google Scholar] [CrossRef]
- Bhatnagar, A.; Sillanpää, M. Removal of natural organic matter (NOM) and its constituents from water by adsorption—A review. Chemosphere 2017, 166, 497–510. [Google Scholar] [CrossRef]
- Fantauzzi, M.; Elsener, B.; Atzei, D.; Rigoldi, A.; Rossi, A. Exploiting XPS for the identification of sulfides and polysulfides. RSC Adv. 2015, 5, 75953–75963. [Google Scholar] [CrossRef]
- Wdowczyk, A.; Szymańska-Pulikowska, A. Analysis of the possibility of conducting a comprehensive assessment of landfill leachate contamination using physicochemical indicators and toxicity test. Ecotoxicol. Environ. Saf. 2021, 221, 112434. [Google Scholar] [CrossRef]
- Boumaiza, H.; Renard, A.; Robinson, M.R.; Kervern, G.; Vidal, L.; Ruby, C.; Bergaoui, L.; Coustel, R. A multi-technique approach for studying Na triclinic and hexagonal birnessites. J. Solid State Chem. 2019, 272, 234–243. [Google Scholar] [CrossRef]
- Shi, Y.; Wells, G.; Morgenroth, E. Microbial activity balance in size fractionated suspended growth biomass from full-scale sidestream combined nitritation-anammox reactors. Bioresour. Technol. 2016, 218, 38–45. [Google Scholar] [CrossRef]
- Roulia, M. Humic Substances: A Novel Eco-Friendly Fertilizer. Agronomy 2022, 12, 754. [Google Scholar] [CrossRef]
- Roulia, M.; Vassiliadis, A.A. Water purification by potassium humate–C.I. Basic Blue 3 adsorption-based interactions. Agronomy 2021, 11, 1625. [Google Scholar] [CrossRef]


| Objects | Wavelength | Apparent Binding Status and Vibrational Assignment | Functional Groups |
|---|---|---|---|
| HA extracted from PBLS | 3780.48 cm−1 | Hydrogen bonded with O-H or N-H vibration | Alcohols, phenols |
| 3408.22 cm−1 | N-H bend | Secondary amines | |
| 3170.97 cm−1 | C-H stretching in -COOH | Carboxylic acids and 1°, 2° amines | |
| 2623.19 | O-H stretch (hydrogen-bonded, which can conceal other peaks within this region.) | Carboxylic acids groups (always cover the entire region with identically wide peaks) | |
| 2108.2 cm−1 | C-C stretch | Alkynes | |
| 1647.21 cm−1 | C-C=C and C=O stretch | Alkenes, ketones | |
| 1539.2 cm−1 | N-H bending vibration, N=O stretch | 2° Amide and nitro groups | |
| 1411.89 cm−1 | O-H vibration, C-C stretch | Aromatics, carboxylic | |
| 1192.01 cm−1 | C-O asymmetric vibration, C-H wag | Alcohols, phenol, esters, alkyl halides | |
| 1053.13 | C-O stretch/C-O-C stretch | Esters, ethers | |
| 869.9 cm−1 | N-H stretch or C-H bending vibration, =C-H and =CH2 bend | Aromatics, alkenes | |
| 599.86 cm−1 | C-Br and C-I stretch | Alkyl halides | |
| HA extracted from APLS | 3770.84 | Hydrogen bonded with O-H or N-H vibration | Alcohols, phenols |
| 3383.14 | N-H bend | Secondary amines | |
| 3128.54 | C-H stretching in -COOH | Carboxylic acids and 1°, 2° amines | |
| 2515.18 | O-H stretch | -COOH | |
| 1720.5 | C=O stretch | Carboxylic acids groups | |
| 1680 | C=O stretch | Carbonyl group | |
| 1639.49 | C=O stretch | Ketonic groups | |
| 1521.84 | N=O stretch | Nitro groups | |
| 1402.25 | S=O stretch | Sulfate groups | |
| 1220.94 | C-O stretch/C-O-C stretch | Alcohols, esters, ethers | |
| 867.97 | =C-H and =CH2 bend | Alkenes |
| UV-Absorbance | PBLS | APLS | ||||
|---|---|---|---|---|---|---|
| Raw Leachate | Humic-Acid-Extracted Leachate | % Removal | Raw Leachate | Humic-Acid-Extracted Leachate | % Removal | |
| UV254 (E2) | 18.995 | 11.975 | 37.01% | 20.975 | 13.425 | 36.00% |
| UV280 (E280) | 14.945 | 9.12 | 39.05% | 20.165 | 11.57 | 42.62% |
| UV365 (E3) | 4.495 | 2.41 | 46.08% | 8.16 | 4.19 | 48.6% |
| E2/E3 | 4.22 | 4.96 | --- | 2.57 | 3.2 | --- |
| PBLS | APLS | |||
|---|---|---|---|---|
| Color (Pt-Co) | COD (mg/L) | Color (Pt-Co) | COD (mg/L) | |
| Raw leachate | 4139 | 3120 | 5367 | 3635 |
| HA extracted leachate | 2524.79 | 1996.8 | 3005.52 | 2206.44 |
| % Removal | 39% | 36% | 44.02% | 39.30% |
Disclaimer/Publisher’s Note: The statements, opinions and data contained in all publications are solely those of the individual author(s) and contributor(s) and not of MDPI and/or the editor(s). MDPI and/or the editor(s) disclaim responsibility for any injury to people or property resulting from any ideas, methods, instructions or products referred to in the content. |
© 2023 by the authors. Licensee MDPI, Basel, Switzerland. This article is an open access article distributed under the terms and conditions of the Creative Commons Attribution (CC BY) license (https://creativecommons.org/licenses/by/4.0/).
Share and Cite
Ahmed, Z.; Yusoff, M.S.; Mokhtar Kamal, N.H.; Abdul Aziz, H.; Roulia, M. Spectroscopic and Microscopic Analysis of Humic Acid Isolated from Stabilized Leachate HSs Fractionation. Agronomy 2023, 13, 1160. https://doi.org/10.3390/agronomy13041160
Ahmed Z, Yusoff MS, Mokhtar Kamal NH, Abdul Aziz H, Roulia M. Spectroscopic and Microscopic Analysis of Humic Acid Isolated from Stabilized Leachate HSs Fractionation. Agronomy. 2023; 13(4):1160. https://doi.org/10.3390/agronomy13041160
Chicago/Turabian StyleAhmed, Zaber, Mohd Suffian Yusoff, Nurul Hana Mokhtar Kamal, Hamidi Abdul Aziz, and Maria Roulia. 2023. "Spectroscopic and Microscopic Analysis of Humic Acid Isolated from Stabilized Leachate HSs Fractionation" Agronomy 13, no. 4: 1160. https://doi.org/10.3390/agronomy13041160