Article

A Framework Combining CENTURY Modeling and Chronosequences Sampling to Estimate Soil Organic Carbon Stock in an Agricultural Region with Large Land Use Change

1
School of Information Engineering, Jiangsu Vocational College of Agriculture and Forestry, Jurong 212400, China
2
College of Plant Protection, Yangzhou University, Yangzhou 225009, China
3
Institute of Agricultural Information, Jiangsu Academy of Agricultural Sciences, Nanjing 210014, China
4
State Key Laboratory of Soil and Sustainable Agriculture, Institute of Soil Science, Chinese Academy of Sciences, Nanjing 210008, China
5
School of Agricultural Engineering, Jiangsu University, Zhenjiang 212013, China
6
School of Geomatics, Anhui University of Science and Technology, Huainan 232001, China
*
Author to whom correspondence should be addressed.
Agronomy 2023, 13(4), 1055; https://doi.org/10.3390/agronomy13041055
Submission received: 2 March 2023 / Revised: 30 March 2023 / Accepted: 3 April 2023 / Published: 5 April 2023

Abstract

:
Agricultural land use has a remarkable influence on the stock and distribution of soil organic carbon (SOC). However, both regional soil sampling and process-based ecosystem models for SOC estimation at the regional scale have limitations when applied in areas with a large land use change. In the present study, a framework (CMCS) combining CENTURY modeling (CM) and chronosequences sampling (CS) was established, and a case study was conducted in Cangshan County, where vegetable cultivation conversion from grain production was significant in recent decades. The SOC stock (SOCS) of the non-vegetable area estimated by CM was comparable to that estimated by regional soil sampling in 2008. This result confirmed that CM was reliable in modeling SOC dynamics in a non-vegetable area without land use change. However, when applied to the overall cropland of Cangshan County, the CM, without considering the land use change, underestimated the SOCS by 0.23 Tg (6%), compared with the observed measurements (3.58 and 3.81 Tg, respectively). Using the CMCS framework of our study, the underestimation of CM was offset by the SOC sequestration estimated by CS. The SOCS estimated by the CMCS framework ranged from 3.72 to 4.02 Tg, demonstrating that this framework is reliable for the regional SOC estimation of large-area land use change. In addition, annual SOCS dynamics were obtained by this framework. The CMCS framework provides a low-cost and practicable method for the estimation of the regional SOC dynamic, which can further support the strategy of carbon peaking and carbon neutrality in China.

1. Introduction

Soil organic carbon (SOC) sequestrated in agro-ecosystems could mitigate greenhouse gas emissions and improve soil fertility [1]. Numerous factors, including climate, land use, soil properties, and land management, regulate SOC dynamics [2]. Any slight change in SOC dynamics may greatly affect the atmospheric CO2 concentration and, furthermore, the strategy of carbon neutrality in China. Among these factors, most researchers examining the matter have suggested that land use change is the major factor determining SOC storage [3,4].
Agricultural land use has a remarkable influence on the content of SOC [5]. By soil sampling under different land uses, Illiger et al. [6] concluded that land use change from steppe to cropland led to a mean carbon loss of 23.3% and 13.9% for Chernozem and Kastanozems soils, respectively. Xia et al. [7] found that the uplands in northeastern China, mainly transformed from paddy fields, were the largest carbon sources among different land use types. Conversion from conventional grain production to vegetable cultivation is one of the most significant land use changes in China in recent decades due to the high market price and increasing demand for vegetables [8]. Yan et al. [9] estimated that the accumulation rates of carbon in the surface soil (0–30 cm) of greenhouse vegetable fields reached 1.37 Mg ha−1 yr−1, compared with adjacent wheat–maize fields in northern China. However, Wang et al. [10] found that land use conversion from paddy soil to long-term vegetable cultivation (more than 20 years) decreased SOC density (SOCD) in the surface soil layer (0–20 cm) by 4 Mg ha−1. The different results of SOC after land use conversion to vegetable cultivation were due to the different soil properties and soil management at the plot scale. At the regional scale, studies focusing on SOC dynamics after land use conversion to vegetable cultivation remain limited. However, vegetable cultivation affects SOC dynamics at the regional scale and is seldom discussed.
Soil sampling and process-based ecosystem models are generally used in SOC dynamics estimation at the regional scale [11,12]. Soil sampling is more reliable than models [13]. However, soil sampling is usually time-consuming and labor-intensive at the regional scale, which limits long-term monitoring networks [14,15]. In most cases, regional soil sampling at two periods was used to estimate SOC change, but without temporal dynamics [13]. In addition to regional soil sampling, chronosequences sampling (CS) and associated space for time substitutions are important methods for investigating the rates of soil evolution across multiple time scales [16]. CS can offer supplemental temporal information when sufficient regional sampling is unavailable. Process-based ecosystem models were developed as an alternative for estimating and predicting SOC dynamics and have been used at the regional scale [17]. However, there are still problems resulting from a lack of regional data or from significant gaps in the information. Furthermore, impacts of land use change on SOC dynamics are difficult to investigate by using process-based models, mainly due to the unavailability of spatial land use change datasets, the lack of model parameters for special plants (e.g., input of biomass), and the difficulty in transforming land use in model datasets [18,19,20]. Whether process-based models can be used or how to use these models to estimate SOC dynamics at the regional scale in a large land use change region should be investigated and discussed.
Cangshan County is one of the most well-known vegetable regions in China’s Shandong province. Prior to the 1980s, most cropland was cultivated based on a rotation of winter wheat and summer maize in Cangshan County with limited irrigation and fertilizer input. However, by 2008, the area cultivated for vegetables reached 46,000 ha with an annual vegetable yield of over 2 million tons [21]. Conversion from non-vegetable fields (e.g., cereal fields) to vegetable cultivation is considered to be an important land use change that affects the SOC dynamics in Cangshan County [22,23]. Two regional soil samplings were conducted in 1980 and 2008, respectively. However, data on more detailed temporal and spatial SOC dynamics in Cangshan County are still lacking.
The CENTURY model is a process-based computer model of plant-soil ecosystems that simulates the long-term transformation and cycling of carbon and nutrients in the top 20 cm of soil [24]. The performance of CENTURY modeling (CM) has been extensively validated for croplands from the plot scale [25] to larger scales [26]. In our previous research, the CENTURY model demonstrated good performance in modeling SOC dynamics at the plot and regional scale for Chinese upland soils [27]. However, to our knowledge, as a result of the lack of specific parameters for vegetable species and management, it is still a challenge to use process-based ecosystem models, including the CENTURY model, to simulate SOC dynamics in areas under vegetable cultivation [28], particularly in areas that are under greenhouse cultivation (such as shed greenhouses and plastic film greenhouses).
In an area with large land use change, such as from cereal production to vegetable cultivation in Cangshan County, regional soil sampling or process-based modeling alone could not obtain the temporal and spatial SOC dynamics. Hence, the aims of the present study were to 1) establish a CMCS framework to estimate SOC dynamics in a region with large land use change by combining CM and CS; 2) estimate the SOC dynamics of Cangshan County by using the established CMCS framework; and 3) discuss the reliability and limitation of the CMCS framework.

2. Materials and Methods

2.1. Study Area and Data Sources

Cangshan County (34°37′–35°06′ N and 117°41′–118°18′ E), with an area of 1800 km2 (Figure 1), is located in the Huang–Huai–Hai region of China [29]. The climate of Cangshan County is characterized as warm-temperate with periodic monsoon rain, with an average annual temperature of 13.2 °C and an average annual rainfall of 859.6 mm. The main soil types are fluvoaquatic soil, cinnamon soil, and lime concretion black soil (according to the Genetic Soil Classification of China (Ustochrepts, Hapludalfs, and Endoaquepts in the US. Soil Taxonomy, respectively)), which support 34.4, 30.1, and 24.7% of the total agricultural land, respectively [29,30]. Cangshan County is well-known for vegetable cultivation, especially greenhouse vegetable production. The cropland of Cangshan County could be simply divided into the non-vegetable area (NA) and vegetable area (VA). Local statistics showed that approximately 90% of the NA followed a winter wheat–summer maize rotation, and the rest was mainly under wheat–soybean, maize–peanut, or maize–sweet potato rotation. To simplify the modeling process, we assumed that all the NA in Cangshan County was under a wheat–maize rotation.
Two regional soil surveys, which addressed all the soil types of Cangshan County, were conducted in 1980 and 2008, including a total of 845 and 1951 agricultural soil samples, respectively [22]. The surface SOCD of each sample was calculated first. Then, Ordinary Kriging was applied to obtain the spatial distribution of SOCD of Cangshan County. Ordinary Kriging was carried out with ArcGIS 9.2 at a resolution of 30 m. In total, 80% of the soil samples were selected randomly as calibration points for spatial interpolation, while the remaining 20% were used for validation. SOCD maps from spatial interpolation were obtained for further investigation. More details were presented in [22].
To estimate the SOC change rates of vegetable cultivation, a space for time sampling was conducted for three local vegetable cultivation methods (perennial greenhouse, seasonal greenhouse, and field cultivation, represented as PG, SG, and FC, respectively). Briefly, surface soil samples from fields with the same cultivation method but different cultivation duration (1–16 years for PG, 1–16 years for SG, and 4–26 years for FC, respectively) and the adjacent wheat-maize rotation crop field were sampled. The SOC content and soil bulk density were measured to calculate SOCD. Then, SOC change rates were obtained by comparing the three vegetable cultivation fields with the adjacent wheat-maize rotation crop field. The average SOC change rates of the three vegetable cultivation methods in the soil surface layer (0–20 cm) were estimated to be 0.4 Mg ha−1 y−1 (0.64, 0.36, and 0.20 Mg ha−1 y−1 for PG, SG, and FC, respectively). Detailed information can be found in [23].

2.2. CENTURY Model and Its Input

The CENTURY model (v. 4.6) developed by the Natural Resources Ecology Lab of Colorado State University was used in this study. The initialization of the CENTURY model using historical land use patterns for establishing the initial proportions of the SOC pool fractions (active, slow, and passive) was performed by using a three-step initialization method [30,31]. Briefly, the first part of the model initialization involved simulating the native conditions in an equilibrium state for 5000 years. The second part of the model initialization was achieved by considering approximately 2000 years to simulate the influences of historical land use changes and management practices. The third part of the model initialization was to run the model for each monitoring unit for the period from 1955 to 1980, when the application of N fertilizer and farmyard manure began. To construct modeling units of Cangshan County, the administrative map with 21 towns, soil type map with 28 soil families, and land use type map were integrated. In total, 227 modeling units were generated. Using the properties of 845 soil samples collected in 1980, the soil attributes assignment in the polygon-based soil database was compiled with the Pedological Knowledge Based method [32]. Fertilizer and farmyard manure additions of 21 towns in Cangshan County were calculated by the method of Wang et al. [31], based on agricultural statistical data obtained from the Cangshan Statistical Yearbook [21]. Meteorological information on monthly mean air temperature and precipitation was obtained from the nearest weather station (http://data.cma.cn/ accessed on 1 May 2015.). Owing to the lack of a long-term SOC monitoring site in this area, the CENTURY model was calibrated by using 12 paired measurements of wheat–maize rotation in 1980 and 2008 (2 sampling sites within 100 m) (Figure 1). The crop-specific parameters and straw removal ratio were adjusted manually until the simulated SOC matched the measured SOC in 2008. Finally, model inputs (including meteorological, soil, and farming management data) were prepared for each of the 227 modeling units. After model initialization, CM was conducted in each modeling unit from 1980 to 2008. The SOC dynamics of each unit were obtained and assembled to form the SOC dynamics of the whole of Cangshan County.

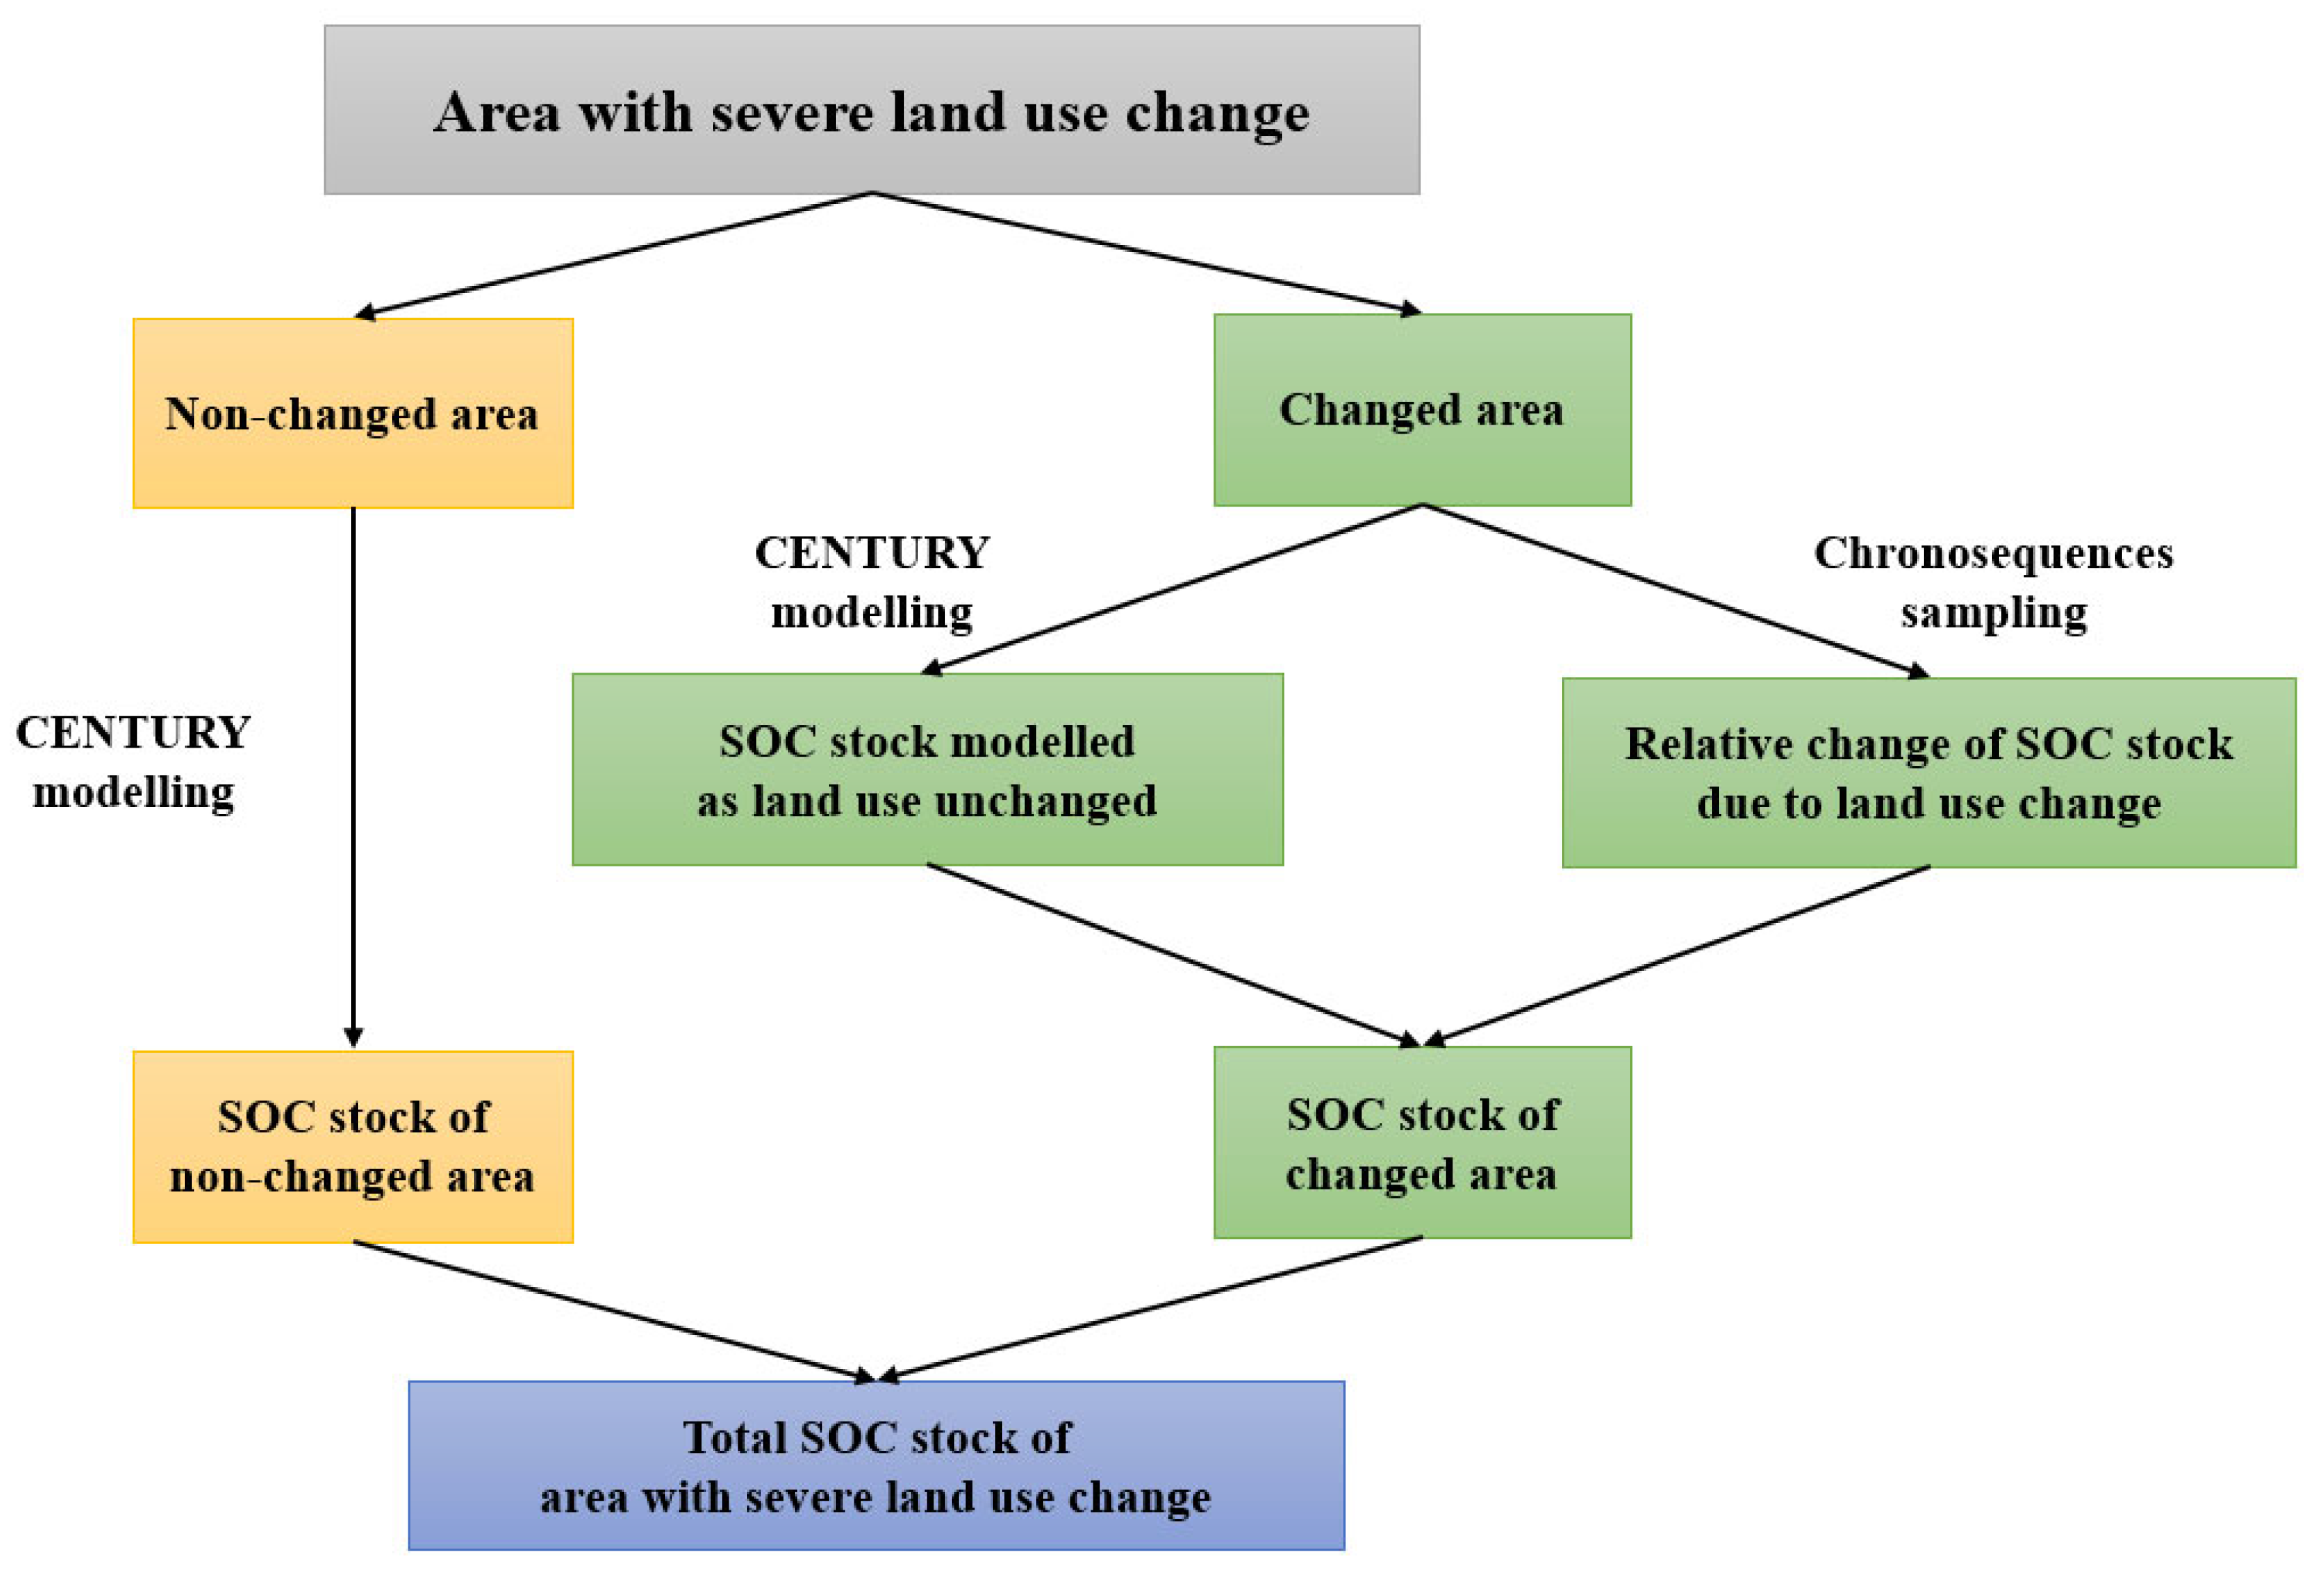
2.3. Design of CMCS Framework for SOC Estimation at the Regional Scale

The CMCS framework to estimate SOC dynamics in an area with large land use change is shown in Figure 2. The specific procedure included four steps. First, we divided the cropland of Cangshan County into two parts, NA and VA. Second, CM was conducted to estimate SOC dynamics in both NA and VA separately, assuming both areas were under wheat–maize rotation. Third, SOC stock (SOCS) under VA was calculated by adding SOC dynamics estimated by CM to SOC relative change estimated by CS (Equation (1)). Fourth, the SOC in NA and VA was assembled to obtain the overall SOC dynamics in the cropland of Cangshan County.
S O C S V A = S O C S C M + R S O C v e g
where S O C S V A is the SOCS under VA (Tg), S O C S C M is the SOCS estimated by CM (Tg), and R S O C v e g is the relative change in SOCS in VA (Tg).

2.4. Data Analysis

Measurements of soil organic carbon, recorded as SOC content (SOCC, g kg−1), needed to be transformed into SOCD (Mg ha−1) by using Equation (2) for driving the CENTURY model [31]:
S O C D = S O C C × B D × H × 0.1
where BD is the bulk density (g cm−3), and H is the soil layer thickness, which is 20 cm in this study. The soils in the cropland of Cangshan County are not gravelly.
SOC stocks (SOCS, Tg) were calculated via Equation (3) [31]:
S O C S = i = 1 n S O C D i × A i 10 6
where SOCDi and Ai are the soil organic carbon density (Mg ha−1) and area (ha) of the ith modeling unit or interpolation grid, respectively, and n is the total number of modeling units or interpolation grids.
The SOCS in VA was assembled by the relative change in SOCS under vegetable cultivation (estimated by CS) and the SOCS under wheat–maize rotation (estimated by CM). The relative change in SOCS in VA (RSOCveg, Tg) was derived as Equation (4):
R S O C v e g n = j = 1 n S j × R v e g 10 6
where j represents the jth year, n represents the modeling duration (n = 29 in the present study), Sj is the area of vegetable cultivation (ha), and Rveg is the relative change rate of SOCS under vegetable cultivation (Mg ha−1 y−1), which was 0.64, 0.36, and 0.20 for PG, SG, and FC, respectively, in the present study.
The Pearson correlation coefficient (r) and root-mean-square error (RMSE) were used to assess the differences between observed and modeled SOC values at the regional scale. The statistical significance of Pearson’s correlation coefficient was determined at the p = 0.05 and 0.01 levels.
R M S E = 1 n i = 1 n [ C ¯ s ( x i ) C s ( x i ) ] 2
where C s is the measured SOC density, C ¯ s is the estimated SOC density, and n is the number of validation observations.

3. Results

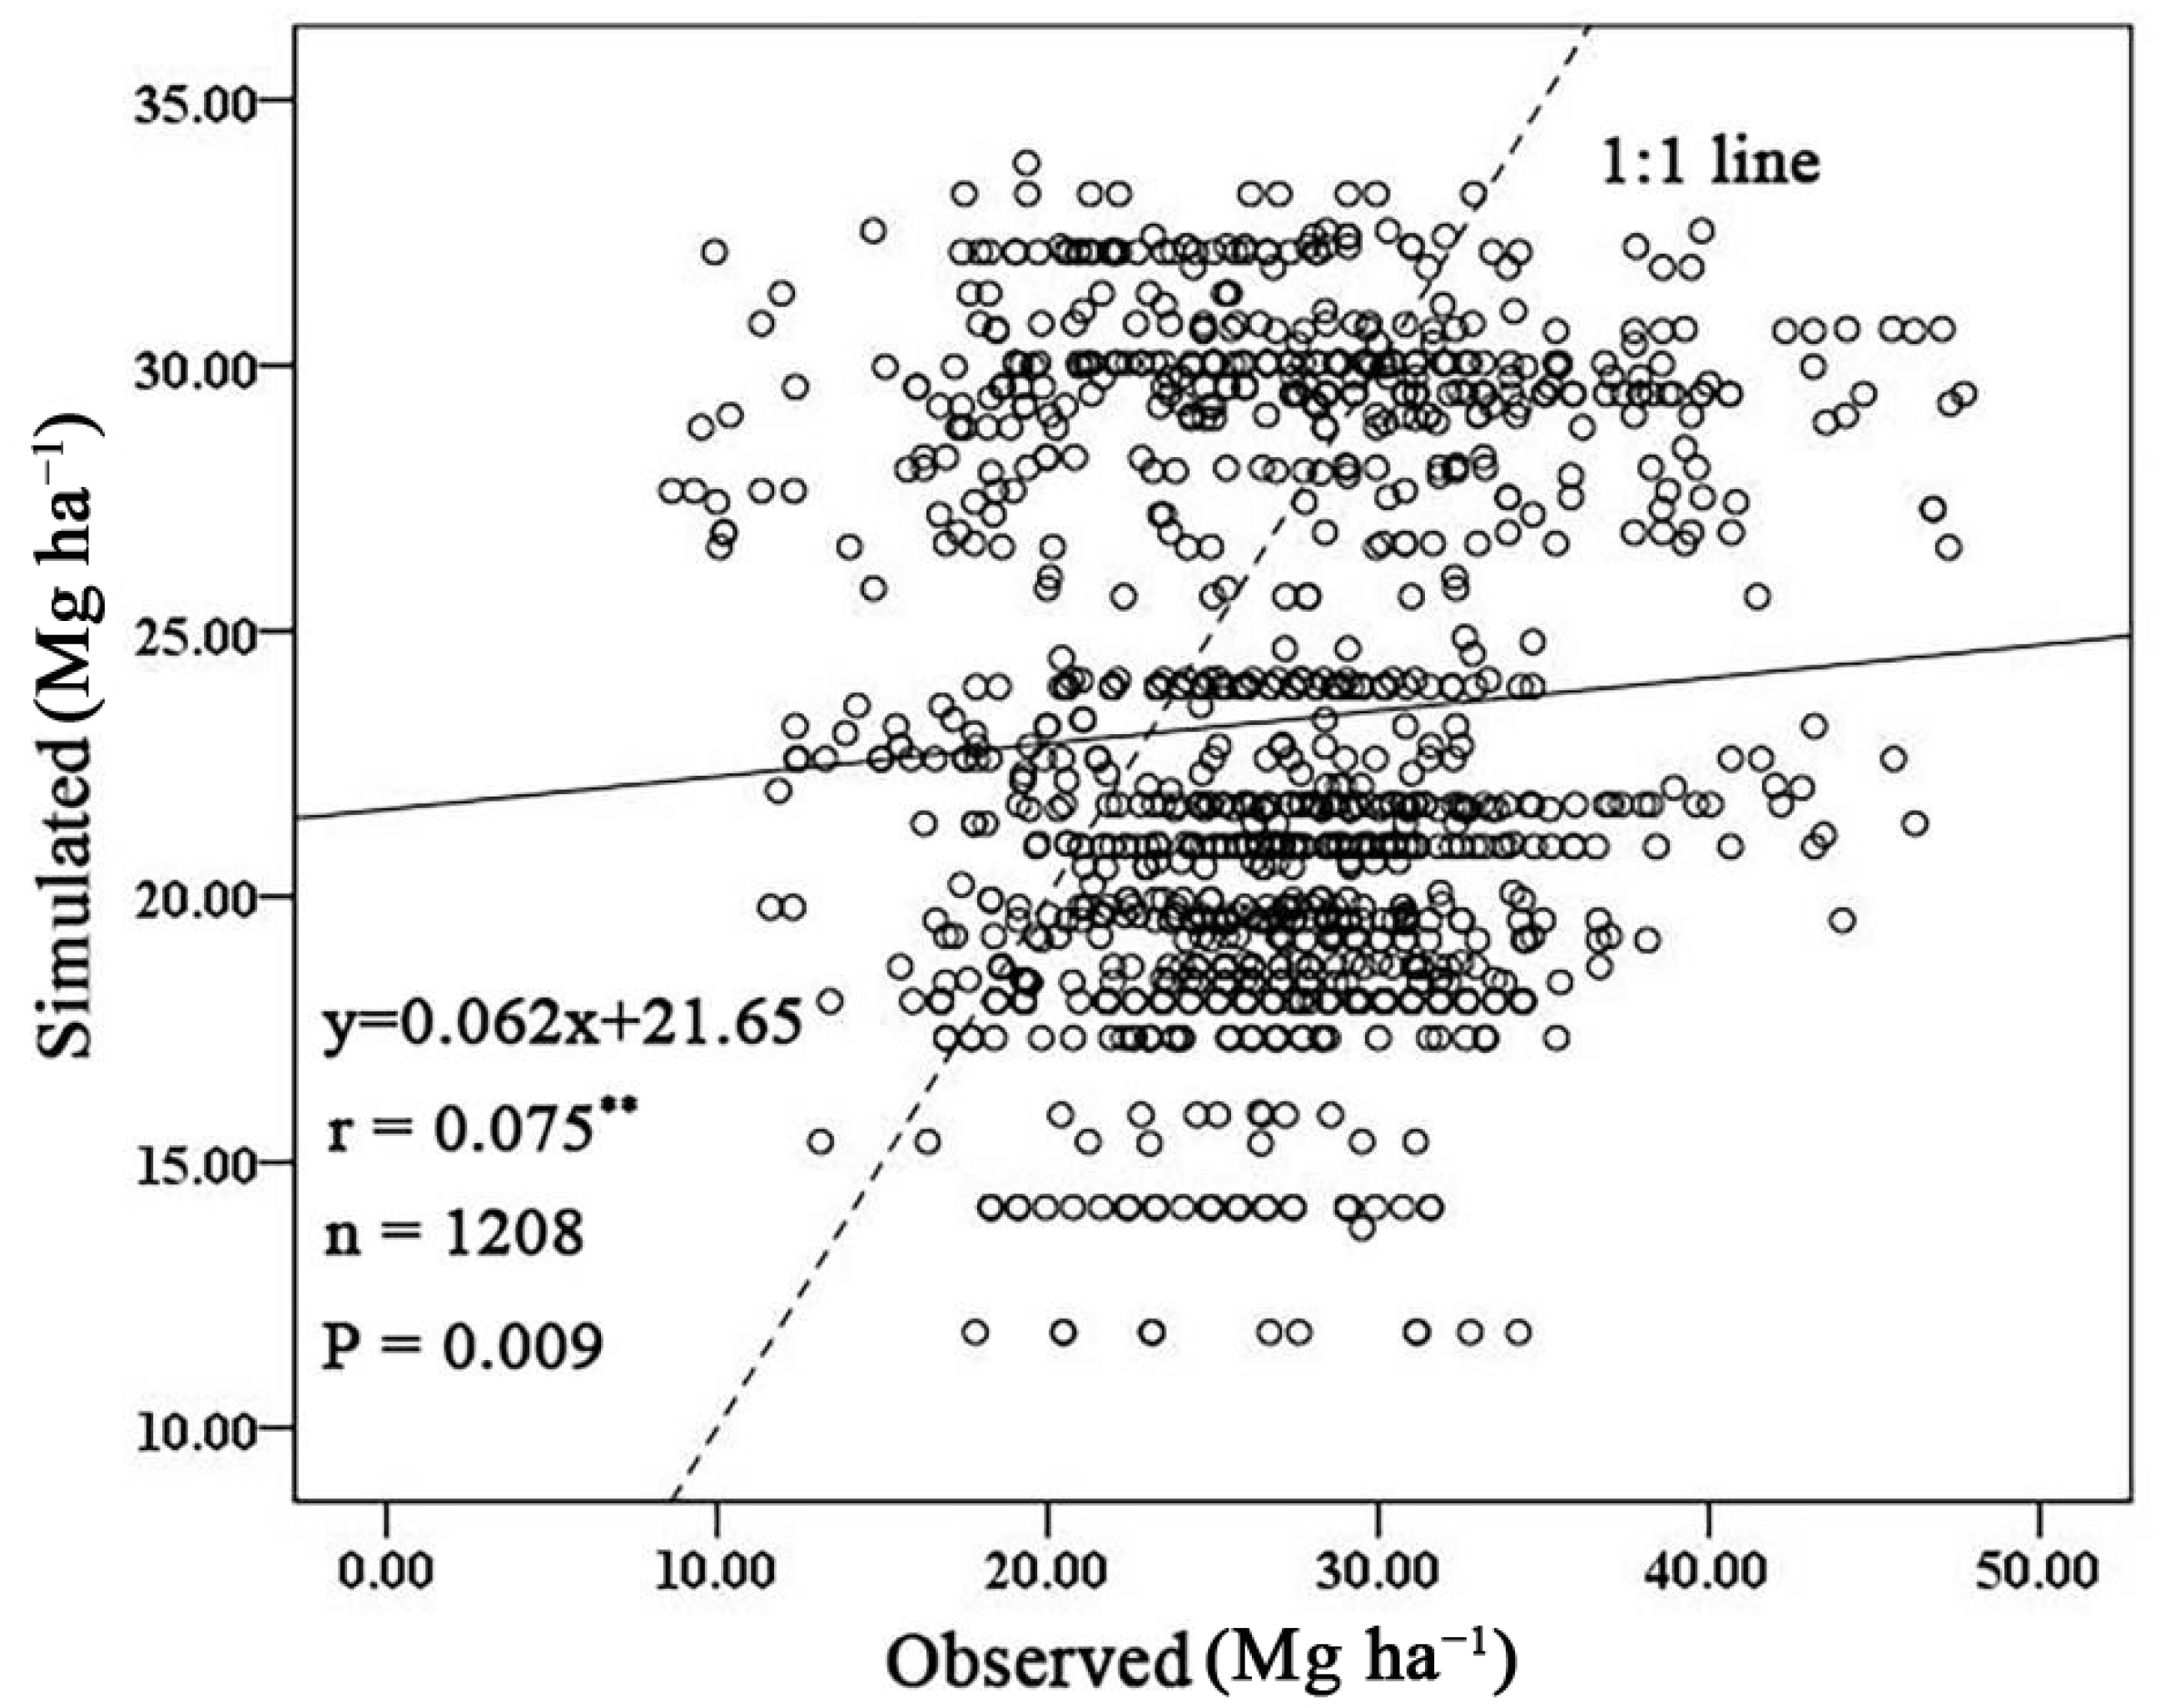
3.1. Validation of CENTURY Modeling

The SOCD of 1208 samples under a wheat–maize rotation was extracted from regional soil sampling in 2008. Then, the simulated SOCD of these 1208 sites in 2008 was also obtained from the 227 modeling units by CM. To validate the results of CM, correlation analysis was conducted and the RMSE was 8.61 Mg ha−1. The correlation between observed and simulated SOCD was significant (r = 0.075, p < 0.01) (Figure 3). The low correlation efficiency was mainly because the simulated SOCD by CM was coarse (from the 227 modeling units) compared with that by regional sampling (from 1208 soil samples). The validation result indicated that the observed SOCD was higher than the simulated one (26.95 and 23.31 Mg ha−1, respectively).

3.2. Estimated SOC Dynamics in Non-Vegetable Areas and Vegetable Areas

Simulated SOCS in NA increased gradually from 1.81 Tg in 1980 to 2.45 Tg in 2008, after a minor decrease in the initial 2 years (Figure 4a). The observed SOCS based on regional soil sampling was 1.85 and 2.61 Tg in 1980 and 2008, which was 2.2 and 6.5% higher than that based on CM, respectively. This result showed that CM could simulate the SOC dynamics of the wheat–maize rotation in Cangshan County.
Spatially, there are variations between SOCD simulated by CM and that based on regional soil sampling (Figure 5). Generally, SOCD estimated by CM (assuming all cropland was under a wheat–maize rotation) was lower than that estimated by interpolation from regional sampling in 2008. The high SOCD areas based on interpolation (Figure 5b) were in agreement with the VA in Figure 1, indicating that vegetable cultivation enhanced SOCD. However, the CENTURY model cannot simulate SOC dynamics under vegetable cultivation. For NA in Cangshan County, the CENTURY model offered acceptable SOC dynamics, as shown in Figure 4a. However, for VA converted from NA, the CENTURY model alone could not simulate its SOC dynamics. Even if the CENTURY model possessed a module to simulate SOC dynamics under vegetable cultivation, the simulation results would still be doubtful as a result of the absence of model input (such as vegetable cultivation method and management in detail) and the lack of SOC monitoring data under vegetable cultivation to calibrate the model parameters. For these reasons, CM did not capture the SOCD dynamics induced by land use change from cereal to vegetable cultivation.
Therefore, CM alone could not offer the SOC dynamics of cropland of the whole of Cangshan County. To solve this problem, a new framework should be established to obtain the SOC dynamics of VA at the regional scale.
In 1980, most cropland in Cangshan County was under a wheat–maize rotation. Since then, the vegetable cultivation area has increased significantly and reached 46,000 ha in 2008. The SOCS estimated by CM showed a similar tendency for both VA and NA (Figure 4). The SOCS would increase from 0.8 to 1.13 Tg based on CM if the land use remained NA instead of being converted to VA over the 29 years (Figure 4b). However, the observed SOCS of VA in 2008 was 1.20 Tg, which was 6.2% higher than the simulated result (assuming a wheat–maize rotation). To fill the gap caused by land use change from a wheat–maize rotation to vegetable cultivation, the effects of vegetable cultivation on SOC dynamics should be considered.
Since the CENTURY model cannot simulate SOC dynamics under vegetable cultivation, we tried to use the SOC change rates estimated by CS to compensate for the underestimation of SOCS by CM without considering vegetable cultivation. According to our previous research, based on a space for time sampling, the SOC change rates of the three main vegetable cultivation methods in Cangshan County were 0.64, 0.36, and 0.2 Mg ha−1 y−1 for PG, SG, and FC, respectively. The relative change in SOCS in VA was calculated by Equation (3) first, and the results were added to the SOCS estimated by CM, as shown in Figure 2. Using this compensation method, the SOCS in VA was 1.27–1.57 Tg in 2008 (Figure 4b).

3.3. Estimated SOC Dynamics in Cropland by the CMCS Framework

In the cropland of Cangshan County, simulated SOCS from CM increased from 2.60 to 3.58 Tg from 1980 to 2008, assuming that all the cropland was under a wheat–maize rotation and no land use change occurred. In contrast, the observed SOCS in 2008 was 3.81 Tg, which was 6.4% higher than the simulated result. The SOCS in the cropland of Cangshan County estimated by CMCS with different SOC change rates is also shown in Figure 6. The gap between observed and simulated SOCS narrowed. By 2008, the estimated SOCS by the CMCS framework was 4.02, 3.83, 3.72, and 3.86 Tg for PG, SG, FC, and their average, respectively. Compared with different vegetable cultivation methods, the result using the SOC change rate of SG was the closest to the observed SOCS (Figure 6).
The observed SOCS was in the range estimated by the CMCS framework, which indicated the framework could provide a new method to solve the SOCS gap caused by vegetable cultivation or other significant land use change.

4. Discussion

4.1. Performance of the CMCS Framework

For NA, the SOCDs estimated by CM were significantly correlated with those observed (p < 0.01), and the simulated SOCS was 6.5% higher than the observed figure. This result demonstrated that SOC dynamics simulated by CM were reliable in NA, which was consistent with previous studies [33,34]. Our former research also showed that the simulated and observed SOCD were linearly correlated in 21 long-term monitoring sites with different climates, soils, and management conditions across China (R2 = 0.97, p < 0.001). Among these monitoring sites, the site in the Licheng District followed a wheat–maize rotation in cinnamon soil, which shared a similar condition to that of Cangshan County [34]. Furthermore, the SOCD from CM was reliable for six counties in the northeast region of China at the regional scale [33]. The performances demonstrated that the CENTURY model is reliable for estimating SOC that was comparable to the measurements under variable combinations of agricultural and geographical conditions. However, correlation efficiency was low in our case study (r = 0.075). The main reason was that the modeling units were not fine enough. Using the CM method, the SOCD from 227 modeling units could not represent that from 1208 soil samples well. Therefore, the correlation was significant but low. To solve this problem, more detailed regional data (including soil properties and management data) should be collected to construct finer modeling units. At present, limited studies use a process-based ecosystem model to simulate SOC dynamics under vegetable cultivation [35], especially under different vegetable cultivation methods. The main reason is that the species and cultivation management of vegetables are usually complex and diverse, temporally and spatially. Furthermore, there are seldom long-term monitoring sites to calibrate the model for acquiring specific parameters of vegetable cultivation. Thus, it is difficult to simulate SOC dynamics under vegetable cultivation using process-based ecosystem models. Using the CS method [16,36], the SOC change rate of VA was estimated first. Then, the CMCS framework was applied to offset the underestimation of SOCS without considering the land use change. After using the CMCS framework, the estimated SOCS range contained the observed one, which illustrated that this framework could be used in a large land use change area such as Cangshan County. In addition, normal regional soil sampling can only offer the SOCS at the sampling year, such as 2.60 and 3.58 Tg in 1980 and 2008 of Cangshan County. How SOCS changed between the two soil surveys is still unknown. Based on the CMCS framework, the annual SOCS can be estimated, and the land use change was considered (Figure 6). We believe this framework is beneficial to evaluate SOC dynamics at the regional scale and, furthermore, helps to support the strategy of carbon neutrality in China. Nonetheless, further studies should be conducted to better understand the suitability of this framework in other areas and other land use change types.

4.2. Effect of Vegetable Cultivation on SOC Stock

The observed SOCS suggested that vegetable cultivation contributed to SOC sequestration. However, the SOC sequestration rate estimated by interpolating regional soil samplings was lower than that by CS at the plot scale (Figure 4b). The difference was primarily due to the difficulty of locating sufficient similar sites which covered all the vegetable species, management practices, and cultivation duration at the regional scale by CS [15]. Previous research was carried out to evaluate the impact of vegetable cultivation on SOC. However, whether soil under vegetable cultivation is a carbon source or sink is still controversial because of the differences in experiment schemes and environments [37,38].
By now, most studies indicate that vegetable cultivation enhanced SOC sequestration if organic input was sufficient. In Cangshan County, a large amount of manure was traded and applied in greenhouse vegetable cultivation, e.g., over 10 t ha−1 yr−1 of chicken manure for SG and PG, based on a local interview [30]. The extra organic input can enhance SOC sequestration in vegetable cultivation [39]. Nevertheless, traded manure was ignored since the data in the present study were based on agricultural statistics instead of actual records. As a result, SOC sequestration under vegetable cultivation might be underestimated if using a modeling method. However, the SOC increment from extra organic input can be captured by the CS method. The higher SOC change rates under greenhouse vegetable cultivation mainly resulted from their higher input. In the future, more detailed vegetable cultivation data, including vegetable species, fertilizer input, and harvest, should be collected and presented as supplementary material to interpret SOC dynamics under vegetable cultivation.
Cultivation duration also affected SOC dynamics under vegetable cultivation. Results from a space-for-time approach showed that SOC under vegetable cultivation increased gradually in the first 7–11 years, tended to reach an equilibrium, but then decreased [40]. In the present study, SOC change rates were assumed to increase linearly with the cultivation duration of different vegetable cultivation methods. This hypothesis may overestimate the SOCS of VA since the duration was 29 years in this study, and a new equilibrium would be attained before 2008. To obtain an accurate SOC change rate of vegetable cultivation, more long-term representative sites should be established and monitored in Cangshan County.

4.3. Limitation of the Framework

SOC modeling at the regional scale will introduce considerable uncertainty due to imperfect model structure, heterogeneous model input, unknown parameters, and spatial up-scaling [14,41]. However, these factors were not investigated in the present study as a result of lacking long-term SOC monitoring data and more detailed model input at the regional scale in Cangshan County. Simulated SOCS was underestimated compared to the observed figure in this study (Figure 3). This underestimation was also declared in several previous ecological modeling studies, which may be partially attributed to the underlying functional relationships in the model [41]. The model input, which could not reflect the explicit heterogeneity, also accounted for the underestimation. The availability of regional model input is limited, especially in developing countries where regional data are scarce [42]. Even for the wheat–maize rotation in Cangshan County, SOCD variation existed spatially (Figure 5), mainly due to the lack of more accurate input data. The main objective of the present study was to offer a low-cost and practicable framework. In further studies, more regional data should be collected to reduce the uncertainties, and more case studies should be conducted to test the reliability of the framework.

5. Conclusions

A framework to estimate regional SOC dynamics by combining CENTURY modeling and chronosequences sampling (CMCS) was established, and its performance was tested in Cangshan County, where the vegetable cultivation area has increased significantly in recent decades. The SOC change rate of vegetable cultivation was estimated by chronosequences sampling to offset the underestimation of SOCS without considering the land use change. Using this framework, the observed SOCS was in the range of that estimated by CMCS. The results indicated that CMCS could provide a more reliable SOCS estimation. Moreover, annual SOCS can be provided, which is helpful to reveal the SOC dynamics at the regional scale and is beneficial to policymakers. This framework offers a new method for estimating agricultural SOC dynamics in regions with large agricultural land use changes.

Author Contributions

Conceptualization, X.L. and Y.L.; Formal analysis, X.L. and S.W.; Funding acquisition, X.L.; Methodology, X.L., Y.C., Y.L. and J.J.; Writing—original draft, X.L., Y.C., Y.L., S.W. and J.J.; Writing—review & editing, Y.C., Y.L., Y.Z. and D.Y. All authors have read and agreed to the published version of the manuscript.

Funding

This research was funded by the Foundation of Jiangsu Vocational College of Agriculture and Forestry, grant number 2022kj18; the National Natural Science Foundation of China, grant number 31800358; the Qinglan Project of Jiangsu Province and the Research Fund of Key Laboratory of Agro-Environment in Downstream of Yangtze Plain, grant number AE2018006.

Data Availability Statement

Not applicable.

Conflicts of Interest

The authors declare no conflict of interest.

References

  1. Zhao, Y.C.; Wang, M.Y.; Hu, S.J.; Zhang, X.D.; Ouyang, Z.; Zhang, G.L.; Huang, B.; Zhao, S.W.; Wu, J.S.; Xie, D.T.; et al. Economics-and policy-driven organic carbon input enhancement dominates soil organic carbon accumulation in Chinese croplands. Proc. Natl. Acad. Sci. USA 2018, 16, 4045–4050. [Google Scholar] [CrossRef] [Green Version]
  2. Bell, M.J.; Worrall, F. Estimating a region’s soil organic carbon baseline: The undervalued role of land-management. Geoderma 2009, 152, 74–84. [Google Scholar] [CrossRef]
  3. Stumpf, F.; Keller, A.; Schmidt, K.; Mayr, A.; Gubler, A.; Schaepman, M. Spatio-temporal land use dynamics and soil organic carbon in Swiss agroecosystems. Agr. Ecosyst. Environ. 2018, 258, 129–142. [Google Scholar] [CrossRef]
  4. Redmile-Gordon, M.; Gregory, A.S.; White, R.P.; Watts, C.W. Soil organic carbon, extracellular polymeric substances (EPS), and soil structural stability as affected by previous and current land-use. Geoderma 2020, 363, 114143. [Google Scholar] [CrossRef] [PubMed]
  5. Nocentini, A.; Monti, A. Comparing soil respiration and carbon pools of a maize-wheat rotation and switchgrass for predicting land-use change-driven SOC variations. Agri. Syst. 2019, 173, 209–217. [Google Scholar] [CrossRef]
  6. Illiger, P.; Schmidt, G.; Walde, I.; Hese, S.; Kudrjavzev, A.E.; Kurepina, N.; Mizgirev, A.; Stephan, E.; Bondarovich, A.; Frühauf, M. Estimation of regional soil organic carbon stocks merging classified land-use information with detailed soil data. Sci. Total Environ. 2019, 695, 133755. [Google Scholar] [CrossRef] [PubMed]
  7. Xia, X.Q.; Yang, Z.F.; Xue, Y.; Shao, X.; Yu, T.; Hou, Q.Y. Spatial analysis of land use change effect on soil organic carbon stocks in the eastern regions of China between 1980 and 2000. Geosci. Front. 2017, 3, 597–604. [Google Scholar] [CrossRef] [Green Version]
  8. Wu, L.; Tang, S.R.; He, D.D.; Wu, X.; Shaaban, M.; Wang, M.; Zhao, J.S.; Khan, I.; Zheng, X.H.; Hu, R.G.; et al. Conversion from rice to vegetable production increases N2O emission via increased soil organic matter mineralization. Sci. Total Environ. 2017, 583, 190–201. [Google Scholar] [CrossRef]
  9. Yan, Y.; Tian, J.; Fan, M.S.; Zhang, F.S.; Li, X.L.; Christie, P.; Chen, H.Q.; Lee, J.; Kuzyakov, Y.; Six, J. Soil organic carbon and total nitrogen in intensively managed arable soils. Agr. Ecosyst. Environ. 2012, 150, 102–110. [Google Scholar] [CrossRef]
  10. Wang, H.; Guan, D.S.; Zhang, R.D.; Chen, Y.J.; Hu, Y.T.; Xiao, L. Soil aggregates and organic carbon affected by the land use change from rice paddy to vegetable field. Ecol. Eng. 2014, 70, 206–211. [Google Scholar] [CrossRef]
  11. Xie, E.Z.; Zhang, X.; Lu, F.Y.; Peng, Y.X.; Chen, J.; Zhao, Y.C. Integration of a process-based model into the digital soil mapping improves the space-time soil organic carbon modelling in intensively human-impacted area. Geoderma 2022, 409, 115599. [Google Scholar] [CrossRef]
  12. Xie, E.Z.; Zhang, Y.X.; Huang, B.; Zhao, Y.C.; Shi, X.Z.; Hu, W.Y.; Qu, M.K. Spatiotemporal variations in soil organic carbon and their drivers in southeastern China during 1981–2011. Soil Till. Res. 2021, 205, 104763. [Google Scholar] [CrossRef]
  13. Yan, X.Y.; Cai, Z.C.; Wang, S.W.; Smith, P. Direct measurement of soil organic carbon content change in the croplands of China. Glob. Chang. Biol. 2011, 3, 1487–1496. [Google Scholar] [CrossRef]
  14. Ogle, S.M.; Breidt, F.J.; Easter, M.; Williams, S.; Killian, K.; Paustian, K. Scale and uncertainty in modeled soil organic carbon stock changes for US croplands using a process-based model. Glob. Chang. Biol. 2010, 2, 810–822. [Google Scholar] [CrossRef]
  15. Jandl, R.; Rodeghiero, M.; Martinez, C.; Cotrufo, M.F.; Bampa, F.; van, W.B.; Harrison, R.B.; Guerrini, I.A.; deB Richter, D.; Rustad, L.; et al. Current status, uncertainty and future needs in soil organic carbon monitoring. Sci. Total Environ. 2014, 486, 376–383. [Google Scholar] [CrossRef] [PubMed]
  16. Huang, L.M.; Thompson, A.; Zhang, G.L.; Chen, L.M.; Han, G.Z.; Gong, Z.T. The use of chronosequences in studies of paddy soil evolution: A review. Geoderma 2015, 237, 199–210. [Google Scholar] [CrossRef]
  17. Zhang, L.M.; Zhuang, Q.L.; Li, X.D.; Zhao, Q.Y.; Yu, D.S.; Liu, Y.L.; Shi, X.Z.; Xing, S.H.; Wang, G.X. Carbon sequestration in the uplands of Eastern China: An analysis with high-resolution model simulations. Soil Till. Res. 2016, 158, 165–176. [Google Scholar] [CrossRef]
  18. Wan, Y.F.; Lin, E.D.; Xiong, W.; Li, Y.E.; Guo, L.P. Modeling the impact of climate change on soil organic carbon stock in upland soils in the 21st century in China. Agr. Ecosyst. Environ. 2011, 1–2, 23–31. [Google Scholar] [CrossRef]
  19. Yu, Y.Q.; Huang, Y.; Zhang, W. Projected changes in soil organic carbon stocks of China’s croplands under different agricultural managements, 2011–2050. Agr. Ecosyst. Environ. 2013, 178, 109–120. [Google Scholar] [CrossRef]
  20. Zhang, L.M.; Wang, G.X.; Zheng, Q.F.; Liu, Y.L.; Yu, D.S.; Shi, X.Z.; Xing, S.H.; Chen, H.Y.; Fan, X.Y. Quantifying the impacts of agricultural management and climate change on soil organic carbon changes in the uplands of Eastern China. Soil Till. Res. 2017, 174, 81–91. [Google Scholar] [CrossRef]
  21. Statistics Bureau of Cangshan County. Cangshan Statistical Yearbook 2008; Shandong Statistics Press: Jinan, China, 2008. (In Chinese)
  22. Liu, Y.; Yu, D.S.; Wang, N.; Shi, X.Z.; Warner, E.D.; Zhang, H.D.; Qin, F.L. Impacts of agricultural intensity on soil organic carbon pools in a main vegetable cultivation region of China. Soil Till. Res. 2013, 134, 25–32. [Google Scholar] [CrossRef]
  23. Liu, Y.; Yu, D.S.; Shi, X.Z.; Zhang, G.X.; Qin, F.L. Influence of vegetable cultivation methods on soil organic carbon sequestration rate. Acta. Ecol. Sinica. 2012, 32, 2953–2959, (In Chinese with English Abstract). [Google Scholar]
  24. Parton, W.J.; Scurlock, J.M.O.; Ojima, D.S.; Gilmanov, T.G.; Scholes, R.J.; Schimel, D.S.; Kirchner, T.; Menaut, J.C.; Seastedt, T.; Moya, E.G.; et al. Observations and modeling of biomass and soil organic matter dynamics for the grassland biome worldwide. Global Biogeochem. Cy. 1993, 7, 785–809. [Google Scholar] [CrossRef] [Green Version]
  25. Parton, W.J.; Schimel, D.S.; Cole, C.V.; Ojima, D.S. Analysis of factors controlling soil organic matter levels in Great Plains grasslands. Soil Sci. Soc. Am. J. 1987, 5, 1173–1179. [Google Scholar] [CrossRef]
  26. Lugato, E.; Panagos, P.; Bampa, F.; Jones, A.; Montanarella, L. A new baseline of organic carbon stock in European agricultural soils using a modelling approach. Glob. Chang. Biol. 2014, 1, 313–326. [Google Scholar] [CrossRef]
  27. Liu, X.; Zhao, Y.; Shi, X.; Wang, S.; Yan, F. Spatio-temporal Changes and Associated Uncertainties of CENTURY-modelled SOC for Chinese Upland Soils, 1980–2010. Chinese Geogr. Sci. 2021, 1, 126–136. [Google Scholar] [CrossRef]
  28. Deng, J.; Zhou, Z.X.; Zheng, X.H.; Li, C.S. Modeling impacts of fertilization alternatives on nitrous oxide and nitric oxide emissions from conventional vegetable fields in southeastern China. Atmos. Environ. 2013, 81, 642–650. [Google Scholar] [CrossRef]
  29. Wang, M.Y.; Shi, X.Z.; Yu, D.S.; Xu, S.X.; Tan, M.Z.; Sun, W.X.; Zhao, Y.C. Regional Differences in the Effect of Climate and Soil Texture on Soil Organic Carbon. Pedosphere 2013, 6, 799–807. [Google Scholar] [CrossRef]
  30. Liu, Y.; Liu, X.Y.; Feng, Y.F.; Yu, D.S.; Shi, X.Z. Composition of a Soil Organic Carbon Increment under Different Vegetable Cultivation Patterns: A Study Using Three SOC Pools. Sustainability 2018, 1, 35. [Google Scholar] [CrossRef] [Green Version]
  31. Wang, S.H.; Shi, X.Z.; Zhao, Y.C.; Weindorf, D.C.; Yu, D.S.; Xu, S.X.; Tan, M.Z.; Sun, W.X. Regional Simulation of Soil Organic Carbon Dynamics for Dry Farmland in East China by Coupling a 1:500 000 Soil Database with the Century Model. Pedosphere 2011, 3, 277–287. [Google Scholar] [CrossRef]
  32. Zhao, Y.C.; Shi, X.Z.; Weindorf, D.C.; Yu, D.S.; Sun, W.X.; Wang, H.J. Map scale effects on soil organic carbon stock estimation in North China. Soil Sci. Soc. Am. J. 2006, 4, 1377–1386. [Google Scholar] [CrossRef]
  33. Liu, X.Y.; Zhao, Y.C.; Shi, X.Z.; Liu, Y.; Wang, S.H.; Yu, D.S. Uncertainty in CENTURY-modelled changes in soil organic carbon stock in the uplands of Northeast China, 1980–2050. Nutr. Cycl. Agroecosys. 2019, 1, 77–93. [Google Scholar] [CrossRef]
  34. Liu, X.Y.; Zhao, Y.C.; Shi, X.Z.; Liu, Y.; Wang, S.H.; Yu, D.S. Sensitivity and uncertainty analysis of CENTURY-modeled SOC dynamics in upland soils under different climate-soil-management conditions: A case study in China. J. Soils Sediments 2016, 1, 85–96. [Google Scholar] [CrossRef]
  35. Farina, R.; Testani, E.; Campanelli, G.; Leteo, F.; Napoli, R.; Canali, S.; Tittarelli, F. Potential carbon sequestration in a Mediterranean organic vegetable cropping system. A model approach for evaluating the effects of compost and Agro-ecological Service Crops (ASCs). Agr. Syst. 2018, 162, 239–248. [Google Scholar] [CrossRef]
  36. Wang, M.Y.; Xu, S.X.; Kong, C.; Zhao, Y.C.; Shi, X.Z.; Guo, N.J. Assessing the effects of land use change from rice to vegetable on soil structural quality using X-ray CT. Soil Till. Res. 2019, 195, 104343. [Google Scholar] [CrossRef]
  37. Luan, H.A.; Gao, W.; Huang, S.W.; Tang, J.W.; Li, M.Y.; Zhang, H.Z.; Chen, X.P. Partial substitution of chemical fertilizer with organic amendments affects soil organic carbon composition and stability in a greenhouse vegetable production system. Soil Till. Res. 2019, 191, 185–196. [Google Scholar] [CrossRef]
  38. Zhang, M.; Li, B.; Xiong, Z.Q. Effects of organic fertilizer on net global warming potential under an intensively managed vegetable field in southeastern China: A three-year field study. Atmos. Environ. 2016, 145, 92–103. [Google Scholar] [CrossRef]
  39. Sierra, J.; Causeret, F.; Chopin, P. A framework coupling farm typology and biophysical modelling to assess the impact of vegetable crop-based systems on soil carbon stocks. Application in the Caribbean. Agr. Syst. 2017, 153, 172–180. [Google Scholar] [CrossRef]
  40. Li, J.; Wan, X.; Liu, X.; Chen, Y.; Slaughter, L.C.; Weindorf, D.C.; Dong, Y. Changes in soil physical and chemical characteristics in intensively cultivated greenhouse vegetable fields in North China. Soil Till. Res. 2019, 195, 104366. [Google Scholar] [CrossRef]
  41. Ogle, S.M.; Breidt, F.J.; Easter, M.; Williams, S.; Paustian, K. An empirically based approach for estimating uncertainty associated with modelling carbon sequestration in soils. Ecol. Model. 2007, 205, 453–463. [Google Scholar] [CrossRef]
  42. Qin, F.L.; Zhao, Y.C.; Shi, X.Z.; Xu, S.X.; Yu, D.S. Sensitivity and uncertainty analysis for the DeNitrification-DeComposition model, a case study of modeling soil organic carbon dynamics at a long-term observation site with a rice-bean rotation. Comput. Electron. Agr. 2016, 124, 263–272. [Google Scholar] [CrossRef]
Figure 1. The distribution of non-vegetable and vegetable areas in Cangshan County. Samplings in 1980 and 2008 represent paired measurements of wheat-maize rotation selected from regional soil sampling in 1980 and 2008, respectively (2 sampling sites within 100 m).
Agronomy 13 01055 g001
Figure 2. CMCS Framework for estimating SOC in areas with a large land use change.
Agronomy 13 01055 g002
Figure 3. Comparison between simulated and observed soil organic carbon (SOC) density in 2008 in the non-vegetable area of Cangshan County. ** denotes p < 0.01.
Agronomy 13 01055 g003
Figure 4. Comparison of soil organic carbon (SOC) stocks of (a) non-vegetable area; and (b) vegetable area in Cangshan County. CMCS represented the framework combining CENTURY modeling and chronosequences sampling. PG, SG, and FC represent perennial greenhouse, seasonal greenhouse, and field cultivation, respectively.
Agronomy 13 01055 g004
Figure 5. Distribution of soil organic carbon density (SOCD) in Cangshan County in 2008 estimated (a) by CENTURY modeling (assuming all cropland under a wheat–maize rotation); (b) by interpolation from regional sampling in 2008.
Agronomy 13 01055 g005
Figure 6. Comparison of soil organic carbon (SOC) stocks estimated by CENTURY modeling, CMCS framework, and regional soil sampling in cropland of Cangshan County. CMCS represented the framework combining CENTURY modeling and chronosequences sampling. PG, SG, and FC represent perennial greenhouse, seasonal greenhouse, and field cultivation, respectively.
Agronomy 13 01055 g006
Disclaimer/Publisher’s Note: The statements, opinions and data contained in all publications are solely those of the individual author(s) and contributor(s) and not of MDPI and/or the editor(s). MDPI and/or the editor(s) disclaim responsibility for any injury to people or property resulting from any ideas, methods, instructions or products referred to in the content.

